 Mei Han
 Stephen G. Evans
 Kun He
 Hao Sun4
- 1Faculty of Mathematics, Southwest Jiaotong University, Chengdu, China
- 2Department of Earth and Environmental Sciences, University of Waterloo, Waterloo, ON, Canada
- 3Faculty of Geosciences and Environmental Engineering, Southwest Jiaotong University, Chengdu, China
- 4Key Laboratory of Mountain Hazards and Earth Surface Process, Institute of Mountain Hazards and Environment, Chinese Academy of Sciences, Chengdu, China
- 5Sichuan Institute of Land and Space Ecological Restoration and Geological Hazard Prevention, Chengdu, China
Debris flow is a major secondary geological process associated with the 2008 M7.9 Wenchuan Earthquake area, causing the loss of around 200 lives as well as extensive property damage. Based on data developed over the past 21 years (1998–2018) of continuous monitoring of debris flow events in Sichuan, the temporal and spatial aspects of debris flows have been analyzed, including magnitude and frequency. The 21-year study period is divided into three time-intervals: 1998–2007 (pre-earthquake), 2008–2013 (short-term post-earthquake), and 2014–2018 (long-term post-earthquake). Distribution maps are plotted to compare debris flow distribution density in the three periods and to visualize debris flow development throughout Sichuan Province from 1998 to 2018. Many large-scale debris flows occur in groups immediately following the earthquake (2008–2013). After 2014, the magnitude and frequency of debris flows begin to decrease and gradually returned near to the pre-earthquake level as the damaged landscape recovered. The effect of rainfall is investigated by analyzing a 21-year record of precipitation; Following the earthquake the threshold rainfall values for debris flow triggering decrease only to recover to pre-earthquake levels as the landscape heals. Magnitude-frequency (M-F) relations for debris flows of the three periods were developed, and the distribution can be well fitted by a power-law function. Finally, the work done by debris flow was defined by multiplying the magnitude by frequency. At the regional scale, the work peaks in the three time periods have been determined and it is found that the peaks corresponded with the larger debris flow sizes. The concept of offset is introduced to describe the shift of the work peak in relation to the probability peak and is termed the Wolman-Miller offset. It is concluded that with a greater offset in the short-term post-earthquake period, more work has been done by larger events and that the greater proportion of the volume being mobilized by larger events occurring more frequently is a key process in the landscape returning to a pre-earthquake (equilibrium) state. The recovery of an earthquake-damaged landscape represents a transient period of high hazard that should be considered in any hazard assessment of earthquake-triggered landslides (in addition to co-seismic landslides).
Introduction
Debris flow, a major disaster-generating hazard in mountainous areas, is often triggered by heavy rains. It mobilizes poorly sorted rock and soil debris from hillslopes and stream channels which cause destructive mass movements that frequently result in both loss of life and damage to infrastructures (Jakob and Hungr, 2005; Dowling and Santi, 2014; Chang et al., 2017; Hu et al., 2019). Many studies focused on the mechanisms and behavior of debris flows (Iverson, 1997; Gregoretti, 2000; Brayshaw and Hassan 2009; Tang et al., 2011a; Yu et al., 2021). Of particular interest is the geomorphic response of landscapes to earthquake shaking, especially the occurrence and characteristics of post-seismic debris flows (Marc et al., 2015; Marc et al., 2016; Fan et al., 2019).
It is well known that the occurrence rate of rainfall-generated debris flows (and similar landslide types) increases over a number of years after a strong earthquake in mountainous area, marking a period of enhanced post-seismic landsliding (Lin et al., 2003; Fan et al., 2019; Cui et al., 2022). The rate then decreases (Fan et al., 2018a), finally reverting to near pre-earthquake levels (Hovius et al., 2011; Marc et al., 2015). It has also been established that, in the aftermath of a strong earthquake, the rainfall threshold for debris flows is reduced (Shieh et al., 2009; Yu et al., 2014; Guo et al., 2016a; Guo et al., 2016b; Fan et al., 2019). This reduction persists for a number of years before reverting back (increasing) to near pre-earthquake levels (Yu et al., 2014; Zhang and Zhang, 2017; Domènech et al., 2019). All the effects indicate a dramatic transient increase in the sensitivity of the landscape to rainfall which decreases in a relatively short time after a seismic shock due to the exhaustion of source materials. The exhaustion is caused by debris flow mobilisation and the healing of the landscape through re-vegetation (Lin et al., 2006; Li et al., 2016a; Domènech et al., 2019; Shen et al., 2020a; He et al., 2022).
However, still largely unknown are the effects of strong earthquakes on pre-earthquake debris flow magnitude frequency relations and how these change in the post-seismic period as the landscape reverts to a pre-earthquake state. Some questions that may be asked include 1) How does the size distribution of debris flows change during this process? 2) Does the contribution of debris flows of certain sizes to total debris volume mobilised change? 3) How do the frequencies of debris flow sizes change? 4) How long does the effect of earthquake-generated landscape damage persist? and 5) what are the implications of these changes for landscape evolution and the mass movement geomorphology of terrain subjected to earthquake shock? Marc et al. (2015) studied transient changes of landslide rates in epicentral areas of four major earthquakes and established (see Figure 3 in Marc et al., 2015) that the magnitude (measured by area)–frequency relation for landslides during the recovery phase of the post-seismic period is similar to the background (pre-earthquake period) of the four earthquakes studied suggesting a process of full recovery to pre-seismic levels. However, the resolution of their landslide data could not be used to investigate the M-F relation of landslides in the immediate post-seismic period. Thus, the limit of a landslide M-F relation resulting from earthquake-generated landscape damage is defined.
The M7.9 Wenchuan Earthquake on 12 May 2008 caused serious destruction owing to its high magnitude and long fracture zone (Yin, 2008; Huang and Meng, 2009; Cui et al., 2021). During and immediately after the Wenchuan Earthquake, the terrain surface was severely altered because of the generally high seismic intensity (IX degrees or more). Compared with other types of landslides, debris flows played a more significant role in earthquake-related geological disasters in Sichuan Province. Post-earthquake debris flows were caused by an acute increase of slumped material that blocked streams in debris flow gullies. This contributed to high-frequency and spatially grouped debris flows under significantly decreased critical rainfall values. For example, the first debris flow, the 72-Gully Debris Flow occurred in Beichuan County on 24 September 2008, 4 months after the Wenchuan Earthquake killed 42 people (Tang et al., 2011a). On 17 July 2009, a large-scale debris flows occurred in Dujiangyan County-level City (You et al., 2012). Moreover, a total of 85 debris flows were induced by heavy rainfall on 13 August 2010 in Qingping Town, Yinxiu Town, and Longchi Town (Tang et al., 2011b). In addition, debris flows occurred along the Dujiangyan-Wenchuan (Du-wen) Expressway and Dujiangyan County-level City in the seismic area on 10 July 2013 (Ge et al., 2015).
The Wenchuan Earthquake showed that a catastrophic seismic event can 1) produce a great deal of loose landslide deposits in stream channels and on slopes and 2) could also result in more active mass movement geo-hazard (such as landslides and debris flows) than pre-earthquake periods (Fan et al., 2018c; Liu et al., 2021a; He et al., 2021). Coseismic landslide deposits and shattered mountain slopes provided plentiful source materials for debris flow initiation, which also required a lower antecedent rainfall and a lower hourly rainfall intensity threshold to trigger debris flow after an earthquake (Zhou and Tang 2014). Consequently, debris flows occurred more frequently in the region affected by earthquake shock. Furthermore, landslides triggered by earthquakes have a major influence on long-term slope erosion and sediment yield (Guo et al., 2021; Xiong et al., 2021), which can directly lead to long-term material supply to valley floors, and increase the magnitudes of debris flows for a post-earthquake period.
Since the earthquake, many scientists have explored the post-seismic effect on debris-flow occurrence, mainly involving characteristics, initiation and runout mechanisms (Zeng et al., 2014; Hu and Huang 2017; Shen et al., 2020b), triggering rainfall thresholds variation (van Asch et al., 2014; Chang et al., 2021), and long-term evolution of debris flow occurrence (Cui et al., 2014; Zhang et al., 2014). The volume of erodible materials produced by coseismic landslides in the Wenchuan Earthquake reached 5–15 km3 and was deposited on slopes or in gullies of mountainous areas, which in turn provided abundant source materials for debris flow generation (Parker et al., 2011). Tang et al. (2011b) and Tang et al. (2012) studied the combined effects of strong earthquake and rainstorms on the 13 August 2010 debris flows in Qingping Town, and found that the deposit had a volume ranging from 5,760 m3 to 3.1 Mm3, showing the huge possibility for future debris flow activity.
In addition, post-seismic rainfall thresholds have also been widely studied since the Wenchuan event. The critical amount of accumulative precipitation and hourly rainfall intensity to initiate debris flow decreased after the Wenchuan Earthquake (Tang et al., 2009; Liu et al., 2021b). Yu et al. (2014) suggested that the rainfall triggering threshold is lower after the earthquake than that before the earthquake (cf. Marc et al., 2015). Zhang and Zhang (2017) revealed that the post-seismic rainfall thresholds for debris flow triggering decreased by 75% after the Wenchuan Earthquake. Despite the fact that there have been a large number of studies on the long-term changes in debris flow occurrence over time (Fan et al., 2018c; Xiong et al., 2021), the M-F relation for debris flow activity before and after the Wenchuan Earthquake are still poorly documented and largely understudied.
Debris-flow activity can be characterized by the magnitude and frequency of occurrence, and magnitude-frequency (M-F) characteristics are essential elements of the debris flow process in terms of hazard assessment (van Steijn, 1996; Hungr et al., 2008; Jakob and Friele, 2010). The M-F relation at a regional scale can be used to characterize debris-flow activity and indicate the evolutionary process of activity in a given drainage basin thus providing the basis for engineering design, land use planning, and the geomorphic analysis of landscape evolution (Guthrie ad Evans, 2007; Hungr et al., 2008; Mao et al., 2009; Stoffel, 2010). In several studies, M-F relation for debris flows in different areas over different time scales have been obtained using direct and indirect dating methods (Innes, 1983; Innes, 1985; Jakob et al., 2005; Stoffel and Beniston, 2006; Scheidl et al., 2008).
Wolman and Miller (1960) proposed a way to measure of relative effectiveness of geomorphic processes based on the work of varying frequencies and magnitudes, to establish which event of magnitude is the ultimate control landscape morphology. Analysis indicated that a majority of work is accomplished by events of moderate magnitude which recur relatively frequently rather than by rare events of unusual high magnitude. Guthrie and Evans (2007) defined the work of landslides as the product of probability and magnitude (measured by area). Then they applied it to the Clayoquot study area of coastal British Columbia (n=1109) and landslides triggered by the 1994 Northridge earthquake, California (n=11,036) to test the Wolman-Miller hypothesis with respect to landslides. After systematic analysis of these landslide datasets, Guthrie and Evans (2007) found that moderate-sized landslides performed the most work of transporting material on hillslopes (forming the work peak) as originally conceived by Wolman and Miller (1960) for rivers. Landslides that form the work peak are distinct from high-magnitude catastrophic landslides that are themselves formative and system resetting (Guthrie and Evans, 2007).
From an evolution perspective of debris flows after a strong earthquake, most previous studies mainly investigated the initiation conditions of debris flows. In order to determine the effect of the earthquake on debris-flow activity, the pre- and post-earthquake debris-flow occurrence in Sichuan Province was studied by field investigations and statistical analysis. A dataset of 2,572 debris flows derived from work by the Sichuan Institute of Land and Space Ecological Restoration and Geological Hazard Prevention was used to examine the relationships between the magnitude and frequency of debris flows in Sichuan Province in the period of 1998–2018, representing a total mobilized volume of 123.4 Mm3. According to the database, the evolution of debris flow occurrence before and after the Wenchuan earthquake was illustrated and evaluated both in Sichuan Province as a whole, in the epicentral area itself, and in three sub-regions. At the same time, the work done by debris flow events in the Sichuan database was also analysed by evaluating the work peaks in three periods before and after the Wenchuan Earthquake. The concept of the Wolman-Miller Offset is introduced to describe the offset of the work peak in relation to the probability peak. The specific objectives of this study are thus to evaluate the effect of the M7.9 Wenchuan earthquake on the temporal and spatial patterns of occurrence, to determine the sensitivity of an earthquake damaged landscape through an investigation of rainfall-trigger thresholds, to explore their M-F relation, and to explore the geomorphic work done by debris flows and their contributions by magnitude to the total volume mobilized.
Study area
The study area is located in Sichuan Province, southwest China (Figure 1), within the Longmen Shan Thrust Belt Region. The area is characterized by steep mountain terrain, strong tectonic motion due to the rapid convergence of the India Plate at rates of 5–5.5 cm/a (Tang and van Westen, 2018), and frequent strong earthquakes (Figure 1). The study area with the elevation ranging from 302 to 7,143 m has a high relative relief which provides the topographical conditions for the formation of debris flow and landslides. Three major faults (Longmenshan Fault, Anninghe Fault and Xianshuihe Fault) occur in the study area (Figure 1). The Longmenshan Fault is a thrust fault which runs along the base of the Longmen Mountains, with a average strike of approximately NE (Wang and Meng, 2009). Motion on this fault is responsible for the uplift of the mountains relative to the lowlands of the Sichuan Basin to the east. Representing the eastern boundary of the Qinghai-Tibet Plateau, it forms the border between the Bayan Kola Block in the Plateau and the South China block in the Eurasian Plate. Both the 2008 Wenchuan Earthquake and the 2013 Ya’an Earthquake were generated on the main structure of the Longmenshan Fault. The Anninghe Fault Zone is a highly active left-lateral strike-slip fault system with a length of about 200 km. The fault zone is located in the eastern margin area of the Tibetan Plateau, and is a portion of a larger fault system forming the eastern edge of the Sichuan-Yunnan Active Tectonic Block, which is recognized as a seismic gap having a high potential of earthquakes (Wen et al., 2008a). The Xianshuihe Fault is an important left-lateral strike-slip fault on the eastern margin of the Tibetan Plateau. Along the entire length of the fault, there have been seven major earthquakes higher than Ms 7.0 during the past 300 years (Wen et al., 2008b).
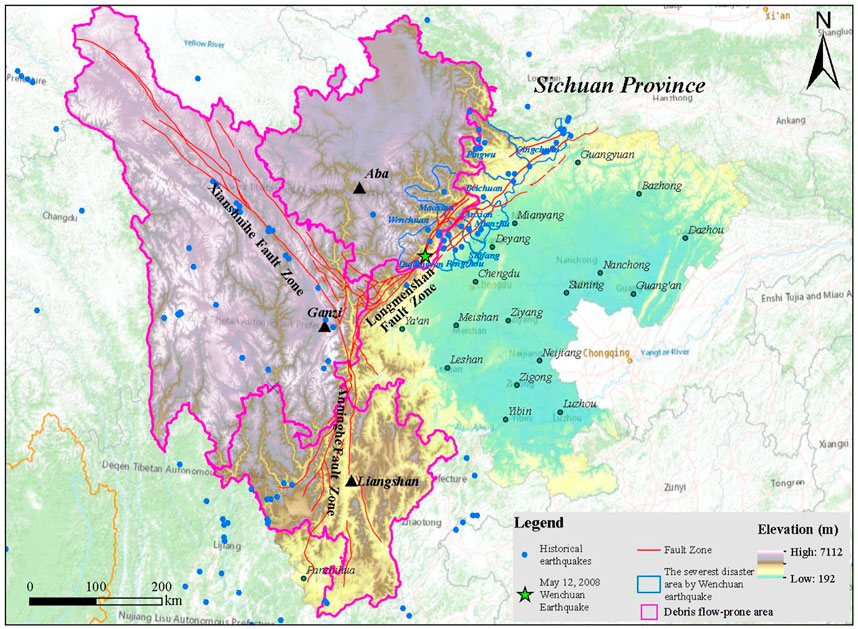
FIGURE 1. Location and tectonic map of the study area (Base map is from http://www.ngac.org.cn/).
The climate in the study area varies from region to region. The river valley area of the Western Sichuan Plateau mainly includes the valleys of Ganzi Prefecture, Aba Prefecture and some areas in the northwest of Liangshan Prefecture, which are characterized by few rainstorms with average daily precipitation of 50 mm or more. The mountainous area around the Sichuan Basin has three rainstorm areas, including Qingyi River, Longmenshan and Dabashan Rainstorm Area, where the average annual rainfall is greater than 1200 mm. In these places, the rainfall is concentrated from June to September, a period accounting for about 70% of the annual rainfall.
Furthermore, in addition to an analysis of Province-wide debris flow occurrence, two regions were selected in the study area for detailed study. These are defined as the severest disaster area, by earthquake damage (and approximately corresponding to the epicentral area) and the debris-flow prone region by pre-earthquake debris flow activity. The severest disaster area is identified based on field investigations and comprehensive assessment of disaster intensity, severity of the Wenchuan Earthquake and associated geo-hazard influences (see Report on the Scope of Disaster Affected by Wenchuan Earthquake Disasters Assessment, 2008). The severest disaster area includes Wenchuan County, Beichuan County, Mianzhu County-level City, Shifang County-level City, Qingchuan County, Maoxian County, Anxian County, Dujiangyan County-level City, Pingwu County, 202 and Pengzhou County-level City. In Figure 1, the severest disaster area affected by the earthquake is defined by the red line, with the epicenter indicated as a red star. Debris-flow prone regions before the earthquake cover Aba Prefecture, Ganzi Prefecture and Liangshan Prefecture (see yellow dots in Figure 1). From the study of the whole Sichuan Province and two sub-regions, the effect of earthquake on the debris flows was comprehensively.
Data sources and methodology
Data sources
Compared to pre-earthquake debris flows, those debris flows that occurred after the Wenchuan Earthquake in the earthquake-affected region show many particular characteristics including the fact that 1) the variety and quantity of material mobilized in debris flow events increased, 2) debris flows often occurred in spatial and temporal clusters and were of long duration, 3) the critical precipitation necessary to trigger debris flows was clearly reduced, and 4) the debris flows formed critical components of long complex post-seismic cascades of geo-hazards (Fan et al., 2019). A large number of collapses, landslides triggered by the Wenchuan Earthquake generated abundant loose source materials for debris flow. On July10th, 2013, several large-scale debris flow events occurred in groups and combined with many previous debris flow gullies (Figure 2A) along the Minjiang River and Du-Wen Highway (Xu 2010), which generally lasted 1.5–2.0 h, even as long as 3 h. Meanwhile, the critical rainfall condition for debris flow formation in some small watersheds reduced from a 50-years to a 20-years rainstorm return period, and the volume of mobilized material reached twice as much as the level of pre-earthquake period (Yu et al., 2011). For example, the area of Wayao and Taoguan Gully are 1.21 and 50.86 km2 respectively, and the flow volume that rushed out from these two gullies on 10 July 2013 was 1.2 × 10⁵ and 1.08 × 10⁶ m3 respectively (Figure 2B–E). In summary, the debris flow activity in Sichuan Province, especially in the Wenchuan Earthquake area, has changed significantly since 2008 (Figure 2).
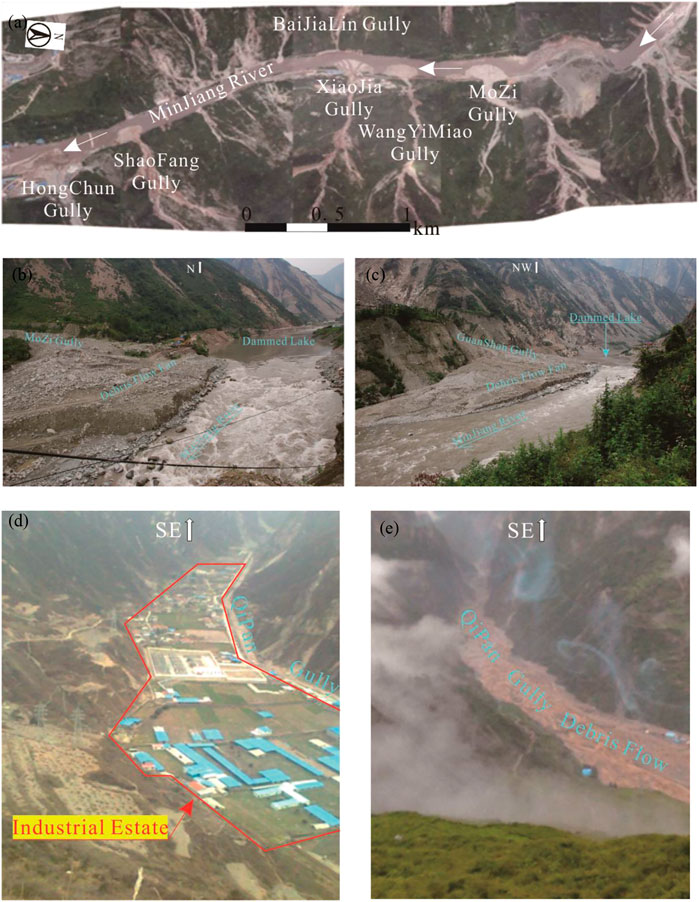
FIGURE 2. Typical debris flow events after Wenchuan earthquake. (A) Debris flows occurred in 9th to 12th July, 2013, along Du-Wen Highway in Wenchuan county (Aerial photo, taken by UAV on 21th July 2011). (B,C) Debris flow occurred in Mozi gully blocked Minjiang River. (D,E) Qipan gully outlet before and after debris flow occurred in 9th July 2013.
The impact of Wenchuan Earthquake on the occurrence of debris flow events and the outbreak tendency of debris flow in Sichuan Province have been analyzed utilizing a 21-year dataset of debris flow occurrence. The dataset has been developed through 21-years of continuous monitoring and data collection, field investigations and field data analysis by the Sichuan Institute of Land and Space Ecological Restoration and Geological Hazard Prevention from 1st July 1998 to 26 September 2018. There were 2,572 debris flows occurred during the period 1998–2018 throughout Sichuan Province (Table 1). The database included information on occurrence time, location, and mobilized volume for each debris flow event. The volume was determined by on-site investigation by professional and technical staffs, aerial photography by UAV and comparison of satellite images. The volume range covers several orders of magnitude, from 5 m3 to 4.0 ×10⁶ m3; the largest debris flow in the dataset occurred on 9th July 2013, in Mianzhu County level City of Deyang City (Yu et al., 2010). According to the dataset, 873 debris flows with magnitudes larger than ×1.0 104 m3 (34% of total) occurred in the study area during the period 1998–2018.
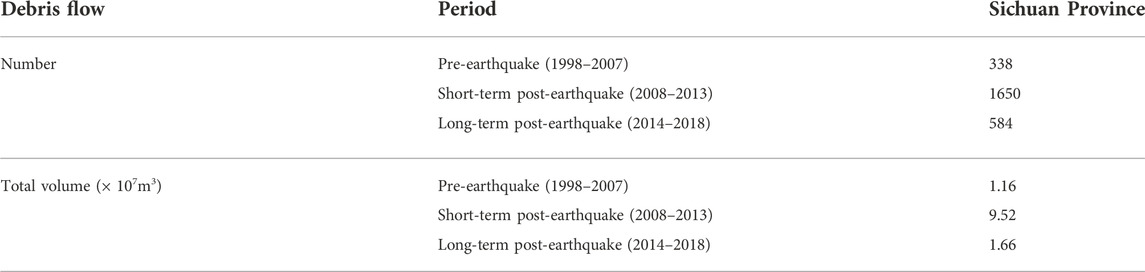
TABLE 1. Number and volume of debris flow events in Sichuan Province in the three time periods examined in this paper.
Xiong et al. (2021) suggested that the transfer process of landslide sediment from hillslopes to channels in alpine basins was intense during the first 5 years after the Wenchuan earthquake; then, it gradually weakened without the influence of extreme rainfall. However, strong rainfall hit Wenchuan County again in 2013, which caused the number and area to increase significantly. Subsequently, both the number and area of landslides gradually decreased from 2013 to 2017.
For further analysis, three periods of debris flow activity were distinguished, which were the 10-years pre-earthquake period (1998–2007), the 6-years short-term (immediate) post-earthquake period (2008–2013), and the 5-years long-term post-earthquake period (2014–2018) respectively.
By extracting the annual and cumulative number as well as the volume versus time for the three periods of the 21-years debris flow record, the temporal aspects of debris flow occurrence were analyzed to determine the seismic effect on debris flow occurrence and characteristics. To evaluate the spatial aspects of debris flow occurrence, the number and volume of mobilized debris flow in the entire Sichuan Province and the severest disaster areas were analyzed. Furthermore, the data of debris flows in three debris flow-prone regions pre-earthquake including Ganzi Prefecture, Aba Prefecture and Liangshan Prefecture were analyzed to reveal the relation between the frequency of debris flow occurrence and distance from the epicenter. The relationship with annual precipitation in the study area was also studied.
Methodology
The relationship between magnitude (size) and frequency is an important indicator to be considered in assessing societal risk caused by landslides (Friele et al., 2008; Jakob and Friele, 2010). Dai and Lee (2001) have proposed a frequency-volume relation for rainfall-induced landslides. In order to better understand the effect of the Wenchuan Earthquake on debris flow occurrence, the structure of the magnitude-frequency (M-F) relation of debris flow events was examined in the period 1998–2018. In this study, magnitude is characterized by the debris flow volume. The percentage contribution to total volume mobilized in a given period is defined as:
which satisfies that
Through (1), the cumulative percentage of debris flow in each magnitude bin was calculated, and then plotted for the three periods to show the contribution of debris flows at different magnitudes to the total volume mobilized. This enabled us to see which magnitude accounted for the largest proportion of total mobilized volume, and the influence of a strong earthquake on debris flow magnitude.
Then, the events are ranked in the order of decreasing magnitude. The incremental frequency of an event of rank i is determined as (Hungr et al., 2008):
where Ti is the length in years of the respective interval 1998–2007, 2008–2013, and 2014–2018. The M-F relation is constructed by accumulating the incremental frequencies from the largest magnitude downward (Hungr et al., 2008):
In (3), Fi is the cumulative frequency of debris flow events of magnitude Mi or larger. Then it can be determined whether the distribution of debris flows occurring in the three periods can be well fitted by a power-law function:
In (4), y is the cumulative debris flow frequency, x is the debris flow magnitude, and a and b are regression parameters of the power law relation. Furthermore, the coefficients can be compared to gain insight into the pattern of debris flow occurrence.
Moreover, the work done by debris flow events can be used to measure the relative importance of extreme or catastrophic events and more frequent events of smaller magnitude on geomorphic processes, as well as the quantity of material transported by debris flow. The work done by each debris flow event was obtained by multiplying the frequency of debris flow event of a given size by the magnitude of the same event in the study area during the three periods. The magnitude at which the maximum occurs provides a measure of the level at which the largest portion of the total work is accomplished (Wolman and Miller, 1960), the “work peak” of Guthrie and Evans (2007).
Meanwhile, a probability term defined to describe the likelihood of a debris flow occurring with a given volume in each period to study the effect of earthquake on the magnitude and frequency of debris flows in Sichuan Province in the period 1998–2018:
where
where [∙] represents a rounding function. Furthermore, a work peak index parameter is defined to study the interaction of magnitude (i.e., the debris flow volume) and earthquake effects:
By this method, the pulse of debris flows that occurred during 2008–2013 in the immediate aftermath of the earthquake was documented to see if a gradual return to a near steady state in the longer term post-seismic period occurred, and if an echo of the earthquake perturbation persists.
Temporal and spatial aspects of debris flow occurrence
Using the 21-year record of debris flows, the temporal and spatial aspects of debris flow occurrence were explored in Sichuan Province in the period 1998–2018 with respect to the annual number of debris flows, the annual debris flow volume mobilized, and the evolution of the spatial pattern of debris flow occurrence.
Temporal pattern of debris flow occurrence versus precipitation
Owing to the influence of the Wenchuan Earthquake, the source debris volume increased dramatically with changes in slope topography and stream channel conditions. The Sichuan database recorded the occurrence of 2,572 debris flows in the period 1998–2018. The annual number of debris flows during this time period is indicated in Figure 3A. Data (n =724; 28% of total) from the severest disaster areas is shown by the blue bars and curves in Figure 3A. In Figure 3A the peak occurs in 2012 for Sichuan Province and in 2013 for the severest disaster area.
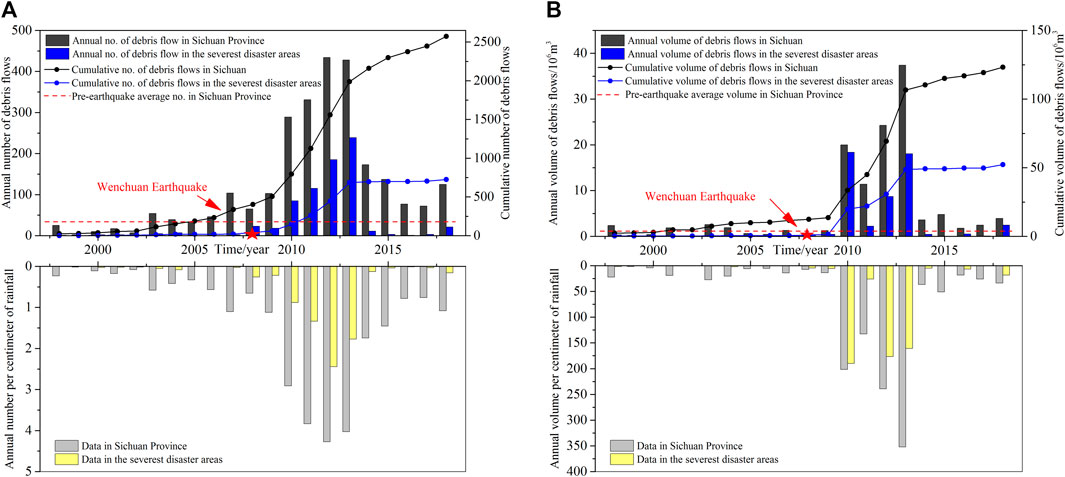
FIGURE 3. (A). Annual number and cumulative number of debris flow events in Sichuan Province (1998–2018; n=2,572) and the severest disaster areas (1998–2018; n=724). (B) Annual volume and cumulative volume mobilized by debris flows in Sichuan Province and the severest disaster area.
With respect to the Sichuan dataset, in the short-term post-earthquake period (2008–2013), the number and mobilized volume of debris flow events that occurred in 2008 was not particularly high because the materials originating from coseismic landslide were simply deposited in debris gullies, and only materials in short and steep valleys were mobilized within a short time of the seismic shock.
338 debris flows had occurred (13.1% of total) prior to the 2008 Wenchuan Earthquake (pre-earthquake period 1998–2007). In this period the annual number of debris flows throughout Sichuan Province fluctuated steadily below 100; the annual average number of debris flows was 70 with a maximum of 198 in 2007 (Figure 3A). This was taken to represent a background annual frequency of debris flow occurrence for Sichuan. In the short-term aftermath of the 2008 Wenchuan earthquake (2008–2013), debris flows occurred frequently and massively during the 6-year short-term post-earthquake period (2008–2013). Debris flows reduced gradually in number, approaching the pre-earthquake level from 2014, while the impact of the earthquake decayed to a relatively low level in 2018.
With reference to the Sichuan Province total and regional data in Figure 3A, a lag time between the 2008 earthquake and the peak in the annual number of debris flows in 2012 was noted. This delayed (rather than immediate) response may reflect the delay in debris flow entering the long and complex chain of secondary processes caused by the earthquake and/or the lack of high-magnitude triggering rainfalls during the period of delay. On the basis of Figure 3B, the total volume of debris flows mobilized in the study period (1998–2018) was 123.4 Mm3 in 2,572 events at an average of 4.8 × 10⁴ m3 per event. The average annual pre-earthquake (1998–2007) debris flow volume was 1.16 Mm3 in 338 events and reached 15.9 Mm3 in the short-term post-earthquake period (2008–2013; in 1650 events) with a maximum in 2013 of 37.4 Mm3. From 2014 to 2018, the annual average volume decreased to 3.3 Mm3 in 584 events, still somewhat larger than the pre-earthquake figure.
According to the above analysis, debris flow activity can be concluded to have essentially returned to pre-earthquake conditions by 2018, even though an echo of the earthquake remains owing to heavy rainfall, remaining source materials that were yet to be mobilized, and several other earthquakes that followed the 2008 Wenchuan Earthquake, such as the Ya’an Earthquake (M7.0) on 20 April 2013 (Pei and Huang, 2013) and the Kangding Earthquake (M6.3) on 2 November 2014 (Yi et al., 2015). Debris flow occurrences are anticipated to return to pre-earthquake values eventually but more time is required. From the above-mentioned figures, the debris flow frequency switches from low to high and then back to low, which illustrates the amplification effects of earthquake shock in 2008–2013 and subsequent weakening of the earthquake effect.
At the same time, the threshold of hydrological conditions leading to debris flow initiation decreased significantly; namely, the critical rainfall intensity necessary to trigger a debris flow decreased to that before earthquake (Cui et al., 2010; Zhou and Tang 2014; Li TT. et al., 2016; Guo et al., 2016c; Chang et al., 2021). After this initial decrease in the rainfall threshold, the threshold then increased as the supply of co-seismic source material became exhausted. For example, the triggering rainfall amount of Gaojiagou debris flow shows an increasing trend after the significant drop in 2008. The rainfall threshold of 4 debris flows occurring successively in Gaojiagou Gully was 155.5 mm in 2010, 163.1 mm in 2011, 173.7 mm in 2013 and 176.5 mm in 2016 (Fan et al., 2018b) due to the reduced source materials, the increased particle size and the restoration of vegetation.
From 1998 to 2007, the precipitation curves in Figure 3 fluctuate over a narrow range with an average of 0.4 debris flows per centimeter of rainfall. After the Wenchuan Earthquake (2008–2013), the annual number of debris flows per centimeter of rainfall increased and reached a maximum of 4.3 debris flows per centimeter of rainfall. While after 2013 (in the long-term post-earthquake phase, 2014–2018), the number of debris flows per centimeter of rainfall curves decreases sharply (Figure 3) to an average of 1.2 debris flows/cm close to but still above the pre-earthquake level. A similar pattern with the annual debris flow volume mobilized per centimeter of rainfall plot was found. In the pre-earthquake period, the average annual volume of debris flow per centimeter of rainfall is 12 × 103 m3/cm. After the earthquake, it shows a dramatic increase to a peak of 350 ×103 m3/cm and an average of 158 × 103 m3/cm for the period. In the long-term post-earthquake period (2014–2018) the average annual volume per centimeter of rainfall decreases to 33 × 103 m3/cm of rainfall, almost at pre-earthquake levels. Thus the annual number and volume of debris flow events per centimeter of rainfall in Sichuan Province present a similar temporal pattern to that of debris flow occurrence.
This analysis helps to verify the immediate post-earthquake debris flow characteristic that rainfall threshold values for triggering debris flows showed a dramatic decrease (i.e., for a given amount of rainfall more debris flows were triggered and a greater volume is mobilized). In the longer-term post-earthquake period, the annual number of debris flows and volume mobilized per centimeter of rainfall (Figure 3), whilst approaching pre-earthquake values, were still higher than those in 2008, which suggests that a period of time is still required for the debris flow system to recover to pre-earthquake rainfall threshold levels.
Spatial distribution of debris flow occurrence
As noted, the Sichuan database (n = 2,572) recorded the number and magnitude of debris flow events that occurred in 1998–2018; these are plotted as red dots in Figure 4, and the magnitude is expressed in terms of the dot size. Data (n = 724) selected from the database recorded the debris flow events in the most severe disaster areas, outlined in blue in Figure 4. The maps compare the debris flow distribution density in the three time-intervals, and visualize the debris flow development throughout Sichuan Province (Figure 4).
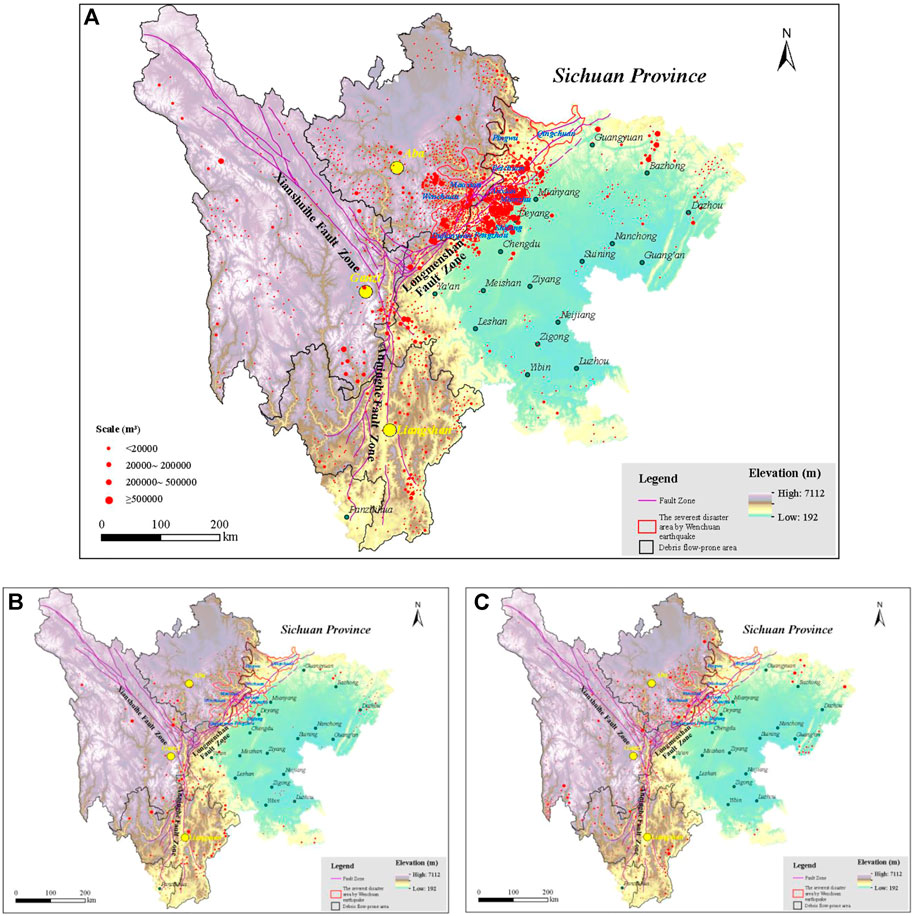
FIGURE 4. Maps showing distribution of debris flows (red dots, n=2,572) in Sichuan Province before and after the 2008 Wenchuan Earthquake: (A) short-term post-earthquake (2008–2013, n=1650); (B) pre- earthquake (1998–2007, n=338); (C) long-term post-earthquake (2014–2018, n=584).
In these three maps, the red dots indicate the location and magnitude of debris flows in the Sichuan database. Before the earthquake (Figure 4B), some small-scale debris flows were distributed evenly in the alpine valley region and low mountains, while in the short-term post-earthquake period (Figure 4A), the number and volume of debris flows grew dramatically, and were concentrated in the vicinity of the Longmenshan Fault Zone. The main reason for this is that rocks on the fault zone are relatively broken and the slopes are prone to instability under heavy rainfall, providing the source materials for debris flow formation (Yang et al., 2018). In Figure 4C (long-term post-earthquake phase), the spatial distribution of debris flows is quite similar to that in the pre-earthquake map (Figure 4B) suggesting a return to pre-earthquake conditions.
To further clarify the characteristics of the number and magnitude of debris flows in the three periods, pre-earthquake was selected for analysis in three debris flow-prone regions, including Aba Prefecture, Ganzi Prefecture and Liangshan Prefecture, shown as yellow dots in Figure 4. The occurring number and volume of these debris flow events in these three regions are listed in Table 2 for the three time periods.
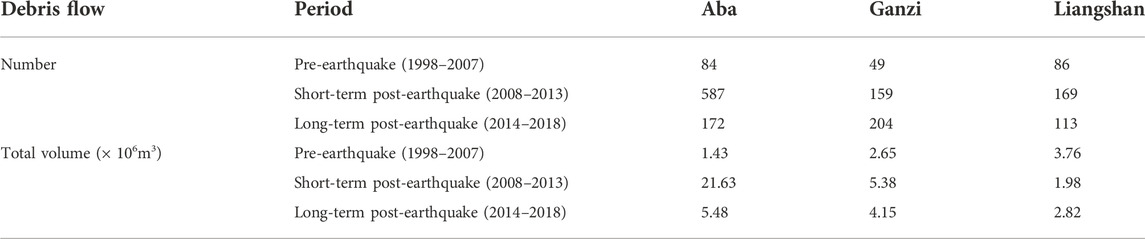
TABLE 2. Number and volume of debris flow events in three pre-earthquake debris flow-prone regions in the three time periods.
The number of debris flow events during the short-term post-earthquake period (2008–2013) in Aba Prefecture and Liangshan Prefecture increased to 7 and twice the number in the pre-earthquake period respectively. Whereas in the long-term post-earthquake period, this value decreased to twice and 1.5 times the number in the pre-earthquake period. The volume of debris flows occurring in these three regions presents a similar pattern in Aba Prefecture and Ganzi Prefecture. However, in Ganzi Prefecture, the number of debris flows during these three periods show only slight differences owing to its long distance from the Longmenshan Fault Zone. At the same time, the debris flow volume in Liangshan Prefecture did not fluctuate as noticeably over these three periods.
Debris flow magnitude and frequency
Magnitude and cumulative percentage of total volume mobilize
Fan et al. (2018b) showed that, after the Wenchuan earthquake, the landslide frequency increased by a large margin. Of the nearly 200,000 landslides triggered originally, many remobilized within a few years after the initial event by rainfall, which often caused catastrophic debris flows. At the same time, sufficient material supply and poor restoration of vegetation in the northern Wenchuan County led to longer-term debris flow activity in the earthquake disaster regions. This subsequently decreased within 10 years to the equivalent level of pre-earthquake debris flow activity. Xiong et al. (2022) found that landslide sediment showed a trend of substantial increase.
Debris flow volume is taken to represent debris flow magnitude and the contribution of different magnitudes of debris flow to total volume mobilized was examined in the three periods under consideration (Figure 5, Table 3). In the short-term post-earthquake period (2008–2013), the higher percentage of large-magnitude events contributed to a gentler slope of the cumulative curve that differentiates it from the pre-earthquake and long-term post-earthquake curves (Figure 5). It can be seen that debris flow events with volume higher than 1 × 10⁶ m3 contributed about 40% of the entire volume mobilized during this period with the largest debris flow being 4 × 10⁶ m3 in volume. Moreover, the relatively flat slope in the period 2008–2013 (Figure 5) implies that the large-scale debris flows (>1 Mm3) moved proportionately more materials in this period than in the other two periods.
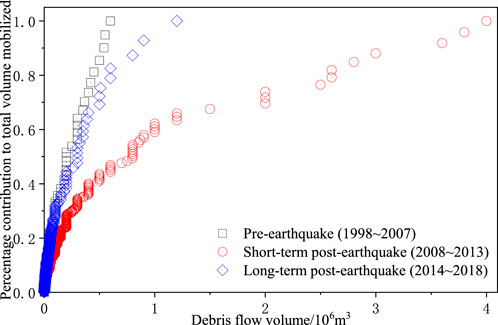
FIGURE 5. Relationship between percentage contribution to total volume mobilized and debris flow volume in the three periods of concern.
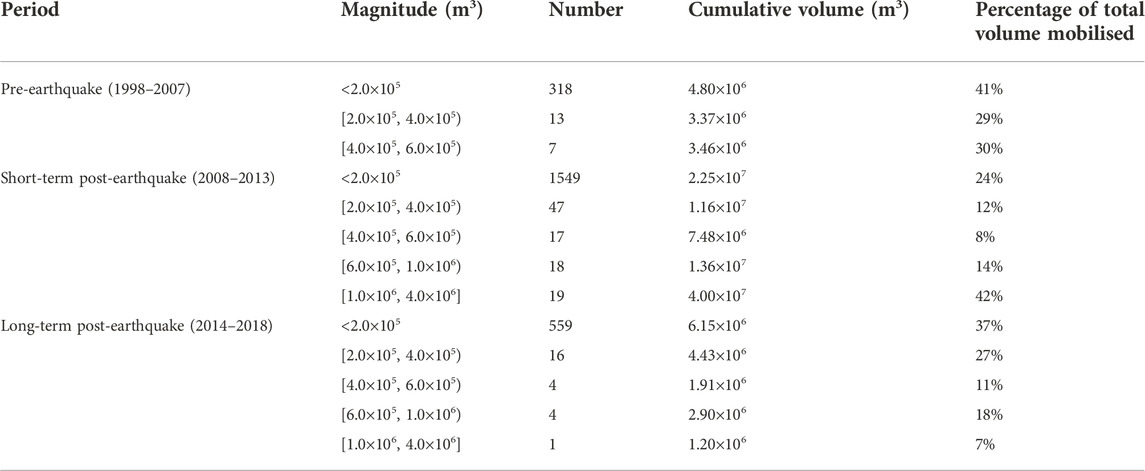
TABLE 3. Volume and contributions to total debris flow volume mobilized during each of the three periods under examination.
Figure 5 also shows that the cumulative percentage contribution of the higher magnitudes in 2014–2018 is still a little greater than it was in the pre-earthquake period (1998–2007) and thus has not returned to pre-seismic levels. Specifically, debris flow events with magnitude lower than ×0.2106 m3 in 2014–2018 contributed to the total volume mobilized more or less at the pre-earthquake level. The events in the larger volume range (0.5–1.0 × 10⁶ m3) still contributed above pre-earthquake levels (Figure 5). Thus, the cumulative contribution of pre-earthquake debris flow events with specified magnitude to the total volume mobilized, is practically coincident with that in the longer-term post-earthquake period (2014–2018; Figure 5). In contrast, in the short-term post-earthquake period (2008–2013), the form of the curve shows a deviation from pre-earthquake and long-term post-earthquake conditions. In this period larger debris flows contributed a greater proportion of the total volume mobilized. This largely reflects the fact that the volume of the largest debris flow occurring between 2008 and 2013 was 4 × 10⁶ m3, substantially larger than the maximum of 6 × 10⁵ and 1.2 × 10⁵ m3 in the other two periods (Figure 5).
Table 3 shows that, in 1998–2007, there were 318 debris flows with volumes lower than 2 × 10⁵ m3, so the data points in Figure 5 are concentrated in the first 41% of the total volume mobilized in the pre-earthquake period. 7 debris flows occurred with volumes between 4 × 10⁵ and 6 × 10⁵ m3, which made up about 30% of the total volume in this period; 13 debris flows occurred with volume between 2 × 10⁵ and 4 × 10⁵ m3, contributed 29% of the total volume mobilized (Figure 5). 100% of the material mobilized in this period were by debris flows ≤ 1 × 10⁶ m3 in volume.
In the short-term post-earthquake period (2008–2013), there were only 19 debris flow events with magnitude larger than ×1 106 m3 (Table 3; Figure 5). But these events contributed 42% of the total volume mobilized. At the same time, 1,596 debris flows with volumes less than 4 × 10⁵ m3 contributed 36% of the total volume mobilized. Debris flows with volumes between 4 × 10⁵ m3 and 1 × 10⁶ m3 contributed the remaining 22% of the total volume mobilized in the period 2008–2013. 58% of the material mobilized in this period were by debris flows ≤ 1 × 10⁶ m3 in volume.
At the bottom of Table 3, it can be seen that in the period of 2014–2018, there were 559 debris flows with magnitude less than ×2 105 m3, which contributed 37% of the total volume mobilized in this period. 20 debris flows with volume between 2 × 10⁵ m3 and 6 × 10⁵ m3 contribute a total volume of 38%. 5 debris flows with volume larger than 6 × 10⁶ m3, made up the remaining 25% of the total volume mobilized during 2014–2018. 93% of the material mobilized in this period were contributed by debris flows ≤ 1 × 10⁶ m3 in volume.
From Figure 5 and Table 3, it can be seen that in the immediate post-earthquake period of 2008–2013, 19 debris flows occurred with magnitudes larger than ×1 106 m3 occurred and contributed almost half (42%) of the total volume mobilized in this period. At the same time, the cumulative contribution plots of the other two periods (pre-earthquake and long-term post-earthquake) are similar, which indicate a lower contribution by large-scale debris flows (Table 3). The percentage contribution of small and medium-sized debris flows to the total volume mobilized during the long-term post-earthquake period appears to have recovered to the pre-earthquake level in a stepwise manner.
In the pre-earthquake period (1998–2007) 100% of the debris mobilized in 338 debris flows were contributed by debris flows ≤ 1Mm3; 41% of the debris, mobilized were contributed by smaller debris flows ≤ 2 × 10⁵ m3. In the immediate post-earthquake period (2008–2013) 58% of the debris mobilized in 1,650 debris flows were contributed by debris flows ≤ 1 Mm3; 24% of the debris mobilized were contributed by smaller debris flows ≤ 2 × 10⁵ m3. In the longer term post-earthquake period (2014–2018), 93% of the debris mobilized in 584 debris flows was by debris flows ≤ 1 Mm3; 37% of the debris mobilized were contributed by smaller debris flows ≤ 2 × 10⁵ m3. Thus in the immediate post-earthquake period 1) larger debris flows contributed a greater proportion of the total volume mobilized than in pre-earthquake and long-term post-earthquake periods, and 2) smaller debris flows still contributed a significant proportion of the total volume mobilized by virtue of their increased frequency (Table 3).
Magnitude-Frequency (M-F) relation
The M-F relation of debris flow events in Sichuan Province from 1998 to 2018 is given for the three periods under examination in Figure 6. According to the figure, magnitude (M) is the volume of debris flow (in m3) and frequency (F) is the annual frequency of M or greater (see Eq. 3). The shape of the plots is remarkably similar to the long-term post-earthquake curve plotting between the pre-earthquake and short-term post-earthquake curves (cf. Marc et al., 2015). The earthquake had a great impact on the frequency and severity of debris flow events (Figure 6). At a given frequency, the magnitude of debris flow in the short-term post-earthquake period (2008–2013) is substantially higher than the other two periods. Whereas for the same magnitude, the frequency in the second period (2008–2013), in the immediate aftermath of the earthquake, is the largest (Figure 6). The form of the three curves illustrates that with increasing magnitude, frequency decreases at a similar rate over the three periods. A decade after the earthquake, the frequency and magnitude of debris flows occurrence have more-or-less returned to the pre-earthquake level (Figure 6), indicating that the seismic effect has gradually dissipated.
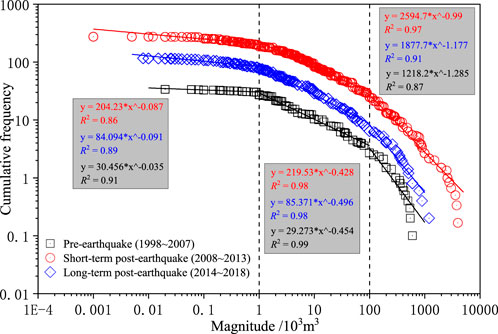
FIGURE 6. The M-F relation for debris flows in the whole Sichuan Province over the three periods under examination.
It is seen in Figure 6 that the similar shapes of the three M-F curves have similar inflection points to a rollover at around 1 × 10³ and 100 × 103 m3, respectively (see vertical dashed lines in Figure 6); the curve can thus be divided into 3 segments, which are <1 × 10³ m3, 1–100 × 103 m3, and >100 × 103 m3. The distribution of the three segments can be fitted by a power-law function (Eq. 4); regression parameters of the relation are listed in Table 4.
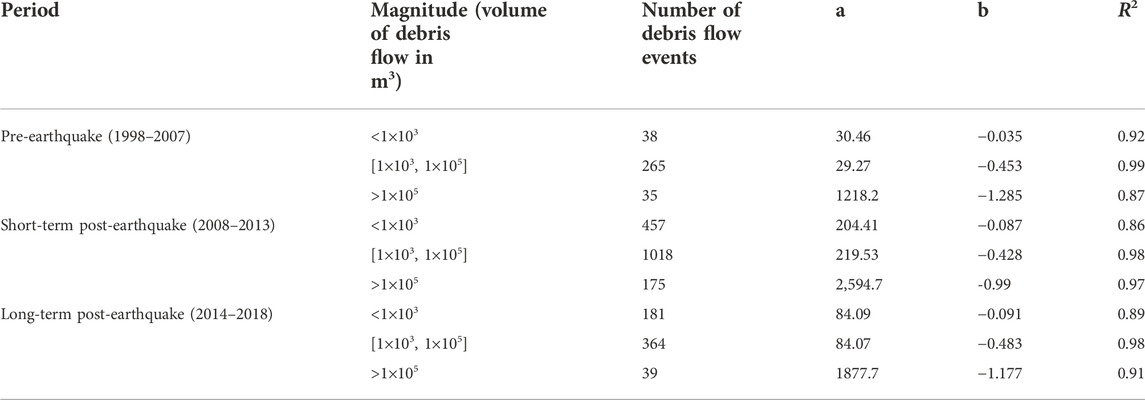
TABLE 4. Regression parameters of M-F relation for debris flow events in the three periods under examination (see Figure 6).
The segments of the M-F relation well satisfy a power law form with a goodness of fit (R2) higher than 0.86 for each segment of each curve (Table 4). The value of Parameter a in Eq.4 during the long-term post-earthquake (2014–2018) is between the values of the pre- and short-term post-earthquake; at the same time, it increased rapidly when the debris flow magnitude increases from volume range of [1×10³ m3, 1×10⁵ m3] to the magnitude larger than 105 m3. Therefore, the Parameter a in Eq. 4 shows the same pattern of change as the M-F curve (Table 4) over the three periods.
The exponent b also shows a low-high-low tendency in the three periods except when the debris flow magnitude is <103 m3. The value of parameter b remains essentially the same with only slight fluctuation over the three periods with maximum differences of −1.25 (between −0.035 and −1.285), −0.903 (between −0.087 and −0.99), and −1.086 (between −0.091 and −1.177), respectively. The exponent b increases with increasing magnitude of debris flow for each period as it approaches the upper limit of debris flow volume. The change in parameters a and b reveals the impact of earthquake on debris flow magnitude and frequency.
To verify the effect of the 2008 Wenchuan Earthquake on debris flow occurrences, the data (n=724) from the most severe disaster areas affected by the earthquake was also analyzed (Figure 7). The M-F relation of the debris flows in this area also well satisfied a power law distribution (Figure 7). For example, the exponent b changes little between the same segments in the three periods. Whereas the parameter a indicates a significant difference between them reflecting differences in frequency for a given magnitude. The constant a is 110.35 in 2008–2013 in the segment corresponding to the magnitude range from ×1 103 to 100 × 103 m3, which is 73 times larger than it was in the pre-earthquake period (1.5048), and remains nearly 12 times larger than it was in 2014–2018 (9.372) (Figure 7).
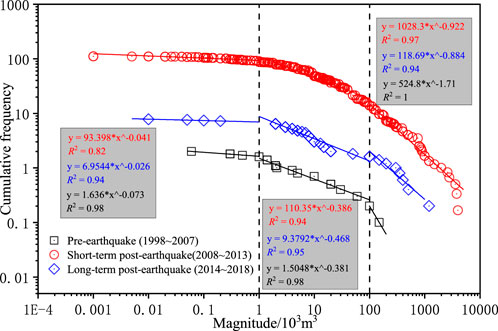
FIGURE 7. The M-F relation in the severe disaster areas over the three periods under examination.
Debris flow work
Work done by debris flow events
Following the concepts and methodology of Wolman and Miller (1960) and Guthrie and Evans (2007), the Sichuan debris flow record (n = 2,572; 1998–2018) was used to analyze the work done by debris flow events of different magnitudes. The work done by debris flow events of a given magnitude equals the probability of an event with that magnitude multiplied by the volume (our measure of magnitude) of the event. Units of work are a function of the magnitude and frequency, and work on each graph is scaled back linearly to enable visual comparison to the probability of occurrence. The important component of the work portion in Figure 8 is the magnitude at its peak rather than its actual metric, the so-called work peak (Guthrie and Evans 2007).
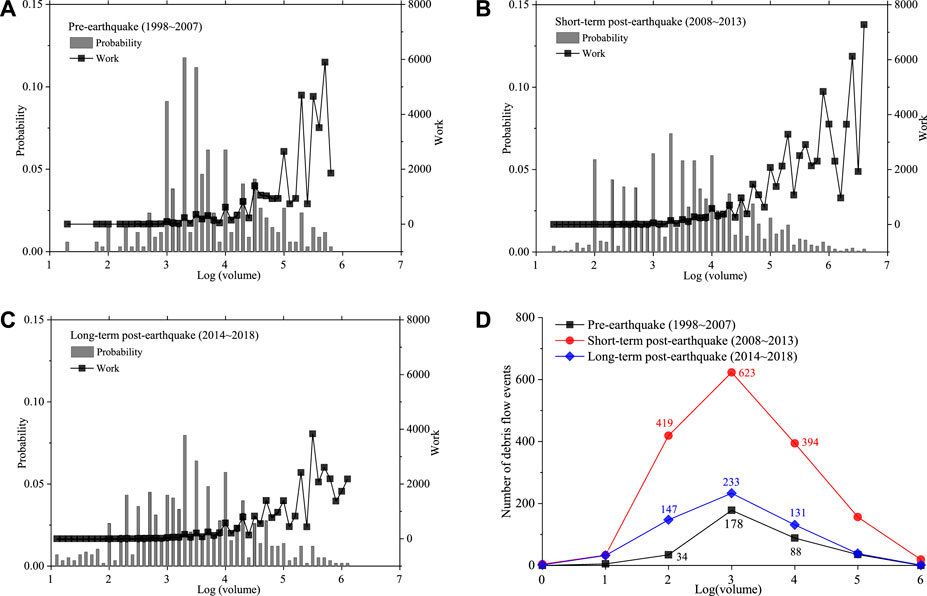
FIGURE 8. Probability and work in (A) 1998–2007, (B) 2008–2013, and (C) 2014–2018. (D) Number of debris flow events with different orders of magnitude in the three periods under study.
The probability distribution of debris flow volumes is shown in Figures 8A–C over the three periods under examination, in which the Y axis shows the probability of a debris flow event in a given magnitude class with the total value of 1. In all three phases (Figures 8A–C), the relatively high-probability debris flow events were associated with those of small- and moderate-volume, generally on the order of 103–104 m3. In contrast, the work peak (see Eq. 7) is associated with the larger-scale debris flow events in the range >105 >106 m3 (Figures 8A & C), and in the case of the short-term post-earthquake period the maximum debris flow magnitude (Figure 8B). This represents a violation of Wolman-Miller conditions, in which most work in a geomorphic system (corresponding to the work peak) is done by events of moderate magnitude, and is in contrast to the findings of Guthrie and Evans (2007) for debris flow systems in British Columbia. In Figure 8B, it was seen that in the period of 2008–2013, the work peak is displaced to the right and reached a maximum in excess of 106 m3, whilst the high-probability debris flow events were concentrated in moderate events (<105 m3). In the long-term post-earthquake period (2014–2018), the highest probability is distributed in moderate-size debris flow events and the work peak again occurs in association with the maximum debris flow magnitude (Figure 8C), similar to the pre-earthquake work profile in pattern (Figure 8A). The offset between the probability peak and the work peak in Figures 8A–C is noted and its significance is explored further.
The Wolman-Miller Offset
The offset between the probability peak and the work peak is termed here the “Wolman-Miller Offset” (see Figure 1 in Wolman and Miller, 1960). It is speculated that a large offset (e.g., Figure 8B for the immediate post-earthquake period) is representative of the mass movement response of a landscape in disequilibrium where the work peak is associated with larger events (in this case say >106 m3). In the Wenchuan Earthquake, the Wolman-Miller Offset has decreased in the long-term post-earthquake period (2014–2018) for the work peak’s migrating to the left of the probability peak as the landscape heals and returns to a background state. It is further suggested that a smaller W-M Offset is associated with a background state and represents the geomorphic signature of a particular landscape where still the most work is done by the largest debris flow events. It appears, even at background levels of debris flow activity, Wolman-Miller conditions, i.e., most work (corresponding to the work peak) done by events of moderate magnitude, do not prevail in the Sichuan landscape. Furthermore, it appears that larger events occurring more frequently are key elements of the process that returns a landscape to a steady state after a seismic shock. In this process, larger events mobilize a greater proportion of the total amount of material moved (see Figure 5). A further observation is that a large W-M offset (a highly displaced work peak) represents a transient high-hazard landscape in which large-scale debris flows occur more frequently. The limits, threshold behavior, and implications of the Wolman-Miller offset for landscape geomorphology and geohazard assessment are topics for future examination.
In terms of the size distribution of debris flows (Figure 8D), a debris flow event with a volume of 1 Mm3 was not reported in the pre-earthquake period and only one was reported in the long-term post-earthquake period. In contrast 19 debris flow events of 1 Mm3 in volume or greater occurred in the short-term post-seismic period (2008–2013). This demonstrates that the pulse of large magnitude debris flows which occurred during 2008–2013 gradually decreased and returned to a steady state after 2013, although there remains an echo of earthquake impact in the long-term post-earthquake period (2013–2018). During this process it is significant that debris volume magnitude shows a similar distribution in all three periods.
Discussion
After a strong earthquake, most previous studies mainly investigated the initiation conditions of debris flows (Lin et al., 2003; Xu et al., 2012; Zhang and Zhang 2017). Conspicuous differences before and after the earthquakes were revealed in the triggering rainfall amount and intensity for debris flows, the area extent in which debris flows occurred, the frequency of debris flow and the source materials supply of debris flows. Cheng et al. (2005) suggested that debris flows induced by 2001 Toraji typhoon were primarily caused by rainstorm on inherently unstable slopes that had been loosened in the 1999 Chichi earthquake. Dong et al. (2009) proposed an equation between debris flow volume and catchment area. Chang et al. (2011) studied the sediment volume of debris flows after the 1999 Chichi earthquake, and proposed an empirical model for estimating the sediment volume in a debris flow, involving landslide area, catchment area, geological index, cumulative rainfall and rainfall duration as the input variables. Hovius et al. (2011) studied the prolonged seismically induced erosion of the ChiChi earthquake and found that erosion peaked at more than five times the background rate and returned progressively to pre-earthquake levels in about 6 years. However, the aforementioned studies rarely explored the M-F relation of debris flows in earthquake-affected areas. We extracted debris flow data after the 1999 Chichi earthquake from Chang et al. (2011) and built the M-F relation of those debris flows in the Chichi earthquake area (Figure 9).
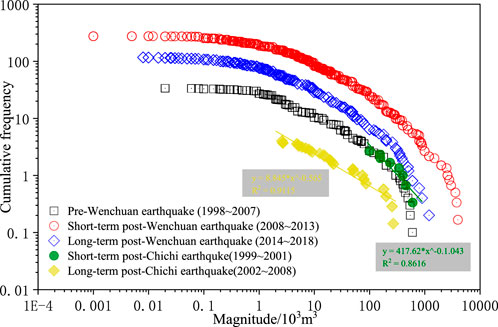
FIGURE 9. M-F relation contrasted in Wenchuan and Chichi earthquake.
According to the database, after the earthquake in 1999, many debris flows with an average magnitude greater than ×10 104 m3 occurred due to the Toraji typhoon in 2001. Subsequently, Typhoon Mindulle in 2004, Haitang in 2005 and Kalmaegi in 2008 also triggered a great deal of debris flows, which had smaller magnitude than that of the 2001 events. Therefore, we identified two periods to construct the M-F relations, the 1999–2001 and 2002–2008 periods. Through the fitted curve in Figure 9, it can be noticed that the Chi-Chi earthquake has a time-delayed effect on the debris flow occurrence, and the M-F relation of the two periods also conforms to the power-law distribution. Comparing the fitting formulas, it can be observed that the impact of the effects of ChiChi earthquake and Wenchuan earthquake on the debris flow activity has similar charactersitics. In the Wenchuan earthquake, the constant a is 2,594.7 in 2008–2013, which is 6.2 times larger than that of the ChiChi earthquake of 417.62 in 1999–2001, indicating that the Wenchuan earthquake has a greater impact on the magnitude and frequency of the debris flow in the strongly earthquake-affected period. From 2008 to 2013 after the Wenchuan earthquake, the magnitude of debris flow has been at a high level, especially after reaching the peak in 2013, and then gradually decreased. Debris flows continued to occur until 2018, and the curve was still above the pre-earthquake level. However, the ChiChi earthquake area only experienced large-magnitude debris flow in 2001, two years after the earthquake. The subsequent debris flows in 2002–2008 present a relatively small volume. This decay process took 10 years for the ChiChi earthquake. By contrast, it took longer for the Wenchuan earthquake to return the debris-flow activity to a pre-earthquake level. This result also shows that the post-seismic effect of the Wenchuan earthquake is greater and the debris flows are more active.
Xu et al. (2016) studied the 2008 Wenchuan and 2015 Gorkha earthquakes, which have comparable magnitudes of Mw 7.8 and 7.9, both occurred on the margins of the Tibetan Plateau, and both are characterized by high topography and steep slopes. However, the number, total area and volume of large landslides (≥10,000 m2) triggered by the Wenchuan Earthquake were 12–16 times of those triggered by the Gorkha Earthquake. The significant difference between the two earthquakes lies in the dip of the seismogenic fault and the area of surface region directly above the rupture plane, which controls the manner of earthquake energy release and influences the deformation of the hanging wall bedrock. The Wenchuan Earthquake has a much steeper dip of the seismogenic fault and relatively small overlying surface area, which concentrated the surface energy and resulted in many large, intense landslides. This research indicates that local topography and PGA cannot explain the large difference in landsliding between the events, and the much different dip angle of their seismogenic faults is the primary reason.
In addition, the co-seismic landslides triggered by the Wenchuan Earthquake generated several km3 of debris, which was deposited along the slopes and in low-order channels and became a large and distributed source of material for successive post-seismic debris flows (Parker et al., 2011). Terrain analysis after the Wenchuan Earthquake shows that a large volume of material was deposited on slopes; these slope deposits represented an increasing number of debris flow sources. The total number of slope collapses and landslides triggered by the Wenchuan Earthquake reached 30,000–50,000 (Huang and Li, 2009). These collapses and landslides created abundant loose source materials to be potentially mobilized in debris flow. For example, the area of slope collapse and landslides located along Du-wen Highway is as high as 6.97% of the Minjiang drainage basin area. The total volume of the loose materials is 2.13 × 10⁸ m3 (Liu et al., 2012), which covers 10–50% of the debris flow drainage area. The volume of loose materials per unit area is 1 × 10⁶ m3/km2, which is seven times that in the pre-earthquake debris flow gullies (Cui et al., 2010).
Conclusion
The regional mass movement (debris flow) response to earthquake-generated landscape damage was quantified through the analysis of long-term (1998–2018) monitoring data on 2,572 debris flow events in Sichuan Province, China. This unique record of largely rainfall-generated debris flows represents a total mobilized volume of 123.4 Mm3. For this analysis the debris flow record was divided into three time intervals: pre-earthquake (1998–2007), short-term post-earthquake (2008–2013), and long-term post-earthquake (2014–2018).
The geomorphic structure of the transient pulse of debris flow activity associated with the earthquake shock is characterized by a dramatic increase in the average annual number and volume of material mobilised by debris flows in 2010 after a lag of 2 years; this peak had decreased almost to pre-earthquake levels by 2018. The impact of the earthquake on rainfall thresholds for debris flow initiation was also examined and it was found that the landscape became hyper-sensitive to rainfall in the short-term post-earthquake period. This response reflects the availability of debris flow source materials in a damaged landscape that became exhausted in the longer-term post-earthquake period as well as being stabilized by re-vegetation.
The spatial distribution of debris flows in the immediate aftermath of the earthquake was clearly concentrated along the source fault becoming more diffused in the longer-term post-earthquake period. The contribution of different debris flow magnitudes to the total volume of material mobilised was investigated in the three periods under examination. We found that in the short-term post-earthquake period, 19 debris flow events greater than 1 Mm3 contributed 42% of the volume mobilised; no debris flow of this magnitude was recorded before the earthquake and only one (volume > 1 Mm3) was recorded in the long-term post-earthquake period. Thus, the debris flow hazard in the immediate post-earthquake period is characterised by more frequent, larger debris flows and represents a transient high-hazard landscape.
In terms of Magnitude-Frequency (M-F) relations, it was found that the three time periods yielded very similar shaped M-F curves, each one exhibited three segments consisting of low, medium, and high magnitudes. They were characterized by robust power law fits with very similar exponents in each segment of the M-F curve. It was hypothesised that the similarities in the form of the M-F relation reflect control at the landscape scale (e.g., topographic characteristics) conditioned by material properties, and environmental effects (e.g., vegetation and rainfall effects).
Finally, the work done by debris flow events in the Sichuan database was also analysed by evaluating the work peaks in the three periods. The concept of the Wolman-Miller Offset was introduced to describe the offset of the work peak in relation to the probability peak. It was concluded that with a greater W-M Offset in the immediate post-earthquake period, more work is done by larger events and the work peak corresponds to the maximum debris flow size (in violation of the Wolman-Miller precept). At the same time, the greater proportion of the volume being mobilised by larger events occurring more frequently is a key process in the landscape returning to a pre-earthquake (equilibrium) state.
Data availability statement
The original contributions presented in the study are included in the article/Supplementary Material; further inquiries can be directed to the corresponding author. Requests to access the datasets should be directed to MH at aGFubWVpQGhvbWUuc3dqdHUuZWR1LmNu.
Author contributions
MH: Methodology, Writing—original draft preparation, Data curation and processing. SE: Conceptualization, Writing—review and editing, English and text arrangement. KH: Structure, manuscript shaping. HS: Figure revision, Data analysis. ZM: data procurement.
Funding
This paper was funded by the National Science Fund for Young Scholars of China (Grant No. 41907225 to MH), State Key Laboratory of Geohazard Prevention and Geoenvironment Protection (China) Open Fund (Grant No. SKLGP2017K003 to SE, SKLGP2018K011 to MH), Fundamental Research Funds for the Central Universities (Grant No. 2682021ZTPY100).
Conflict of interest
The authors declare that the research was conducted in the absence of any commercial or financial relationships that could be construed as a potential conflict of interest.
Publisher’s note
All claims expressed in this article are solely those of the authors and do not necessarily represent those of their affiliated organizations, or those of the publisher, the editors and the reviewers. Any product that may be evaluated in this article, or claim that may be made by its manufacturer, is not guaranteed or endorsed by the publisher.
References
Brayshaw, D., and Hassan, M. A. (2009). Debris flow initiation and sediment recharge in gullies. Geomorphology 109 (3-4), 122–131. doi:10.1016/j.geomorph.2009.02.021
Chang, C. W., Lin, P. S., and Tsai, C. L. (2011). Estimation of sediment volume of debris flow caused by extreme rainfall in Taiwan. Eng. Geol. 123, 83–90. doi:10.1016/j.enggeo.2011.07.004
Chang, M., Tang, C., Van Asch, T. W., and Cai, F. (2017). Hazard assessment of debris flows in the Wenchuan earthquake-stricken area, SouthWest China. Landslides 14 (5), 1783–1792. doi:10.1007/s10346-017-0824-9
Chang, M., Dou, X., Hales, T. C., and Yu, B. (2021). Patterns of rainfall-threshold for debris-flow occurrence in the Wenchuan seismic region, Southwest China. Bull. Eng. Geol. Environ. 80 (3), 2117–2130. doi:10.1007/s10064-020-02080-7
Cheng, J. D., Huang, Y. C., Wu, H. L., Yeh, J. L., and Chang, C. H. (2005). Hydrometeorological and landuse attributes of debris flows and debris floods during typhoon Toraji, July 29–30, 2001 in central Taiwan. J. Hydrology 306 (1-4), 161–173. doi:10.1016/j.jhydrol.2004.09.007
Cui, P., Zhuang, J. Q., and Chen, X. C. (2010). Characteristics and countermeasures of debris flow in Wenchuan area after the earthquake. J. Sichuan Univ. Eng. Sci. Ed. 42 (5), 10–19. doi:10.1016/S1876-3804(11)60004-9
Cui, P., Guo, C. X., Zhou, J. W., Hao, M. H., and Xu, F. G. (2014). The mechanisms behind shallow failures in slopes comprised of landslide deposits. Eng. Geol. 180, 34–44. doi:10.1016/j.enggeo.2014.04.009
Cui, S., Pei, X., Jiang, Y., Wang, G., Fan, X., Yang, Q., et al. (2021). Liquefaction within a bedding fault: Understanding the initiation and movement of the Daguangbao landslide triggered by the 2008 Wenchuan Earthquake (Ms = 8.0). Eng. Geol. 295, 106455. doi:10.1016/j.enggeo.2021.106455
Cui, S., Wu, H., Pei, X., Yang, Q., Huang, R., and Guo, B. (2022). Characterizing the spatial distribution, frequency, geomorphological and geological controls on landslides triggered by the 1933 Mw 7.3 Diexi Earthquake, Sichuan, China. Geomorphology 403, 108177. doi:10.1016/j.geomorph.2022.108177
Dai, F. C., and Lee, C. F. (2001). Frequency-volume relation and prediction of rainfall-induced landslides. Eng. Geol. 59, 253–266. doi:10.1016/s0013-7952(00)00077-6
Domènech, G., Fan, X., Scaringi, G., van Asch, T. W. J., Xu, Q., Huang, R., et al. (2019). Modelling the role of material depletion, grain coarsening and revegetation in debris flow occurrences after the 2008 Wenchuan earthquake. Eng. Geol. 250, 34–44. doi:10.1016/j.enggeo.2019.01.010
Dong, J. J., Lee, C. T., Tung, Y. H., Liu, C. N., Lin, K. P., and Lee, J. F. (2009). The role of the sediment budget in understanding debris flow susceptibility. Earth Surf. Process. Landf. 34 (12), 1612–1624. doi:10.1002/esp.1850
Dowling, C. A., and Santi, P. M. (2014). Debris flows and their toll on human life: A global analysis of debris-flow fatalities from 1950 to 2011. Nat. Hazards (Dordr). 71, 203–227. doi:10.1007/s11069-013-0907-4
Fan, X., Domènech, G., Scaringi, G., Huang, R., Xu, Q., Hales, T. C., et al. (2018a). Spatio-temporal evolution of mass wasting after the 2008 Mw 7.9 Wenchuan Earthquake revealed by a detailed multi-temporal inventory. Landslides 15, 2325–2341. doi:10.1007/s10346-018-1054-5
Fan, X., Juang, C. H., Wasowski, J., Huang, R., Xu, Q., Scaringi, G., et al. (2018b). What we have learned from the 2008 Wenchuan Earthquake and its aftermath:A decade of research and challenges. Eng. Geol. 241, 25–32. doi:10.1016/j.enggeo.2018.05.004
Fan, R. L., Zhang, L. M., Wang, H. J., and Fan, X. (2018c). Evolution of debris flow activities in Gaojiagou Ravine during 2008–2016 after the Wenchuan earthquake. Eng. Geol. 235, 1–10. doi:10.1016/j.enggeo.2018.01.017
Fan, X., Scaringi, G., Korup, O., West, J. A., van Westen, C. J., Tanyas, H., et al. (2019). Earthquake-induced chains of geologic hazards: Patterns, mechanisms and impacts. Rev. Geophys. 57, 421–503. doi:10.1029/2018RG000626
Friele, P., Jakob, M., and Clague, J. J. (2008). Hazard and risk from large landslides from Mount Meager volcano, British Columbia, Canada. Georisk Assess. Manag. Risk Eng. Syst. Geohazards 2 (1), 48–64. doi:10.1080/17499510801958711
Ge, Y. G., Cui, P., Zhang, J. Q., Zeng, C., and Su, F. H. (2015). Catastrophic debris flows on July 10 th 2013 along the Min River in areas seriously-hit by the Wenchuan earthquake. J. Mt. Sci. 12 (1), 186–206. doi:10.1007/s11629-014-3100-7
Gregoretti, C. (2000). The initiation of debris flow at high slopes: Experimental results. J. Hydraulic Res. 38 (2), 83–88. doi:10.1080/00221680009498343
Guo, X., Cui, P., Li, Y., Ma, L., Ge, Y., and Mahoney, W. B. (2016a). Intensity–duration threshold of rainfall-triggered debris flows in the Wenchuan earthquake affected area, China. Geomorphology 253, 208–216. doi:10.1016/j.geomorph.2015.10.009
Guo, X., Cui, P., Li, Y., Zhang, J., Ma, L., and Mahoney, W. B. (2016b). Spatial features of debris flows and their rainfall thresholds in the Wenchuan earthquake-affected area. Landslides 13, 1215–1229. doi:10.1007/s10346-015-0608-z
Guo, X., Cui, P., Li, Y., Zou, Q., and Kong, Y. (2016c). The formation and development of debris flows in large watersheds after the 2008 Wenchuan Earthquake. Landslides 13, 25–37. doi:10.1007/s10346-014-0541-6
Guo, X., Li, Y., Chen, X., Zhang, J., and Sun, Y. (2021). Variation of debris flow/flood formation conditions at the watershed scale in the Wenchuan Earthquake area. Landslides 18, 2427–2443. doi:10.1007/s10346-021-01644-2
Guthrie, R. H., and Evans, S. G. (2007). Work, persistence, and formative events: The geomorphic impact of landslides. Geomorphology 88 (3-4), 266–275. doi:10.1016/j.geomorph.2006.11.010
He, K., Li, Y., Ma, G., Hu, X., Liu, B., Ma, Z., et al. (2021). Failure mode analysis of post-seismic rockfall in shattered mountains exemplified by detailed investigation and numerical modelling. Landslides 18 (1), 425–446. doi:10.1007/s10346-020-01532-1
He, K., Liu, B., Hu, X., Zhou, R., Xi, C., Ma, G., et al. (2022). Rapid characterization of landslide-debris flow chains of geologic hazards using multi-method investigation: Case study of the tiejiangwan LDC. Rock Mech. Rock Eng. 55, 5183–5208. doi:10.1007/s00603-022-02905-9
Hovius, N., Meunier, P., Lin, C. W., Chen, H., Chen, Y. G., Dadson, S., et al. (2011). Prolonged seismically induced erosion and the mass balance of a large earthquake. Earth Planet. Sci. Lett. 304 (3-4), 347–355. doi:10.1016/j.epsl.2011.02.005
Hu, T., and Huang, R. Q. (2017). A catastrophic debris flow in the wenchuan earthquake area, july 2013: Characteristics, formation, and risk reduction. J. Mt. Sci. 14 (1), 15–30. doi:10.1007/s11629-016-3965-8
Hu, X., Hu, K., Tang, J., You, Y., and Wu, C. (2019). Assessment of debris-flow potential dangers in the Jiuzhaigou Valley following the August 8, 2017, Jiuzhaigou earthquake, Western China. Eng. Geol. 256, 57–66. doi:10.1016/j.enggeo.2019.05.004
Huang, R. Q., and Li, W. L. (2009). Analysis of the geo-hazards triggered by the 12 may 2008 wenchuan earthquake, China. Bull. Eng. Geol. Environ. 68 (3), 363–371. doi:10.1007/s10064-009-0207-0
Hungr, O., McDougall, S., Wise, M., and Cullen, M. (2008). Magnitude–frequency relations of debris flows and debris avalanches in relation to slope relief. Geomorphology 96 (3), 355–365. doi:10.1016/j.geomorph.2007.03.020
Innes, J. L. (1983). Lichenometric dating of debris-flow deposits in the scottish highlandsflow deposits in the scottish highlands. Earth Surf. Process. Landf. 8, 579–588. doi:10.1002/esp.3290080609
Innes, J. L. (1985). Lichenometric dating of debris-flow deposits on alpine colluvial fans in Southwest Norwayflow deposits on alpine colluvial fans in Southwest Norway. Earth Surf. Process. Landf. 10 (5), 519–524. doi:10.1002/esp.3290100510
Iverson, R. M. (1997). The physics of debris flows. Rev. Geophys. 35 (3), 245–296. doi:10.1029/97rg00426
Jakob, M., Bovis, M., and Oden, M. (2005). The significance of channel recharge rates for estimating debris-flow magnitude and frequency. Earth Surf. Process. Landf. 30, 755–766. doi:10.1002/esp.1188
Jakob, M., and Friele, P. (2010). Frequency and magnitude of debris flows on cheekye river, British Columbia. Geomorphology 114, 382–395. doi:10.1016/j.geomorph.2009.08.013
M. Jakob, and O. Hungr (Editors) (2005). Debris-flow hazards and related phenomena (Springer-Verlag), 739. doi:10.2113/gseegeosci.13.1.75
Li, L., Yao, X., Zhang, Y., Iqbal, J., Chen, J., and Zhou, N. (2016a). Surface recovery of landslides triggered by 2008 Ms 8.0 wenchuan earthquake (China): A case study in a typical mountainous watershed. Landslides 13 (4), 787–794. doi:10.1007/s10346-015-0594-1
Li, T. T., Huang, R. Q., and Pei, X. J. (2016b). Variability in rainfall threshold for debris flow after Wenchuan earthquake in Gaochuan River watershed, Southwest China. Nat. Hazards (Dordr). 82, 1967–1980. doi:10.1007/s11069-016-2280-6
Lin, C. W., Shieh, C. L., Yuan, B. D., Liu, S. H., and Lee, S. Y. (2003). Impact of chi-chi earthquake on the occurrence of landslides and debris flows: Example from the chenyulan river watershed, nantou, taiwan. Eng. Geol. 71, 49–61. doi:10.1016/s0013-7952(03)00125-x
Lin, W-T., Lin, C-Y., and Chou, W-C. (2006). Assessment of vegetation recovery and soil erosion at landslides caused by a catastrophic earthquake: A case study in central taiwan. Ecol. Eng. 28, 79–89. doi:10.1016/j.ecoleng.2006.04.005
Liu, J. F., You, Y., and Chen, X. C. (2012). Potential damages and identification of debris flow barrier lakes in the upper Minjiang River drainage. Sci. Geogr. Sin. 32 (7), 885–891. doi:10.13249/j.cnki.sgs.2012.07.885
Liu, B., He, K., Han, M., Hu, X., Wu, T., Wu, M., et al. (2021a). Dynamic process simulation of the Xiaogangjian rockslide occurred in shattered mountain based on 3DEC and DFN. Comput. Geotechnics 134, 104122. doi:10.1016/j.compgeo.2021.104122
Liu, B., Hu, X., Ma, G., He, K., Wu, M., and Liu, D. (2021b). Back calculation and hazard prediction of a debris flow in Wenchuan meizoseismal area, China. Bull. Eng. Geol. Environ. 80 (4), 3457–3474. doi:10.1007/s10064-021-02127-3
Mao, L., Cavalli, M., Comiti, F., Marchi, L., Lenzi, M. A., and Arattano, M. (2009). Sediment transfer processes in two Alpine catchments of contrasting morphological settings. J. Hydrology 364 (1-2), 88–98. doi:10.1016/j.jhydrol.2008.10.021
Marc, O., Hovius, N., Meunier, P., Uchida, T., and Hayashi, S. (2015). Transient changes of landslide rates after earthquakes. Geology 43 (10), 883–886. doi:10.1130/g36961.1
Marc, O., Hovius, N., Meunier, P., Gorum, T., and Uchida, T. (2016). A seismologically consistent expression for the total area and volume of earthquake-triggered landsliding. J. Geophys. Res. Earth Surf. 121, 640–663. doi:10.1002/2015jf003732
Parker, R. N., Densmore, A. L., Rosser, N. J., De Michele, M., Li, Y., Huang, R., et al. (2011). Mass wasting triggered by the 2008 Wenchuan earthquake is greater than orogenic growth. Nat. Geosci. 4 (7), 449–452. doi:10.1038/ngeo1154
Pei, X. J., and Huang, R. Q. (2013). Analysis of characteristics of geololical hazard by 4 ·20 Lushan Earthquake in Sichuan China. J. Chengdu Univ. Technol. Sci. Technol. Ed. 40 (3), 257–263. doi:10.3969/j.issn.1671-9727.2013.03.05
Scheidl, C., Rickenmann, D., and Chiari, M. (2008). The use of airborne LiDAR data for the analysis of debris flow events in Switzerland. Nat. Hazards Earth Syst. Sci. 8 (5), 1113–1127. doi:10.5194/nhess-8-1113-2008
Shen, P., Zhang, L. M., Fan, R. L., Zhu, H., and Zhang, S. (2020a). Declining geohazard activity with vegetation recovery during first ten years after the 2008 Wenchuan earthquake. Geomorphology 352, 106989. doi:10.1016/j.geomorph.2019.106989
Shen, W., Wang, D., He, S., and Li, T. (2020b). Numerical assessment of the impeding effect of check dams in the Hongchun debris flow gully, Sichuan Province, China. Bull. Eng. Geol. Environ. 79 (6), 2833–2845. doi:10.1007/s10064-020-01755-5
Shieh, C. L., Chen, Y. S., Tsai, Y. J., and Wu, J. H. (2009). Variability in rainfall threshold for debris flow after the Chi-Chi earthquake in central Taiwan, China. Int. J. Sediment Res. 24, 177–188. doi:10.1016/s1001-6279(09)60025-1
Stoffel, M., and Beniston, M. (2006). On the incidence of debris flows from the early little ice age to a future greenhouse climate: A case study from the Swiss alps. Geophys. Res. Lett. 33 (16), L16404. doi:10.1029/2006gl026805
Stoffel, M. (2010). Magnitude–frequency relations of debris flows - a case study based on field surveys and tree-ring records. Geomorphology 116 (1-2), 67–76. doi:10.1016/j.geomorph.2009.10.009
Tang, C., and van Westen, C. J. (2018). Atlas of wenchuan-earthquake geohazards: Analysis of co-seismic and post-seismic geohazards in the area affected by the 2008 wenchuan earthquake. Beijing: Science Press.
Tang, C., Zhu, J., Li, W. L., and Liang, J. T. (2009). Rainfall-triggered debris flows following the Wenchuan earthquake. Bull. Eng. Geol. Environ. 68 (2), 187–194. doi:10.1007/s10064-009-0201-6
Tang, C., Zhu, J., Qi, X., and Ding, J. (2011a). Landslides induced by the wenchuan earthquake and the subsequent strong rainfall event: A case study in the beichuan area of China. Eng. Geol. 122, 22–33. doi:10.1016/j.enggeo.2011.03.013
Tang, C., Zhu, J., Ding, J., Cui, X. F., Chen, L., and Zhang, J. S. (2011b). Catastrophic debris flows triggered by a 14 August 2010 rainfall at the epicenter of the Wenchuan earthquake. Landslides 8 (4), 485–497. doi:10.1007/s10346-011-0269-5
Tang, C., van Asch Twj, , Chang, M., Chen, G. Q., Zhao, X. H., and Huang, X. C. (2012). Catastrophic debris flows on 13 August 2010 in the qingping area, southwestern China: The combined effects of a strong earthquake and subsequent rainstorms. Geomorphology 139, 559–576. doi:10.1016/j.geomorph.2011.12.021
van Asch, T. W. J., Tang, C., Alkema, D., Zhu, J., and Zhou, W. (2014). An integrated model to assess critical rainfall thresholds for run-out distances of debris flows. Nat. Hazards (Dordr). 70 (1), 299–311. doi:10.1007/s11069-013-0810-z
van Steijn, H. (1996). Debris-flow magnitude—frequency relations for mountainous regions of central and northwest Europe. Geomorphology 15 (3-4), 259–273. doi:10.1016/0169-555x(95)00074-f
Wang, E., and Meng, Q. (2009). Mesozoic and Cenozoic tectonic evolution of the Longmenshan fault belt. Sci. China Ser. D-Earth. Sci. 52, 579–592. doi:10.1007/s11430-009-0053-8
Wen, X., Fan, J., Yi, G., Deng, Y., and Long, F. (2008a). A seismic gap on the Anninghe fault in Western Sichuan, China. Sci. China Ser. D-Earth. Sci. 51 (10), 1375–1387. doi:10.1007/s11430-008-0114-4
Wen, X. Z., Ma, S. L., Xu, X. W., and He, Y. N. (2008b). Historical pattern and behavior of earthquake ruptures along the eastern boundary of the Sichuan-Yunnan faulted-block, Southwestern China. Phys. Earth Planet. Interiors 168, 16–36. doi:10.1016/j.pepi.2008.04.013
Wolman, M. G., and Miller, J. P. (1960). Magnitude and frequency of forcesin geomorphic processes. J. Geol. 68, 54–74. doi:10.1086/626637
Xiong, J., Tang, C., Chen, M., Gong, L., Li, N., Zhang, X., et al. (2021). Long-term changes in the landslide sediment supply capacity for debris flow occurrence in Wenchuan County, China. Catena 203, 105340. doi:10.1016/j.catena.2021.105340
Xiong, J., Tang, C., Gong, L. F., Chen, M., Li, N., Shi, Q. Y., et al. (2022). How landslide sediments are transferred out of an alpine basin: Evidence from the epicentre of the Wenchuan earthquake. CATENA 208, 105781. doi:10.1016/j.catena.2021.105781
Xu, Q. (2010). The 13 August 2010 catastrophic debris flows in sichuan province: Characteristic, genetic mechanism and suggestions. J. Eng. Geol. 18 (5), 596–608. doi:10.3724/SP.J.1231.2010.06586
Xu, Q., Zhang, S., Li, W. L., and van Asch Twj, (2012). The 13 August 2010 catastrophic debris flows after the 2008 Wenchuan earthquake, China. Nat. Hazards Earth Syst. Sci. 12, 201–216. doi:10.5194/nhess-12-201-2012
Xu, C., Xu, X. W., Tian, Y. Y., Shen, L. L., Yao, Q., Huang, X. Q., et al. (2016). Two comparable earthquakes produced greatly different coseismic landslides: The 2015 Gorkha, Nepal and 2008 wenchuan, China events. J. Earth Sci. 27 (6), 1008–1015. doi:10.1007/s12583-016-0684-6
Yang, W., Qi, W., and Zhou, J. (2018). Decreased post-seismic landslides linked to vegetation recovery after the 2008 Wenchuan earthquake. Ecol. Indic. 89, 438–444. doi:10.1016/j.ecolind.2017.12.006
Yi, G. X., Long, F., Wen, X. Z., Liang, M. J., and Wang, S. W. (2015). Seismogenic structure of the M6.3 kangding earthquake sequence on 22 Nov.2014, southwestern China. Chin. J. Geophysics-Chinese Ed. 58 (4), 1205–1219. doi:10.6038/cjg20150410
Yin, Y. P. (2008). Researches on the geo-hazards triggered by Wenchuan earthquake, Sichuan. J. Eng. Geol. 16 (4), 433–444.
You, Y., Liu, J., Chen, X., and Pan, H. (2012). Debris flow formation conditions and optimal characteristics of drainage canal following Wenchuan earthquake. Environ. Earth Sci. 65 (4), 1005–1012. doi:10.1007/s12665-011-1024-x
Yu, B., Ma, Y., and Wu, Y. F. (2010). Investigation of severe debris flow hazards in wenjia gully of sichuan province after the wenchuan earthquake. J. Eng. Geol. 18 (6), 827–836. doi:10.3724/SP.J.1231.2010.06586
Yu, B., Ma, Y., and Zhang, J. N. (2011). The group debris flow hazards after the Wenchuan earthquake in Longchi, Dujiangyan, Sichuan province. J. Mt. Sci. 29 (6), 738–746. doi:10.1007/s12583-011-0163-z
Yu, B., Wu, Y., and Chu, S. (2014). Preliminary study of the effect of earthquakes on the rainfall threshold of debris flows. Eng. Geol. 182, 130–135. doi:10.1016/j.enggeo.2014.04.007
Yu, B., Yang, L., Chang, M., and van Asch, T. W. (2021). A new prediction model on debris flows caused by runoff mechanism. Environ. Earth Sci. 80 (1), 26–11. doi:10.1007/s12665-020-09336-1
Zeng, C., Cui, P., Ge, Y., Zhang, Y., Lei, Y., and Yan, Y. (2014). Characteristics and mechanism of buildings damaged by debris flows on 11 July, 2013 in Qipangou of Wenchuan, Sichuan. J. Earth Sci. Environ. 36 (2), 81–91. doi:10.3969/j.issn.1672-6561.2014.02.012
Zhang, L. M., Zhang, S., and Huang, R. Q. (2014). Multi-hazard scenarios and consequences in Beichuan, China: The first five years after the 2008 Wenchuan earthquake. Eng. Geol. 180, 4–20. doi:10.1016/j.enggeo.2014.03.020
Zhang, S., and Zhang, L. M. (2017). Impact of the 2008 Wenchuan earthquake in China on subsequent long-term debris flow activities in the epicentral area. Geomorphology 276, 86–103. doi:10.1016/j.geomorph.2016.10.009
Keywords: debris flow, temporal and spatial distribution, 2008 wenchuan earthquake, magnitude-frequency relation, work peak, Wolman-Miller
Citation: Han M, Evans SG, He K, Sun H and Ma Z (2023) The structure of a magnitude-frequency relation for debris flows conditioned by earthquake shock. Front. Earth Sci. 10:946301. doi: 10.3389/feart.2022.946301
Received: 17 May 2022; Accepted: 23 August 2022;
Published: 06 January 2023.
Edited by:
Xiangjun Pei, Chengdu University of Technology, ChinaReviewed by:
Zhilu Chang, Nanchang University, ChinaZhice Fang, China University of Geosciences Wuhan, China
Copyright © 2023 Han, Evans, He, Sun and Ma. This is an open-access article distributed under the terms of the Creative Commons Attribution License (CC BY). The use, distribution or reproduction in other forums is permitted, provided the original author(s) and the copyright owner(s) are credited and that the original publication in this journal is cited, in accordance with accepted academic practice. No use, distribution or reproduction is permitted which does not comply with these terms.
*Correspondence: Stephen G. Evans, c2dldmFuc0B1d2F0ZXJsb28uY2E=
†ORCID: Mei Han, orcid.org/0000-0003-3407-4502