
94% of researchers rate our articles as excellent or good
Learn more about the work of our research integrity team to safeguard the quality of each article we publish.
Find out more
ORIGINAL RESEARCH article
Front. Earth Sci., 14 September 2022
Sec. Solid Earth Geophysics
Volume 10 - 2022 | https://doi.org/10.3389/feart.2022.945297
This article is part of the Research TopicEarthquake Swarms and Complex Seismic Sequences in Tectonic and Volcanic AreasView all 6 articles
 Seyyedmaalek Momeni1,2*
 Raul Madariaga3
The seismic history of the Mosha fault, the largest and most active fault of Eastern Tehran metropolis, and its relation to the Damavand active volcano, the highest mountain in the Middle East, is investigated. We deduce that the central Mosha, near the Damavand, has a higher seismicity than either its western or eastern segments. On 7 May 2020, an Mw 5.1 earthquake occurred on the central Mosha, about 40 km east of Tehran and 10 km southwest of the Damavand crest, and it was felt intensely in Tehran. Its rupture is imaged and located in a region that presented a relative seismic quiescence compared to its eastern and western parts, during the last 14 years, suggesting its partial locking and heterogeneous distribution of fault frictional strength on this segment of Mosha. Its significant directivity to the west is confirmed by the mainshock rupture model, its PGA distribution, and distribution of early aftershocks. The rupture model suggests a relatively small stress drop of 2.6 bar, which is consistent with the comparatively high rupture dimension of 9 km for a Mw 5.1 earthquake, and indicates the easy rupture expansion on the central Mosha near the Damavand Volcano. The central Mosha experienced earthquakes in 1930, 1955, and 1983, as well as high microseismic activity and the 2020 seismic sequence, all of which strongly point to a possible influence of the Damavand Volcano on the seismicity of the central Mosha. This is corroborated by the observation of hydrothermal zones on the Mosha fault and the extension of a sill-like Damavand young magma chamber until central Mosha in tomography studies. We propose that the existing heat may increase the pore pressure on the fault, which lowers the effective normal stress, facilitates the nucleation-expansion of the rupture, and unclamps the fault. Damavand could act as a fuse and nucleate earthquakes, and if the rupture extends toward the west, it could have a significant directivity effect on low-frequency seismic waves that reach Tehran without attenuation and affect tall structures. In addition, high site amplification for frequencies up to 16 Hz due to the deep sedimentary basin, mainly in the mid-city of Tehran, will be remarkable for short buildings.
On 7 May 2020, an M5.1 earthquake occurred in south central Alborz Mountains just 4 km north of the Mosha fault (hereafter MSH) and 10 km south of Damavand Volcano (hereafter DMV), which is situated 45 km east of Tehran city, the capital of Iran with over 15 million population (Figure 1). Despite its moderate magnitude, it caused two fatalities and several injuries (IRNA news agency). A peak ground acceleration (PGA) of 141 cm/s2 relative to the mainshock was measured at the close station of the Iranian National Strong Motion Network (ISMN) situated just 12 km southwest of the epicenter (RDH1, Figure 1B). In terms of mechanism, it exhibits an almost pure strike-slip faulting (Figure 1, reported by the Iranian Seismological Center (IRSC); Supplementary Table S1). This event did not produce any surface rupture.
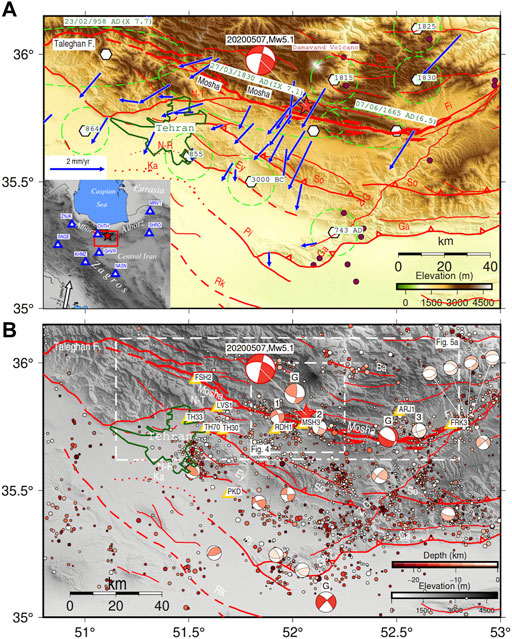
FIGURE 1. (A) Seismotectonics of the study area. Star shows the mainshock hypocenter location and the related focal mechanism as reported by IRSC. Faults are shown with solid and dashed lines. Dotted lines marked N-R and Ka are related to the North Ray and Kahrizak scarps, respectively, that are uncertain whether created by faulting or are old shorelines (after Nazari et al., 2010). Vectors are geodetic surface deformation rates by Djamour et al. (2010), with respect to a fixed central Iran block. Triangles are the used station data of the Broadband National Iranian Network (BIN) for moment tensor inversion (Section 3.1). Hexagons are historical earthquakes (Ambraseys and Melville, 1982; Berberian and Yeats, 1999; Nazari et al., 2009). Circles are instrumental earthquakes by Engdahl et al. (2006). Dashed ellipses show affected regions by historical earthquakes. Fault names are as follows: Ga, Garmsar; So, Sorkhe; Ey, Eyvanakey; Fi, Firuzkuh; Pi, Pishva; N–T, North Tehran; Ba, Baijan; Rk, Robat Karim; and NR, North Rey. The Tehran area is in Green. MSH in in red solid line. (B) Circles: Seismicity recorded by the IRSC network from 2006 until just before the M 5.1 mainshock. Colors represent hypocentral depths. Faults are the same as (A). Focal mechanisms with label G are from the GCMT catalog. The ones without labels and those labeled 1, 2, and 3 are from small to moderate magnitude earthquakes (3.6<M<4.8) that occurred from 2006 to 2012 in the region and obtained by inverting local broadband seismic data for their moment tensors (Momeni, 2012). Triangles are the strong motion station locations of the Iranian Strong Motion Network (ISMN) whose data was used for extended rupture inversion (Section 3.3).
MSH is the longest fault in south central Alborz with a length of ∼175 km and has a left-lateral strike-slip faulting mechanism, which mostly accommodates the strike-slip component of the Caspian Sea clockwise rotational relative motion (Djamour et al., 2010). This earthquake is the only well-recorded M > 5 seismic event near the MSH by the IRSC network.
DMV is the highest and largest volcano of the Middle East with an altitude of 5670 m, situated just 50 km northeast of Tehran city. Damavand had an average uplift rate of 3 mm/y between 2003 and 2010 (Vajedian et al., 2015), which was almost uniformly distributed on the area suggesting the existence of a sill-like magma chamber (Yazdanparast and Vosooghi, 2014). Thermal areas exist near the MSH (Eskandari et al., 2018), confirming the extension and presence of the DMV magma chamber toward the MSH.
Tehran is built on a thick sedimentary basin consisting of quaternary alluvial deposits which are the main cause of wave amplification in that area (i.e., Majidnejad et al., 2017; Kamranzad et al., 2020). Inside Tehran, several active faults have been recognized, such as Qeytarieh, Lavizan, Pardisan, Chitgar, and Garmdare (Ritz et al., 2012; Talebian et al., 2016), among which some have relatively fast slip rates that are estimated > 1 mm/yr (e.g., Pardisan). This can have a strong impact on the earthquake hazard assessment of Tehran city and the surrounding region.
In this study, we first invert the local broadband displacement full waveforms of the 7 May 2020 M5.1 mainshock for its moment tensor. Then we relocate the mainshock and largest aftershock hypocenters. Later, we invert the near field strong-motion displacement wave-fields of the mainshock recorded in the Iranian Strong Motion Network (ISMN), for the spatiotemporal evolution of the slip, and investigate its relation to the distribution of early aftershocks and the seismic history of the MSH. Then we analyze the frequency content of the mainshock rupture, fmax in the Tehran area, and stress drop due to the mainshock to better investigate the impact of such earthquakes on the hazard for Tehran city. Finally, we discuss the relation between MSH seismic activity and DMV and the plausible cause of triggering.
The Alborz mountain range is part of the northern boundary between Iran and Eurasia, located south of the Caspian Sea (Figure 1). It accommodates about 30% of the total 25 mm/y of shortening between Arabia and Eurasia; the remaining being accommodated both by the shortening of the Zagros Mountains and by long strike-slip faults in Central Iran (Vernant et al., 2004). The motion between Central Iran and the South Caspian Basin is oblique to the belt and involves roughly ∼ 5 mm/y of shortening and ∼ 4 mm/y of left-lateral strike-slip motion (Vernant et al., 2004; Khorrami et al., 2019). This oblique motion is due to the clockwise rotation of the South Caspian Basin (Djamour et al., 2010).
Alborz Mountains have deformed during several tectonic episodes. The first corresponds to the collision of the Iranian microplate with Eurasia that occurred during the Late Triassic (i.e., Asserto and Milano, 1966; Berberian and King, 1981; Stocklin, 1974). The second was the collision of Arabia with Iran that represented the main contribution to the deformation of Alborz. This collision either began ∼12 million years ago, according to the thermochronology of exhumated rocks (Guest et al., 2006a; Guest et al., 2006b), or even before, ∼20 million years ago based on the sedimentary studies of Ballato et al. (2008, 2011). The third episode is associated with partitioning. It may have started 10 million years ago or 5 million years ago according to Hollingsworth et al. (2008) and to Allen et al. (2003), or even more recently following Ritz et al. (2006).
MSH consists of three segments: the western MSH segment located north of Tehran strikes WNW and is parallel to the eastern segment of the sinistral-reverse Taleghan fault (Guest et al., 2006a; Guest et al., 2006b). The western MSH could be part of a local partitioning system with the Taleghan fault (Guest et al., 2006a; Guest et al., 2006b) or deactivated in favor of the Taleghan fault (Nazari et al., 2009).
The central MSH strikes WNW with a length of ∼80 km and branches to the west of the North Tehran fault (NTF, Solaymani et al., 2011). This segment is also a left-lateral strike-slip fault that accumulated ∼35 km of total displacement (Guest et al., 2006a; Guest et al., 2006b). Abbassi and Farbod (2009), however, believed that the NTF is not presently active and suggested that the motion occurs on several smaller faults situated southward. A paleoseismological study by Ritz et al. (2012) on a segment of NTF revealed its shallow dip thrusting toward the north (N115°E) and interpreted between six and seven surface-rupturing events with estimated magnitudes between 6.5 and 7.2 that occurred during the past 30 kyrs.
The eastern segment of MSH has a WNW strike and connects to the left-lateral/normal ENE–WSW Firuzkuh fault to the east. It is situated along the Mosha Valley and is almost parallel to the Sorkhe fault on its south. This segment has a left-lateral strike-slip motion and dips to the north (Allen et al., 2004; Bachmanov et al., 2004) but with a slight normal component (Ritz et al., 2006). The total sinistral offset is ∼35 km (Allen et al., 2003) and the slip rate ∼2 mm/y (Ritz et al., 2006). Recent GPS measurements also estimated 1–2 mm/y of left-lateral strike-slip motion on the MSH (Djamour et al., 2010).
It is estimated that the Firuzkuh fault with a late quaternary estimated slip rate of 1.1–2.2 mm/yr have experienced earthquakes with a maximum magnitude of 7.1, involving 1.2 m average displacement, that is expected to occur every 540–1,100 years (Nazari et al., 2014). As the last earthquake on the Firouzkuh fault may be up to 700 years in age, it can be considered as one of the major hazards for future earthquakes.
Damavand is a young, dormant stratovolcano, which is a large intraplate quaternary composite cone of trachyandesite lava and pyroclastic deposits overlying the active fold and thrust belt of the Central Alborz Mountains. Isotope dating and geological and tomography studies have revealed that the present cone (young Damavand) has been constructed over the last 600 kyrs with a dimension of ∼80 km3, a little to the south-southwest and on an older, eroded edifice of the old Damavand (Davidson et al., 2004; Mostafanejad et al., 2011; Shomali and Shirzad, 2014).
Tehran sedimentary basin consist of four units: 1) Hezardarreh formation is the oldest deposit in Tehran with a thickness of 1,200 m that forms an anticline through the northeast-east of Tehran; 2) Kahrizak formation unconformably overlies on the eroded surfaces of Hezardarreh formation with 10–60 m in thickness and maximum dip of 15°; 3) Tehran formation, formed mainly of conglomeratic young alluvial fan deposits, and its thickness can reach 60 m and its bedding is almost horizontal; 4) the last one is the recent alluvium that represents the youngest stratigraphic unit within the region as its age reaches to Holocene Epoch, and its thickness is 10 m. This unit composes of poorly consolidated to unconsolidated cementation with alluvial and fluvial origin (Kamranzad et al., 2020).
In total, three M > 6.5 historical earthquakes are related to the MSH (Tchalenko et al., 1974; Ambraseys and Melville, 1982; Berberian, 1994; Berberian and Yeats, 1999). The 07/06/1665 AD (M 6.5) on the eastern segment, 27/03/1830 AD (IX 7.1) on its central segment, and 23/02/958 AD (X 7.7) on its western segment, which is also partially imputed to the Taleghan fault (Figure 1A).
Several moderate magnitude earthquakes have also been reported after 1800 AD on the central segment of MSH near DMV: 1802, 20/06/1811, 1815, 02/10/1930 AD Ms 5.2, and 24/11/1955 AD mb 4.0 earthquakes that occurred just south of the DMV, very close to the 2020 mainshock (Berberian et al., 1993; Berberian, 1997; Nazari et al., 2009).
The instrumental seismicity is widely spread in the region. The EHB catalog (Engdahl et al., 2006) locates most of the seismicity near the Mosha, Firuzkuh, Sorkhe, and Garmsar faults (Figure 1A). However, recent seismic activity recorded by the IRSC network shows a broad distribution of seismicity in the region. Figure 1B shows selected earthquakes of the region that were recorded by the IRSC network since 2006. They have been located by at least five stations, have a location error of <3 km, RMS of <0.5 s, and azimuthal gap of <180°. The eastern and central segments of the MSH show more intense microseismic activity compared to its western segment. A seismic cluster to the east of Tehran city is mostly related to mining activities in that area. The rest of the seismicity is related to the Sorkhe, Eyvanakey, Pishva, Garmsar, Zirab–Garmsar, Firuzkuh, and Robat Karim faults. Detailed microseismic monitoring on the MSH by a local dense seismic network confirmed its left-lateral strike-slip mechanism with an east-southeastward–oriented fault plane, according to Tatar et al. (2012) who proposed an average dip of 70° to the north for this fault.
A total of three moderate magnitude earthquakes with strike-slip mechanisms have been inverted by Momeni, (2012) on the central and eastern segments of the MSH; two of them (#1 and #2) were located south of DMV (Figure 1B; #1: 20/12/2006 Mw 4.2, #2: 26/02/2007 Mw 3.6, and #3: 24/04/2008 Mw 3.6). However, there was no seismic activity reported for the western MSH segment neither from 1900 to 1996 (Berberian et al., 1993) nor in the recent IRSC catalog (Figure 1B).
The 2020 seismic sequence is well-recorded by different seismic and acceleration networks. We use the seismic waveforms of the mainshock and the largest aftershock recorded in the IRSC network to relocate their hypocenters.
The mainshock waveforms recorded in eight three-components stations of the Iranian broadband seismic network (BIN) situated at distances ranging from 84 km to 433 km are used for the moment tensor inversion (Figure 1A). The BIN seismic network is maintained by the International Institute of Earthquake Engineering and Seismology (IIEES), Tehran, Iran.
We use the near-field strong motion waveforms of the mainshock recorded by 10 three-components SSA-2 Kinemetrics digital accelerometers of the Iranian Strong Motion Network (ISMN) to estimate its extended rupture model. The stations are located at distances ranging between 4 km and 60 km from the rupture area (Figure 1B). We also use the strong motion data recorded in all ISMN stations to investigate the PGA distribution of the mainshock in the mainshock region and in Tehran.
The IRSC catalog since 1990 to 22 June 2020, together with other reports on the seismicity of the region for the years before 1990, are used to investigate the seismicity of the Mosha fault and the eastern Tehran region.
We first relocate the mainshock and largest aftershock hypocenters. Then we estimate the moment tensor of the mainshock source by inverting the local to regional waveforms from the broadband seismic network. Then we invert the near-field strong motions of the mainshock for its extended rupture model. At the end, we investigate the statistics on the seismic activities of different segments of the Mosha fault.
The mainshock and largest aftershock hypocenters were relocated by visually reading the Pg and Sg crustal phases arrival times recorded in the IRSC network and inverting them using the HYPOCENTER code (Lienert and Havskov, 1995). We used the velocity model of the area by Tatar et al. (2012) and applied the station time corrections that were obtained in their study.
The low-frequency full waveforms of the mainshock recorded at distances < 450 km were inverted to obtain the moment tensor, assuming a point source and using the latest version of Isola code (Sokos and Zahradník, 2008). Distant stations were excluded from the inversion to keep the maximum possible frequencies of the displacement waves while avoiding the undesirable effects of crustal heterogeneity on the centroid location and moment tensor calculations. The mean and trend of data were removed and band-pass filtered by a fourth-order Butterworth filter between 0.03 and 0.08 Hz and cut from origin time for a length of 250 s. The Green’s functions for the trial point source were computed using the discrete wavenumber (DWN) method (Bouchon, 2003) and the similarity between the observed and calculated waveforms measured by the variance reduction (VR) parameter of the Isola code. Details of the inversion procedure are explained in a study by Momeni and Tatar (2018). We used a velocity model of the area obtained in a detailed microseismic study by Tatar et al. (2012) (Supplementary Table S2). The trial point sources were grid searched in the activated area (Figure 2A). The centroid time was searched as well, from 2 s before to 4 s after the origin time with steps of 0.08 s (Figure 2B).
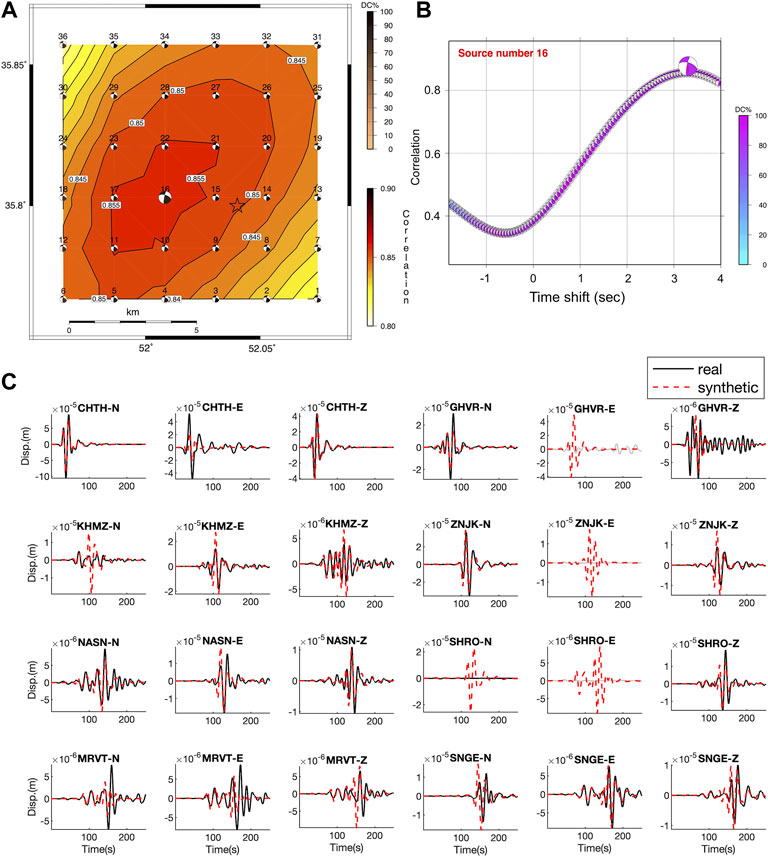
FIGURE 2. 3D grid search of the M5.1 mainshock centroid location-time. (A) Horizontal slice on the space-time correlation plot of trial centroid point sources at a depth of 12 km. The best result was obtained for source number 16 (the larger focal mechanism) with a correlation of 85% situated almost 4 km WNW of the hypocenter reported by IRSC (black star). (B) Centroid time correlation plot for the preferred point source #16. The best centroid time is shifted 3.3 s with respect to the IRSC reported origin time. (C) Waveform fit between the real (solid) and synthetic (dashed) displacements for the best obtained moment tensor. Station names and components are written on the top of each sub-figure. Gray waveforms were not used in the inversion, while the related synthetics were produced by forward modeling.
We invert the near-field strong-motion displacement time series to obtain the spatial and temporal evolution of the slip for the mainshock. The acceleration data is integrated twice to displacements. The mean and trend of the waveforms are corrected and the horizontal components are rotated to an NS/EW coordinate system. The waveforms are cut using a time window of 25.6 s after the respective origin time (Figure 3D). The data was band-pass filtered using a Butterworth one-pass causal filter in the frequency band 0.08–0.7 Hz. We observed some low-frequency noise below 0.08 Hz. Also, the upper limit of the frequency band is chosen based on the resolution of the crustal velocity model and simplifications assumed in the used model.
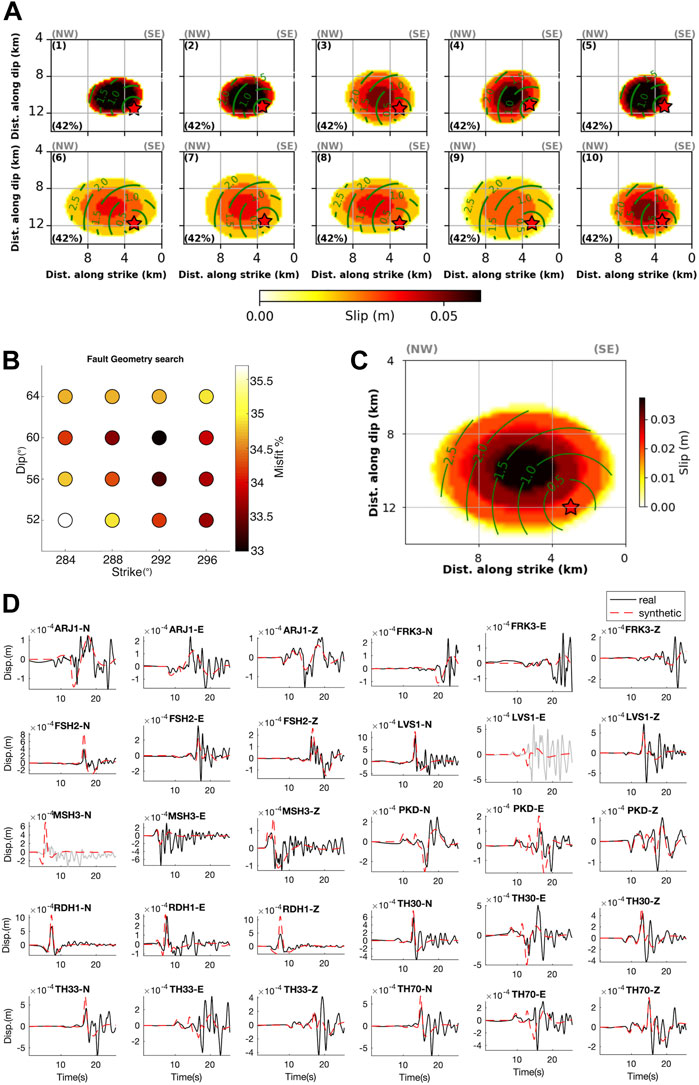
FIGURE 3. (A): 10 final rupture models for the mainshock obtained on the preferred geometry obtained during independent inversions, assuming different ranges for the rupture parameters. (B) Grid search of the geometry of the ruptured area. The preferred geometry has a strike/dip of 292°/60°. (C) Best rupture model for the mainshock. (D) waveform fit of the best rupture model shown in (C). Gray waveforms were not used in the inversion; their corresponding synthetic waveforms were obtained by forward modeling.
The processed data has been inverted for the rupture evolution using the elliptical sub-fault approximation method (i.e., Ruiz and Madariaga, 2013; Twardzik et al., 2012; Ruiz et al., 2019; Momeni et al., 2019). It approximates the rupture distribution with a few elliptical patches on a planar fault and has the advantage of reducing the number of parameters of inversion in comparison to the more commonly used rectangular sub-fault parametrization. Each of the elliptical slip patches is described by just nine parameters, five of which are used to define the fault’s geometry, whereas the other four describe the rupture process with slip amplitude, slip duration, slip direction, and onset time. Although this method is not suited to retrieve fine details of the rupture process, it focuses on the more robust features of the source.
Proper geometry is grid searched for the mainshock near the two nodal planes obtained in Section 3.2.2 (Figure 3B). One and two elliptical patch(es) were investigated to estimate the rupture process. During the inversions, for each of the tested geometries, we consider a wide range of source parameters (see Supplementary Figures S2–S11). The inversions were carried out using the neighborhood algorithm (Sambridge, 1999) to search for the rupture model that fits best the strong-motion displacements. Green’s functions were computed using AXITRA (Cotton and Coutant, 1997), a program that is based on a discrete wavenumber method (Bouchon, 2003), and adopting a velocity model (Tatar et al., 2012). For each inversion, the hypocenter is allowed to move ± 1 km on the fault plane along strike and dip to allow small corrections for errors on the origin time. Up to 500 iterations were applied during inversions, and each iteration had 35 different trial rupture models to ensure convergence (for more details, see Supplementary Figures S2–S11).
The hypocenter obtained in Section 3.2.1 has been used as the initiation point of rupture, and different trial planar rupture geometries were tested in the inversion using one elliptical slip patch to find the optimum geometry based on waveform fit to the strong-motion records.
We investigate the seismicity and scalar seismic moment release along the Mosha fault in four time periods: 1) before 1996 when there was no local seismic network, 2) since 1996 to 2006 when there was a sparce local seismic network, 3) after 2006 until the 2020 seismic sequence when the seismic network coverage has been improved, and 4) the 2020 seismic sequence. The earthquakes in distance of 5 km from the Mosha fault are investigated. They are selected based on localization precision (i.e., number of phases used in localization, azimuthal gap, and RMS).
We use the strong motion data of 33 accelerogram stations of the ISMN network to study the PGA distribution of the mainshock in the region and in Tehran. The geometric average of the strong motions’ peaks for two horizontal components of each station is referred to as the horizontal PGA. The stress drop is obtained from the extended rupture model and is compared with the Brune model. The corner frequency and Fmax is obtained from the smoothed spectra (see Konno et al., 1998) for all strong motion stations in the region and in Tehran.
The obtained hypocenter for the mainshock is situated 4 km north and 2 km east of the Mosha town, at a depth of 14 km (Supplementary Table S1). It is 2 km to the north, 2 km to the east, and 3 km deeper than the IRSC hypocenter.
The M4.1 aftershock hypocenter is relocated 2 km south and 4 km west of the mainshock hypocenter and at a depth of 9 km. The latter is almost 1 km northwest of the IRSC reported hypocenter and is 3 km shallower than their result.
We stress that the hypocenter locations of the earthquakes in the study region provided by the BIN seismic network have higher uncertainty compared to IRSC reported locations. This is due to a relatively sparse coverage of the BIN network (only three stations in the distance of 100 km from the earthquake). However, the IRSC network had 10 stations in the same distance from the source. The IIEES reported hypocenter for the mainshock is located at 2 km to the west, 3 km to the south, and 4 km shallower than our location. Their located hypocenter for the largest aftershock is situated in 2 km to the west, 3 km to the south, and 1 km deeper than our result.
The best waveform fit with a space-time correlation of 85% was obtained for a point source situated in ∼3 km west of the relocated hypocenter and at a depth of 12 km, proposing that the rupture grew mostly to the west (toward Tehran city) (see Zahradnik et al., 2008). The NW striking nodal plane has a strike/dip of 291°/60° (Figure 2), which is steeper than the one obtained by IRSC (52°). However, that is less steep compared to the GCMT result (68°). The centroid depth could change between 11 km and 16 km, with only a slight change in the waveform fit (<2%). A total scalar seismic moment of 4.8 E+16 Nm equivalent to Mw 5.1 was computed, which is larger than the GCMT and IRSC results (4.1*E+16 Nm and 2.8*E+16 Nm, respectively).
The WNW striking nodal plane obtained in Section 3.2.2 provides a better wave-fit of 58%, suggesting that the rupture occurred on the MSH. In addition, the geometries near the NW striking nodal plane were examined in order to identify the rupture plane that best fits the observed displacement waveforms (Figure 3B). The favored geometry has a strike/dip = 292°/60°. This geometry is very similar to the MSH’s general NW strike in this region. However, our obtained dip angle is 10° less than Tatar et al. (2012) results that estimated the average dip of 70° for the MSH.
We evaluate 10 final rupture models produced by various inversions of the near-field displacement waveforms (see Figure 3A; Supplementary Table S3). These rupture models were computed using the hypocenter determined in Section 3.2.1, and considering our preferred planar fault with a strike/dip of 292°/60°N. We use a single elliptical slip patch to represent the mainshock slip. These models have a 42% minimum wave misfit. The late part of the displacement fields, which mostly contain the surface waves and site effects, are responsible for the majority of the mismatch (see Supplementary Figures S2–S11). The extension of slip to the west of the hypocenter is visible in all of these models, with high values seen at depths between 13 and 10 km. This range is consistent with the highest waveform correlation in the moment tensor inversion and the IRSC result. The rupture exhibits a left-lateral strike-slip mechanism (rakes = 14°–18°) and has not reach the ground surface.
All the models had roughly similar sub-shear rupture speeds, ranging from 2.2 to 2.8 km/s (Vs.=3.5 km/s), and durations, ranging from 2.1 to 2.8 s. The rise time varies from 0.02 to 0.26 s. Models with higher rise times exhibit mostly higher rupture speeds, which is consistent with the results of dynamic simulations from Schmedes et al. (2010). Depending on the rupture dimension, the maximum slip ranges from 3 to 9 cm.
The seismic moment release estimated by the extended rupture inversions range from 3.8e+16 Nm to 4.3e+16 Nm, which is less than the predicted scalar moment determined by regional point-source waveform inversion (4.8 e+16 Nm). We stress that the strong motions’ low-frequency noises restricted inversion to using frequencies below 0.08 Hz, whereas in point-source inversion, in Section 3.2.2, we used frequencies down to 0.03 Hz. All the rupture models satisfy the observed strong motions. We choose the average of the 10 final models as our preferred model. This rupture model shows nucleation at the depth of ∼14 km (Figure 4A). The slip mostly extends toward the west and to the shallow depths with an average speed of 2.75 km/s. The area of largest slip of ∼ 4 cm is estimated between depths of 13 km and 11 km. A total scalar seismic moment of 4.04 E+16 Nm corresponding to Mw5.0 is released during the rupture, which lasts for around 2.8 s. This is smaller than what was found using the point-source moment tensor inversion in Section 3.2.2. At a depth of 12 km, the highest slip is located 2.5 km west and 0.5 km south of the hypocenter. The rupture ends 10 km below the surface. The remarkable rupture length of 9 km for an M5.0 event suggests its easy extension.
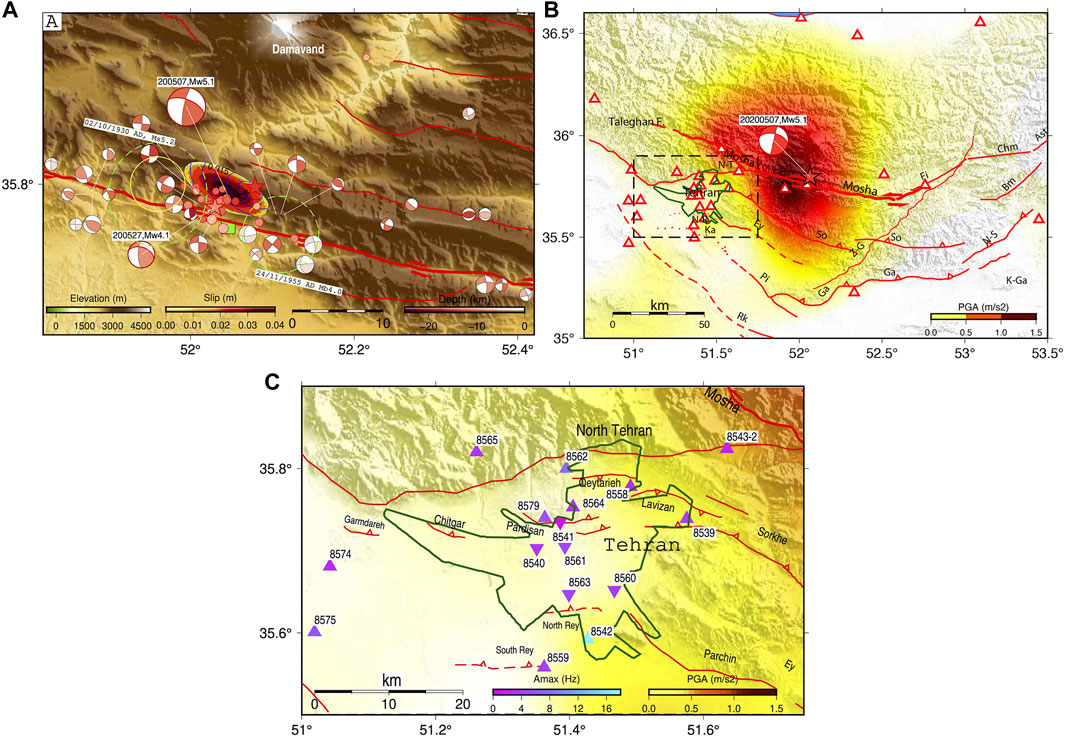
FIGURE 4. (A) Correlation between mainshock rupture (colored ellipses is the surface projection of rupture) and aftershocks of the first 45 days (filled circles). Stars are mainshock and largest aftershock hypocenters relocated in this study (Section 3.2). The mainshock focal mechanism is obtained in Section 3.1. The M4.1 27/05/2020 aftershock focal mechanism is from IRSC. Inner colors represent their depths. Faults are plotted with red lines; curved lines on the rupture model represent rupture direction. The square is the location of Mosha town. The dashed ellipses show the damaged areas of the Ms 5.2 1930 and mb 4.0 1955 earthquakes (after Berberian et al., 1993). Other focal mechanisms are from microearthquakes on the MSH obtained by Tatar et al. (2012) from June to October 2006. The solid circle is the observed thermal area on the MSH (after Eskandari et al. (2018). (B) The directivity effect of the 7th May Mw 5.1 mainshock observed from the PGA recorded in the triggered BHRC network stations in the region. Strong motion stations are shown in triangles. Black dashed rectangle shows the area shown in (C). (C) PGA distribution of the mainshock in the Tehran area. Solid lines are the active faults [after Talebian et al. (2016)]. Strong motion stations inside the Tehran city are shown in reverse triangles. Inner colors of triangles represent the maximum spectral frequency (Amax) at the stations. Dashed lines are probable shoreline scarps (after Nazari et al., 2010).
The misfit of the kinematic rupture models decreases to a minimum value of 39% when two elliptical slip patches are utilized in the inversion, which is not a significant improvement in the wave-fit. Therefore, the mainshock rupture can be estimated using the model with a single slip patch.
Within the first 45 days following the 2020 mainshock, the IRSC network reported 27 M ≥ 2.5 aftershocks with localization errors of <3 km, azimuthal gaps of <180°, and RMS of <0.5 s (Figure 4A), 25 of them are located within the distance of 5 km from the central segment of MSH (Figure 5B, Supplementary Table S5). It is evident from Figures 5C,D that the M5.1 mainshock rupture, and its early aftershocks (45 days) occurred in a part of central MSH that had a much lower seismic activity compared to its neighboring areas. The aftershocks concentrated in the direction of the mainshock rupture (Figure 4A). All of the aftershocks happen at depths between 8 km and 14 km. The majority of the MSH microseisms were also located by Tatar et al. (2012) on the central segment, at depths of 10–15 km.
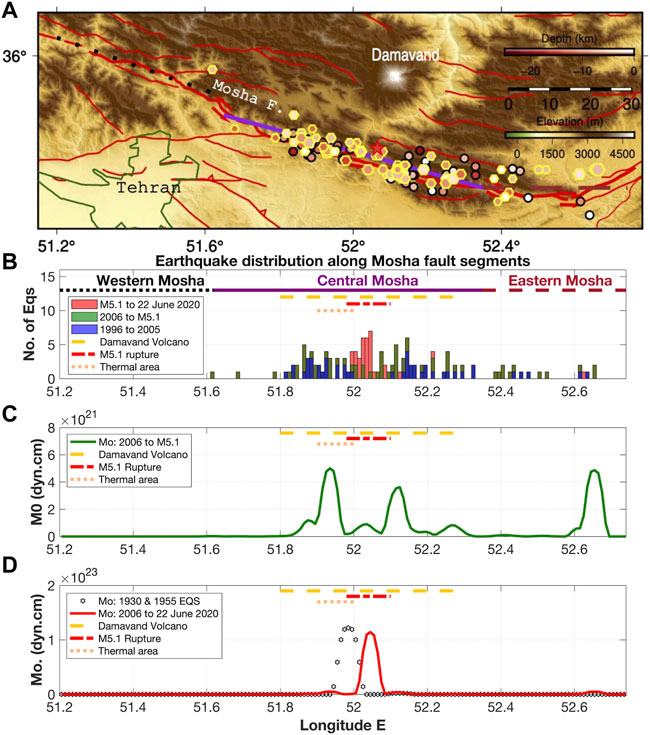
FIGURE 5. (A) Seismicity within a distance of 5 km of the MSH since 1996 until the M5.1 mainshock. Circles and hexagons are the earthquakes since 1996 to the end of 2005 and 2006 until before the M5.1, respectively. Dotted, solid, and dashed lines are western, central, and eastern segments of the MSH, respectively. (B) Histogram showing the distribution of earthquakes along the MSH. (C) Distribution of scalar seismic moments along the MSH from 2006 until before the 2020 M5.1 mainshock. (D) Distribution of scalar seismic moments along MSH from 2006 until 22 June 2020, including the M5.1 mainshock and 27 M ≥ 2.5 early aftershocks.
A continuation of the same slipping area is suggested by the fact that the biggest aftershock of the 2020 sequence (Mw4.1, occurred on May 27) was located directly in front of the mainshock rupture, where it was arrested. Its focal mechanism resembles the mainshock in many ways (Figure 4A). In addition, two distant aftershocks have been recorded, one close to the DMV and the other in the region of the occurrence of 24 November 1955 earthquake.
Beginning in 1996, the IRSC seismic network in east of Tehran began providing accurate earthquake locations for smaller events. However, the IRSC network was relatively underdeveloped until 2005, and as a result, there are only 47 earthquakes with precise locations within 5 km of the MSH (Figures 5A,B). The chosen earthquakes are located by at least six stations and have location uncertainties of <5 km, RMS of <0.5 s, and azimuthal gaps of <180°. The events mentioned are mostly distributed on the central segment of the MSH with a considerable concentration near the DMV. Since 2006, the IRSC seismic network catalog has improved in both magnitude completeness and localization precision, and as a result, 60 M ≥ 2.5 earthquakes have been located within 5 km of the MSH as of the mainshock on 7 May 2020. (Figures 5A,B, Supplementary Table S4). The location error, azimuthal gap, and RMS for this group of earthquakes are all less than 3 km, 180°, and 0.5 s, respectively. In addition, this seismicity is concentrated in the MSH Central section, close to the DMV. Although the western segment is essentially calm, the eastern segment exhibits seismic activity at its eastern terminus.
As the located earthquakes after 2006 have better location precision, we decided to compute the cumulative scalar seismic moments of the earthquakes that occurred after 2006, to investigate the seismic energy release behavior along the MSH fault. The cumulative scalar seismic moment plot shows three peaks of seismic energy: two of them to the east and west of the M5.1 rupture on the central segment, and one near the eastern termination of the fault (Figure 5B,C). These peaks are mostly related to three events that occurred on 20/12/2006 Mw4.2 (#1), 26/02/2007 Mw3.6 (#2), and 4/04/2008 Mw3.6 (#3), and their moment tensors were inverted by Momeni, (2012) (Figure 1B).
The early aftershocks of 2020 are surrounded by the two peaks of cumulative scalar seismic moment release of earthquakes from 2006 until the M5.1 mainshock (Figure 5C). After the mainshock, the cumulative scalar seismic moment plot shows a large peak in the mainshock slip area and its related aftershocks (Figure 5D) that has a comparable amplitude to the scalar seismic moment release from the 1930 M5.2 earthquake.
The interpolated PGA from 33 recorded stations of the ISMN network suggests a west-northwestward directivity for the 2020 mainshock, which is consistent with our source model (Figure 4A). However, the PGA drops in the Tehran Basin (Figure 4B).
The stress drop has been estimated 2.6 bar from the extended rupture model, posing roughly a circular slip patch with a radius of 4.3 km, and a scalar seismic moment of 4.8 e+16 Nm (see Madariaga, 1977). The low-frequency content of the 2020 mainshock, with a corner frequency of 0.7 Hz, is seen in the Fourier spectra of the closest strong motion data for stations FRK3 and LVS1 with negligible site effect.
The far-field Brune model for an M5.1 earthquake is estimated in the Tehran region (Brune, 1970) in which the slip patch radius is roughly 4.3 km, S-wave velocity is 3.5 km/s, and
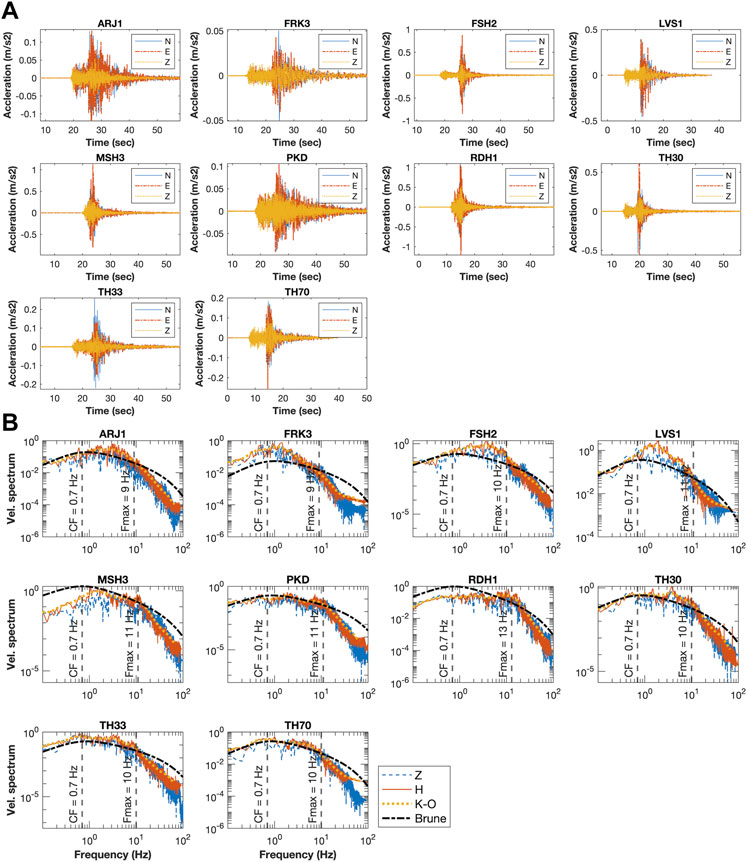
FIGURE 6. (A) Strong motion signals of the mainshock recorded in the near-field stations shown in Figure 1B. (B) Fourier spectra of the strong motions showed in (A). Black dashed line represents the Brune theoretical velocity spectra for a circular source.
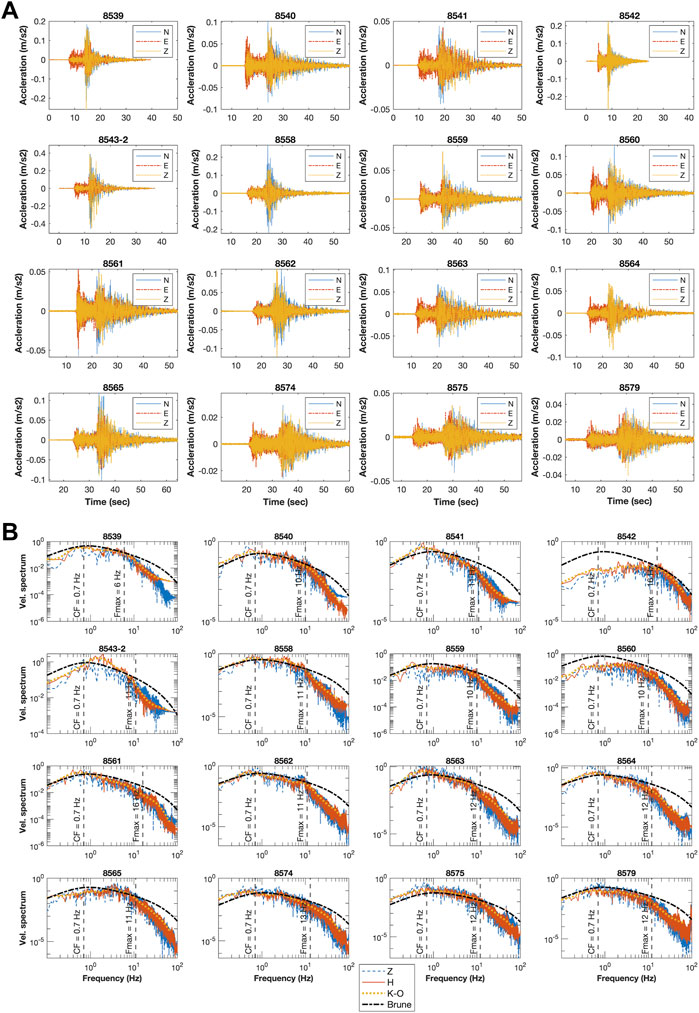
FIGURE 7. (A) Strong motion acceleration waveforms of the mainshock recorded in the ISMN network stations in the Tehran area shown in Figure 4C. (B) Velocity Fourier spectra of the strong motions shown in (A). Black dashed line represents the Brune theoretical velocity spectra for a circular source.
The seismicity of the MSH is investigated from documented historical earthquakes until before 22 June 2020. All the segments of the MSH are ruptured during the 3 M ≥ 6.5 historical earthquakes. Nevertheless, instrumental seismicity is relatively low. A total of three earthquakes are mentioned in the EHB database (Engdahl et al., 2006) as occurring on the eastern and central segments of MSH, close to the DMV. The GCMT catalog also shows two earthquakes on these segments with magnitudes 5<M<5.3. The IRSC earthquake catalog has been improved since 2006 in term of magnitude completeness. This catalog contains 67 M ≥ 2.5 earthquakes within a distance of 5 km from the fault for a period from 2006 until before the 2020 mainshock. The central segment of MSH, south of the DMV, experienced most of this seismic activity. The cumulative scalar seismic moment map of these earthquakes shows three peaks (Figure 5C). It's interesting to note that the projected rupture zones for the Ms 5.2 1930 and Mb 4.0 1955 earthquakes overlap with the two central peaks that are mainly associated with the 2006 and 2007 earthquakes. They could be late aftershocks of these earthquakes.
The rupture process and the fault geometry of the 2020 mainshock is investigated by inverting both the local broadband seismic data for the moment tensor and the near-field strong-motion displacement time series for its extended rupture model. The mainshock nucleated on the central segment of the MSH and about 15 km south-southwest of the DMV crest at a depth of about 14 km. The rupture is estimated in an elliptical patch with a major–minor axis of 5 km–3.6 km. It evolves mostly along strike to the northwest and in an up-dip direction with a sub-shear speed of 2.75 km/s for 2.8 s. The estimated geometry is ∼WNW (292°) strike and ∼60° dip to the north. When applying an extended rupture model, the obtained scalar seismic moment drops from 4.8 e+16 Nm to 4.04 e+16 Nm, indicating that some of the scalar seismic moment was released at relatively lower frequencies between 0.03 Hz and 0.08 Hz.
The estimated stress drop of 2.6 bar is much smaller than the Ide and Beroza (2001) empirical relationship between scalar moment and stress drop, which propose a stress drop of about 10 bars for an M5.1 earthquake. However, the low stress drop is consistent with the observed large rupture duration for the mainshock. We stress that the obtained rupture length (estimated between 7 km and 9 km) is considerable for an earthquake of this magnitude (for example, Momeni et al., 2019 estimated a rupture length of 12 km for a Mw 6.5 earthquake; Vicic et al., 2020 estimated a rupture length of ∼4 km for an Mw 5.1 earthquake).
The mainshock exhibits a left-lateral strike-slip mechanism (Rake=14°), which is similar to the general MSH mechanism proposed by Tatar et al. (2012), a geodetic study by Djamour et al. (2010), and geological and paleoseismological studies by Nazari et al. (2009) and Solaymani et al. (2011) among others. The maximum slip between depths of 12 km and 11 km is calculated about 3 cm. The rupture stopped at a depth of 8 km.
The mainshock rupture and the initial aftershocks on the MSH occurred between the two peaks of cumulative scalar seismic moment, suggesting that this part of the fault was locked in comparison to two other nearby neighbors that were affected by the earthquakes in 1930 and 1955.
The aftershock distribution was up-dip and westward, in line with the direction of the main rupture and the MSH’s overall orientation. The largest aftershock, with M4.1, took place 20 days after the mainshock and had the same left-lateral strike-slip mechanism. Aftershocks surrounding the mainshock slipped area (Figures 4A,5), is a consistent feature of large earthquakes (see Henry and Das, 2002; Hamzeloo et al., 2007).
Past studies refer to the possibility of a hot, young, sill-like DMV magma chamber southwest of its present crater (i.e., Mostafanejad et al., 2011; Shomali and Shirzad, 2014; Yazdanparast and Vosooghi, 2014; Eskandari et al., 2018). In the former magma chamber of Damavand, which is perceived as a cooled, a high-velocity dike-like structure is detected at the north-northeast of the crater (Mostafanejad et al., 2011).
We note that the hydrothermal zones highlighted by Eskandari et al. (2018) are close to the western peak of cumulative scalar seismic moment release on MSH (Figure 5C). According to a tomography study by Mostafanejad et al. (2011), a low-velocity zone has been proposed in the same region south-southwest of the DMV and extending until the MSH down to a depth of 15 km (Supplementary Figure S1A). The region’s hydrothermal activity has likely been caused by the presence of many branches of the DMV magma chambers, as was also suggested by Eskandari et al. (2018).
Occurrence of the 1930 (Ms 5.2), 1955 (Mb 4.0), 1983 (Mw 5.3), and 2020 (Mw 5.1) earthquakes in the south-southwest of the DMV, together with its seismic activity from 2006, suggest a strong relationship between the volcanic activity of DMV and relatively high seismicity rate of the central MSH. Most of the microseismic activity and larger microearthquakes are also reported by Tatar et al. (2012) on the central MSH, south of DMV between longitudes from 51.75 E to 52.2 E, whereas their seismic network was well-distributed on the two other segments of MSH.
High seismicity on the central MSH may have been caused by the young magma chamber of the DMV, which is still active, increasing the pore pressure on the MSH, reducing the effective normal stress on the left-lateral strike-slip fault, and facilitating rupture nucleation and expansion (Figure 8). Most commonly for strike-slip and normal faulting mechanisms, such phenomena have been widely observed and described (i.e., Saar and Magna, 2003; Goebel et al., 2017; Scuderi et al., 2017; Johann et al., 2018; Eaton and Schultz, 2018; Benson et al., 2020). On the other hand, such a mechanism might prevent a substantial buildup of strain on this segment of the MSH close to the DMV (i.e., Yagi et al., 2016).
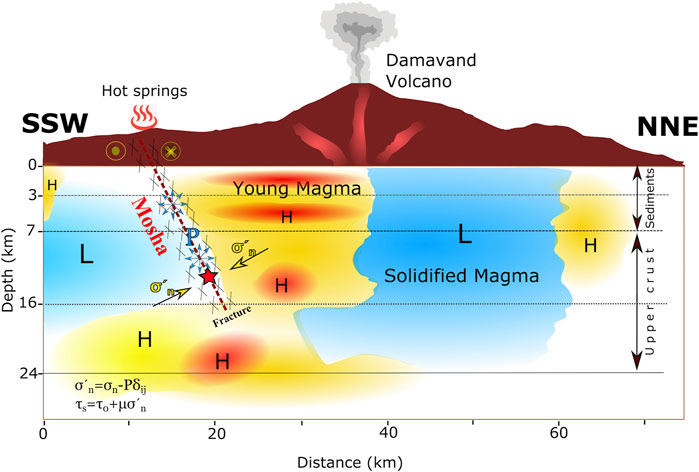
FIGURE 8. Schematic plot illustrating the relation between MSH and DMV. Red and blue represent the hot and cool rocks, respectively (after Mostafanejad et al., 2011; Shomali and Shirzad, 2014; Yazdanparast and Vosooghi, 2014; Vajedian et al., 2015; Eskandari et al., 2018). Star is the 7 May 2020 M5.1 mainshock hypocenter. H and L represent high and low temperature areas, respectively. The dashed line is the MSH. Horizontal thin dashed lines are crustal velocity layers from Tatar et al. (2012).
The west-northwestward directivity of the 2020 mainshock is revealed from the PGA distribution and our obtained source model (Figure 4A). The damped PGA in central Tehran is believed to be due to attenuation caused by the deepest portion of the sedimentary basin (see Majidnejad et al., 2017). However, the 2020 mainshock contained low-frequency energies (Fc= 0.7 Hz) that could reach Tehran with negligible damping. The estimated Brune model for the mainshock (Brune, 1970) matches the observed Fourier spectra in the Tehran region (Figures 6, 7). The Fmax shows a relatively large variation between 6 Hz and 16 Hz in the Tehran region (Konno et al., 1998; Figures 6, 7, Supplementary Figures S12, S13). That is possibly due to the site amplification/attenuation (i.e., scattering and dissipation) (see Hanks, 1982; Gomberg et al., 2012).
The smooth geometry of the central MSH may facilitate the rupture expansion on it. The 2020 seismic activity occurred at a depth range between 15 km and 8 km, where Tatar et al. (2012) also detected most of the microearthquakes. This range closely matches the upper-crystalline layer of the velocity model for the area proposed by Abbassi and Farbod., (2009). This relatively thick and deep part of the seismogenic layer may have the capacity to produce large earthquakes with low-frequency contents that can reach Tehran with less damped seismic energy and impact the tall buildings, similar to the 7 May 2020 M5.1 mainshock.
The 2020 M5.1 earthquake is the largest well-recorded event on the central MSH after the 1983 earthquake. This segment of the MSH has experienced the 1830 IX 7.1 historical earthquake. All of the mentioned evidences propose that the 2020 mainshock and recent seismicity of the central MSH are related to the existence/activity of the magma chamber of DMV. We also stress that 1930, 1955, and 1983 earthquakes in the south of DMV might have happened due to the unclamping mechanism because of the existing high pore pressure.
The western segment of Mosha, which is closer to Tehran city, is silent compared to the central segment. GPS studies, however, reveal its slower rate of deformation (1 mm/yr; Djamour et al., 2010). The occurrence of earthquakes like the 2012 Ahar-Varzaghan doublet (Mw 6.5 and Mw 6.3), which had almost no seismic activity detected in the IRSC network before the mainshock and a low deformation rate (i.e., Momeni et al., 2019), emphasizes the necessity of a detailed seismic-geodetic study on the western segment of MSH that will affect the seismic hazard of that region, especially Tehran city. In addition, the eastern MSH exhibits seismic activity, highlighting its potential as another MSH component that could experience future large earthquakes.
We infer that the central segment of the MSH situated in the south-southwest of DMV has a high seismicity. Numerous evidences suggest a connection between this high seismicity and the impact of the existing young sill-like magma chamber of DMV in that area. The eastern segment of MSH shows relatively lower seismic activity and the western one is almost silent. We suggest that the heat transferred by the magma chamber to the fractured area of the MSH may increase pore pressure which in turn lowers the effective normal stress on the central MSH and triggers the rupture nucleation-expansion. The two peaks of cumulative scalar seismic moment release are observed on both sides of the 7 May 2020 Mw 5.1 mainshock, suggesting its partial locking. However, the fact that this section of MSH has experienced numerous minor to moderate-sized earthquakes implies the uneven distribution of stress on it. This indicates that the seismicity of the central MSH close to DMV may be influenced by both the uneven distribution of fault plane strength and increased pore pressure as a result of temperature.
The rupture model obtained for the mainshock and the PGA distribution of strong motions in the near-field and Tehran suggest the mainshock’s directivity toward the west (Tehran). The corner frequency is estimated at 0.7 Hz, consistent with the Brune (1970) model. In parallel, negligible attenuation of low-frequency signals (< 1 Hz) (related to the source rupture) is observed in the Tehran region (see Figures 6, 7). A large variation of Fmax (between 6 Hz and 16 Hz) and Amax (between 2 Hz and 17 Hz) in Tehran is possibly due to the site amplification/attenuation caused by the sedimentary basin beneath Tehran. The obtained Fmax is close to the average value of 10 Hz reported for Tehran in a study by Haghshenas and Bard, (2007). The Amax inside Tehran show relatively similar frequencies for Amax between 2 Hz and 6 Hz (Figure 4C, Supplementary Table S7).
In terms of rupture dynamics, DMV may work as a fuse and nucleate earthquakes on the MSH, for which if the rupture grows toward the west, it will cause a strong directivity effect for that earthquake toward Tehran megacity, similar to the 7 May 2020 Mw 5.1 earthquake (Figures 4B,C). Considering that there is essentially no seismic activity in the western segment of the MSH, which is the closest section to the city of Tehran, it may be entirely locked; nonetheless, GPS measurements indicate that its deformation rate is 1 mm/yr, and a locking depth of 16 km is suggested. This segment has not ruptured since the 958 AD M∼7.7 Taleghan–Mosha historical earthquake.
The original contributions presented in the study are included in the article/Supplementary Material; further inquiries can be directed to the corresponding author.
SM and RM contributed in conception and design of the study. SM conducted the calculations, plot the figures, and wrote the first draft of manuscript. RM contributed in revision of manuscript.
Open access funding provided by École Polytechnique Fédérale de Lausanne.
We thank Hamid Nazari, Simone Cesca, and Alberto Armigliato for their constructive comments that improved the manuscript. We thank IIEES, IRSC, and ISMN networks for providing the seismic and strong motion data. Figures plotted using Generic Mapping Tools (GMT) (http://gmt.soest.hawaii.edu/), personal codes in the MATLAB environment (https://www.mathworks.com) and Paraview software (https://www.paraview.org).
The authors declare that the research was conducted in the absence of any commercial or financial relationships that could be construed as a potential conflict of interest.
All claims expressed in this article are solely those of the authors and do not necessarily represent those of their affiliated organizations, or those of the publisher, the editors, and the reviewers. Any product that may be evaluated in this article, or claim that may be made by its manufacturer, is not guaranteed or endorsed by the publisher.
The Supplementary Material for this article can be found online at: https://www.frontiersin.org/articles/10.3389/feart.2022.945297/full#supplementary-material
Abbassi, M. R., and Farbod, Y. (2009). Faulting and folding in quaternary deposits of Tehran’s piedmont (Iran). J. Asian Earth Sci. 34, 522–531. doi:10.1016/j.jseaes.2008.08.001
Allen, M. B., Ghassemi, M. R., Sharabi, M., and Qoraishi, M. (2003). Accommodation of late cenozoic oblique shortening in the Alborz Range, northern Iran. J. Struct. Geol. 25, 659–672. doi:10.1016/S0191-8141(02)00064-0
Allen, M., Jackson, J., and Walker, R. (2004). Late Cenozoic reorganization of the Arabia-Eurasia collision and the comparison of short-term and long-term deformation rates. Tectonics 23, TC2008. doi:10.1029/2003TC001530
Ambraseys, N. N., and Melville, C. P. (1982). A history of Persian earthquakes. Cambridge, United Kingdom: Cambridge Univ. Press.
Asserto, R., and Milano, S. G. (1966). Geological map of upper Djadjurd and Lars valley. central Alborz, Iran: Inst. Geol. Univ., 232. Spec. Pub.
Bachmanov, D. M., Trifonov, V. G., Hessami, K. T., Kozhurin, A. I., Ivanova, T. P., Rogozhin, E. A., et al. (2004). Active faults in the Zagros and central Iran. Tectonophysics 380, 221–241. doi:10.1016/j.tecto.2003.09.021
Ballato, P., Nowaczyk, N. R., Landgraf, A., Strecker, M. R., Friedrich, A., and Tabatabaei, S. H. (2008). Tectonic control on sedimentary facies pattern and sediment accumulation rates in the Miocene foreland basin of the southern Alborz mountains, northern Iran. Tectonics 27, TC6001. doi:10.1029/2008TC002278
Ballato, P., Uba, C. E., Landgraf, A., Strecker, M. R., Sudo, M., Stockli, D. F., et al. (2011). Arabia–eurasia continental collision: Insights from late tertiary foreland-basin evolution in the Alborz mountains, northern Iran. Geol. Soc. Am. Bull. 123, 106–131. doi:10.1130/B30091.1
Benson, P. M., Austria, D. C., Gehne, S., Butcher, E., Harnett, C. E., Fazio, M., et al. (2020). Laboratory simulations of fluid-induced seismicity, hydraulic fracture, and fluid flow. Geomechanics Energy Environ. 24, 100169. doi:10.1016/j.gete.2019.100169
Berberian, M., Ghorashi, M., Arjangravesh, B., and Mohajer-Ashjaie, A. (1993). Seismotectonic and earthquake-fault hazard investigations in the great Ghazvin Region. Tehran, Iran: Geological Survey of Iran, 84. Report no. 57.
Berberian, M., and King, G. C. P. (1981). Towards a paleogeography and tectonic evolution of Iran. Can. J. Earth Sci. 18, 210–265. doi:10.1139/e81-019
Berberian, M. (1994). Natural hazards and the first earthquake catalog of Iran, 1. Iran: I.I.E.E.S. Historical hazards in Iran prior 1900 report.
Berberian, M. (1997). “Seismic sources of the Transcaucasian historical earthquakes,” in Historical and prehistorical earthquakes in the caucasus. Editors S. Giardini, and S. Balassanian (Dordrecht, Netherlands: Kluwer Academic Publishing), 233–311. doi:10.1007/978-94-011-5464-2_13
Berberian, M., and Yeats, R. S. (1999). Patterns of historical earthquake rupture in the Iranian Plateau. Bull. Seismol. Soc. Am. 89, 120–139. doi:10.1785/BSSA0890010120
Bouchon, M. (2003). A review of the discrete wavenumber method. Pure Appl. Geophys. 160, 445–465. doi:10.1007/pl00012545
Brune, J. N. (1970). Tectonic stress and the spectra of seismic shear waves from earthquakes. J. Geophys. Res. 75 (26), 4997–5009. doi:10.1029/JB075i026p04997
Cotton, F., and Coutant, O. (1997). Dynamic stress variations due to shear faults in a plane-layered medium. Geophys. J. Int. 128, 676–688. doi:10.1111/j.1365-246X.1997.tb05328.x
Davidson, J., Hassanzadeh, J., Berzins, R., Stockli, D. F., Bashukooh, B., Turrin, B., et al. (2004). The geology of Damavand volcano, Alborz Mountains, northern Iran. Geol. Soc. Am. Bull. 116 (1-2), 16–29. doi:10.1130/B25344.1
Djamour, Y., Vernant, P., Bayer, R., Nankali, H. R., Ritz, J. F., Hinderer, J., et al. (2010). GPS and gravity constraints on continental deformation in the Alborz mountain range, Iran. Geophys. J. Int. 181, 1287–1301. doi:10.1111/j.1365-246X.2010.04811.x
Eaton, D. W., and Schultz, R. (2018). Increased likelihood of induced seismicity in highly overpressured shale formations. Geophys. J. Int. 214 (1), 751–757. doi:10.1093/gji/ggy167
Engdahl, E. R., Jackson, J. A., Myers, S. C., Bergman, E. A., and Priestley, K. (2006). Relocation and assessment of seismicity in the Iran region. Geophys. J. Int. 167, 761–778. doi:10.1111/j.1365-246X.2006.03127.x
Eskandari, A., Amini, S., De Rosa, R., and Donato, P. (2018). Nature of the magma storage system beneath the damavand volcano (N. Iran). Integr. study 300–301 (17), 154–176. doi:10.1016/j.lithos.2017.12.002
Goebel, T. H. W., Weingarten, M., Chen, X., Haffener, J., and Brodesky, E. E. (2017). The 2016 Mw5.1 Fairview, Oklahoma earthquakes: Evidence for long-range poroelastic triggering at >40 km from fluid disposal wells. Earth Planet. Sci. Lett. 472, 50–61. doi:10.1016/j.epsl.2017.05.011
Gomberg, J., Creager, K., Sweet, J., Vidale, J., Ghosh, A., and Hotovec, A. (2012). Earthquake spectra and near-source attenuation in the Cascadia subduction zone. J. Geophys. Res. 117, B05312. doi:10.1029/2011JB009055
Guest, B., Axen, G. J., Lam, P. S., and Hassanzadeh, J. (2006a). Late Cenozoic shortening in the west-central Alborz Mountains, northern Iran, by combined conjugate strike-slip and thin-skinned deformation. Geosphere 2, 35–52. doi:10.1130/GES00019.1
Guest, B., Stockli, D. F., Grove, M., Axen, G. J., Lam, P. S., and Hassanzadeh, J. (2006b). Thermal histories from the central Alborz mountains, northern Iran: Implications for the spatial and temporal distribution of deformation in northern Iran. Geol. Soc. Am. Bull. 118, 1507–1521. doi:10.1130/B25819.1
Haghshenas, E., and Bard, P. Y. (2007). Strong motion simulation in tehran using empirical green function method. J. Seismol. Earthq. Eengineering 9 (3), 137
Hamzeloo, H., Vaccari, F., and Panza, G. F. (2007). Towards a reliable seismic microzonation in Tehran, Iran. Eng. Geol. 93, 1–16. doi:10.1016/j.enggeo.2007.05.001
Henry, C., and Das, S. (2002). TheMw8.2, 17 February 1996 Biak, Indonesia, earthquake: Rupture history, aftershocks, and fault plane properties. J. Geophys. Res. 107, ESE 11-1–ESE 11-16. doi:10.1029/2001JB000796
Hollingsworth, J., Jackson, J., Walker, R., and Nazari, H. (2008). Extrusion tectonics and subduction in the eastern South Caspian region since 10 Ma. Geol. 36, 763–766. doi:10.1130/g25008a.1
Ide, S., and Beroza, G. C. (2001). Does apparent stress vary with earthquake size? Geophys. Res. Lett. 28 (17), 3349–3352. doi:10.1029/2001gl013106
Johann, L., Shapiro, S. A., and Dinske, C. (2018). The surge of earthquakes in central oklahoma has features of reservoir-induced seismicity. Sci. Rep. 8, 11505. doi:10.1038/s41598-018-29883-9
Kamranzad, F., Memarian, H., and Zare, M. (2020). Earthquake risk assessment for Tehran, Iran. ISPRS Int. J. Geoinf. 9, 430. doi:10.3390/ijgi9070430
Khorrami, F., Vernant, P., Masson, F., Nilfouroushan, F., Mousavi, Z., Nankali, H., et al. (2019). An up-to-date crustal deformation map of Iran using integrated campaign-mode and permanent GPS velocities. Geophys. J. Int. 217 (2), 832–843. doi:10.1093/gji/ggz045
Konno, K., and Ohmachi, T. (1998). Ground-motion characteristics estimated from spectral ratio between horizontal and vertical components of microtremor. Bull. Seismol. Soc. Am. 88, 228–241. doi:10.1785/bssa0880010228
Lienert, B. R., and Havskov, J. (1995). A computer program for locating earthquakes both locally and globally. Seismol. Res. Lett. 66, 26–36. doi:10.1785/gssrl.66.5.26
Majidnejad, A., Zafarani, H., and Vahdani, S. (2017). Dynamic simulation of ground motions from scenario earthquakes on the North Tehran Fault. Geophys. J. Int. 209, 434–452. doi:10.1093/gji/ggx017
Momeni, S. M., Aoudia, A., Tatar, M., Twardzik, C., and Madariaga, R. (2019). Kinematics of the 2012 ahar–varzaghan complex earthquake doublet (Mw6.5 and Mw6.3). Geophys. J. Int. 217, 2097–2124. doi:10.1093/gji/ggz100
Momeni, S. M. (2012). Seismicity and seismotectonic of the garmsar region. Master thesis in Persian. Tehran: International Institute of Earthquake Engineering and Seismology, 132.
Momeni, S. M., and Tatar, M. (2018). Mainshocks/aftershocks study of the August 2012 earthquake doublet on Ahar-Varzaghan complex fault system (NW Iran). Phys. Earth Planet. Interiors 283, 67–81. doi:10.1016/j.pepi.2018.08.001
Mostafanejad, A., Shomali, Z. H., and Mottaghi, A. A. (2011). 3-D velocity structure of damavand volcano, Iran, from local earthquake tomography. J. Asian Earth Sci. 42, 1091–1096. doi:10.1016/j.jseaes.2011.03.011
Nazari, H., Ritz, J-F., Walker, R., Salamati, R., Rizza, M., Patnaik, R., et al. (2014). Palaeoseismic evidence for a medieval earthquake, and preliminary estimate of late Pleistocene slip-rate, on the Firouzkuh strike-slip fault in the Central Alborz region of Iran. J. Asian Earth Sci. 82, 124–135. doi:10.1016/j.jseaes.2013.12.018
Nazari, H., Ritz, J.-F., Shafei, A., Ghassemi, A., Salamati, R., Michelot, J.-L., et al. (2009). Morphological and palaeoseismological analysis along the Taleghan fault (central Alborz, Iran). Geophys. J. Int. 178, 1028–1041. doi:10.1111/j1365-246x.2009.04173.x
Nazari, H., Ritz, J.‐F., Salamati, R., Shahidi, A., Habibi, H., Ghorashi, M., et al. (2010). Distinguishing between fault scarps and shorelines: The question of the nature of the Kahrizak, north rey and south rey features in the tehran plain (Iran). Terra nova. 22, 227–237. doi:10.1111/j.1365-3121.2010.00938.x
Ritz, J.-F., Nazari, H., Ghassemi, A., Salamati, R., Vernant, P., Shafei, A., et al. (2006). Active transtension inside central Alborz: A new insight into northern Iran–southern caspian geodynamics. Geol. 34, 477–480. doi:10.1130/G22319.1
Ritz, J. F., Nazari, H., Balescu, S., Lamothe, M., Salamati, R., Ghassemi, A., et al. (2012). Paleoearthquakes of the past 30, 000 years along the north Tehran fault (Iran). J. Geophys. Res. 117, B06305. doi:10.1029/2012jb009147
Ruiz, S., Ammirati, J. B., Leyton, F., Cabrera, L., Potin, B., and Madariaga, R. (2019). The january 2019 (Mw 6.7) coquimbo earthquake: Insights from a seismic sequence within the nazca plate. Seismol. Res. Lett. 90 (5), 1836–1843. doi:10.1785/0220190079
Ruiz, S., and Madariaga, R. (2013). Kinematic and dynamic inversion of the 2008 northern Iwate earthquake. Bull. Seismol. Soc. Am. 103 (2), 694–708. doi:10.1785/0120120056
Saar, M. O., and Manga, M. (2003). Seismicity induced by seasonal groundwater recharge at Mt. Hood, Oregon. Earth Planet. Sci. Lett. 214, 605–618. doi:10.1016/S0012-821X(03)00418-7
Sambridge, M. (1999). Geophysical inversion with a neighbourhood algorithm—I. Searching a parameter space. Geophys. J. Int. 138, 479–494. doi:10.1046/j.1365-246X.1999.00876.x
Schmedes, J., Archuleta, R. J., and Lavallee, D. (2010). Correlation of earthquake source parameters inferred from dynamic rupture simulations. J. Geophys. Res. 115, B03304. doi:10.1029/2009JB006689
Scuderi, M. M., Collettini, C., and Marone, C. (2017). Frictional stability and earthquake triggering during fluid pressure stimulation of an experimental fault. Earth Planet. Sci. Lett. 477, 84–96. doi:10.1016/j.epsl.2017.08.009
Shomali, Z. H., and Shirzad, T. (2014). Crustal structure of Damavand volcano, Iran, from ambient noise and earthquake tomography. J. Seismol. 19, 191–200. doi:10.1007/s10950-014-9458-8
Sokos, E., and Zahradník, J. (2008). ISOLA a Fortran code and a Matlab GUI to perform multiple-point source inversion of seismic data. Comput. Geosci. 34, 967–977. doi:10.1016/j.cageo.2007.07.005
Solaymani, S., Ritz, J.-F., and Abbassi, M. (2011). Analyzing the junction between the mosha and the north tehran active faults. Tectonophysics 497, 1
Stocklin, J. (1974). “Possible ancient continental margin in Iran,” in Geology of continental margins. Editors C. Burke, and C. Drake (New York: Springer-Verlag), 873–877. doi:10.1007/978-3-662-01141-6_64
Talebian, M., Copley, A., Fattahi, M., Ghorashi, M., Jackson, J., Nazari, H., et al. (2016). Active faulting within a megacity: The geometry and slip rate of the pardisan thrust in central tehran, Iran. Geophys. J. Int. 207 (3), 1688–1699. doi:10.1093/gji/ggw347
Tatar, M., Hatzfeld, D., Abbassi, A., and YaminiFard, F. (2012). Microseismicity and seismotectonics around the mosha fault (central Alborz, Iran). Tectonophysics 544–545, 50–59. doi:10.1016/j.tecto.2012.03.033
Tchalenko, J. S., Berberian, M., Iranmanesh, H., Bailly, M., and Arsovsky, M. (1974). Seismotectonic framework of the north Tehran fault. Tectonophysics 29, 411–420. doi:10.1016/0040-1951(75)90169-9
Twardzik, C., Madariaga, R., Das, S., and Custodio, S. (2012). Robust features of the source process for the 2004 Parkfield, California, earthquake from strong-motion seismograms. Geophys. J. Int. 191, 1245–1254. doi:10.1111/j.1365-246X.2012.05653.x
Vajedian, S., Motagh, M., and Nilfouroushan, F. (2015). StaMPS improvement for deformation analysis in mountainous regions: Implications for the damavand volcano and mosha fault in alborz. Remote Sens. 7, 8323–8347. doi:10.3390/rs70708323
Vernant, P., Nilforoushan, F., Hatzfeld, D., Abassi, M. R., Vigny, C., Masson, F., et al. (2004). Present-day crustal deformation and plate kinematics in the middle east constrained by GPS measurements in Iran and northern Oman. Geophys. J. Int. 157, 381–398. doi:10.1111/j.1365-246X.2004.02222.x
Yagi, Y., Okuwaki, R., Enescu, B., Kasahara, A., Miyakawa, A., and Otsubo, M. (2016). Rupture process of the 2016 kumamoto earthquake in relation to the thermal structure around Aso volcano. Earth Planets Space 68, 118. doi:10.1186/s40623-016-0492-3
Yazdanparast, M., and Vosooghi, B. (2014). A research on damavand magma source model using GPS data. Geomatics, Nat. Hazards Risk 5 (1), 26–40. doi:10.1080/19475705.2013.772543
Keywords: triggered seismicity, earthquake source observations, earthquake hazards, volcano seismology, waveform inversion, permeability and porosity
Citation: Momeni S and Madariaga R (2022) Long-term triggered seismicity on the Mosha fault by Damavand volcano, Iran: Implications on the seismic hazard of Tehran metropolis. Front. Earth Sci. 10:945297. doi: 10.3389/feart.2022.945297
Received: 16 May 2022; Accepted: 23 August 2022;
Published: 14 September 2022.
Edited by:
Luigi Passarelli, Istituto Nazionale di Geofisica e Vulcanologia, ItalyReviewed by:
Alberto Armigliato, Alma Mater Studiorum—Università di Bologna, ItalyCopyright © 2022 Momeni and Madariaga. This is an open-access article distributed under the terms of the Creative Commons Attribution License (CC BY). The use, distribution or reproduction in other forums is permitted, provided the original author(s) and the copyright owner(s) are credited and that the original publication in this journal is cited, in accordance with accepted academic practice. No use, distribution or reproduction is permitted which does not comply with these terms.
*Correspondence: Seyyedmaalek Momeni, c2V5eWVkbWFhbGVrLm1vbWVuaUBlcGZsLmNo
Disclaimer: All claims expressed in this article are solely those of the authors and do not necessarily represent those of their affiliated organizations, or those of the publisher, the editors and the reviewers. Any product that may be evaluated in this article or claim that may be made by its manufacturer is not guaranteed or endorsed by the publisher.
Research integrity at Frontiers
Learn more about the work of our research integrity team to safeguard the quality of each article we publish.