 Enran Liu
 Chenglin Liu
 Dishi Shi3
- 1State Key Laboratory of Petroleum Resources and Prospecting, China University of Petroleum, Beijing, China
- 2College of Geosciences, China University of Petroleum, Beijing, China
- 3Oil and Gas Survey, China Geological Survey, Beijing, China
The Shanxi Formation layers in the northeast of the Zhoukou Depression, Southern North China Basin, mainly consist of dark mudstone interbed with tight stone and widely developed coal seam, which is a promising target for unconventional oil and gas exploration. A series of geochemical and geological methods were used to analyze the characterization and controls of the pores structural heterogeneity in low-thermal-maturity shale. These methods include the Rock-Eval analysis, total organic carbon (TOC) analysis, scanning electron microscope observation with an energy-dispersive spectrometer (SEM-EDS), X-ray diffraction, and low-pressure N2 adsorption. Based on these measurements, the pore diameter, specific surface area (SSA), and fractal dimension (D) were calculated, and then, the pore structure heterogeneity was analyzed. The result shows the pores of Shanxi Formation shale are mainly interparticle pores with low porosity and low permeability, and the pore structure is highly complex. The average fractal dimension of the micropore and the macropore are both 2.77, but that of the mesopore is 2.65, indicating a less-complex mesopore structure than the micropore and macropore. The S2, S1, and TOC exhibit no clear correlation with SSA and fractal dimension of pores, which proved the little impact of organic matter on the heterogeneity of pore structure in the low-maturity shale of the research area. The illite has a strong effect on the pore structural heterogeneity of Shanxi Formation shale. The samples with high content of illite show higher SSA, better physical properties, and low fractal dimension, reflecting low pore structural heterogeneity. However, the quartz and clay minerals show a slight correlation with SSA and no obvious relationship with the fractal dimension, indicating a little effect of them on the pore structure heterogeneity. The pore structural heterogeneity decreases along with the increase in porosity, while the permeability influenced by a variety of reasons under the compaction shows a poor relationship with SSA and fractal dimension. On the whole, the pore structural heterogeneity decreases for low-thermal-maturity shale with high content of illite and high porosity, which should be considered to be the better unconventional oil and gas reservoir in the research area.
1 Introduction
The usage of new technologies, including horizontal hydraulic fracturing, micro-seismic monitoring, and multi-well industrial exploitation, caused a shale gas revolution all over the world (Jarvie et al., 2007; He et al., 2018; Liu et al., 2019a; Liu et al., 2019b). Shale is a kind of fine-grained sedimentary rock composed of debris particles with diameters smaller than 0.0625 mm. In recent years, shale gas has drawn significant attention and has been proved to be stored in three different states in the geological environment: free gas in pores and natural fractures, adsorbed gas in organic matter and clay minerals, and dissolved gas in residual oil and water (Zhang et al., 2012; Tian et al., 2016; Zhou et al., 2019; Liu et al., 2021). Adsorption is one of the important mechanisms for shale gas occurrence, and the adsorption capacity of shale was used to accurately evaluate the adsorbed gas content in shale reservoirs (Rani et al., 2015; Zhou et al., 2018; Li et al., 2019).
Compared with the conventional reservoirs, the shale and tight sandstone have developed a micro-nano pore throat system, which shows large pore size span, low porosity and permeability, and strong heterogeneity in pore structure (Curtis, 2002; Zhang et al., 2012; Tan et al., 2014; Chen et al., 2019a; Chen et al., 2019b). The research on pore structure of shale reservoir has developed from qualitative description to quantitative characterization. The pore model, as an important aspect of unconventional reservoir pore structure characterization, has developed from no mineral attribute to mineral attribute, and improving the accuracy of reservoir characterization (Kennedy et al., 2002; Ji et al., 2016; Jiang et al., 2016; Gao et al., 2018; Wu et al., 2020a; Chen et al., 2021). In recent years, a series of technologies, including high-pressure mercury injection, low-temperature nitrogen and carbon dioxide adsorption, field emission scanning electron microscope, atomic force microscope, nuclear magnetic resonance, small-angle neutron scattering, and high-resolution CT scanning, improved the measurement accuracy of pore size from micron to nanoscale. Moreover, the comprehensive use of various methods increases the characterization accuracy of unconventional reservoirs (Wu et al., 2019a; Wu et al., 2019b; Wu et al., 2019c; Wu et al., 2020b; Wu et al., 2020c; Wu et al., 2020d; Zeng et al., 2022). At the same time, considering the high complexity of shale and tight sandstone samples, Euclidean geometry cannot give accurate description and characterization. Fractal dimension (D), as an important parameter used to analyze complex rock pore networks, was used to represent the pore structural heterogeneity in detail and quantificationally express the degree of complexity of the pore system (Zeng et al., 2021; Zhang et al., 2021). The fractal dimension is frequently calculated from nitrogen adsorption data according to the fractal Frenkel−Halsey−Hill (FHH) method (Yao et al., 2012).
Previous researchers mainly focused on the tectonic evolution characteristics, sedimentary facies and depositional model, reservoir and hydrocarbon of the whole sediment unit in the Zhoukou Depression from the Carboniferous to Permian or upper Palaeozoic periods (Quan et al., 2002; Sun et al., 2004; Zhai et al., 2005; Hu et al., 2006; Liu et al., 2008a; Liu et al., 2008b; Kuang et al., 2009; Li and Yao, 2011; Cao et al., 2013; Li and Ma, 2013; Zhao et al., 2017; Zhao et al., 2019; Li et al., 2020). The formation sequence of the research area has not yet been identified and classified in detail, and the microcosmic study in the reservoir needs to be quantified further. Moreover, the pore structure complexity needs more detailed characterization to meet the demand of exploration. The main purpose of this research is to investigate the pore structural heterogeneity of low-thermal-maturity shale reservoirs from the viewpoint of fractal characteristics. The relationships between organic matter, mineral content, pore structure parameters, and fractal dimension were then characterized to find out the controls on the pore structural heterogeneity.
2 Regional Geological Characteristics
The Southern North China Basin is located in the southeast of the North China Plate (platform) and consists of six second-order tectonic units, namely, the Kaifeng Depression, Taikang Uplift, Huaibei Uplift, Zhoukou Depression, Changshan Uplift, and Xinyang-Hefei Depression from, north to south (Figure 1). This basin is formed by multiple superimpositions of basin prototypes on the nearly EW-trending basement structure as many Mesozoic-Cenozoic depressions have developed. It extends in nearly EW direction and parallel to the Qinling-Dabie Orogenic Belt (Li et al., 1996).
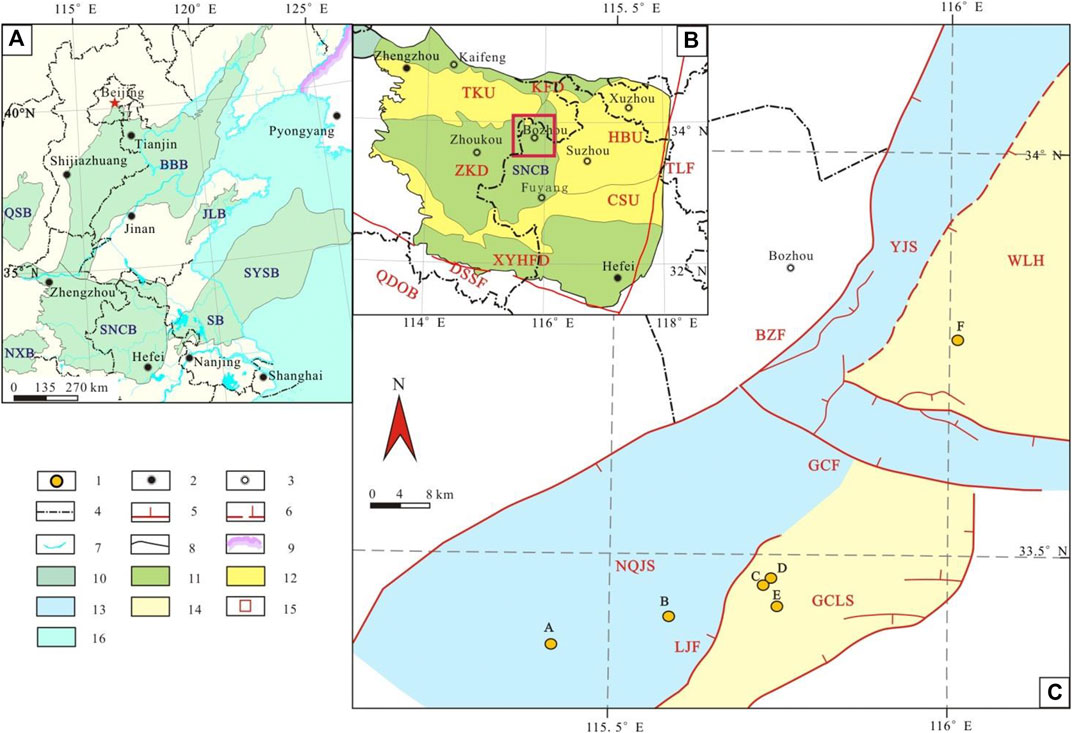
FIGURE 1. Geological structure outline map of the northeastern part of the Zhoukou Depression. BBB, Bohai Bay Basin; BZF, Bozhou Fault; CSU, Changshan Uplift; DSSF, Danfeng-Shangnan-Shangcheng Fault; GCF, Gucheng Fault; GCLS, Gucheng lower high; HBU, Huaibei Uplift; JLB, Jiaolai Basin; KFD, Kaifeng Depression; LJF, Luoji Fault; NQJS, Niqiuji Sag; NXB, Nanxiang Basin; QDOB, Qinling-Dabie Orogenic Belt; QSB, Qinshui Basin; SB, Subei Basin; SNCB, South North China Basin; SYSB, South Yellow Sea Basin; TLF, Tan-Lu Fault; WLH, Wanglou High; XYHFD, Xinyang-Hefei Depression; YJS, Yanji Sag; ZKD, Zhoukou Depression. 1. Well location; 2. Provincial city; 3. Prefecture-level city; 4. Provincial boundary; 5. Normal fault; 6. Reverse fault; 7. Coastline, river, or lake; 8. Basin boundary; 9. National boundary; 10. Basin; 11. Depression; 12. Uplift; 13. Sag; 14. High; 15. The study area; 16. Sea. (A) Geological structure outline map of Southern North China Basin (SNCB); (B) Geological structure outline map of Zhoukou Depression (ZKD); (C) Geological structure outline map of research filed.
The Zhoukou Depression, an area of about 32,600 km2, is located in the central part of the Southern North China Basin (Li et al., 1996). Administratively, the study area is located in the northwestern part of Anhui Province and under the jurisdiction of Fuyang City, Anhui Province. Tectonically, it lies in the northeastern part of the Zhoukou Depression and is surrounded by the Taikang Uplift in the north, the Huaibei Uplift (located in the west of the Tanlu fault zone) in the east, and faces the Qinling-Dabie orogenic belt in the south. It is a Mesozoic-Cenozoic fault basin formed on a stable platform in North China, and can be divided into the northern zone and the southern zone by the Gucheng Fault. The northern zone can be then divided into Yanji sag and Wanglou uplift by a nearly NE-SW-trending reverse fault, and the southern zone can be divided into Niqiuji sag and Gucheng lower uplift by a nearly NE-SW-trending normal fault (Luoji fault) (Figure 1) (Liu et al., 2020).
In the research area, a total of 21 Wells were drilled, of which 5 wells showed a complete Upper Paleozoic strata, and 12 wells got oil and gas showings in the Cenozoic, Mesozoic and Paleozoic strata, revealing great oil and gas exploration potential. On the basis of analyzing the drilling, logging, and seismic data, it is concluded that the Shanxi Formation in the research area is a promising target exploration strata for unconventional oil and gas in Southern North China Basin. The Shanxi Formation was deposited in the early Permian, and is divided into 3 third-order sequences (SQs1, SQs2, and SQs3) from bottom to top according to sedimentary cycles caused by sea-level eustacy. The Shanxi Formation mainly consists of dark mudstone interbed with tight sandstone, and widely developed coal seam (up to 0–15 m). Shale and tight sandstone layers in the Shanxi Formation, representing the major source rock and reservoir in this research filed, are mainly developed in the SQs2 and SQs3 third-order sequences (Figure 2) (Liu et al., 2020).
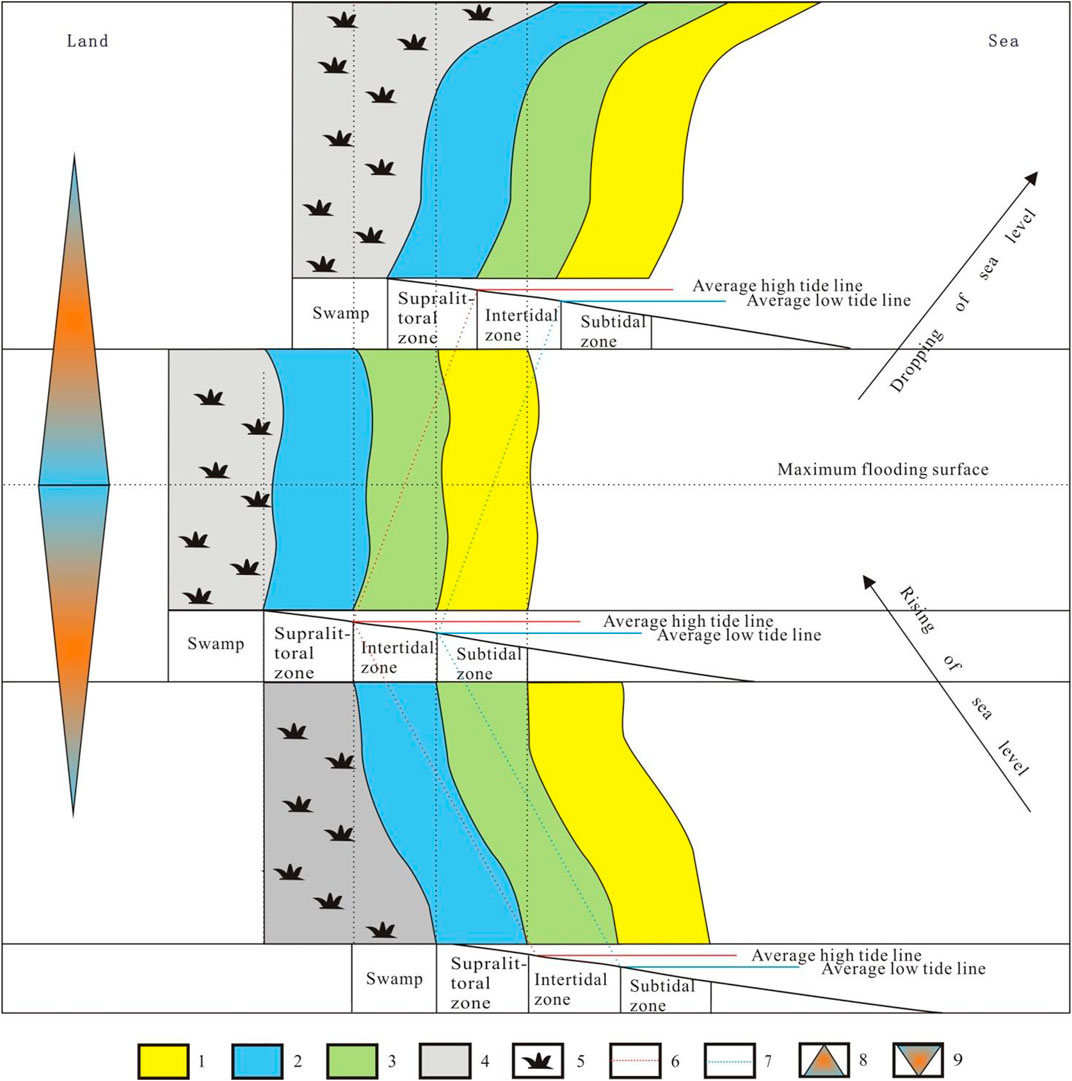
FIGURE 2. Trends of tidal flats and lithology varying with sea level. 1. Sand flat; 2. Mud flat; 3. Mixed flat; 4. Swamp; 5. Vegetation; 6. Curve of change in average high tide line; 7. Curve of change in average low tide line; 8. Fining-upwards sequence; 9. Coarsening-upwards sequence.
The Shanxi Formation is the carbonate-clastic tidal flat sedimentary system, which can be characterized by mudstone interbedded with tight sandstone, and further divided into five microfacies namely sand flat, mixed flat, mud flat, limemud flat, and peat flat. Sand flat developed below the average low-water line, mixed flat between the average high water line and average low-water line, and mud flat above the average high water line (Figure 2) (Cattaneo and Steel, 2003; Cummings et al., 2006a; Cummings et al., 2006b; Su et al., 2020; Ward et al., 2020). Meanwhile, the limemud flat mainly consists of carbonate sediments in a clear-water environment, and the peat flat is characterized by the development of coal seams (Zhu, 2009; Longhitano et al., 2012; Song et al., 2018; Wang, 2018). The sediments in the sand flat mainly include fine and medium sandstone (Espitalié et al., 1977), and those in the mixed flat mostly the interbedding of thin laminated fine sandstone and mudstone, or the mixture of sandstone and silty mudstone. The sediments in the mud flat mainly include mudstone, silty mudstone, and carbonaceous mudstone (Figure 3). The Shanxi Formation is approximately 262.4 ft (approximately 80 m) thick on average, and the maximum thickness is 328 ft (approximately 100 m). It is buried at 4,018–8,724.8 ft (1,225–2,660 m) depths, averaging 5,105.9 ft (approximately 1,556.7 m), and thin coal seams are widely developed (Figure 3).
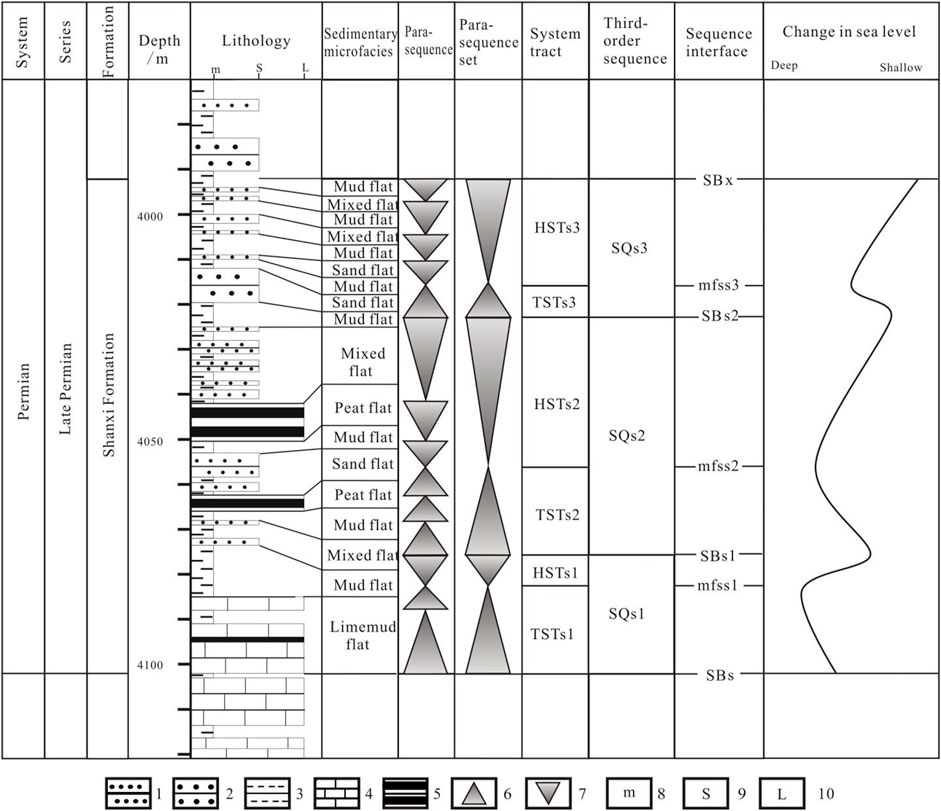
FIGURE 3. Division of sequence stratigraphic framework of Shanxi Formation (well A) 1. Fine sandstone; 2. Medium sandstone; 3. Mudstone; 4. Limestone; 5. Coal seam; 6. Rising of sea level; 7. Dropping of sea level; 8. Width of mudstone; 9. Width of sandstone; 10. Width of limestone.
3 Sampling and Experimental Methods
3.1 Geochemical Characteristic Analysis
3.1.1 Vitrinite Reflectance Analyses
A total of 23 samples from the Shanxi Formation were used in vitrinite reflectance analyses. Vitrinite reflectance analyses were conducted at the State Key Laboratory of Petroleum Resources and Prospecting of the China University of Petroleum (Beijing), using a Leica 4500P+CRAIC Spectrophotometer apparatus according to the testing standard of SY/T5124-2012, under the 23°C and 48% relative humidity testing environment.
3.1.2 Rock-Eval Analyses
A total of 84 samples from the Shanxi Formation were used in Rock-Eval analyses (Figure 4). This experiment is an established method for representing the type of organic matter in sedimentary rocks as well as their petroleum generation potential (Espitalié et al., 1977). The samples were subjected to programmed heating in an inert atmosphere to determine the amount of volatile gas and residual bitumen (S1 peak) and the amounts of nonvolatile hydrocarbons and oxygen-containing organic compounds released during thermal cracking of the remaining organic matter in the rock (recorded in as S2). In other words, S1 presents residual bitumen in the Shanxi Formation shale samples, whereas S2 presents hydrocarbons generated during the Rock-Eval process. Hence, S2 can present the content of kerogen to some extent.
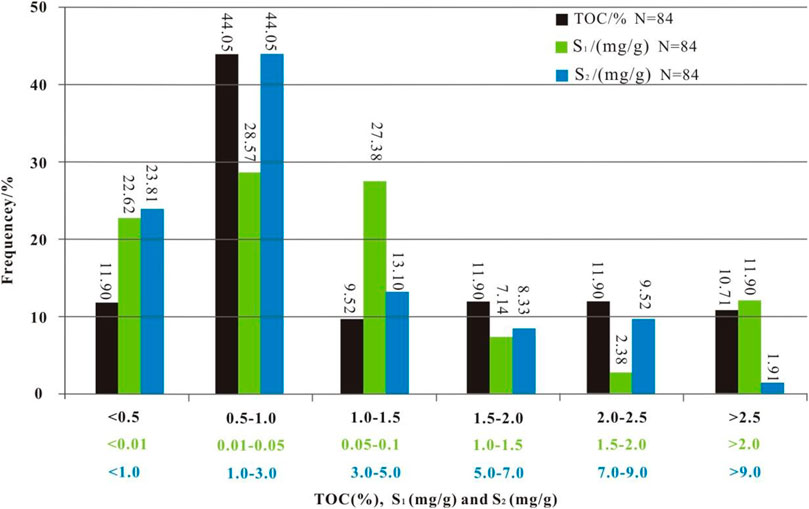
FIGURE 4. TOC, S1 (mg/g) and S2 (mg/g) histogram. There are three groups of data scopes, color-coded: black, ranges of TOC data; green, ranges of S1 data; blue, ranges of S2 data.
3.1.3 Mineral Composition Analysis
A total of 10 samples from the Shanxi Formation were used in mineral composition analysis. X-ray diffraction is a widely used and statistically valid method to identify minerals and clay minerals composition in shale reservoirs. The mineral composition was measured by a Bruker D8 ADVANCE X-ray poly-crystalline diffractometer.
3.1.4 Pore Image Analysis
SEM observation is a commonly method used to provide visualization of the pores. In this research, pores image analysis is supported by a scanning electron microscope (SEM) equipped with an energy-dispersive spectrometer (EDS) and electron backscatter diffraction (EBSD) (Huang et al., 2017).
3.1.5 Porosity and Permeability Analysis
A total of 10 samples from the Shanxi Formation were used in porosity and permeability analysis. The samples were evaluated by Coretest AP608 overburden pore porosity and permeability experiments, and measured by helium as a carrier gas.
3.2 Low-Pressure N2 Adsorption Analysis
Adsorption is the accumulation of molecules on the surfaces of a material (adsorbent). This process creates a layer of adsorbate on the adsorbent’s surface and is a consequence of surface energy (Gregg and Sing, 1982). Low-pressure (77K) N2 adsorption analysis is widely used to characterize the specific surface area (SSA), especially for the mesopore (pore diameter ranges from 2 to 50 nm) (Rouquerol et al., 1994). The N2 adsorption is measured at low pressure (<0.127 MPa) and temperature (−196°C), and the equivalent surface areas are calculated according to the Brunauer–Emmett–Teller (BET) method (Brunauer et al., 1938):
where γ is the surface tension of liquid nitrogen at boiling point (8.59) (Wang et al., 2000; Qi et al., 2002a; Groen et al., 2003), Vm is the molar volume of liquid nitrogen in cm3/mol, R is the gas constant in mol*K, T is the boiling point of nitrogen (77K), P is the gas vapor pressure in MPa, P0 is the saturation pressure of adsorbent in MPa, d is the diameter of the pore in nanometers (nm), and rK is the Kelvin radius of the pore in nanometers (nm).
A total of 20 samples from the Shanxi Formation shale were used in low-pressure N2 adsorption analysis through a Micromeritics ASAP 2020 instrument, which is based on the manometric method. In the beginning, the void volume of the sample cell (SC) containing the adsorbent, is determined by helium expansion. Subsequently, specific amounts of the nitrogen gas are transferred into the sample cell and record the adsorption equilibrium pressure. The equilibrium pressure and the void volume data can be used to calculate the residual gas volume.
The quantity of adsorbed gas is then calculated as the difference between the quantity of gas transferred into the SC and the quantity of gas that could be accommodated in the void volume of the SC if no adsorption occurred (non-adsorption case). The gas dosing and equilibration steps are repeated until the N2 pressure (P) and the saturation pressure (P0) are equal. The SC is then gradually evacuated stepwise and the pressure is measured to calculate the amount of adsorbed gas. Hysteresis occurs due to desorption and adsorption differences (Huang et al., 2017).
3.3 Pore Structure and Fractal Dimension Analysis
Fractal dimension (D) is an important parameter used to analyze complex rock pore networks. It can represent the pore structural heterogeneity in detail and point out the degree of complexity of the pore system. The fractal dimension of the pores structure was computed in this work using the Frenkel–Halsey–Hill (FHH) (Yao et al., 2012) model:
where V is the volume of adsorbed gas molecules at equilibrium pressure in m3/t, V0 is the volume of monolayer coverage in m3/t, D is the fractal dimension of the pore structure, P is the equilibrium pressure of the gas in MPa, and P0 is the gas saturation pressure in MPa (Huang et al., 2017).
A larger fractal dimension means a coarser and more complex pore surface area. According to the measured nitrogen adsorption isotherm, the data of P/P0 was selected and plotted in Ln [Ln (P/P0)] with Ln (V/V0), and then the fractal dimension was calculated according to the slope of the fitting trend line.
4 Results
4.1 Organic Matter Characteristics
The total organic carbon (TOC) content of the Shanxi Formation shale ranges from 0.25% (minimum) to 3.00% (maximum) and mainly varies from 0.5% to 1.0% (Figure 4). The vitrinite reflectance (RO) of shale varies from 0.85% (minimum) to 1.24% (maximum), with an average of 1.1%, whereas the RO of shale mainly ranges from 1.0% to 1.2% (Figure 5).
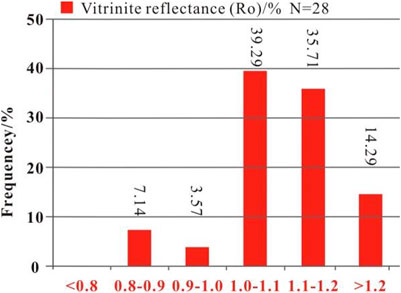
FIGURE 5. Vitrinite reflectance (RO) histogram.
The S1 ranges from 0.001 mg/g (minimum) to 0.36 mg/g (maximum), with an average of 0.07 mg/g, and mainly varies from 0.01 mg/g to 0.1 mg/g (Figure 4). The S2 ranges from 0.1 mg/g (minimum) to 9.30 mg/g (maximum), with an average of 2.83 mg/g, and most samples show an S2 range of 1.0–5.0 mg/g (Figure 4). The Tmax varies from 432°C to 455°C, with an average of 444°C (Figure 5). The organic matter in Shanxi Formation shale varies form Type II1 to Type III, mainly Type II2 followed by Type III. The Type II1 organic matter is limited (Figure 6).
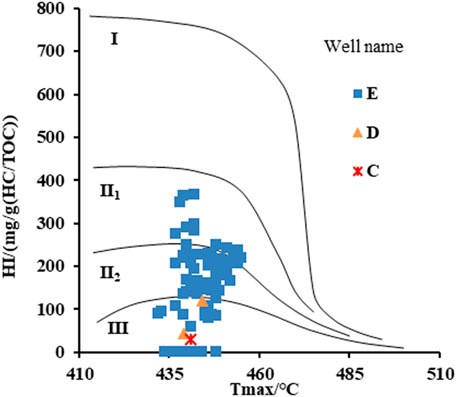
FIGURE 6. Plot of the hydrogen index (HI) versus Tmax.
4.2 Mineral Composition Characteristics
The minerals of the Shanxi Formation shale mainly consist of clay minerals (minimum 47.5%, maximum 70.0%, and 61.0% on average) and quartz (minimum 26.0%, maximum 41.7%, and 33.7% on average). In addition, a small amount of plagioclase and siderite are also developed (average: 1.9% and 6.4%, respectively), and the K-feldspar and rutile minerals are hardly exist (Table 1). The samples from well E mainly consist of clay minerals (minimum 47.5%, maximum 51.1%, and average 49.3%) and quartz (minimum 36.9%, maximum 41.7%, and average 38.7%). Besides, a small amount of plagioclase and siderite is also developed (average: 2.2% and 8.5%, respectively), and the K-feldspar (the value is 0.9%) and rutile minerals are hardly exist (the average value is 0.9%) (Table 1). The samples in well F mainly consist of clay minerals (minimum: 61.9%, maximum: 70.0%, and average: 66.0%), and followed by quartz (minimum 26.0%, maximum 38.1%, and average 38.6%). However, K-feldspar, plagioclase, siderite, and rutile minerals are hardly exist (Table 1).
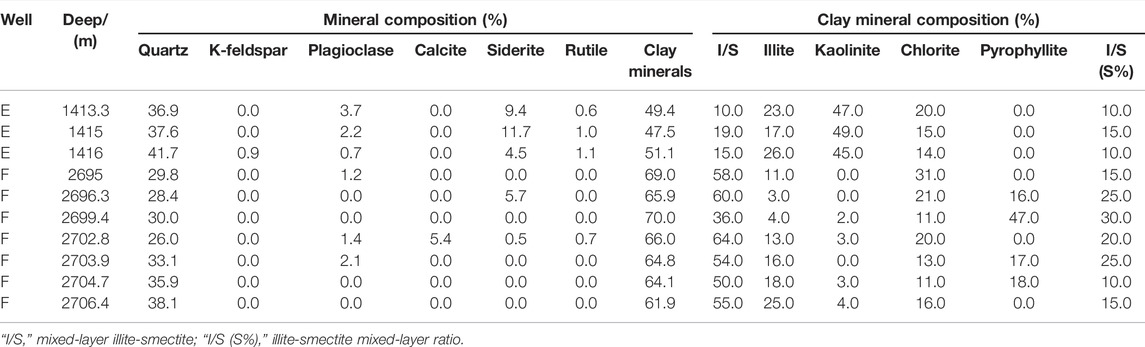
TABLE 1. Mineral composition of Shanxi Formation shale samples.
The clay minerals of Shanxi Formation shale consist of mixed-layer illite-smectite, illite, chlorite, kaolinite, and pyrophyllite. The mixed-layer illite-smectite accounts for the majority of clay minerals (minimum 10.0%, maximum 64.0%, and average 42.1%), which is followed by chlorite and illite (average: 17.2% and 15.6%, respectively). Besides, some of the samples developed kaolinite and pyrophyllite (the average values are 21.9% and 24.5% respectively), and the smectite-illite ratio is 17.5% (Table 1). The samples in well E mainly consists of kaolinite (minimum 45.0%, maximum 49.0%, and average 47.0%), and the mixed-layer illite-smectite, illite, chlorite followed by kaolinite (average: 14.7%, 22.0%, and 16.3%, respectively). The samples in well F mainly consist of mixed-layer illite-smectite (minimum 36.0%, maximum 64.0%, and average 56.9%), and chlorite, illite followed (average: 17.6% and 12.9%, respectively). Besides some of the samples developed pyrophyllite and kaolinite (average: 24.5% and 3.0%, respectively).
4.3 Characterization of Pores
The organic matter could be readily identified by SEM. The black points are organic matter (Figures 7A,C), which can be identified under high magnification (Figure 7B). Few pores can be observed in organic matter (Figures 7B,C), and only a few cracks can be observed. It is hard to ascertain that these cracks in organic matter are related to thermal evolution considering the sample processing procedure before microscopic analysis. The relatively low thermal maturity, which is reflected by the relatively low vitrinite reflectance values (RO: 0.8–1.2%), impedes the formation of pores in organic matter of the Shanxi Formation shale.
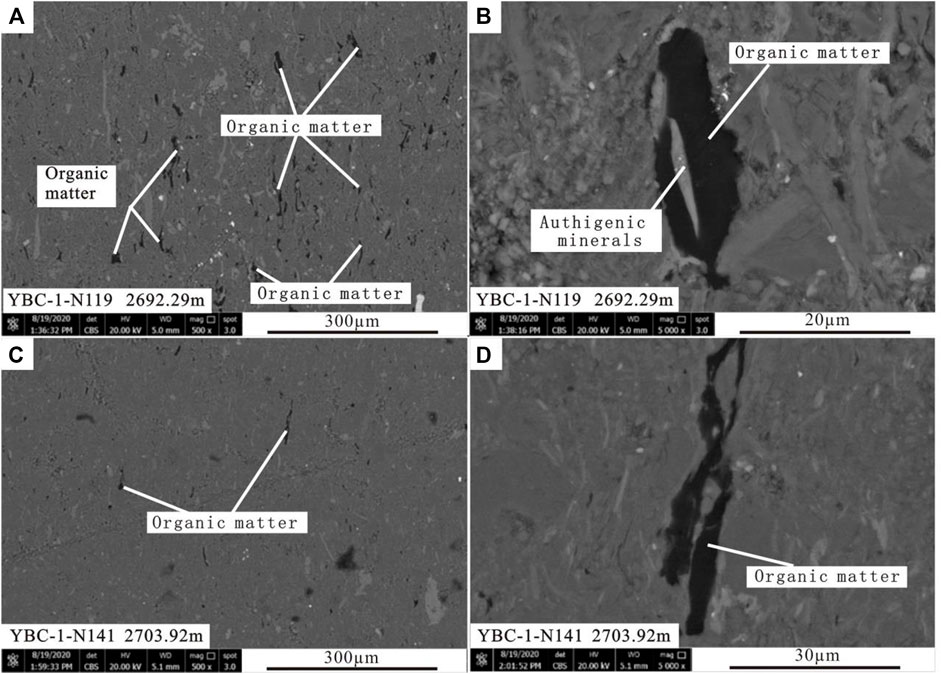
FIGURE 7. SEM images of organic matter in Shanxi Formation shale. (A) organic matter pores; (B) organic matter pores with authigenic minerals fill in; (C,D) organic matter pores.
Although the pores of organic matter are not well developed, interparticle pores occur among clay minerals (Figures 8A,C). The clay minerals lost their crystalline morphology and character during sedimentation, compaction, and consolidation that develop during diagenesis (Huang et al., 2017). Some clay minerals exhibit sheet-like shapes because of compaction (Figures 8B,D).
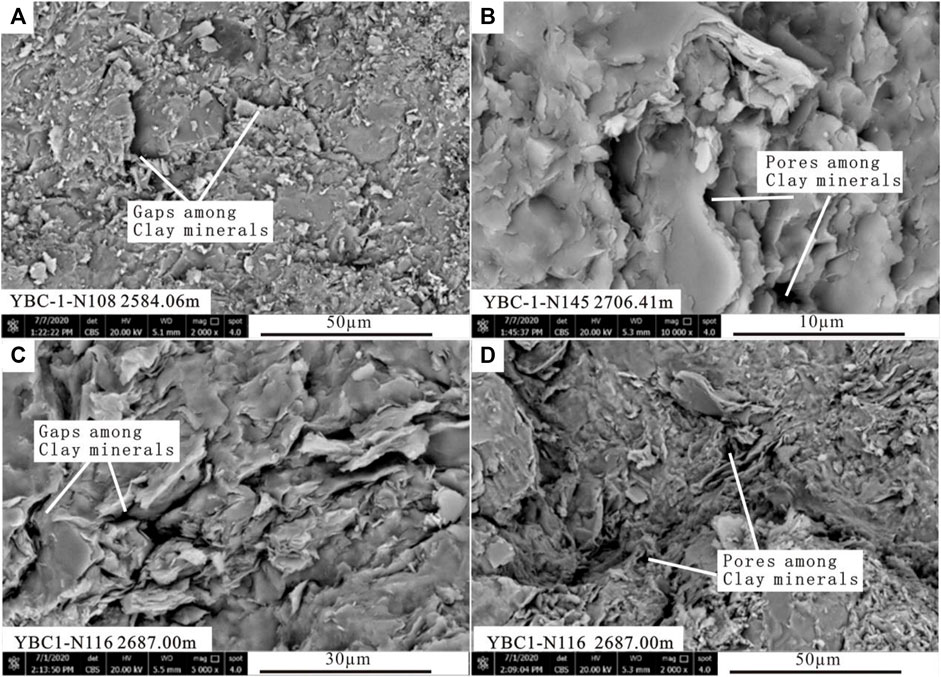
FIGURE 8. SEM images of interparticle pores related to clay minerals in Shanxi Formation shale. (A,C) gaps among clay minerals; (B,D) pores among clay minerals.
The porosity and permeability experimental results of Shanxi Formation shale are presented in Figure 9. The porosity of Shanxi Formation shale ranges from 0.8% (minimum) to 3.78% (maximum), with an average of 1.74%, and the permeability ranges from 0.0032 mD (minimum) to 0.0189 mD (maximum), with an average of 0.001 mD. This result shows the Shanxi Formation shale has low porosity and permeability (Figure 9). The well E is located in the south of the study area, and the Shanxi Formation shale is buried under 1400 m. The well F is located in the south part, and the Shanxi Formation shale is buried under 2600 m. From the porosity and permeability value, the porosity of well E with shallow depth is higher than well F, and the permeability distribution of well E is more compact than well F. The porosity of Shanxi Formation shale decreased as the depth increases. However, the permeability changes are irregular, which may be influenced by the geometry shape, grain size, and arrangement direction of the pores.
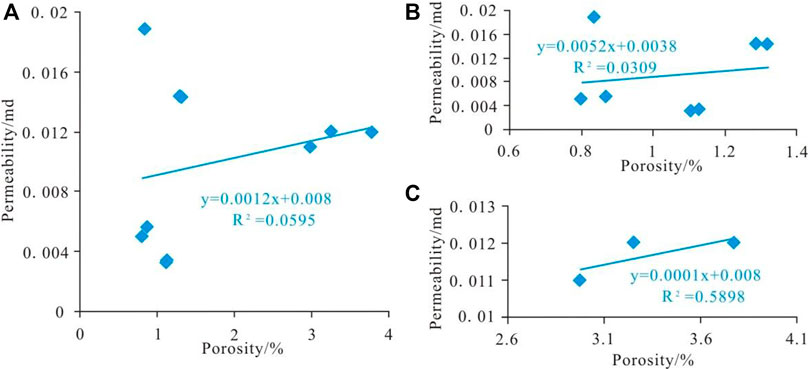
FIGURE 9. The relationship between permeability and porosity. The relationship between permeability and porosity of (A) well E and well F, (B) well F and (C) well E
The porosity of Shanxi Formation shale samples of well E and well F shows a poor correlation with its permeability (Figure 9A). The correlation for shale samples from well F is the worst (Figure 9B). However, the correlation for shale samples from well E is better, although there are only three data points (Figure 9C).
Intergranular pores are well developed and pores are mainly filled with organic matter and minerals. Since upper paleozoic developed coal strata in the study area, the environment of the sedimentary is acidic-weak to acidic. The dissolution began when the mudstone was not consolidated into rock, and was associated with pressure dissolution. In this period, the early clay matrix was formed, resulting in a large number of fillings in the primary pores. After that, organic matter matured as the Shanxi Formation shale buried depth increased, and the rock is under the diagenetic stage. The filling of clay minerals and authigenic minerals in the pores, reduced the space of pores developed in the later stage. Hence, the Shanxi Formation shale in the study area shows poor physical properties of low porosity and low permeability.
4.4 Low-Pressure N2 Adsorption Analysis
4.4.1 Specific Surface Area and Pore Size Distribution
For the 20 samples of Shanxi Formation shale, the SSAs ranged from 1.67 m2/g to 10.57 m2/g, with an average of 3.7 m2/g (Figure 10). The SSAs of well E ranged from 6.19 m2/g to 10.57 m2/g, with an average of 8.05 m2/g, and those of well F ranged from 1.67 m2/g to 7.94 m2/g, with an average of 3.72 m2/g. Samples from Well E exhibit much higher SSAs than well F.
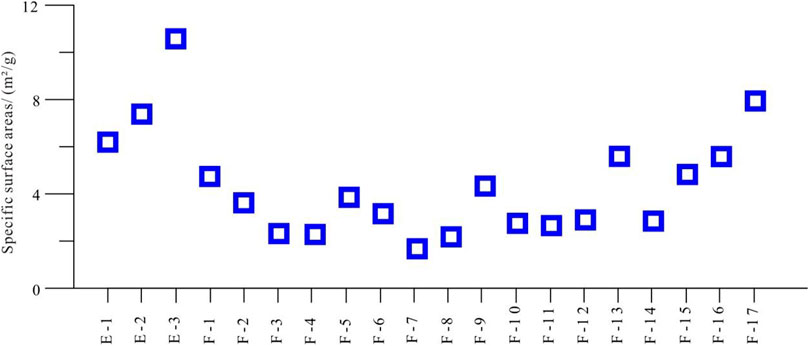
FIGURE 10. Specific surface area of 20 samples.
The Shanxi Formation shale reservoir nitrogen adsorption and desorption curve (Figure 11) shows an inverse “S” shape for each sample. The adsorption and desorption curve has little difference between each sample. In the low-pressure section (P/P0<0.2), the adsorption curve slowly rises, and the curve is gentle and slightly convex, showing a monolayer of nitrogen adsorbed on the surface of reservoir pore throats. In the middle-pressure section (0.2<P/P0<0.8), the adsorption capacity increased slowly as the relative pressure increased, and the adsorption curve is approximately linear, indicating the multi-molecular layer nitrogen adsorption. In the high-pressure section (0.8<P/P0<1.0), the adsorption curve increased rapidly and showed a concave shape. When the equilibrium pressure is close to the saturated vapor pressure, the slope of the adsorption curve of most samples is still increasing. However, the sample did not show adsorption saturation. This shows that a small number of pore throats with pores diameter larger than 50 nm are developed in the samples. When P/P0>0.45, the desorption curve is above the adsorption curve.
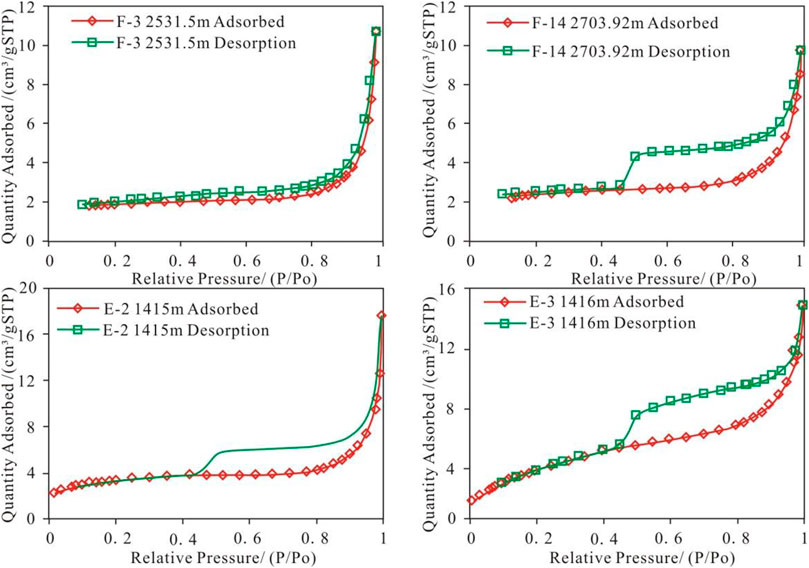
FIGURE 11. Comparison of the isotherms and hysteresis of Shanxi Formation.
The nitrogen adsorption isotherms of Shanxi Formation shale show obvious hysteresis loops (Figure 11). The International Union of Pure and Applied Chemistry (IUPAC) classified the adsorption isotherms into six types, from Type I to Type VI. The IUPAC also classified the hysteresis patterns into four types, Type H1 to Type H4. The shale samples isotherms are closely similar to Type III isotherm shape (Figure 11). The hysteresis is the same as Types H3 and H4. The Type H3 loop is related to plate-like particles giving rise to slit-shaped pores. Similarly, the Type H4 loop is usually associated with narrow slit-like pores (Sing, 1985; Rouquerol et al., 1994; Rouquerol et al., 1999; Jiang et al., 2010; Kuila et al., 2012). With the increase of relative pressure, the adsorption curve and desorption curve rise fast. When the relative pressure is close to 1, the curve is almost perpendicular to the P/P0 axis and does not reach the adsorption saturation, indicating the occurrence of condensation in the pores during nitrogen adsorption. After that, the relative pressure decreased and the desorption amount decreased rapidly. There is no obvious inflection point between the adsorption curve and desorption curve. This adsorption characteristic often occurs in wedge-shaped holes with openings at both ends or in the formation of non-rigid aggregates composed of flake-like particles (Sing, 1985; Rouquerol et al., 1999; Jiang et al., 2010; Kuila et al., 2012). According to the isotherms and hysteresis description, the pores morphology of Shanxi Formation is type B (Mohammad et al., 2013; Xu et al., 2019), and means dominance of slit-plate-like pores, which is open and has good connectivity. The adsorption and desorption isotherms converge at a relative pressure (P/P0) of 0.45–0.5, equivalent pore diameter of 2.3–2.7 nm according to the BET calculation based on the relationship between relative pressure (P/P0) and diameter. Therefore, it is considered that the hysteresis loop and the “forced closure” of shale pores shown by nitrogen adsorption isotherm of Shanxi Formation occur in the range of pore diameter between 2.3 and 2.7 nm.
4.4.2 The Fractal Dimension
Due to the analytical temperature of the nitrogen, adsorption analyses are too low (−196°C) for nitrogen molecules to get access to the micropore. The nitrogen adsorption analyses are usually used to demonstrate the mesopore size (2–50 nm) distribution (Unsworth et al., 1989; Rouquerol et al., 1994). Moreover, the “forced closure” emerges corresponding to diameter 2.3–2.7 nm, and the area of the incremental pores fluctuates rapidly from 2–3 nm of pore diameter (Figure 12); hence, we divided the size of the pores in this research into three ranges with diameters <2 nm (micropore), 2–50 nm (mesopore), and >50 nm (macropore).
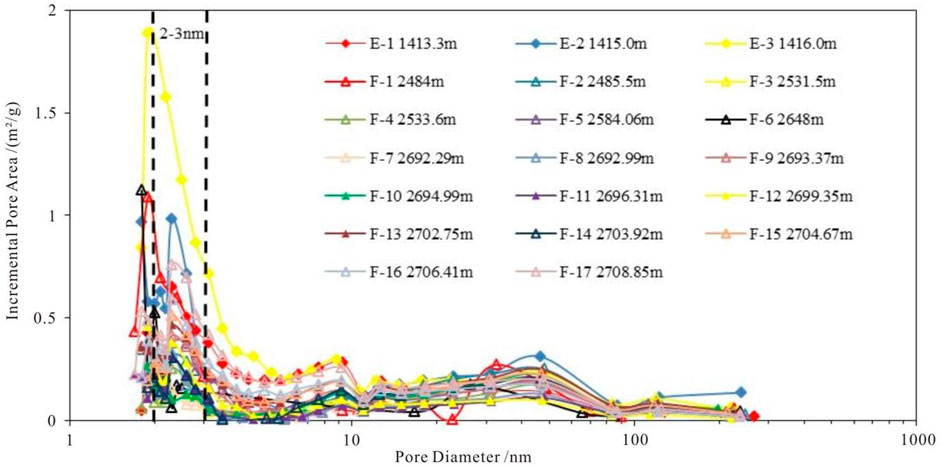
FIGURE 12. Comparison of the pore diameter and incremental pore are of Shanxi Formation shale samples.
A scatter diagram of Ln [Ln (P0/P)] versus Ln (V/V0) for the shale samples data using the original low-temperature nitrogen adsorption isotherm data is represented in Figure 13. Most of the correlation coefficients of the linear fitting curves were larger than 0.96 for all the three ranges, and only a few of the correlation coefficients of the linear fitting curves were larger than 0.84 for all the three ranges.
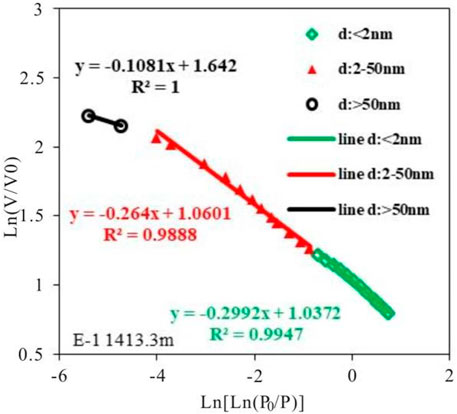
FIGURE 13. Fractal dimensions of the pores in Shanxi Formation shale samples.
Calculation results are based on the Frenkel-Halsey-Hill (FHH) model by the low-pressure N2 adsorption data of the 20 samples. The results show only two data points of the pore size d>50 nm. It indicates that the Shanxi Formation shale has few macropores but mainly developed micropores and mesopores. The low porosity and permeability also indicate a low pore diameter for the Shanxi Formation shale.
As evident from Table 2 and Figure 14, the micropore has a relatively high fractal dimension with an average of 2.77, the mesopore shows a low fractal dimension with an average of 2.65, while the macropore has a high fractal dimension with an average of 2.77. The fractal dimension reflects the structure of pores. Micropore and macropore represent the largest fractal dimensions, meaning the strongest pore structure complexity. However, the mesopore represents the lowest fractal dimensions, meaning less pore structure complexity and better pore connectivity compared with the micropore and the macropore. The fractal dimension of pores in the Shanxi Formation shows that the shale has a coarser pore surface, a lower pore connectivity, and stronger heterogeneity of the reservoir. Compared with the Yanchang Formation shale (lower-maturity shale) (Wang, 2018) in the Ordos basin of the North China Plate, the shale of Shanxi Formation shows relatively higher fractal dimensions on average but a narrow range of fractal dimensions, proving stronger pore structure complexity but lower pore structure diversity in the lower-maturity shale. Compared with highly mature marine shales, the Shanxi Formation shale in the research area represents relatively equal fractal dimensions, indicating high pore structure complexity but lower pore structure diversity in the lower-maturity shale (Yang et al., 2014; Tang et al., 2015).
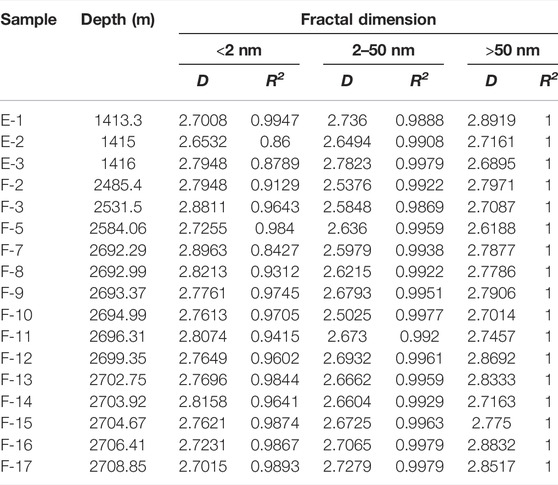
TABLE 2. Tables of fractal dimension of Shanxi Formation shale samples.
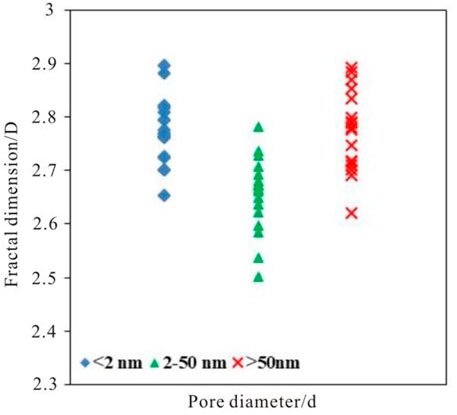
FIGURE 14. Comparison of different pore diameter fractal dimensions of Shanxi Formation.
5 Discussion
5.1 Influence of Rock Framework Particles on Specific Surface Area
The heterogeneity of pore structure is essentially affected by the rock framework particles, which mainly include kerogen and minerals components. To analyze the influence of rock framework particles on the pore structural heterogeneity, the correlations of specific surface area and fractal dimension with S1, S2, TOC and quartz, clay minerals, and other types of clay minerals were established.
5.1.1 Effect of Organic Matter on Specific Surface Area
For the 20 samples, both were used in low-pressure N2 adsorption and Rock-Eval analysis. The S1 and TOC present no clear correlation with the SSA. The S2 exhibits a slight positive correlation with the SSA, but with a rather low correlation coefficient (R2 = 0.4939) (Figure 15). This proved that the residual bitumen of low thermal-maturity shale has no obvious effect on SSA and the kerogen slight effect on it.
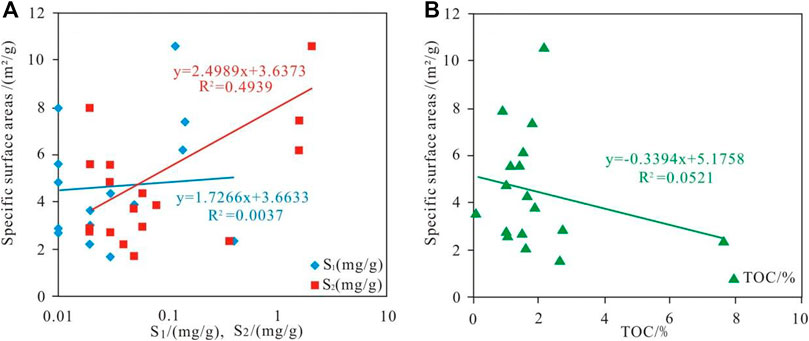
FIGURE 15. Correlation of the average fractal dimensions with S1, S2, and TOC of Shanxi Formation. Average fractal dimensions with (A) S1 and S2, (B) TOC.
5.1.2 Effect of Minerals on Specific Surface Area
For the 10 samples used both in low-pressure N2 adsorption analysis and X-ray diffraction analysis, quartz has a positive effect on the SSA, while clay minerals show a negative correlation with the SSA (Figure 16A). For different types of clay minerals, the illite has a positive correlation with the SSA, while mixed-layer illite-smectite has a negative correlation with the SSA (Figure 16). Chlorite also has a negative correlation with the SSA, but with a rather low correlation coefficient R2 (Figure 16B). Samples with higher content of quartz exhibit higher SSA, while samples with higher content of clay minerals show lower SSA. For different types of clay minerals, samples with high content of illite exhibit higher SSA, whereas samples with high content of mixed layers of illite-smectite and chlorite show lower SSA.
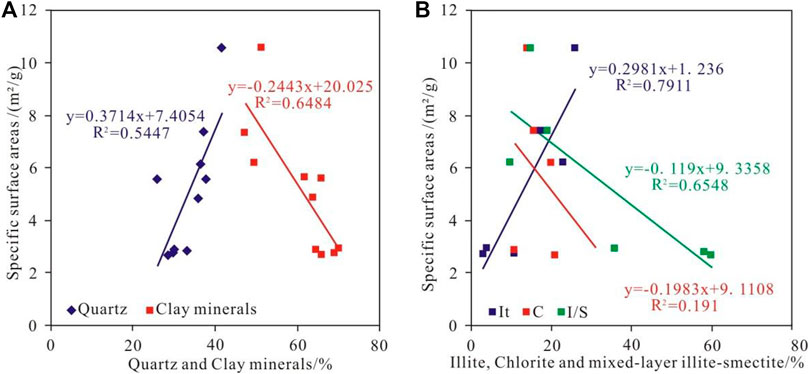
FIGURE 16. Correlation of SSA with quartz, clay minerals and other types of clay minerals. Correlation of SSA with (A) quartz and clay minerals, (B) Illite, chlorite, mixed-layer illite-smectite (I/S). Illite (It); Chlorite (C); Mixed-layer illite-smectite (I/S).
Quartz can keep crystal form under the compaction, high content quartz means high SSA of quartz. The content of illite increased as the depth of shale increased. Clay minerals and mixed-layer illite-smectite are hard to keep crystal form under the compaction, and filled with authigenic minerals in the pores, decreased the SSA of Shanxi Formation shale. All in all, quartz and illite increase the SSA, whereas clay minerals and mixed-layer illite-smectite decrease the SSA.
5.1.3 Effect of Porosity and Permeability on Specific Surface Area
For the 10 samples that used in porosity and permeability, X-ray diffraction, and low-pressure N2 adsorption analysis, porosity has a positive effect on the SSA (Figure 17A), while permeability shows no clear correlation with the SSA (Figure 17B). The larger the SSA is, the higher porosity of the reservoir is. High porosity means more pores or large pores developed in the reservoir. As the number of pores increased, the SSA of pores increased too. However, the result between permeability and SSA presents a poor correlation coefficient R2. Permeability may be influenced by the geometry shape, grain size, and arrangement direction of the pores. In Figure 16, quartz also has a positive effect on the SSA. In fact, quartz, as rock skeleton grains, plays an important role in resistance to the compaction, and then the pores were kept. Hence, high content quartz means large porosity, and then high SSA. Hence, the permeability affects by many influences, so the relationship with SSA is poor.
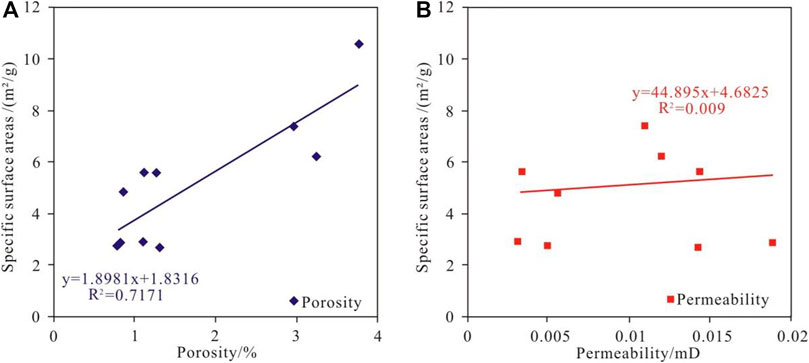
FIGURE 17. Correlation of SSA with porosity and permeability of Shanxi Formation shale. Correlation of SSA with (A) porosity, (B) permeability.
All in all, the porosity of Shanxi Formation shale increased as the SSA increasing, but the relationship between permeability and SSA is hard to be identified.
5.2 Influence of Rock Framework Particles on Fractal Dimension
5.2.1 Effect of Organic Matter on Fractal Dimension
The fractal dimension of the micropore, mesopore and macropore of the Shanxi Formation shale, each has a different correlation with the S1 and S2 (Figure 18). For the micropore, it presents a positive correlation with the S1 and a negative correlation with the S2. However, the correlation coefficient of the micropore is low, which shows the irrelevance of organic matter with the micropore structure heterogeneity. The fractal dimension of the mesopore presents a negative correlation with the S1 and a positive correlation with the S2. However, the correlation coefficient of the mesopore is low for the S1 and S2. This indicates that mesopore structure heterogeneity also has a low correlation with organic matter. The fractal dimension of the macropore presents a negative correlation with the S1 and S2, and the correlation coefficient of the macropore is the lowest, which means the macropore structure heterogeneity has no obvious relationship with organic matter, either (Figure 18).
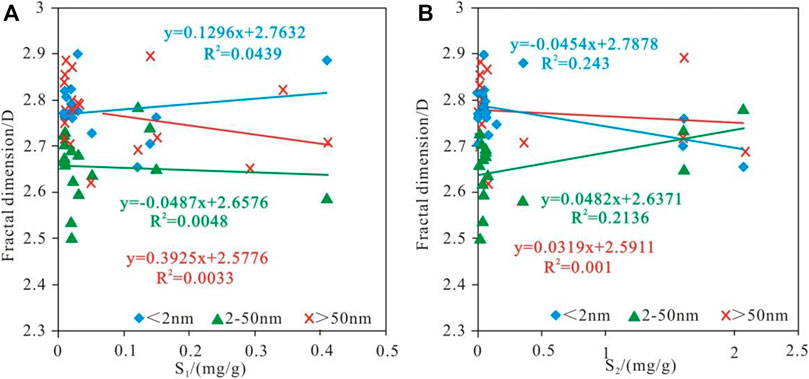
FIGURE 18. Pore size distributions and relationship between fractal dimension and kerogen. Relationship between fractal dimension and (A) S1, (B) S2.
All in all, for Shanxi Formation shale the fractal dimension of the micropore, mesopore, and macropore present no obvious relationship with the S1 and S2. It is proved that the content of organic matter does not affect the pore structure heterogeneity of Shanxi Formation shale in the research area.
5.2.2 Effect of Minerals on Fractal Dimension
The mesopore, micropore, and macropore present great differences in the correlation between fractal dimension and quartz and clay minerals. The fractal dimension of the micropore and macropore presents a negative correlation with quartz, but a positive correlation with clay minerals. On the contrary, the fractal dimension of the mesopore presents a positive correlation with quartz, but a negative correlation with clay minerals. None of the micropore, mesopore, and macropore presented a strong correlation coefficient between the fractal dimension with quartz and clay minerals (Figure 19).
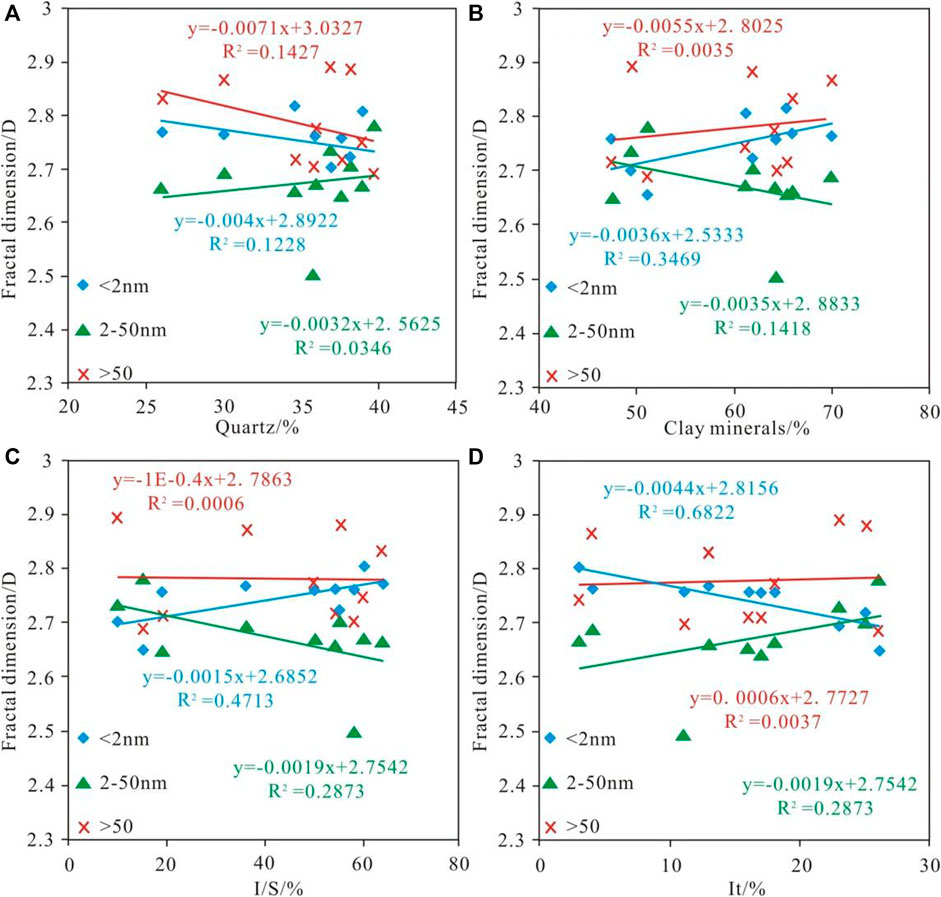
FIGURE 19. The relationship of fractal dimension with detrital minerals and clay minerals. relationship between fractal dimension and (A) quartz, (B) clay minerals, (C) I/S and (D) It.
The illite and the mixed-layer illite-smectite exhibit different correlation with the fractal dimension. The fractal dimension of micropore presented a positive correlation with the mixed-layer illite-smectite, whereas the mesopore and macropore presented a negative correlation with the mixed-layer illite-smectite. The relationship between fractal dimension and the illite of micropore presented a negative correlation with a strong correlation coefficient. However, the relationship between fractal dimension and the illite of mesopore and macropore presented a negative correlation with a poor correlation coefficient.
For all three types of pores, quartz has an inconspicuous correlation with the fractal dimension, and the correlation coefficient R2 values are low (Figure 19A). This indicated that quartz does not affect the fractal dimension of the Shanxi Formation shale. For the micropores, clay minerals and the mixed-layer illite-smectite present a slightly positive correlation with fractal dimension (Figures 19B,C). However, the illite shows obviously negative correlation with a high correlation coefficient R2 (Figure 19D). For the mesopores, the mixed-layer illite-smectite and illite also present slightly but opposite correlation with fractal dimension (Figures 19C,D). The former is negative and the latter is positive. For the macropores, any type of mineral shows no impact on the fractal dimension. The illite shows a hair-like or acicular form and shows a more confirmative effect of the illite minerals on structural heterogeneity for micropore (Figure 19D). The absolute value of the slope of correlation lines with fractal dimension for micropore is larger than mesopore and macropore (Figure 19). It can be concluded that the mixed-layer illite-smectite and illite affect the fractal dimension of Shanxi Formation shale. This also indicates a stronger impact of the clay minerals on structural heterogeneity for micropore.
Quartz can keep crystal form under the compaction and has a smooth surface of the mineral. The mixed-layer illite-smectite is easy to lose crystal form during the compaction. This indicates the two types of minerals mentioned above are not the main influencing factors of pore heterogeneity. As the burial depth of illite increased, the content of illite increased too. Illite has a high correlation with the fractal dimension of micropore, which improves to be the main influencing factor of pore heterogeneity. All in all, quartz, clay minerals, and mixed-layer illite-smectite present no obvious contribution to pore structural heterogeneity. However, illite decrease pore structural heterogeneity of micropore. Compaction is the main factor affecting the pores of Shanxi Formation shale in the study area.
5.2.3 Effect of Porosity and Permeability on Fractal Dimension
The fractal dimension of the micropore, mesopore and macropore of the Shanxi Formation shale, represent a similar correlation with porosity and permeability (Figure 20). The fractal dimension of the micropore and macropore both presented a negative correlation with porosity and permeability, while the mesopore presented a positive correlation with porosity and permeability (Figures 20A,B). The results only show a good negative correlation between porosity and the fractal dimension of the micropore (R2 = 0.5512). Other pores have a poor correlation coefficient R2 between porosity and permeability and the fractal dimension. The larger the micropore fractal dimension, the poor the porosity of the Shanxi Formation shale reservoir, and the more complex the micropore (Figure 20A).
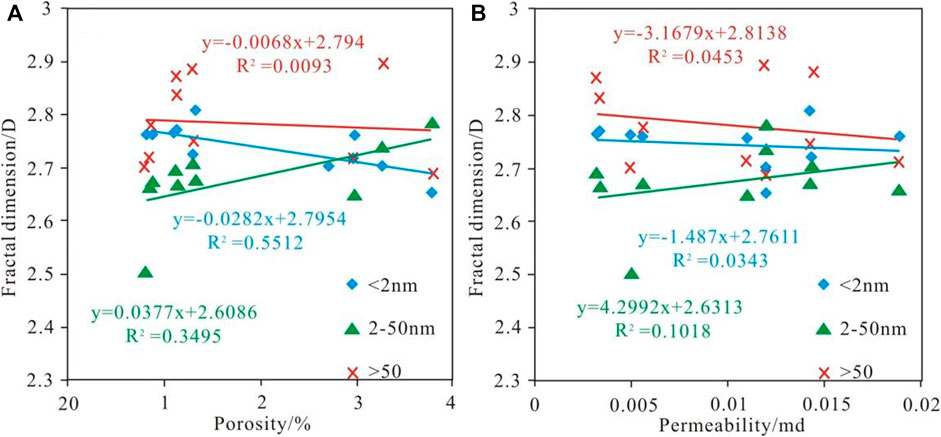
FIGURE 20. Relationship of fractal dimension with porosity and permeability. Fractal dimension with (A) porosity, (B) permeability.
All in all, for Shanxi Formation shale, the fractal dimension of the micropore presents good negative relationship with porosity. It is proved that the Shanxi Formation shale with higher porosity presents lower micropore structure heterogeneity in the research area.
6 Conclusion
1) The Shanxi Formation shale in the study area shows low porosity and permeability, and the pore structure is complexed. Micropore and macropore have a relatively high fractal dimension with an average of 2.77. Mesopore has a low fractal dimension with an average of 2.65. The fractal dimension average of different pores of Shanxi Formation shale is all larger than 2.5, which means all the structures of pores are complex. However, the structure of pores of the micropore and macropore is more complex than the mesopore.
2) Organic matter displays a low impact on the pore structure heterogeneity for Shanxi Formation shale in the research area. S2, S1, and TOC exhibit no clear correlation with SSA, which means the organic matter has little effect on SSA. For Shanxi Formation shale the fractal dimension of micropore, mesopore and macropore present no obvious relationship with organic matter. This proved that organic matter is not the main factor affecting the heterogeneity of pore structure of Shanxi Formation shale in the research area. The low maturity is the reason for the non-influence of organic matter.
3) Illite has a strong effect on the pore structural heterogeneity of Shanxi Formation shale. It is the main factor of the pore structural heterogeneity. As the content of illite increased, the SSA increased, whereas the fractal dimension decreased. This indicates pores with high content of illite have high SSA and low fractal dimension, reflecting low pore structural heterogeneity. Although the correlation coefficients R2 of quartz and clay minerals with SSA are more than 0.5, quartz and clay minerals have no obvious relationship with the fractal dimension. Hence, quartz and clay minerals have little impact on the pore structure heterogeneity. All in all, samples with high content of the illite present low pore structural heterogeneity. Quartz and clay minerals have little impact on the pore structure heterogeneity.
4) The Shanxi Formation shale with higher porosity presents lower micropore structure heterogeneity in the research area. However, the permeability has no correlation with pore structure heterogeneity. As the porosity increased, the SSA increased, while the fractal dimension decreased. This indicates pores with high porosity have high SSA and low fractal dimension, reflecting low pore structural heterogeneity. However, the relationship between permeability and SSA, and the relationship between permeability and fractal dimension are poor. These may be influenced by the geometry shape, grain size, and arrangement direction of the pores in the research area, which control by compaction. Hence, the relationship between permeability and pore structural heterogeneity is not clear.
Data Availability Statement
The original contributions presented in the study are included in the article/Supplementary Material; further inquiries can be directed to the first author.
Author Contributions
Conceptualization: DZ and YW; methodology: CL and EL; formal analysis: EL, CL, and DS; investigation: EL; resources: DZ and QX; data curation: QX; writing—original draft preparation: EL; writing—review and editing: EL, CL, and DS; visualization: EL; supervision: CL and DS; project administration: CL and DS; and funding acquisition: DS. All authors have read and agreed to the published version of the manuscript.
Funding
This research was funded by the China Geological Survey Project, grant number “DD20210435.”
Conflict of Interest
The authors declare that the research was conducted in the absence of any commercial or financial relationships that could be construed as a potential conflict of interest.
The reviewer PW declared a shared affiliation with the authors to the handling editor at the time of review.
Publisher’s Note
All claims expressed in this article are solely those of the authors and do not necessarily represent those of their affiliated organizations, or those of the publisher, the editors, and the reviewers. Any product that may be evaluated in this article, or claim that may be made by its manufacturer, is not guaranteed or endorsed by the publisher.
Acknowledgments
The authors would like to express their sincere gratitude to Pengju Yang, Jianwei Zang, and Chuanfang Jiang from SINOPEC Jiangsu Oilfield Branch Company, Yangzhou, Jiangsu, China. They appreciate the valuable comments from the editors and reviewers.
References
Brunauer, S., Emmett, P. H., and Teller, E. (1938). Adsorption of Gases in Multimolecular Layers. J. Am. Chem. Soc. 60 (2), 309–319. doi:10.1021/ja01269a023
Cao, G. S., Xu, G. M., Lin, Y. X., and Yang, Q. H. (2013). Geometry Characteristics of Pre-mesozoic Basin of Eastern Part of North China. J. Henan Polytech. Univ. (Narural Sci. 32 (1), 46–51. (in Chinese with English abstract).
Cattaneo, A., and Steel, R. J. (2003). Transgressive Deposits: a Review of Their Variability. Earth-Science Rev. 62 (3-4), 187–228. doi:10.1016/s0012-8252(02)00134-4
Chen, L., Jiang, Z., Liu, Q., Jiang, S., Liu, K., Tan, J., et al. (2019a). Mechanism of Shale Gas Occurrence: Insights from Comparative Study on Pore Structures of Marine and Lacustrine Shales. Mar. Petroleum Geol. 104, 200–216. doi:10.1016/j.marpetgeo.2019.03.027
Chen, L., Liu, K. Y., Jiang, S., Huang, H., and Zuo, L. (2021). Effect of Adsorbed Phase Density on the Correction of Methane Excess Adsorption to Absolute Adsorption in Shale. Chem. Eng. J. 420, 127–678. doi:10.1016/j.cej.2020.127678
Chen, L., Zuo, L., Jiang, Z., Jiang, S., Liu, K., Tan, J., et al. (2019b). Mechanisms of Shale Gas Adsorption: Evidence from Thermodynamics and Kinetics Study of Methane Adsorption on Shale. Chem. Eng. J. 361, 559–570. doi:10.1016/j.cej.2018.11.185
Cummings, D. I., Arnott, R. W. C., and Hart, B. S. (2006b). Tidal Signatures in a Shelf-Margin Delta. Geol 34, 249–252. doi:10.1130/g22078.1
Cummings, D. I., Hart, B. S., and Arnott, R. W. C. (2006a). Sedimentology and Stratigraphy of a Thick, Areally Extensive Fluvial-Marine Transition, Missisauga Formation, Offshore Nova Scotia, and its Correlation with Shelf Margin and Slope Strata. Bull. Can. Petroleum Geol. 54 (2), 152–174. doi:10.2113/gscpgbull.54.2.152
Curtis, J. B. (2002). Fractured Shale-Gas Systems. AAPG Bull. 86 (11), 1921–1938. doi:10.1306/61eeddbe-173e-11d7-8645000102c1865d
Espitalié, J., LaPorte, J. L., Madec, M., Marquis, F., LePlat, P., Paulet, J., et al. (1977). Méthode rapide de caractérisation des roches mètres, de leur potentiel pétrolier et de leur degré d'évolution. Rev. Inst. Fr. Pét. 32, 23–42. doi:10.2516/ogst:1977002
Gao, F., Song, Y., Li, Z., Xiong, F., Chen, L., Zhang, Y., et al. (2018). Lithofacies and Reservoir Characteristics of the Lower Cretaceous Continental Shahezi Shale in the Changling Fault Depression of Songliao Basin, NE China. Mar. Petroleum Geol. 98, 401–421. doi:10.1016/j.marpetgeo.2018.08.035
Gregg, S. J., and Sing, K. S. W. (1982). Adsorption, Surface Area, and Porosity, 2. New York: Academic Press, 312.
Groen, J. C., Peffer, L. A. A., and Pérez-Ramıirez, J. (2003). Pore Size Determination in Modified Micro- and Mesoporous Materials. Pitfalls and Limitations in Gas Adsorption Data Analysis. Microporous Mesoporous Mater. 60, 1–17. doi:10.1016/s1387-1811(03)00339-1
He, J., Wang, J., Yu, Q., Liu, W., Ge, X., Yang, P., et al. (2018). Pore Structure of Shale and its Effects on Gas Storage and Transmission Capacity in Well HD-1 Eastern Sichuan Basin, China. Fuel 226, 709–720. doi:10.1016/j.fuel.2018.04.072
Hu, Z. Q., Zhou, X. K., and Zhu, J. H. (2006). Hydrocarbon Generation Potential of Upper Paleozoic in Eastern Part of North China. Petroleum Explor. Dev. 35 (6), 697–701. (in Chinese with English abstract).
Huang, Z., Liu, G., Li, T., Li, Y., Yin, Y., and Wang, L. (2017). Characterization and Control of Mesopore Structural Heterogeneity for Low Thermal Maturity Shale: A Case Study of Yanchang Formation Shale, Ordos Basin. Energy fuels. 31, 11569–11586. doi:10.1021/acs.energyfuels.7b01414
Jarvie, D. M., Hill, R. J., Ruble, T. E., and Pollastro, R. M. (2007). Unconventional Shale-Gas Systems: the Mississippian Barnett Shale of North-Central Texas as One Model for Thermogenic Shale-Gas Assessment. Bulletin 91, 475–499. doi:10.1306/12190606068
Ji, W., Song, Y., Jiang, Z., Meng, M., Liu, Q., Chen, L., et al. (2016). Fractal Characteristics of Nano-Pores in the Lower Silurian Longmaxi Shales from the Upper Yangtze Platform, South China. Mar. Petroleum Geol. 78, 88–98. doi:10.1016/j.marpetgeo.2016.08.023
Jiang, F., Chen, D., Wang, Z., Xu, Z., Chen, J., Liu, L., et al. (2016). Pore Characteristic Analysis of a Lacustrine Shale: a Case Study in the Ordos Basin, NW China. Mar. Petroleum Geol. 73, 554–571. doi:10.1016/j.marpetgeo.2016.03.026
Jiang, Y. Q., Dong, D. Z., Qi, L., Shen, Y. F., Jiang, C., and He, F. W. (2010). The Basic Characteristic and Evaluation of Shale Reservoir. Nat. Gas. Ind. 30 (10), 7–12.
Kennedy, M. J., Pevear, D. R., and Hill, R. J. (2002). Mineral Surface Control of Organic Carbon in Black Shale. Science 295 (5555), 657–660. doi:10.1126/science.1066611
Kuang, H. W., Liu, Y. Q., Peng, X. B., Yang, F., Chen, M. P., Cen, C., et al. (2009). Sedimentary and Tectonic Features and Proto-Basin of Early Cretaceous Tanzhuang - Shenqiu Sag, Zhoukou Depression, in Southern Area of North China Craton. Geol. Rev. 55 (6), 801–813. (in Chinese with English abstract).
Kuila, U., Prasad, M., Derkowski, A., and McCarty, D. K. (2012). “Compositional Controls on Mudrock Pore-Size Distribution: An Example from Niobrara Formation,” in SPE Annual Technical Conference and Exhibition, San Antonio, Texas, USA, October 8–10, 2012, 160141.
Li, J., Wu, K., Chen, Z., Wang, W., Yang, B., Wang, K., et al. (2019). Effects of Energetic Heterogeneity on Gas Adsorption and Gas Storage in Geologic Shale Systems. Appl. Energy 251, 113368. doi:10.1016/j.apenergy.2019.113368
Li, P., Zhang, J. C., Tang, X., Huo, Z. P., Li, Z., Luo, K. Y., et al. (2020). Assessment of Shale Gas Potential of the Lower Permian Transitional Shanxi-Taiyuan Shales in the Southern North China Basin. Aust. J. Earth Sci. 68 (2), 262–284. doi:10.1080/08120099.2020.1762737
Li, S., and Yao, X. (2011). Discussion on Tectonic Evolution and Hydrocarbon Accumulation Upper Palaeozoic Formation in Northern Zhoukou Depression Belt. Fault block Oil &Gas Field 18 (5), 564–567. (in Chinese with English abstract).
Li, W. H., Chen, J. W., and Shao, J. (1996). Sedimentary Facies and Framework of the Lower Cretaceous Strata in the Zhoukou Depression. Sediment. facies Paleogeogr. 16 (1), 43–50. (in Chinese with English abstract).
Li, Y., and Ma, M. Y. (2013). Petrography and Diagenesis of Permian Sandstone Reservoirs in Zhoukou DepressionSouthern North China Basin. Petroleum Geol. Exp. 32 (4), 640–645. (in Chinese with English abstract).
Liu, E.-r., Shi, D. S., Shi, D.-s., Wang, Y.-h., Xu, Q.-c., Wang, B.-q., et al. (2020). Sequence Stratigraphic Framework and Sedimentary Model of Shanxi Formation in Northeast Zhoukou Depression of the North China Plate. China Geol. 3, 575–590. doi:10.31035/cg2020067
Liu, G., Zhai, G., Huang, Z., Zou, C., Xia, X., Shi, D., et al. (2019a). The Effect of Tuffaceous Material on Characteristics of Different Lithofacies: A Case Study on Lucaogou Formation Fine-Grained Sedimentary Rocks in Santanghu Basin. J. Petroleum Sci. Eng. 179, 355–377. doi:10.1016/j.petrol.2019.04.072
Liu, G., Zhai, G., Yang, R., He, T., and Wei, B. (2021). Quartz Crystallinity Index: New Quantitative Evidence for Biogenic Silica of the Late Ordovician to Early Silurian Organic-Rich Shale in the Sichuan Basin and Adjacent Areas, China. Sci. China Earth Sci. 64 (5), 773–787. doi:10.1007/s11430-020-9718-2
Liu, G., Zhai, G., Zou, C., Cheng, L., Guo, X., Xia, X., et al. (2019b). A Comparative Discussion of the Evidence for Biogenic Silica in Wufeng-Longmaxi Siliceous Shale Reservoir in the Sichuan Basin, China. Mar. Petroleum Geol. 109, 70–87. doi:10.1016/j.marpetgeo.2019.06.016
Liu, Z. W., Zhou, L. F., He, M. X., and Han, D. C. (2008b). Hydrocarbon Accumulation Conditions and Enrichment Controlling Factors of Premo-Carboniferous System in Zhoukou Depression. Petrolume Geol. Recovery Effic. 15 (5), 13–16. (in Chinese with English abstract).
Liu, Z. W., Zhou, L. F., and He, M. X. (2008a). Prospects for Coal-Formed Oil and Gas Exploration of Carboniferous-Permian Residual Basins in Zhoukou Depression. Xinjiang Pet. Geol. 29 (6), 699–702. doi:10.13673j.cnki.cn37-1359/te.2008.05.018 (in Chinese with English abstract).
Longhitano, S. G., Mellere, D., Steel, R. J., and Ainsworth, R. B. (2012). Tidal Depositional Systems in the Rock Record: A Review and New Insights. Sediment. Geol. 279, 2–22. doi:10.1016/j.sedgeo.2012.03.024
Mohammad, M. L., Reza, R., Ali, S., and Adnan, A. H. (2013). Evaluation of Pore Size Spectrum of Gas Shale Reservoirs Using Low Pressure Nitrogen Adsorption, Gas Expansion and Mercury Porosimetry: A Case Study from the Perthand Canning Basins, Western Australia. J. Petroleum Sci. Eng. 112 (12), 7–16. doi:10.1016/j.petrol.2013.11.022
Qi, H., Ma, J., and Wong, P. Z. (2002a). Adsorption Isotherms of Fractal Surfaces. Colloids Surf. 206 (1-3), 401–407. doi:10.1016/s0927-7757(02)00063-8
Quan, S. J., Rao, D., Kong, F. J., Liu, S. H., and Jiang, Y. F. (2002). Potential Analysis of the Upper Paleozoic Hydrocarbon Resources in the Zhoukou Depression. Petroleum Geol. Exp. 26 (6), 562–568. (in Chinese with English abstract).
Rani, S., Prusty, B. K., and Pal, S. K. (2015). Comparison of Void Volume for Volumetric Adsorption Studies on Shales from India. J. Nat. Gas Sci. Eng. 26, 725–729. doi:10.1016/j.jngse.2015.07.012
Rouquerol, F., Rouquerol, J., and Sing, K. (1999). Adsorption by Powders and Porous Solid: Principles, Methodology and Application. London: Academic Press.
Rouquerol, J., Avnir, D., Fairbridge, C. W., Everett, D. H., Haynes, J. M., Pernicone, N., et al. (1994). Recommendations for the Characterization of Porous Solids (Technical Report). Pure Appl. Chem. 66 (8), 1739–1758. doi:10.1351/pac199466081739
Sing, K. S. W. (1985). Reporting Physisorption Data for Gas/solid Systems with Special Reference to the Determination of Surface Area and Porosity (Recommendations 1984). Pure Appl. Chem. 57, 603–619. doi:10.1351/pac198557040603
Song, H. B., Li, Y. N., Yu, Z. F., Liu, S. X., Hu, B., and Li, Z. Y. (2018). Sedimentary Succession and Environment Evolution of the Taiyuan Formation in Northeastern Qinshui Basin, Shanxi Province. J. Palaeogeogr. Chin. Ed. 20 (4), 623–636. doi:10.7605/gdlxb.2018.04.045 (in Chinese with English abstract).
Su, J., Fan, D., Liu, J. P., and Wu, Y. (2020). Anatomy of the Transgressive Depositional System in a Sediment-Rich Tide-Dominated Estuary: The Paleo-Yangtze Estuary, China. Mar. Petroleum Geol. 121, 104588. doi:10.1016/j.marpetgeo.2020.104588
Sun, X. M., Zhang, M. S., Long, S. X., Hao, F. J., Liu, P. J., and Liu, C. Y. (2004). Overthrust Tectonic in Northern Qinling-Dabie Orogenic Belt and Basin-Controlling Faults in Zhoukou Depression and Hefei Basin. Oil&Gas Geol. 25 (2), 191–198. (in Chinese with English abstract). doi:10.11743/ogg20040213
Tan, J., Weniger, P., Krooss, B., Merkel, A., Horsfield, B., Zhang, J., et al. (2014). Shale Gas Potential of the Major Marine Shale Formations in the Upper Yangtze Platform, South China, Part II: Methane Sorption Capacity. Fuel 129, 204–218. doi:10.1016/j.fuel.2014.03.064
Tang, X., Jiang, Z., Li, Z., Gao, Z., Bai, Y., Zhao, S., et al. (2015). The Effect of the Variation in Material Composition on the Heterogeneous Pore Structure of High-Maturity Shale of the Silurian Longmaxi Formation in the Southeastern Sichuan Basin, China. J. Nat. Gas Sci. Eng. 23, 464–473. doi:10.1016/j.jngse.2015.02.031
Tian, H., Li, T., Zhang, T., and Xiao, X. (2016). Characterization of Methane Adsorption on Overmature Lower Silurian-Upper Ordovician Shales in Sichuan Basin, Southwest China: Experimental Results and Geological Implications. Int. J. Coal Geol. 156, 36–49. doi:10.1016/j.coal.2016.01.013
Unsworth, J. F., Fowler, C. S., and Jones, L. F. (1989). Moisture in Coal. Fuel 68 (1), 18–26. doi:10.1016/0016-2361(89)90005-7
Wang, J. X. (2018). Tidal Flat Sedimentary Characteristics of Silurian Gepingtage Formation in Tarim Basin. Northwest. Geol. 21 (02), 69–74. doi:10.19751j.cnki.61-1149/p.2018.02.010 (in Chinese with English abstract).
Wang, R., Shen, Y., Yang, C., Zhu, Z., Tan, M. L., Jiang, G., et al. (2000). The Surface Tension of Liquid Gases of Low Boiling Point. Chin. J. Chem. Phys. 13 (3), 380–384. doi:10.3969/j.issn.1674-0068.2000.03.023
Ward, S. L., Scourse, J. D., Yokoyama, Y., and Neill, S. P. (2020). The Challenges of Constraining Shelf Sea Tidal Models Using Seabed Sediment Grain Size as a Proxy for Tidal Currents. Cont. Shelf Res. 205, 104165. doi:10.1016/j.csr.2020.104165
Wu, S. T., Zhu, R. K., Cui, J. W., Mao, Z. G., Liu, K. Y., and Wang, X. Q. (2020). Ideas and Prospect of Porous Structure Characterization in Unconventional Reservoirs. Geol. Rev. 66 (s1), 151–154.
Wu, Y., Lin, C., Yan, W., Liu, Q., Zhao, P., and Ren, L. (2020). Pore-scale Simulations of Electrical and Elastic Properties of Shale Samples Based on Multicomponent and Multiscale Digital Rocks. Mar. Petroleum Geol. 117, 104369. doi:10.1016/j.marpetgeo.2020.104369
Wu, Y., Tahmasebi, P., Lin, C., and Dong, C. (2020). A Comprehensive Investigation of the Effects of Organic-Matter Pores on Shale Properties: A Multicomponent and Multiscale Modeling. J. Nat. Gas Sci. Eng. 81, 103425. doi:10.1016/j.jngse.2020.103425
Wu, Y., Tahmasebi, P., Lin, C., and Dong, C. (2020). Process-based and Dynamic 2D Modeling of Shale Samples: Considering the Geology and Pore-System Evolution. Int. J. Coal Geol. 218, 103368. doi:10.1016/J.COAL.2019.103368
Wu, Y., Tahmasebi, P., Lin, C., Munawar, M. J., and Cnudde, V. (2019). Effects of Micropores on Geometric, Topological and Transport Properties of Pore Systems for Low-Permeability Porous Media. J. Hydrology 575, 327–342. doi:10.1016/j.jhydrol.2019.05.014
Wu, Y., Tahmasebi, P., Lin, C., Ren, L., and Dong, C. (2019). Multiscale Modeling of Shale Samples Based on Low- and High-Resolution Images. Mar. Petroleum Geol. 109, 9–21. doi:10.1016/j.marpetgeo.2019.06.006
Wu, Y., Tahmasebi, P., Lin, C., Zahid, M. A., Dong, C., Golab, A. N., et al. (2019). A Comprehensive Study on Geometric, Topological and Fractal Characterizations of Pore Systems in Low-Permeability Reservoirs Based on SEM, MICP, NMR, and X-Ray CT Experiments. Mar. Petroleum Geol. 103, 12–28. doi:10.1016/j.marpetgeo.2019.02.003
Xu, Y. Q., He, Y. H., Chen, X. D., Wang, J. W., Yang, H. M., and Zhu, Y. S. (2019). Characteristics of Microscopic Pore Throats and Their Influence on Physical Properties of the Chang7 Tight Reservoir in the Longdong Area; Ordos Basin. Geol. Explor. 55 (3), 0870–0881. doi:10.12134/j.dzykt.2019.03.019
Yang, F., Ning, Z., and Liu, H. (2014). Fractal Characteristics of Shales from a Shale Gas Reservoir in the Sichuan Basin, China. Fuel 115, 378–384. doi:10.1016/j.fuel.2013.07.040
Yao, S. L., Qin, S. G., Wang, G. H., Li, Z. P., and Yu, L. J. (2012). “Multifractal Fractal Characteristics of the Heterogeneous Pore Distribution of Cores,” in International Conference on Computer Distributed Control and Intelligent Enviromental Monitoring, Zhangjiajie, Hunan China, Mar. 5 2012 to Mar. 6 2012 (IEEE Computer Soc.), 424–427.
Zeng, F., Dong, C., Lin, C., Tian, S., Wu, Y., Lin, J., et al. (2022). Pore Structure Characteristics of Reservoirs of Xihu Sag in East China Sea Shelf Basin Based on Dual Resolution X-Ray Computed Tomography and Their Influence on Permeability. Energy 239, 122386. doi:10.1016/j.energy.2021.122386
Zeng, F., Dong, C., Lin, C., Wu, Y., Tian, S., Zhang, X., et al. (2021). Analyzing the Effects of Multi-Scale Pore Systems on Reservoir Properties-A Case Study on Xihu Depression, East China Sea Shelf Basin, China. J. Petroleum Sci. Eng. 203, 108609. doi:10.1016/j.petrol.2021.108609
Zhai, C. B., Huang, Z. G., and Lin, L. B. (2005). Structure and Petroleum Analysis of the Tanzhuang - Shenqiu Sag in the South of North China Basin. Petroleum Geol. Exp. 27 (4), 353–359. (in Chinese with English abstract).
Zhang, T., Ellis, G. S., Ruppel, S. C., Milliken, K., and Yang, R. (2012). Effect of Organic-Matter Type and Thermal Maturity on Methane Adsorption in Shale-Gas Systems. Org. Geochem. 47, 120–131. doi:10.1016/j.orggeochem.2012.03.012
Zhang, X. Y., Guo, H. K., Shen, R., Ren, H. C., and Luo, Y. C. (2021). Research Progress of Pore Structure Characterization Technology for Shale Oil and Gas Reservoirs. Appl. Chem. Ind. 50 (02), 444–449. doi:10.3969/j.issn.1671-3206.2021.02.037
Zhao, K. D., Fu, X. H., Zhang, M., Cheng, W. P., and Qu, L. Z. (2019). Evaluation of Organic Geochemical Characteristics and Hydrocarbon Generation Potential of Coal Measure Mud Shale. Coal Sci. Technol. 47 (11), 182–188. (in Chinese with English abstract).
Zhao, X. Y., Zhao, S., Ye, C., and Wang, D. L. (2017). Study on Multi-Stages Structural Styles in Eastern Zhoukou Depression. China Energy Environ. Prot. 39 (8), 44–49. (in Chinese with English abstract).
Zhou, S., Xue, H., Ning, Y., Guo, W., and Zhang, Q. (2018). Experimental Study of Supercritical Methane Adsorption in Longmaxi Shale: Insights into the Density of Adsorbed Methane. Fuel 211, 140–148. doi:10.1016/j.fuel.2017.09.065
Zhou, S., Zhang, D., Wang, H., and Li, X. (2019). A Modified BET Equation to Investigate Supercritical Methane Adsorption Mechanisms in Shale. Mar. Petroleum Geol. 105, 284–292. doi:10.1016/j.marpetgeo.2019.04.036
Keywords: Zhoukou Depression, Shanxi Formation, pore structural heterogeneity, fractal dimension, specific surface area
Citation: Liu E, Liu C, Shi D, Zhu D, Xu Q and Wang Y (2022) Characterization and Control of Pore Structural Heterogeneity for Low-Thermal-Maturity Shale: A Case Study of the Shanxi Formation in the Northeast Zhoukou Depression, Southern North China Basin. Front. Earth Sci. 10:943935. doi: 10.3389/feart.2022.943935
Received: 14 May 2022; Accepted: 06 June 2022;
Published: 18 July 2022.
Edited by:
Yuqi Wu, China University of Petroleum (East China), ChinaReviewed by:
Guo Xiaobo, Xi’an Shiyou University, ChinaGuoheng Liu, China University of Petroleum East China, China
Pengfei Wang, China Geological Survey, China
Copyright © 2022 Liu, Liu, Shi, Zhu, Xu and Wang. This is an open-access article distributed under the terms of the Creative Commons Attribution License (CC BY). The use, distribution or reproduction in other forums is permitted, provided the original author(s) and the copyright owner(s) are credited and that the original publication in this journal is cited, in accordance with accepted academic practice. No use, distribution or reproduction is permitted which does not comply with these terms.
*Correspondence: Chenglin Liu, bGl1Y2xAY3VwLmVkdS5jbg==