- 1China Electronic Technology Group Corporation, Glarun Group Co., Ltd., Nanjing, China
- 2Nanjing Joint Institute for Atmospheric Sciences, Nanjing, China
- 3State Key Laboratory of Severe Weather, Chinese Academy of Meteorological Sciences, Beijing, China
- 4Department of Atmospheric and Oceanic Sciences, Fudan University, Shanghai, China
- 5National Meteorological Center, Beijing, China
In this study, a sensitivity experiment based on a numerical model is conducted to study the influence of the diurnal variation of radiation on the rapid intensification process of Super Typhoon Rammasun (1409) in the South China Sea. The result shows that changing the radiation process can change the onset time of the rapid intensification process of the typhoon and its maximum intensity. Vertical wind shear is a key factor in the TC rapid intensification influenced by diurnal radiation cycle, and the diurnal variation of radiation process causes obvious diurnal variation in vertical wind shear by changing the thermal difference between sea and land. The oscillation of vertical wind shear promotes the diurnal variation of the typhoon rainband, with an opposite variation trend in the control and sensitivity experiments, affecting the local convective available potential energy and inward transport of entropy and thus influencing the onset time of deep convective in the typhoon inner core region. By changing the establishment of the typhoon warm core (especially the upper-level warm core), deep convections finally affect the rapid intensification of the typhoon.
1 Introduction
The diurnal variation of radiation can affect the structure and intensity of tropical cyclones (TCs). It has been found that TC clouds and convection are active in the morning and inactive in the evening when the TC is offshore (Kossin 2002; Dunion et al., 2014). Shu et al. (2013) found that 70% of TC precipitation in the Northwest Pacific exhibits diurnal variability, with the precipitation peak occurring at 06:00 a.m. (local time), which is particularly pronounced during the TC weakening stage. This diurnal variation feature is also influenced by the underlying surface, with the precipitation peak advancing to midnight as the TC moves inland (Bowman et al., 2015). In addition, the diurnal variation amplitude of the precipitation in the outer region of the typhoon is larger than that of the inner-core precipitation (Hu et al., 2017). Zhang and Xu (2022) revealed that the TC clouds and the diurnal variation of the TC precipitation have outward propagation characteristics, and they are coupled with deep convections.
In addition to typhoon precipitation, the diurnal variation of radiation may affect the TC intensification process. Yaroshevich and Ingel (2013) found that the TC intensification rate in the Northwest Pacific is greater at night than that in the daytime. Sun et al. (2021) counted the number of typhoon convection overshooting in satellite images. They found that the deep convection of strong typhoons and rapidly intensifying typhoons are more active than that of general typhoons, and this deep convection phenomenon is usually stronger in the morning and weaker in the evening. Melhauser and Zhang (2014) investigated the effects of diurnal variations in humidity and radiation on the TC intensity by using numerical simulation, and they suggested that the increased atmospheric static instability due to radiative cooling at night contributed to the TC intensification. Tang and Zhang (2016) proposed that the radiative cooling at night increases ambient relative humidity and atmospheric instability, which promotes active convection at night. On the contrary, the radiative heating near the sea surface during the daytime results in an inversion layer at lower levels and a further reduction in the sea surface heat flux, thereby suppressing convective activity. However, Duran and Molinari (2016) did not find diurnal variations in mean static stability based on an observational study. They also proposed that in terms of mature TCs, the Richardson number at the upper layers is small in the early morning due to radiative cooling and troposphere elevation, which can reduce the upper-level stability and promote convection. Therefore, studies on the influence mechanism of the diurnal variation of radiation on the TC intensity and structure need to be more in-depth.
The above studies prove that TC structure and intensity are obviously influenced by the diurnal variation of radiation. Currently, most studies focused on the impact on typhoons in the thermal perspective, i.e., the effects of environmental factors such as temperature and humidity variations on typhoons caused by the diurnal variation of radiation. Fewer studies were conducted on the influence mechanism of the diurnal variation of radiation on the typhoons in terms of dynamic factors, especially for offshore rapidly intensifying typhoons. The super typhoon Rammasun (1409) underwent rapidly intensification in the northern South China Sea in monsoon season. The monsoon flow not only provided abundant moisture transport but also changed the vertical wind shear which is the important dynamic environment factor for TC intensity change. In this research, we use numerical simulation to study the influence mechanism of the diurnal variation of radiation on the rapid intensification process of Typhoon Rammasun focusing on the dynamical factors. The remainder of this paper is organized as follows. Section 2 briefly introduces the data and methods used in this study. Section 3 presents the result analysis. The main conclusion are shown in Section 4.
2 Data and methods
2.1 Case overview
Super Typhoon Rammasun (1409) in 2014 is selected as a study case. This typhoon was generated in the western North Pacific Ocean and moved westward. At 09:00 UTC on July 15, it landed in the central Philippines as a super typhoon. At 00:00 UTC on July 16, Typhoon Rammasun entered the South China Sea. Typhoon Rammasun strengthened again in the north of the South China Sea, about 500 km far from Hainan Island, with the maximum wind speed increasing from 95 kt to 140 kt within 24 h, meeting the rapidly intensifying standard of typhoons (i.e., 30 kt per 24 h defined by Kaplan and DeMaria, 2003) and reaching the maximum intensity in its lifecycle before landing on Hainan. According to the records of the Joint Typhoon Warning Center (JTWC), the maximum near-surface wind speed of Typhoon Rammasun reached 140 kt (72 m/s), and the central minimum surface pressure was 918 hPa. Hence, Typhoon Rammasun is the strongest typhoon in 2014, and it is also the strongest landing typhoon in China since 1973 (Wang et al., 2019).
2.2 Model and data
The model used in this study is the Typhoon Regional Assimilation and Prediction System developed by the Chinese Academy of Meteorological Sciences. This system adds a dynamic initialization scheme based on the Advanced Research Weather Research and Forecasting (WRF-ARW) model (Liu et al., 2018). In the control experiment, the model adopts a three-nested grid with horizontal resolutions of 18 km × 18 km, 6 km × 6 km, and 2 km × 2 km and grid points of 310 × 250, 270 × 270, and 210 × 210. Among them, the second and third nested grids are mobile nests. The number of vertical layers in the model is 50, and the model top is at 10 hPa. The physical schemes used in this system include the Kain-Fritsch cumulus convective parameterization scheme (Kain, 2004), WRF Single-Moment 6-class cloud microphysics scheme (Hong and Lim, 2006), Bougeault and Lacarrere boundary layer scheme (Bougeault and Lacarrere, 1989) and Dudhia radiation scheme (Dudhia, 1989). Note that the cumulus convective parameterization scheme is only used in the first nest. The simulation period of control experiment is from 00:00 UTC on July 16 to 00:00 UTC on July 19. The initial and boundary conditions used in this system are obtained from the Final analysis data of the global forecast system released by the National Centers for Environmental Prediction.
2.3 Sensitivity experiment
A sensitivity experiment is performed as a comparison of the control experiment. In the sensitivity experiment, the model initiation file’s time is modified from 00:00 UTC on July 16 to 12:00 UTC on July 16, delayed for 12 h, while the initial field, boundary conditions and physical schemes are set the same as in the control experiment. Therefore, the differences between the control and sensitivity experiments are the 12-h difference in the initiation time and the radiation conditions, i.e., the difference between the two experiments only comes from the diurnal variation of radiation. Note that the surface sea temperature is not changed in two sensitivity experiments since the model is initialized and running using the daily-observed surface sea temperature, which eliminates the differences induced by the underlying surface.
3 Result analysis
3.1 Track and intensity of Typhoon Rammasun
The simulations of the TC track and intensity (Figure 1) show that the simulated track is slightly more southward in the sensitivity experiment than in the control experiment. However, both the simulated tracks are highly consistent with the JTWC best-track data, indicating less variation in the steering flow. In terms of the TC intensity, the rapid intensification of the TC occurs earlier in the sensitivity experiment than in the control experiment, and the intensification rate after 30-h integration is markedly larger in the sensitivity experiment than that in the control experiment. The final sea level pressure in the sensitivity experiment is lower than that in the control experiment by about 20 hPa. Therefore, altering the radiation condition alone can change the TC intensification process noticeably.

FIGURE 1. The simulated (A) track and (B) intensity change. “CONL” and “EXP12” denote simulations from the control and sensitivity experiments, respectively, “Besttrack” indicates observations from the joint typhoon warning center tropical cyclone best-track data.
3.2 Inner-core structure of the typhoon
The difference of the TC intensification process is related to the inner-core structure of the typhoon. The warm-core temperature anomalies are obtained by subtracting the average temperature within a 500-km radius from the average temperature within a 10-km radius near the TC center. Comparing the variation of the warm-core temperature anomalies with height and time, we find a vertical double warm-core structure in both the control and sensitivity experiments (Figures 2A,B). The low-level warm-core height is about 6 km, and the upper-level warm-core height is about 15 km. The warm-core temperature anomalies are higher in the sensitivity experiment than in the control experiment, and this phenomenon is consistent with the difference in TC intensity between the two experiments. Moreover, the upper-level warm core in the sensitivity experiment is established much rapidly than in the control experiment. In sensitivity experiment, the temperature anomaly at 16 km altitude increases rapidly from ∼5 K at 30 h to more than 12 K at 36 h while increases to 8 K at 36 h in control simulation. The development of upper-level warm core is conductive to the rapid decrease of the pressure in the TC center.
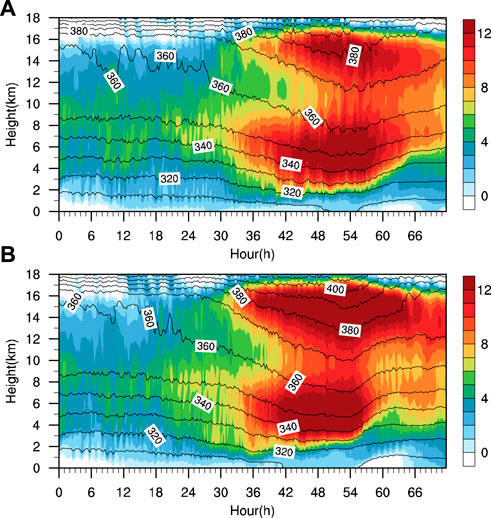
FIGURE 2. Comparison of the warm-core structure in the (A) control and (B) sensitivity experiments. Colored areas present the warm-core temperature anomalies, and contours denote the average potential temperature in the region within a 10 km radius from the TC center (Unit: K).
To study the relationship between the surface pressure and ware-core structure, we introduce the following equation (Eq. 1).
where
The diagnosis is performed by using Eq. 1. The temperature and pressure perturbations are defined as the average value in the region within a 10 km radius from the TC center minus the average value in the region within a 500 km radius. For the Hybrid diagnosis, the temperature perturbation below 10 km height from the warm core structure uses the results from the control experiment, and temperature perturbation above 10 km height is the results from the sensitivity experiment.
Figure 3 indicates that the diagnostic equation (Eq. 1) can well reproduce the rapidly intensifying process of the TC compared with the simulations (the control and sensitivity experiments). The diagnostic surface pressure perturbation is higher than the simulations. Overall, the warm-core structure is the main reason for the decrease of surface pressure in the TC center since the diagnostic results are highly consistent with the model simulations in both the control and sensitivity experiments. The Hybrid diagnostic result is almost consistent with the rapid intensification in the sensitivity experiment, demonstrating that the advance establishment of the upper-level warm core is the main reason for the advance occurrence of the TC rapid intensification in the sensitivity experiment.
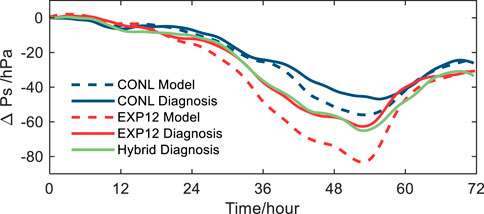
FIGURE 3. The diagnosis of the relationship between the warm core and decrease in the surface pressure. The solid lines indicate the Hybrid diagnostic results (green) and the diagnostic results from the control (CONL; blue) and sensitivity (EXP12; red) experiments, and the dashed lines denote the numerical simulations from the control (CONL; blue) and sensitivity (EXP12; red) experiments.
The formation of upper-level warm core is mainly associated with descending airflow. The overflow from the inner-core convective bursts sinking along the typhoon eyewall plays a key role in establishing the upper-level warm core (Chen and Zhang 2013).
In this study, convective burst is defined as the maximum vertical velocity exceeding 7.5 m s−1 at 2–12 km altitude (Wang and Wang 2014). In addition, we count the number of grid points satisfying the definition of the convective burst within the TC core area. Figure 4 shows the number distribution of the convective bursts. The maximum wind speed radii at 2 and 8 km altitudes show decreasing trends during the TC intensification stage (integration of 24–36 h). Convective bursts are mainly near the maximum wind speed radius at 8 km altitude, especially during the rapid intensification stage of the TC. Convective bursts in the control experiment start to increase after about 30-h integration, while in the sensitivity experiment, convective bursts start to be active after 24-h integration, earlier than that in the control experiment. The development of the upper-level warm core lags behind the convective bursts, and the enhancement process of the upper-level warm core in the control experiment also occurs with a lag compared with that in the sensitivity experiment. Therefore, it can be assumed that the earlier occurrence of convective bursts in the sensitivity experiment leads to the establishment of the upper-level warm core in advance, which contributes to the earlier occurrence of the TC intensification process.
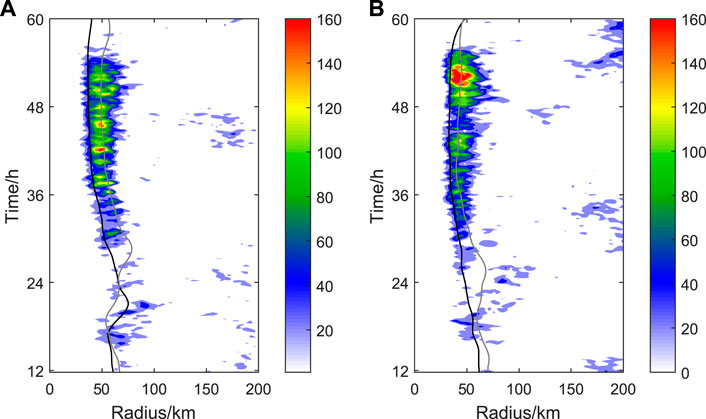
FIGURE 4. Convective burst number (colored area) and maximum wind speed radius (line) in the (A) control and (B) sensitivity experiments. Black and gray lines indicate the maximum wind speed radius at 2 and 8 km altitudes, respectively.
From the evolution of the radar reflectivity at 1 km altitude (Figure 5), it is noted that for the 72-h simulation, the rainband simulated in the control experiment shows three active periods, i.e., at 18–30 h and 42–54 h of integration and after 66 h of integration, with a cycle of about 24 h. The rainband simulated in the sensitivity experiment is active at 30–42 h and 54–66 h of integration, with a cycle also approximating 24 h. The time difference in the active rainband between the two experiments is about 12 h, suggesting that the activity of the rainband has an obvious diurnal variation feature, which may be influenced by the radiation process.
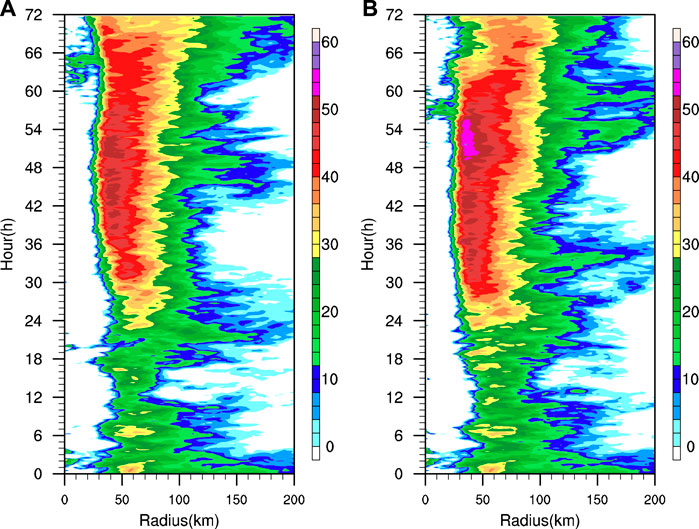
FIGURE 5. Radius-time profiles of the radar echo at 1 km altitude in the (A) control and (B) sensitivity experiments.
The TC rainband activities from both the control experiment and sensitivity experiment (Figure 6, at 6-h intervals) show an obvious diurnal variation feature, i.e., they are most active in the early morning (Figures 6A,E,H) and the weakest in the evening (Figures 6C,F,J), which is consistent with the finding of previous studies (Kossin 2002; Dunion et al., 2014; Sun et al., 2021). In the control experiment, the outer rainband is in the weakening stage at 30–36 h of integration when the inner-core convective bursts start to be active near the maximum wind speed radius (Figure 3A).
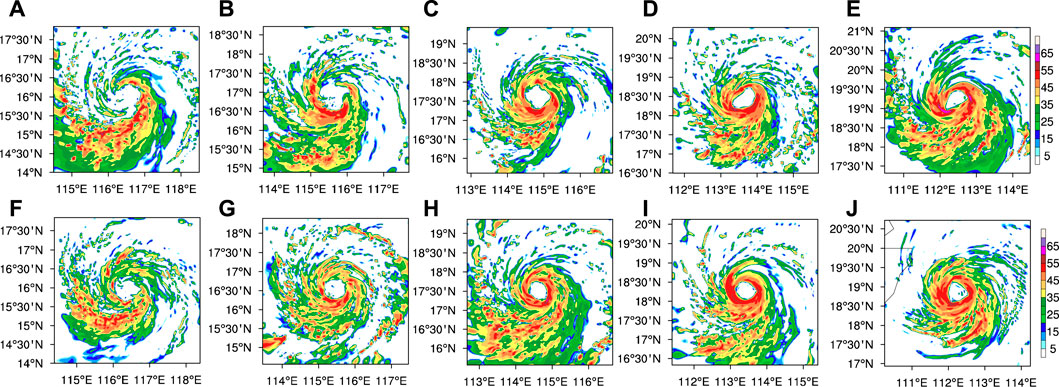
FIGURE 6. Radar reflectivity at 1 km altitude from 24-h integration to 48-h integration in the (A–E) control and (F–J) sensitivity experiments (Unit: dBZ) with time interval of 6 h.
Wang and Wang (2014) found a close relationship between convective bursts and the low-level slantwise convective available potential energy (SCAPE) through numerical simulations of Typhoon Megi (1013). Since the conventional convective available potential energy (CAPE) is integrated along the vertical direction, and the path of upward motion of air particles is slantwise, the CAPE of the mature TC may be underestimated. The calculation of the SCAPE is similar to that of the CAPE, except that the integration of the SCAPE is performed along the isometric angular momentum line, which is consistent with the outward-inclined feature of the eyewall of the mature TC.
In Figure 7, it can be found that a large amount of energy is accumulated in the TC eyewall region between 6 and 33 h of integration. As the TC intensity increases, the eye region is gradually controlled by descending airflow after 36 h of integration, and the SCAPE decreases, while the subsidence warming leads to the enhancement of the warm core (Figure 2). Note that the SCAPE in the eyewall area at 6–18 h of integration in both the control and sensitivity experiments shows an increasing trend, and the large-value range of the SCAPE expands outward with time. In addition, the SCAPE outside the eyewall area has diurnal variation characteristics. For example, the SCAPE in the control experiment shows a complete trend of decreasing and then increasing at 18–42 h of integration.
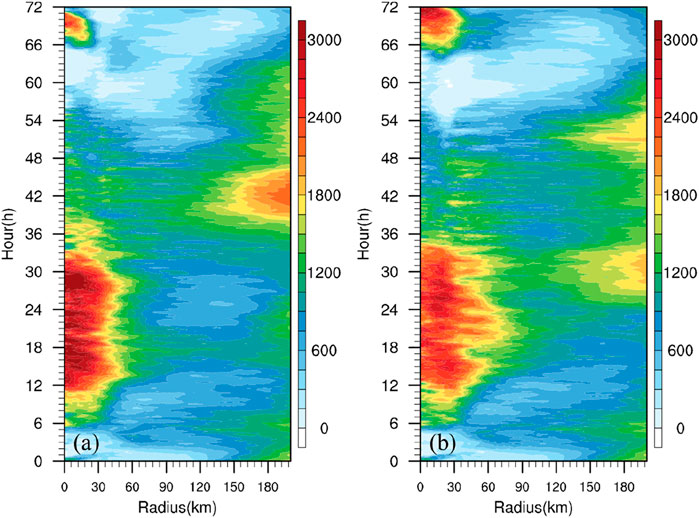
FIGURE 7. Radius-time profiles of the slantwise convective available potential energy (SCAPE) in the (A) control and (B) sensitivity experiment.
Li and Wang (2012) proposed that the CAPE is consumed during rainband active period and recovers in the boundary layer during the rainband inactive period, and the cycle of this CAPE variation process is about 24 h. However, there is no diurnal variation of radiation in Li and Wang (2012), and unlike in the present study, their 24–h cycle is due to the internal dynamics of TCs. That means the diurnal variation of TC may be a combination of external forcing and internal factors.
In the control experiment, the SCAPE decreases rapidly in the area outside the 80 km radius from the TC center at 18–30 h of integration (corresponding to the rainband active period; Figure 5). However, the SCAPE in the sensitivity experiment is in the accumulation phase in the above area and period (Figure 7B), which corresponds to the rainband inactive period in the sensitivity experiment, indicating that the rainband activity can consume local SCAPE. According to Gu et al. (2015), the rainband convections which is induced by strong VWS will lead to downdraft bringing middle-level low-entropy air into boundary layer and may transport low moist enthalpy inward which is negative to deep convections within eyewall.
The previous study indicated that the ambient energy transport has an important supporting role for the inner-core convection, considering that the convection in the eyewall and inner-core areas requires energy consumption (Zhang et al., 2017). Due to consuming SCAPE, the outer rainband activity is detrimental to the inner-core convection. On the one hand, the rainband convection activity consumes local energy, and thus it reduces energy transport, which can suppress deep convections within the inner-core area. On the other hand, the dry and cold descending airflow brought by convection enters the boundary layer, further reducing the SCAPE and the energy transport into the inner-core area. Therefore, in the control experiment, the rainband is inactive after 30 h of integration, and the SCAPE recovers before the convective bursts near the maximum wind speed radius. In contrast, in the sensitivity experiment, because the rainband is inactive at 18–30 h of integration, the convective bursts increase after 24 h of integration, earlier than that in the control experiment, prompting the earlier establishment of the warm core.
In summary, the rainband activity cycles in the control and sensitivity experiments are about 24 h, while the rainband active period in the control experiment is about 12 h earlier than that in the sensitivity experiment. During 18–30 h of integration, the rainband is in the active period in the control experiment, leading to energy consumption. However, the rainband in the sensitivity experiment is inactive during this period. The active rainband can consume the local SCAPE, which is not conducive to the energy transport to the inner-core area, thus suppressing the inner-core convective bursts in the control experiment. The deep convective bursts in the sensitivity experiment are earlier than those in the control experiment, eventually leading to an earlier establishment of the upper-level warm core, the occurrence of TC rapid intensification in advance and the stronger maximum TC intensity.
3.3 Environmental field analysis
Previous studies demonstrated that the outer rainband activity is closely associated with environmental factors, among which vertical wind shear is considered to promote rainband activities, especially in the left quadrant of the downshear (Reasor et al., 2013; Gu et al., 2015). Vertical wind shear favors low-level inflow on the downshear side and low-level outflow on the upshear side. In this study, the ambient vertical wind shear is defined as the difference of the average wind velocity between 200 hPa and 850 hPa within the range of 200–800 km radius from the TC center, and its evolution is shown in Figure 8. The TC ambient vertical wind shear in the sensitivity experiment before 12 h of integration is almost identical to that in the control experiment because the initial fields are the same in the two experiments. In the control experiment, the ambient vertical wind shear starts to enhance in the late night under the influence of radiation forcing and reaches the maximum value in the early morning, with an obvious diurnal variation. The variation trend of the ambient vertical wind shear in the sensitivity experiment is opposite to that in the control experiment after 12 h of integration. When the ambient vertical wind shear enhances (24–36 h of integration in the sensitivity experiment), the rainband is active during the period (Figure 6). Thus, the diurnal variation of the ambient vertical wind shear influences the diurnal variation of the rainband, further affecting the variation of the TC intensity.
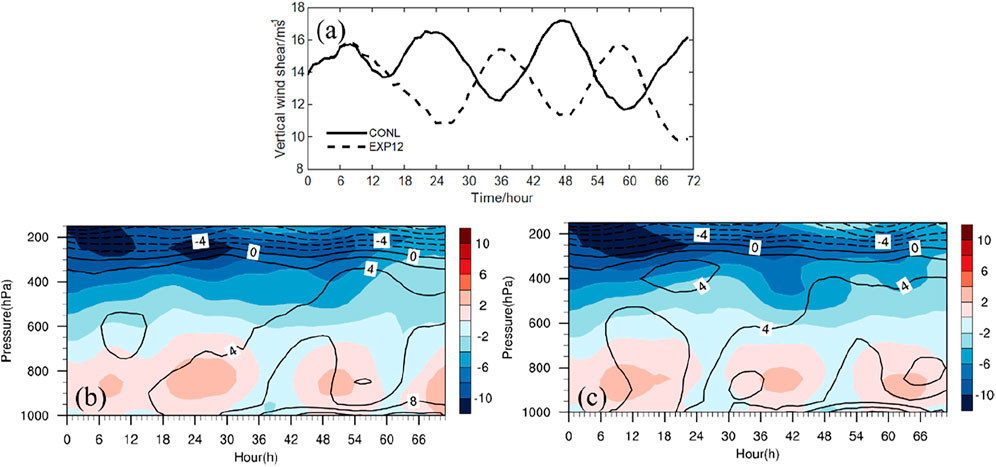
FIGURE 8. (A) Time series and pressure-time profiles of the ambient vertical wind shear in the control (B) and sensitivity experiments (C). “CONL” and “EXP12” in Figure 8A denote the results from the control and sensitivity experiments, respectively, and the colored areas and contours in Figures 8B,C indicate the ambient zonal wind and meridional wind, respectively.
Moreover, the average vertical wind shear in the sensitivity experiment is smaller than that in the control experiment, which can partially explain the stronger TC intensity in the sensitivity experiment than that in the control experiment.
To further investigate the variation of vertical wind shear, we analyze the ambient zonal wind and average meridional wind within the radius range of 200–800 km from the TC center. The diurnal variation of vertical wind shear is mainly contributed by the large variations of ambient zonal wind and meridional wind at low level (850 hPa). It is consistent with the observations in numerous studies (Terao et al., 2006; Chen et al., 2009; Chen and Zhang, 2013) which have indicated that the low-level southerly winds exhibit the strongest over southern China from midnight to predrawn. It is often explained by a combine of a clockwise rotation diurnally due to an inertial oscillation (Balckadar, 1957) and a planetary-scale land-sea breeze circulation produced by the couple of a diurnal change in pressure gradient induced by land-sea heating contrast (Holton, 1967) with the global-scale diurnal tide (Huang et al., 2010). Such breezes could cover ∼1000 km away from coastline of East Asia and always become the largest in the monsoon season (Chen and Zhang, 2013; Chen, 2020). Note that the typhoon Rammasun occurred in July over South China Sea where experienced the largest breezes accordingly.
4 Conclusion
In this study, two comparison experiments are performed by changing the radiation conditions in numerical models to demonstrate that the diurnal variation of radiation can greatly influence the rapidly intensifying process of TC and its structure. We analyze the diurnal variation of the ambient vertical wind shear, rainband activities and upper-level warm core, and we propose a new explanation for the influence of the diurnal variation of radiation on the structures and intensification processes of TCs in the perspective of a dynamic factor (vertical wind shear).
Overall, the thermal difference between land and sea caused by the diurnal variation of radiation results in variations in the offshore ambient vertical wind shear. During summer, the offshore ambient vertical wind shear reaches the maximum in the early morning and the minimum in the evening. This shear can stimulate variations in rainband activities of TCs, i.e., the rainband is active in the early morning and inactive in the evening. The active rainband consumes the local SCAPE outside the eyewall and reduces the energy transport to the inner core region, thus affecting the inner-core energy accumulation and suppressing the inner-core convective activities, which is not conducive to the establishment of TC warm core and affect the rapid intensification of TCs.
Unlike previous studies that focused on the influence of radiation on ambient thermal conditions, this study is based on a case in the perspective of dynamic factors. It is worth noting that the diurnal variation of radiation affects TC intensity and structure through the vertical wind shear only in the offshore region. Meanwhile, the diurnal variation process of radiation can also impact TCs by changing the thermal factors such as the ambient temperature and relative humidity. In offshore regions, the diurnal variations of both thermal and dynamical factors can influence TC activities, making TC intensity variations in offshore regions more complex and therefore requiring further investigation.
Data availability statement
The raw data supporting the conclusion of this article will be made available by the authors, without undue reservation.
Author contributions
XZ is the first author to make the main work of our research. NW is the corresponding author who provide the main idea of numerical model experiment and help to finish the manuscript. QW is the third author who help collect data and provide some advice to the paper.
Funding
This study is supported by the National Natural Science Foundation of China (42192554, 42175007), the National Key R&D Program of China (2020YFE0201900) and the program of an integrated platform for the integration of subjective and objective forecast in Meteorological Bureau of Jiangsu.
Conflict of interest
Author XZ was employed by the company China Electronic Technology Group Corporation, Glarun Group Co., Ltd.
The remaining authors declare that the research was conducted in the absence of any commercial or financial relationships that could be construed as a potential conflict of interest.
Publisher’s note
All claims expressed in this article are solely those of the authors and do not necessarily represent those of their affiliated organizations, or those of the publisher, the editors and the reviewers. Any product that may be evaluated in this article, or claim that may be made by its manufacturer, is not guaranteed or endorsed by the publisher.
References
Blackadar, A. K. (1957). Boundary-layer wind maxima and their significance for the growth of nocturnal inversions. Bull. Am. Meteorol. Soc. 38, 283–290. doi:10.1175/1520-0477-38.5.283
Bougeault, P., and Lacarrere, P. (1989). Parameterization of orography-induced turbulence in a mesobeta-scale model. Mon. Wea. Rev. 117, 1872–1890. doi:10.1175/1520-0493(1989)117<1872:pooiti>2.0.co;2
Bowman, K. P., and Fowler, M. D. (2015). The diurnal cycle of precipitation in tropical cyclones. J. Clim. 28 (13), 5325. doi:10.1029/2009jd012181
Chen, G. (2020). Diurnal cycle of the asian summer monsoon: Air pump of the second kind. J. Clim. 33 (5), 1747–1775. doi:10.1175/jcli-d-19-0210.1
Chen, G., Sha, W., and Iwasaki, T. (2009). Diurnal variation of precipitation over southeastern China: 2. Impact of the diurnal monsoon variability. J. Geophys. Res. 114, D21105.
Chen, H., and Zhang, D. L. (2013). On the rapid intensification of Hurricane Wilma (2005). Part II: Convective bursts and the upper-level warm core. J. Atmos. Sci. 70 (1), 146–162. doi:10.1175/jas-d-12-062.1
Dudhia, J. (1989). Numerical study of convection observed during the winter monsoon experiment using a mesoscale two-dimensional model. J. Atmos. Sci. 46, 3077–3107. doi:10.1175/1520-0469(1989)046<3077:nsocod>2.0.co;2
Dunion, J. P., Thorncroft, C. D., and Velden, C. S. (2014). The tropical cyclone diurnal cycle of mature hurricanes. Mon. Weather Rev. 142 (10), 3900–3919. doi:10.1175/mwr-d-13-00191.1
Duran, P., and Molinari, J. (2016). Upper-tropospheric low Richardson number in tropical cyclones: Sensitivity to cyclone Intensity and the diurnal cycle. J. Atmos. Sci., 73, 545–554. doi:10.1175/jas-d-15-0118.1
Gu, J-F., Tan, Z. M., and Qiu, X. (2015). Effects of vertical wind shear on inner-core thermodynamics of an idealized simulated tropical cyclone. J. Atmos. Sci. 72 (2), 511–530. doi:10.1175/JAS-D-14-0050.1
Hirschberg, P. A., and Fritsch, J. M. (1993). On understanding height tendency. Mon. Weather Rev. 121 (9), 2646–2661. doi:10.1175/1520-0493(1993)121<2646:ouht>2.0.co;2
Holland, G. J. (1997). The maximum potential intensity of tropical cyclones. J. Atmos. Sci. 54 (21), 2519–2541. doi:10.1175/1520-0469(1997)054<2519:tmpiot>2.0.co;2
Holton, J. R. (1967). The diurnal boundary layer wind oscillation above sloping terrain. Tellus 19, 199–205. doi:10.1111/j.2153-3490.1967.tb01473.x
Hong, S. Y., and Lim, J. O. J. (2006). The WRF single-moment 6-class microphysics scheme (WSM6). J. Korean Meteorological Soc. 42, 129–151.
Hu, H., Duan, Y., Wang, Y., and Zhang, X. (2017). Diurnal cycle of rainfall associated with landfalling tropical cyclones in China from rain gauge observations. J. Appl. Meteorology Climatol. 56 (9), 2595–2605. doi:10.1175/jamc-d-16-0335.1
Huang, W., Chan, J., and Wang, S. (2010). A planetary-scale land-sea breeze circulation in East Asia and the Western North Pacific. Q. J. R. Meteorol. Soc. 136, 1543–1553. doi:10.1002/qj.663
Kain, J. S. (2004). The Kain-Fritsch convective parameterization: An update. J. Appl. Meteor. 43, 170–181. doi:10.1175/1520-0450(2004)043<0170:tkcpau>2.0.co;2
Kaplan, J., and DeMaria, M. (2003). Large-scale characteristics of rapidly intensifying tropical cyclones in the north atlantic basin. Weather Forecast. 18, 1093–1108. doi:10.1175/1520-0434(2003)018<1093:lcorit>2.0.co;2
Kossin, J. P. (2002). Daily hurricane variability inferred from GOES infrared imagery. Mon. Weather Rev. 130 (9), 2260–2270. doi:10.1175/1520-0493(2002)130<2260:dhvifg>2.0.co;2
Li, Q., and Wang, Y. (2012). Formation and quasi-periodic behavior of outer spiral rainbands in a numerically simulated tropical cyclone. J. Atmos. Sci. 69, 997–1020. doi:10.1175/2011jas3690.1
Liu, Hao-Yan, Wang, Yuqing, Xu, Jing, and Duan, Yihong (2018). A dynamical initialization scheme for tropical cyclones under the influence of terrain. Weather Forecast. 33, 641–659. doi:10.1175/waf-d-17-0139.1
Melhauser, C., and Zhang, F. (2014). Diurnal radiation cycle impact on the pregenesis environment of Hurricane Karl (2010). J. Atmos. Sci. 71, 1241–1259. doi:10.1175/jas-d-13-0116.1
Reasor, P. D., Rogers, R., and Lorsolo, S. (2013). Environmental flow impacts on tropical cyclone structure diagnosed from airborne Doppler radar composites. Mon. Weather Rev. 141 (9), 2949–2969. doi:10.1175/mwr-d-12-00334.1
Shu, H., Zhang, Q., Xu, B., Steranka, J., Rodgers, E. B., and Gentry, R. C. (2013). Diurnal variation of tropical cyclone rainfall in the Western North Pacific in 2008–2010. Atmos. Ocean. Sci. Lett., 6, 103–108. doi:10.1080/16742834.2013.11447064
Stern, D. P., and Nolan, D. S. (2012). On the height of the warm core in tropical cyclones. J. Atmos. Sci. 69 (5), 1657–1680. doi:10.1175/jas-d-11-010.1
Sun, L., Tang, X., Zhuge, X., Tan, Z.-M., and Fang, J. (2021). Diurnal variation of overshooting tops in typhoons detected by Himawari-8 satellite. Geophys. Res. Lett. 48 (21). doi:10.1029/2021gl095565
Tang, X., and Zhang, F. (2016). Impacts of the diurnal radiation cycle on the formation, intensity, and structure of Hurricane Edouard (2014). J. Atmos. Sci. 73 (7), 2871–2892. doi:10.1175/jas-d-15-0283.1
Terao, T., Islam, M. N., Hayashi, T., and Oka, T. (2006). Nocturnal jet and its effects on early morning rainfall peak over northeastern Bangladesh during the summer monsoon season. Geophys. Res. Lett. 33, L18806. doi:10.1029/2006gl026156
Wang, H., and Wang, Y. (2014). A numerical study of Typhoon Megi (2010). Part I: Rapid intensification. Mon. Weather Rev. 142 (1), 29–48. doi:10.1175/mwr-d-13-00070.1
Wang, Qian, Xu, Yinglong, Wei, Na, Wang, Shuai, and Hu, Hao (2019). Forecast and service performance on rapidly intensification process of typhoons Rammasun (2014) and hato (2017). Trop. Cyclone Res. Rev. 8, 18–26. doi:10.1016/j.tcrr.2019.07.002
Yaroshevich, M. I., and Ingel, L. K. (2013). Diurnal variations in the intensity of tropical cyclones. Izv. Atmos. Ocean. Phys. 49, 375–379. doi:10.1134/s0001433813040117
Zhang, D. L., and Chen, H. (2012). Importance of the upper-level warm core in the rapid intensification of a tropical cyclone. Geophys. Res. Lett. 39. doi:10.1029/2011gl050578
Zhang, Xinghai, Duan, Yihong, Wang, Yuqing, Wei, Na, and Hu, Hao (2017). A high-resolution simulation of supertyphoon Rammasun (2014) — Part I: Model verification and surface energetics analysis. Adv. Atmos. Sci. 34 (6), 757–770. doi:10.1007/s00376-017-6255-7
Keywords: diurnal variations, South China sea, typhoon, rapid intensification, vertical wind shear
Citation: Zhang X, Wei N and Wang Q (2022) Influence of radiation diurnal variation on the rapid intensification process of super Typhoon Rammasun (1409) in the South China Sea. Front. Earth Sci. 10:940418. doi: 10.3389/feart.2022.940418
Received: 10 May 2022; Accepted: 13 July 2022;
Published: 10 August 2022.
Edited by:
Guihua Wang, Fudan University, ChinaReviewed by:
Lin Deng, Shanghai Typhoon Institute, China Meteorological Administration, ChinaYuanlong Li, Nanjing University, China
Ruifen Zhan, Fudan University, China
Copyright © 2022 Zhang, Wei and Wang. This is an open-access article distributed under the terms of the Creative Commons Attribution License (CC BY). The use, distribution or reproduction in other forums is permitted, provided the original author(s) and the copyright owner(s) are credited and that the original publication in this journal is cited, in accordance with accepted academic practice. No use, distribution or reproduction is permitted which does not comply with these terms.
*Correspondence: Na Wei, d2VpbmFAY21hLmdvdi5jbg==
 Xinghai Zhang
 Na Wei
 Qian Wang