 Zheng Cao
 Yingying Jiang2
95% of researchers rate our articles as excellent or good
Learn more about the work of our research integrity team to safeguard the quality of each article we publish.
Find out more
ORIGINAL RESEARCH article
Front. Earth Sci. , 15 July 2022
Sec. Quaternary Science, Geomorphology and Paleoenvironment
Volume 10 - 2022 | https://doi.org/10.3389/feart.2022.940212
This article is part of the Research Topic Trapped Charge Dating and Its Application in Geomorphological, Geological and Archaeological Studies in East Asia View all 15 articles
In provenance investigation of Quaternary sediments, quartz luminescence sensitivity (QLS) has been employed as a technique. The weathering and influence on the earliest signs of luminescence sensitivity of sedimentary quartz require more consideration. In this study, the QLS properties of eight samples of Permian biotite monzogranite from a borehole in the southern tropics of China are investigated. The degree of chemical weathering does not correspond with the QLS values of samples that have undergone varying degrees of in situ weathering. We hypothesize that the variation of the irradiation field during the in situ chemical weathering process may affect the QLS, but not considerably within 200 ka. In addition, we discovered that quartz from the same source undergoes varying degrees of in situ chemical weathering, but has a constant response to irradiation-bleaching cycles (IBCs). The presence of variances in the thermal activation curves (TACs) of the same rock body indicates that further research is required to apply TAC as a provenance indicator.
Thermoluminescence (TL) and optically stimulated luminescence (OSL) refers to light emission of semiconductors or insulating materials which could store energy in the crystal lattice and emit light under thermally or optically stimulated. TL and OSL have become powerful research tools in the fields of materials (Pires et al., 2011; Kalita et al., 2019; Ike et al., 2021), geosciences (Singhvi et al., 1982; Lai, 2006; Fuchs and Owen, 2008), and environmental and medical science (Higashimura et al., 1963; Yukihara and McKeever, 2008) in the past two decades. A wide range of natural and artificial materials have been used in the testing of TL and OSL. Quartz is the most prevalent mineral on the earth’s surface and has good resistance to weathering and so it is widely used in dosimetry and Quaternary geochronology. However, it was found that the luminescence sensitivity of quartz changed obviously during the dating protocol, which caused an inconsistent response of quartz to radiation dose. Although the change in luminescence sensitivity could be calibrated by a series of well-designed dating protocols, the single aliquot regenerative dose protocols (Murray and Wintle, 2000; Murray and Wintle, 2003), the mechanism is still unclear.
Many studies aiming to calibrate this phenomenon in the laboratory have demonstrated that variations in quartz luminescence sensitivity (QLS) are related to irradiation (Zimmerman, 1971; Benny et al., 2000), bleaching (Li and Wintle, 1992; Zhou and Wintle, 1994) and heating (Rendell et al., 1994; Bøtter-Jensen et al., 1995; Armitage et al., 2000). Extensive research shows the behaviors of quartz under laboratory conditions, but the reasons for these behaviors are still not clear. Meanwhile, studies focused on the effects of sedimentary transport processes and the characterization of source materials on the QLS have been developed. Aiming to discover and understand the relationships between QLS and the petrological background of quartz, studies have been undertaken in the following areas: the age of intrusive granite (Rink, 1994), crystallization temperature (Sawakuchi et al., 2011b), inclusions (Chauhan and Singhvi, 2019), thermal and sedimentary history (Preusser et al., 2006; Pietsch et al., 2008; Zheng et al., 2009; Fitzsimmons, 2011; Sawakuchi et al., 2011a; Lü and Sun, 2017; Sawakuchi et al., 2018; Chang and Zhou, 2019; Nian et al., 2019; Li and Zhou, 2020; Sawakuchi et al., 2020; Bartyik et al., 2021; del Río et al., 2021). These exploratory efforts have enhanced our understanding of QLS and expanded its application scenarios.
Many new discoveries have also emerged while exploring the QLS of diverse types of sediments, such as aeolian, fluvial and coastal sediments. Different deserts of northern China exhibit discrepancies in QLS and a decreasing trend from east to west, with one exception of the Gurbantunggut Desert (Li et al., 2007; Zheng et al., 2009; Lü and Sun, 2017). Vertical variations in QLS measured from loess-paleosol sequences show a good correlation with other proxies, such as median grain size and magnetic susceptibility, which may reflect climate change or sediment transport dynamic changes (Lü et al., 2014; Qiu and Zhou, 2015; Li and Zhou, 2020; Lü et al., 2020). With an increasing distance of fluvial sediment transportation, sensitizing QLS is observed by Pietsch et al. (2008) and Sawakuchi et al. (2011a), but this growing trend does not always persist. Sawakuchi et al. (2018) considered the QLS as a proxy for denudation rates in the Amazon basin rather than a proxy for transportation distance. In addition, studies using the thermal activation curve (TAC) of quartz to distinguish sediment sources have shown that it appears to be feasible (Chang and Zhou, 2019; Nian et al., 2019; Li and Zhou, 2020).
The variation and characterization of QLS in geological processes from protoliths to sediments requires a deeper and more detailed understanding before it can be applied to a broader range of scenarios. As an important part of the source–sink process, the influence of weathering or denudation on the QLS is still unclear. Previous research (Preusser et al., 2006; Pietsch et al., 2008; Fitzsimmons, 2011; Sawakuchi et al., 2011a; Sawakuchi et al., 2018; Nian et al., 2019; Bartyik et al., 2021; Nelson et al., 2022) have explored that the QLS signature will be modified during the transport process, which could impair the reliability of the QLS as a provenance proxy. However, their studies did not decouple the effects of weathering or denudation from those of transport processes. In this study, quartz extracted from the drill of southeastern China enduring intense in situ chemical weathering was evaluated to characterize quartz luminescence sensitivity. Additionally, the applicability of thermal activation curve (TAC) and irradiation-bleaching cycle (IBC) analysis in provenance tracing is discussed. This research has implications for understanding QLS changes caused by in situ chemical weathering, as well as evidence for determining whether QLS sensitizing process is dominant under natural conditions.
The borehole representing chemical weathering conditions is located in the southern part of Sanming city, the subtropical monsoon area of southeastern China, Fujian Province (117.448E, 26.006N). Since the study area is located at the convergence of trade winds and westerlies, the climate is controlled by the couplings of monsoon and subtropical highs. In general, the summer (May—September) climate character of the study area is hot and rainy, while it is warm and relatively dry in winter (December—January). The climate data for the study site are for the period 1981–2010 and are from the China Meteorological Data Service Centre (data.cma.cn). The annual average temperature in the Sanming area is 19.6°C, with extreme high temperatures reaching 41.4°C. The average number of days with maximum temperatures above 30°C over the years is 122.8. Precipitation is plentiful throughout the year, with an average annual precipitation of 1,665.2 mm and a maximum continuous precipitation (day) of 444 mm (15 days) over the years. In addition, the study area was also affected by typhoons in summer. All the above conditions resulted in a relative humidity reaching 78% in study area over the year. In summary, the Sanming area is a typical area of intense chemical weathering.
The study area is located in the western part of the Zhenghe-Dapu fault zone, which belongs to the northern end of the Yongmei sag. After the convergence of the Cathysia and Yangzi blocks as part of the Rodinia supercontinent in the early Neoproterozoic (Li et al., 2002), the study area gradually broke up into rift valleys or troughs during supercontinent rifting, and formed giant thick marine deposits during the late Neoproterozoic to Early Paleozoic (Shu, 2012; Shu et al., 2021). With the strong tectono-thermal events in South China during the Silurian, the sediments were deformed and uplifted by compression. At the same time, magmatic activity was frequent, forming a large number of S-type granites and fewer I-type granites (Shu, 2006). The super-thick dolomite and limestone from the Early Paleozoic until the Early Triassic reflect a slow south-to-north transgression (Zu et al., 2012). The study area received strong north-south extrusion during the Indo-Chinese period leading to crustal thickening, accompanied by large-scale magmatic activity (Zhang et al., 2009). During the Cretaceous period, the study area was characterized by three-stage tectono-thermal events and andesites and rhyolites caused by strong volcanic activities (Li et al., 2014). During the Cenozoic period, continuous subduction of the Pacific plate resulted in regional uplift and denudation of the study area (Bureau of Geology and Mineral Resources of Fujian Province, 1985).
In the study area the basement is covered by effusive rock strata and sedimentary rocks formed from Paleozoic to Cenozoic. Both strata and intrusive rocks have undergone intensive tectonic movements, resulting in unformed and discontinuous strata. The Quaternary strata are remnants of alluvium and floodplain, consisting of clay, sand, gravel and rock fragments, with uneven thickness distribution. The residual slope deposits are widely distributed in mountains, gullies and gentle hills, while the alluvial deposits are mainly distributed in river valleys. Small flat Quaternary terraces, small basins connected by the Shaxi River, and low hills constitute the main geomorphic type in the study region.
The drill was conducted by the Fujian Exploration Institute of Coalfield Geology, penetrated Quaternary sediments and regolith, finished in the body of Permian greyish medium-grained biotite monzogranite, at a depth of 18.1 m. According to the field work, the drill core was divided into 5 layers: I. human activities disturbed layer (0∼1.3 m); II. Quaternary sediments or residual soil layer (1.3∼2.9 m); III. completely weathered rock (2.9∼5.6 m); IV. highly weathered rock (5.6∼10.2 m); V. moderately weathered to fresh rock (10.2∼18.1 m). To avoid human interference or sediments from different sources, we sampled 8 weathered rocks from 3.5 to 18.0 m, and the specific positions are shown in the map on the top left of the Figure 1.
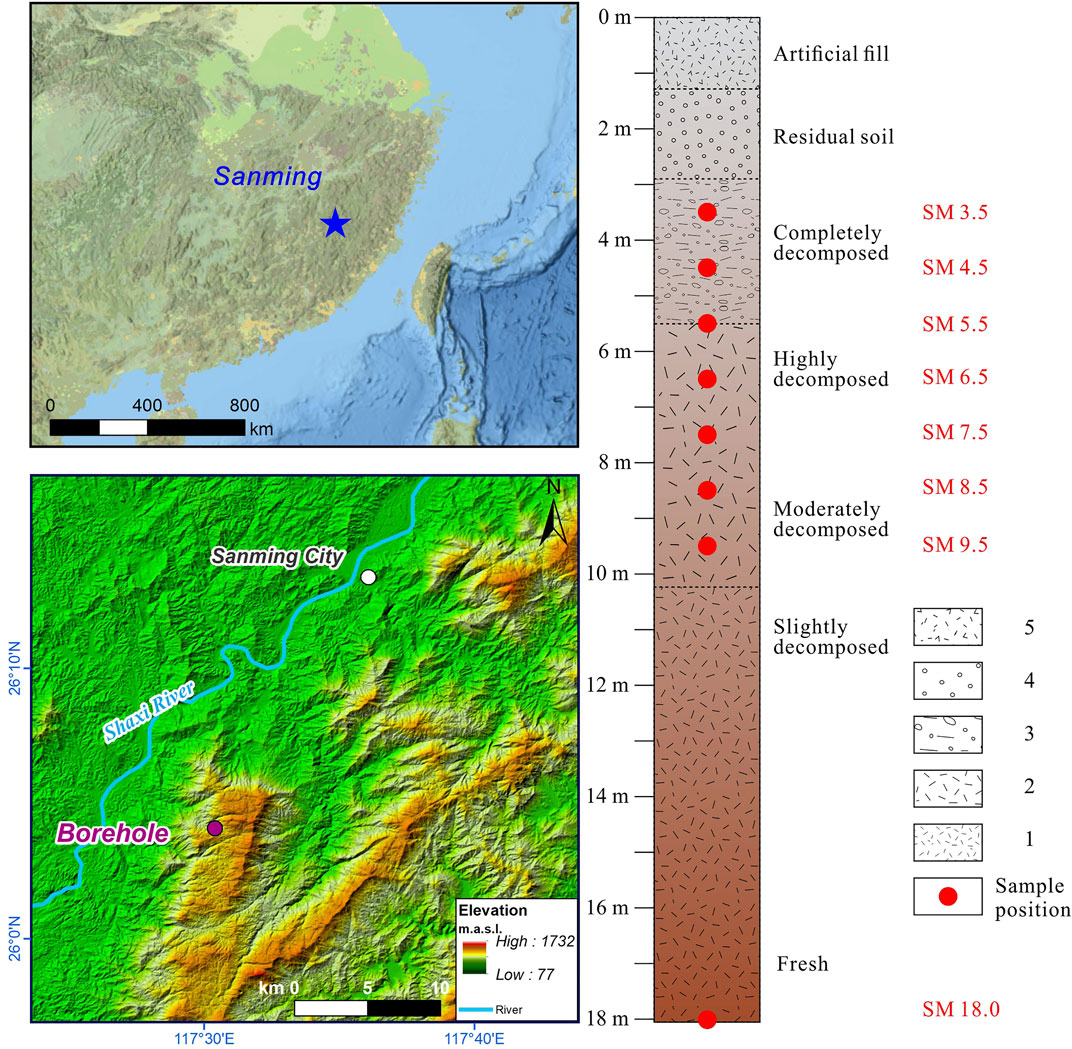
FIGURE 1. The top left map shows the location of Sanming in China. The topographic map on the lower left shows the exact location of the borehole in Sanming. The DEM raster data were obtained from AW3D30 of JAXA (Takaku et al., 2020). The schematic diagram on the right shows the Sanming borehole. 1–5 in the legend indicate different degrees of weathering.
All the granite rocks were crushed and ground after washing with distilled water. The samples for element analysis were ground into powder (diameters < 40 μm) without any separation. The samples for luminescence analysis were crushed and ground, and mixed grains between 180 and 250 μm were selected by wet sieving. The grains were treated with 10% HCl and 30% H2O2 solutions to remove carbonates and organic matter, and then heavy liquids of 2.62 and 2.75 g/cm3 were used to separate quartz and plagioclase from heavy minerals and potassium feldspar (Aitken, 1998). As quartz and plagioclase have similar densities, 40 min HF etching was used to remove the latter. Using differences in hydrodynamics, micas were also removed from the system, preventing their luminescence from affecting the weak luminescence of the rock (Kortekaas and Murray, 2005). Quartz grains were checked by using the X-Ray Diffraction (XRD) and OSL IR depletion ratio (Duller, 2003) to qualify the purity after etching. The mass of aliquots of adhered quartz grains was weighed with a Mettler Toledo XPR10 microbalance with a precision of 1 μg. The average mass on each aliquot is approximately 4–6 mg. The details of the sample preparation protocol are described in the Supplementary Materials.
All luminescence measurements were conducted on a Lexsyg Smart TL/OSL Reader at Peking University, which was equipped with an IR laser diode (850 ± 3 nm, up to 400 mW/cm2 at the sample position) and 5 blue LEDs filtered by 3 mm Schott GG455 glass (458 ± 10 nm, up to 100 mW/cm2 at the sample position). A homogeneous irradiation field is provided by a specially designed circular arranged Beta (90Sr-90Y, 1.6 GBq) source (Richter et al., 2012). Bi-alkaline photomultiplier tubes (Hamamatsu H7360-02, 300–650 nm) with quantum efficiencies of approximately 27% at 400 nm are used for receiving signals (Richter et al., 2013).
The luminescence sensitivity of quartz was measured following the procedures (Table 1). First, the aliquot was bleached enough long (120–180 s) by blue light at 125°C to reduce the quartz signal to the background level, and 11.25 Gy beta dose was given to the sample after bleaching. Second, the aliquot was heated to 220°C to measure the TL signal responding to the given dose, and the integration from 70 to 120°C of the signal was used to calculate the quartz 110°C TL intensity. Next, infrared stimulation was used to ensure that the signal of feldspar inclusions would not affect the quartz OSL sensitivity. Finally, the quartz OSL was obtained by 115 s blue stimulation at 125°C, and the signal for the initial 2 s minus the background value was summed to represent the OSL intensity. A stimulated temperature of 125°C reduces the probability of retrapping by traps when electrons recombine with holes. According to the definition of luminescence sensitivity, we used mass and given dose to normalize quartz 110°C TL and OSL intensity as sensitivity, respectively. Each sample was represented by five aliquots accurately weighed on a microbalance at the 1 μg level.

TABLE 1. Protocol for measurements of quartz luminescence sensitivity (QLS) and sensitivity response to irradiation-bleaching cycles (IBC).
The measurements of irradiation-bleaching cycles (IBCs) are the loop of QLS measurements. To reduce the amount of data and test time, only signals at specific loops were recorded. The protocol for measurements for TAC was the same as that for the QLS and is shown in Table 2. The differences between them are the step of thermal activation before beta dose is given.
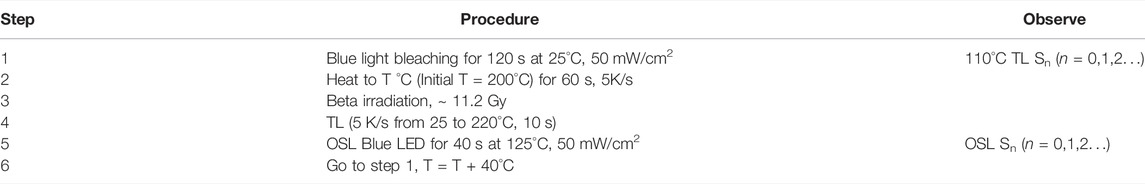
TABLE 2. Protocol for measurements of thermal activation curves (TAC).
For the purpose of evaluating chemical weathering indices, X-ray fluorescence (XRF) is a rapid and convenient method for whole-rock analysis. A wavelength dispersive (WD) XRF (Rigaku ZSX Primus II) at the State Key Laboratory of Plateau Ecology and Agriculture was used to analyze major elements in the whole-rock powder in the ppm to 100% range. The crushed and ground samples mentioned in Section 3.1 were dried in a vacuum drying chamber for 8 h at 110°C to remove moisture. Loss on ignition (LOI) was determined by heating a 2–3 g sample in a muffle oven at 1,050°C for 1 h and weighing immediately after cooling in a desiccator to avoid absorption of air moisture. Samples (3–4 g) were placed into a plastic ring (diameter of 35 mm) without any binder and pressed into a discoidal pallet under 400 bar for 2 min. XRF results were output as the mass percentage of major elements adjusted by LOI and were converted to the molar proportion to calculate the chemical weathering indices.
The mineralogy of the whole-rock powder was determined by X-ray diffraction (XRD) with a Rigaku D/Max 2500PC equipment with radiation from CuKα (λ = 1.5406 Å) at 40 KV and 200 mA. We obtained diffractograms of air-dried mounts for a 2θ range from 3° to 70° at a scanning speed of 8°/min. Panalytical Highscore software and crystallographic information file (CIF) from Crystallography Open Database (Vaitkus et al., 2021) were used to identify minerals and calculate mineral proportions by semi-quantitative methods.
The quartz luminescence sensitivity variations in the Sanming borehole, monitored by 110°C TL and OSL, did not exhibit an obvious trend with the change in depth, as shown in Figure 2 and Table 5. The distribution of data for 110°C TL sensitivity was relatively concentrated, falling within the range of 141.7–99.6 counts/(Gy*mg). The OSL sensitivity values were small overall with slight fluctuations and distributed in the range of 22.6–27.9 counts/(Gy*mg). Both the QLS of the 110°C TL and OSL showed fluctuating patterns of variation along depth, but the former showed a gradual increase along depth above 6.5 m. A total of 40 aliquots for all 8 samples are projected in an X-Y coordinate system with OSL sensitivity and 110°C TL sensitivity as axes. As in Figure 3A, the data points representing all the 40 aliquots are almost clustered together and do not show clear distinguishability.
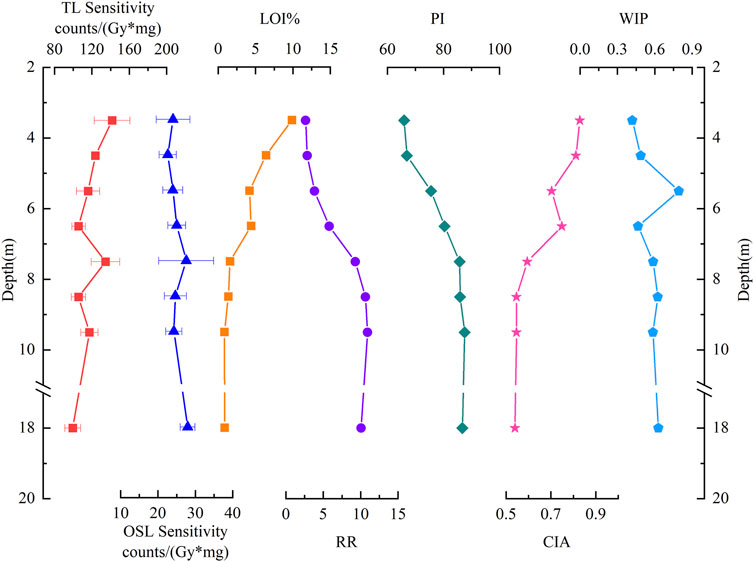
FIGURE 2. The QLS changes with depth in the Sanming borehole and its relationship to different chemical weathering indices. The calculation of weathering indices is listed in Table 4, including Loss on Ignition (LOI), Ruxton Ration (RR), Production Index (PI), Chemical Index of Alteration (CIA), and Weathering Index of Parker (WIP). The error bar denotes the standard deviation of TL and OSL sensitivity. Please note the gap between 10 and 18 m.
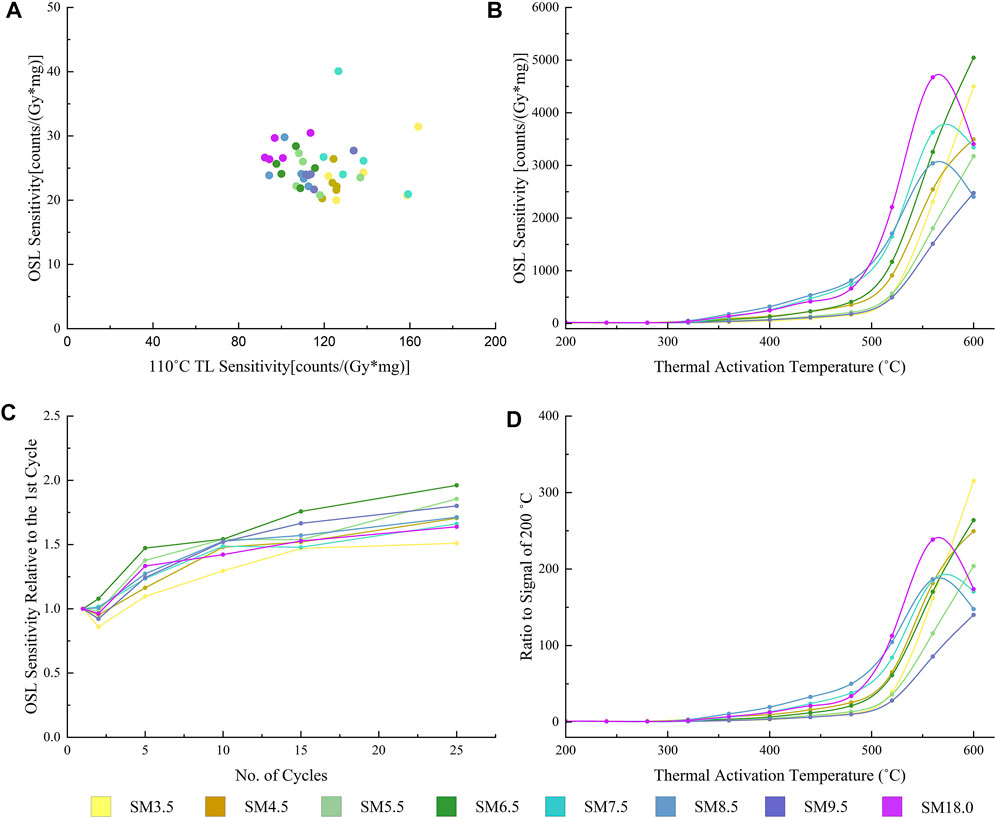
FIGURE 3. Quartz luminescence sensitivity (QLS), thermal activation curve (TAC) and irradiation-bleaching cycles (IBCs) result in Sanming borehole. (A) QLS values of OSL sensitivity and 110°C TL sensitivity. (B) The absolute value of OSL sensitivity at different thermal activation temperatures. (C) The relative values of OSL sensitivity in IBC (normalized by the absolute value of the respective 1st cycle). (D) The relative value of OSL sensitivity at different thermal activation temperatures (normalized by the absolute value of 200°C).
Using the R package numOSL (Peng et al., 2013), we analyzed the composition of the luminescence signals of eight samples with different degrees of weathering. CW-OSL is considered to be resolved into three components based on their decay rates (Smith and Rhodes, 1994), which are fast, medium and slow component. The decay curves were fitted according to equation given below:
where λ1, λ2, λ3 are the decay rate related to electron detrapping cross-sections, and I0k (k=1,2,3) are initial luminescence signal intensity related to the initial populations of electrons in traps (Bluszcz and Adamiec, 2006; Zhou et al., 2010), and I00 is a constant component and is regarded as a background signal.
Figure 4 shows the decay curve raw data and the three components, where the sum of slow component signal and the background signal are shown as a separate item. It can be observed that all samples are dominated by the slow component. After 10 s of stimulation, the samples contain almost no fast and medium components, and the slow components decay at a steady low rate. Figure 5 shows the relative proportions of the three components as a function of excitation time. We noticed that the top 4 samples of borehole had more fast components than the bottom samples. The percentage of “BG+Slow Component” signal (sum of slow component and background signal) for the top 4 samples reached 95% at 5.0 s and 90% at 1.5 s on average. In contrast, the bottom 4 samples reached this ratio much faster, at 2.6 and 1 s, respectively.
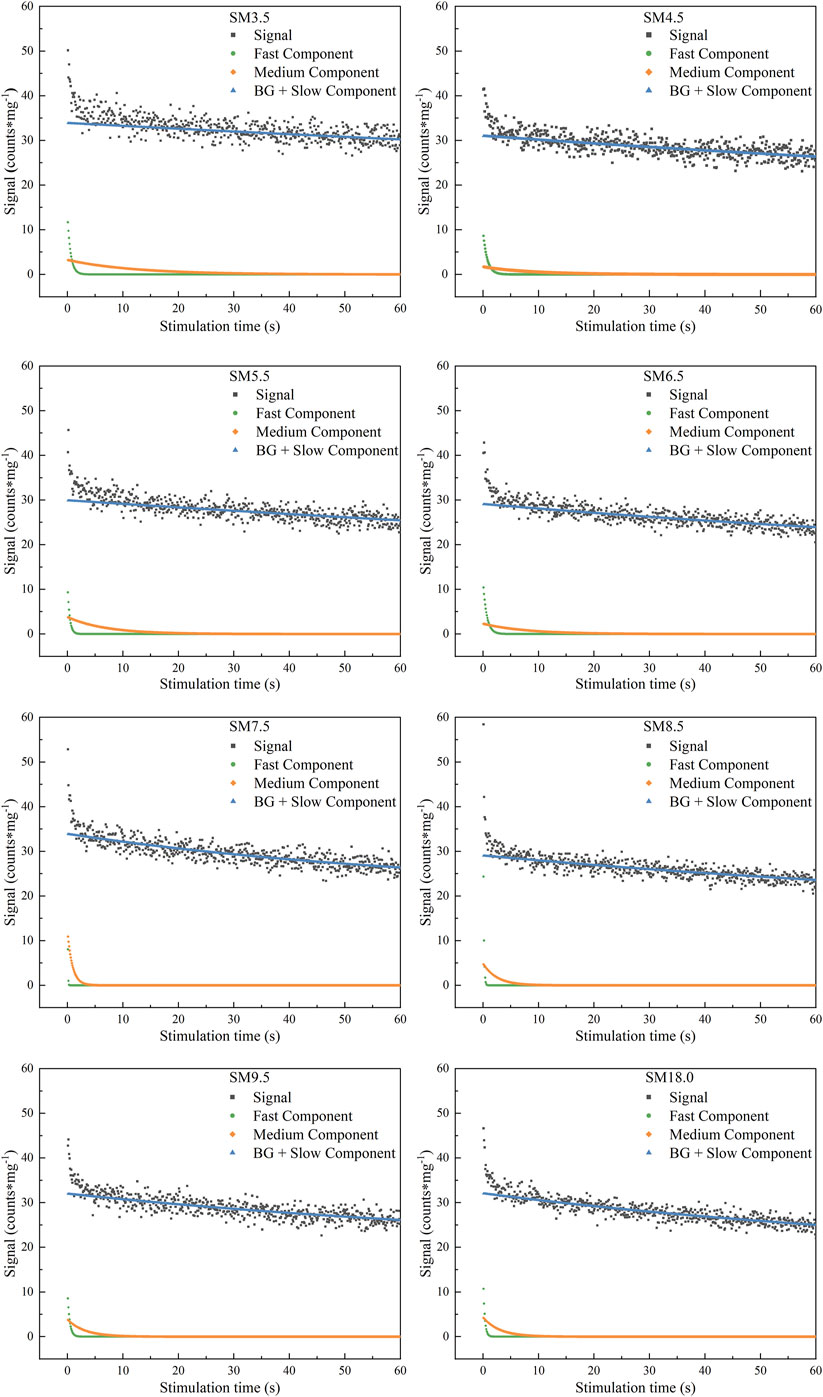
FIGURE 4. The decay curves of 8 samples and the fast, medium and slow components obtained after curve deconvolution. Since the fast and medium components decayed rapidly to zero and the slow component decayed at a constant rate, only the first 60 s of data were intercepted and plotted.
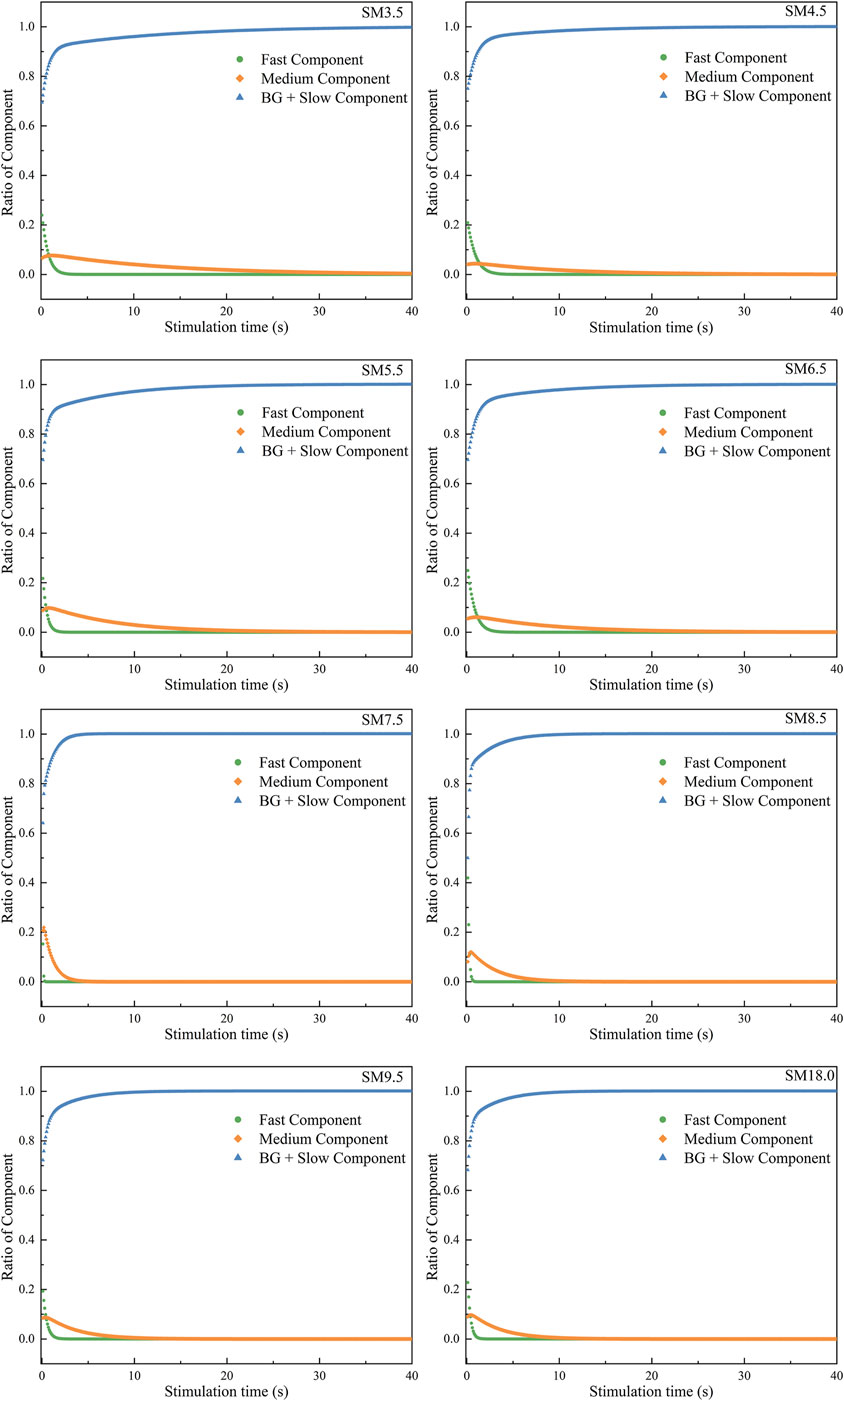
FIGURE 5. The fast, medium and slow components variations with the stimulation time. For an apparent presentation, the first 40 s of data were intercepted for plotting.
Table 3 shows the weight percentages of the major chemical elements measured by XRF and adjusted by the LOI parameter. From the bottom to the top of the borehole, Na2O, K2O, SiO2, and CaO decreased upwards, while Al2O3 and iron oxides Fe2O3 increased significantly with increasing degree of weathering. MgO, P2O5, TiO2, and MnO did not exhibit any obvious trends with depth. LOI parameters were calculated and are listed in Table 3, which also increases with the observed grade of chemical weathering in field. In general, with the decreasing depth of the borehole, soluble and mobile elements were removed, while immobile and nonsoluble elements increased relatively. Although the trend of the concentration of the above elements in the borehole is obvious, there are still some exceptional points, and the reasons for these points will be discussed in Section 5.1.
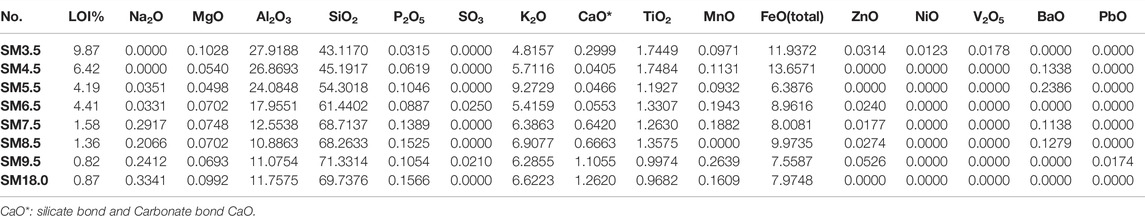
TABLE 3. Major chemical element weight percentage (%) and LOI of Sanming Borehole.
The XRD spectra of 8 samples from the Sanming drill hole at different depths were compared and are shown in Figure 6. Overall, there is consistency between the 8 spectra, but there is also variation. It can be clearly seen that the strongest peak (2θ = 26.59°) in all samples at different depths is from the quartz mineral, as it is the most weathering resistant mineral. The plagioclase decreased with increasing weathering and was not even visible in samples above 6.5 m. The peaks of mica also gradually disappeared in the samples above 6.5 m. The characteristic peaks of kaolinite or chlorite (2θ = 12.40°) and illite (2θ = 19.85°) can be clearly seen in the sample at 3.5 m.
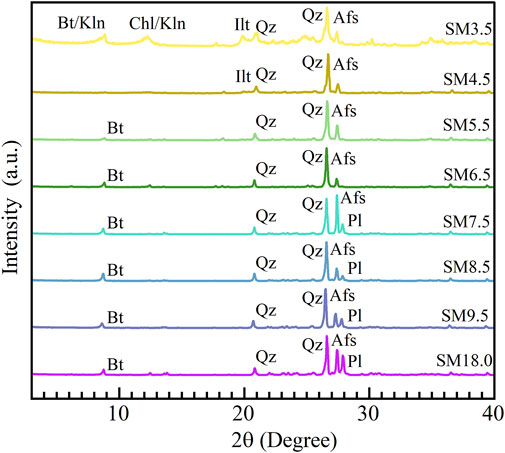
FIGURE 6. Comparison of XRD spectra of in situ chemical weathering of eight samples from the Sanming drill hole. Bt: Biotite, Chl: Chlorite, Kln: Kaolinite, Ilt: Illite, Qz: Quartz, Afs: Alkali feldspar, Pl: Plagioclase (Warr, 2021).
We assessed the IBC values of 8 samples from the Sanming borehole, and each of them were normalized by the respective first cycle value. As shown in Figure 3C, the 8 samples at different depths exhibit relatively the same trend of variation. The normalized IBC values grew gradually with the increase in the number of cycles. After the 1st, 2nd, 5th, 10th, 15th, and 25th cycles, the normalized IBC values of all samples did not show a large dispersion. The normalized IBC values gradually increased from 0.9 to 1.1 at the first cycle to 1.5–2.0 at the last cycle. Additionally, we noticed that some samples (SM5.5) maintained a faster increasing trend after the last cycle, while some samples (SM3.5) remained almost unchanged.
We performed TAC experiments in the interval from 200 to 600°C, with one measurement at each temperature rise of 40°C. The absolute values of the TAC test results are presented in Figure 3B., showing the variations of OSL sensitivity under thermal activation temperatures. The absolute values of TAC of the 8 samples remained almost constant for the measurements before 320°C. As the heating continued, the absolute values of the samples had a faster rise and a larger difference. The 8 samples were divided into two parts: one part reached the peak and subsequently dropped back (SM7.5, 8.5, 18), and the other part continued to increase (the other 5 samples). In Figure 3D., the absolute value of OSL sensitivity is normalized by the respective value of 200°C and the same pattern is also found in the normalized results.
In a normal chemical weathering process under humid-warm climate conditions, hydrolysis results in silica movement in a profile, that is, irregular and small, while alkali and alkaline earth metals are greatly depleted (Parker, 1970). The common principle of weathering indices assumes that the major element distribution in parent rock is homogeneous on a certain scale, and the initial weathering degree is equal or the weathering starting line is the same for the samples.
Different weathering indices have been introduced to estimate the degree of weathering for various weathering conditions or weathering matrix. Although more than 30 different weathering indices were introduced, 5 indices applicable to granite, including RR (Ruxton Ratio), PI (Product Index), CIA (Chemical Index of Alteration), WIP (Weathering Index of Parker) and LOI, were chosen to evaluate chemical weathering intensity or extent in quantitative rather than qualitative terms in the current experiment. The Ruxton (1968) has been proven to be a good index for acidic or felsic rocks, and it assumes that alumina and other sesquioxides are immobile during weathering. WIP (Parker, 1970) is based on bond strength with oxygen and the proportion of mobile major elements (i.e., Na, K, Mg and Ca). CIA (Nesbitt and Young, 1982) applies the molecular ratio between immobile and mobile major elements, reflecting the conversion of feldspars to clays. LOI assesses weathering by calculating OHˉ ions during the weathering process and ignoring a small amount of other volatiles (Sueoka et al., 1985; Gupta and Rao, 2001). Tables 4, 5 summarize and express specific calculation formulas and results.
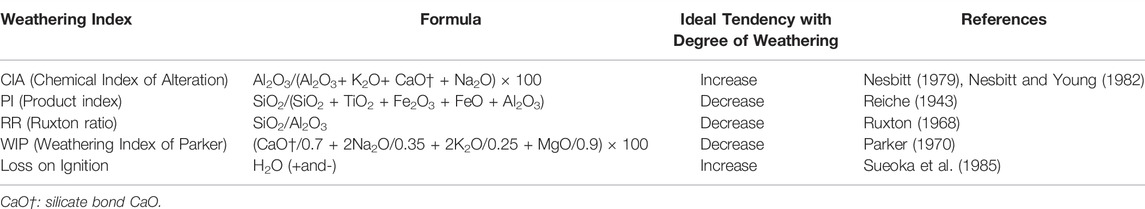
TABLE 4. Chemical weathering indices used in this study.
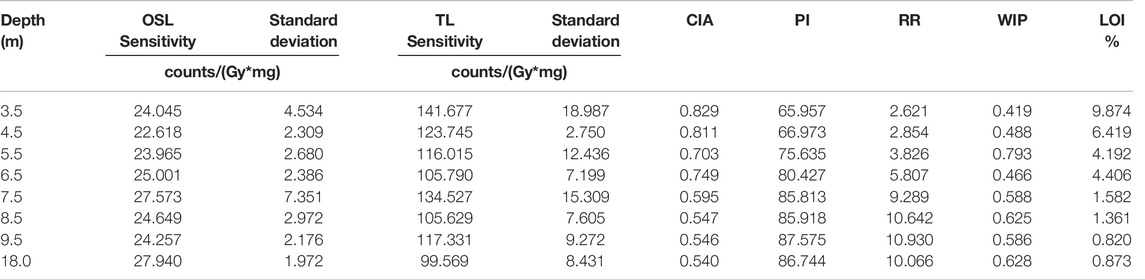
TABLE 5. Quartz luminescence sensitivity and chemical weathering indices for samples from Sanming Borehole.
PI and RR decreased as the grade of weathering increased, LOI and CIA increased as the grade of weathering increased, while WIP did not show an expected tendency as shown in Figure 2. It demonstrated a gradual decreasing weathering effect from 3.5 to 7.5 m and a nearly constant trend from 7.5 to 18.0 m. The initial results of major elements are compatible with the phenomena observed in the field work. Both WIP and CIA exhibited the same variation trend with an odd point at a depth of 5.5 m, where the potassium content was higher than that at all other points, which caused abnormalities in the indices. In contrast, PI employ a calculation method similar to that of CIA or WIP but does not involve potassium, so it gradually increases with depth until it plateaus without outliers. The LOI increased continuously with increased weathering, representing the value of OHˉ in the secondary mineral formation, which is the residual of weathering.
The mineralogical results show that the fresh granite of the Sanming borehole is mainly composed of quartz, plagioclase, alkali feldspar and biotite. With increasing weathering, feldspar and mica chemically decomposed and transformed into hydrous clay minerals, such as kaolinite, illite and chlorite. Our experiments demonstrate from the mobility of chemical elements and the transformation between minerals that chemical weathering of the borehole is present and gradually increases from the bottom to the top.
QLS could be affected by congenital or acquired factors, such as crystallization (Sawakuchi et al., 2011b), inclusions (Chauhan and Singhvi, 2019), irradiation (Zimmerman, 1971; Benny et al., 2000), bleaching (Li and Wintle, 1992; Zhou and Wintle, 1994), or thermal history of quartz grains. The Sanming borehole, penetrated the weathering layer, was drilled on a Carboniferous granitic pluton that crops out on the surface and occupies an area of approximately 80 km2. Compared to the large pluton, the heterogeneity of minerals in the borehole should be ignored, and quartz grains should be considered to have the same crystallization conditions, thermal history, and similar composition. Moreover, in situ weathering conditions do not allow quartz to enter the loop of irradiation-bleaching cycles (IBCs), which have already been proven to lead to an increase in QLS (Pietsch et al., 2008). Thus, the most likely factors affecting QLS are 1) the variation intensity of irradiation due to the changes in the radiation field, 2) the absorbed dose after being shielded by water, and 3) the dissolution of the surface layer of quartz by water. During the weathering process, the migration of radioactive elements would change the radiation field significantly (Jeong et al., 2007). For example, the alpha dose rate (Gy/ka) per ppm for the natural uranium series is 2.78, and the beta dose rate is 0.7982 Gy/ka for natural potassium at a 1% concentration (Adamiec and Aitken, 1998; Guérin et al., 2011). The pores and fractures of granite increase with the intensity of weathering, providing space for water to shield quartz grains against α, β, and γ radiation, which results in quartz gains receiving varying radiation doses during the chemical weathering process. Water not only protects the quartz grains from radiation but also dissolves them. Although the dissolution of quartz at 25°C and at neutral pH is slight (∼10−14.5 to 10−15.1 mol/m2/s) (Schulz and White, 1999), it is also possible to affect the morphology of quartz by creating etch pits and fragmentations that may have effects on QLS. Meanwhile, the gradual expansion of pores and fractures provides channels for radon to escape, which decreases the subsequent radioactive decay chain and intensity of the radiation field. Overall, the main factors that may affect the QLS in the Sanming borehole are fluctuations in the radiation field in the historical period, which are caused by dissolution of quartz grains, water shielding and migration of radioactive elements.
It is quite difficult to recover the radiation field controlled by such complex conditions in the historical period. The chemical weathering process may be regarded as a black-box model combining three input variables: radiation field, water shield, and dissolution of quartz surface. Sawakuchi et al. (2018) considered that a longer duration of chemical weathering increases the QLS, which accounts for the high-sensitivity quartz in the cratonic areas of the Central Brazil shield. In our results, the relationship between OSL sensitivity and chemical weathering indices was not significant in the in situ chemical weathering scenario, indicating that the OSL sensitivity was less sensitive to three variables together. TL sensitivity monitored by 110°C exhibits a trend consistent with the intensity of chemical weathering. As the borehole is only 18 m in depth, and we cannot speculate whether the QLS would have remained constant if weathering had proceeded. However, we can conclude that 110°C TL sensitivity is more responsive to chemical weathering under the same conditions. This can also be noticed in previous work (Lü et al., 2014; Lü and Sun, 2017; Li and Zhou, 2020; Lü et al., 2020), where quartz in Paleosol or Pedocomplex has a higher QLS compared to loess, and the luminescence sensitivity of TL is several times higher than that of OSL. The difference, however, is that our QLS values are in the tens to hundreds of percent of the values in the above literature. Yang and Zhou (2019) used the uranium disequilibrium method to estimate that the chemical weathering rate of granite is 0.038 mm/year in the northern part of Guangdong Province, a mountain area with weathering conditions close to Sanming. We assume that samples above 7.5 m were weathered at the rate described above and concluded that the QLS caused by the variate intensity of irradiation will not change significantly in at least 200 ka under such weathering conditions.
Changes in the luminescence sensitivity of quartz particles during irradiation-bleaching cycles (IBCs) have been extensively studied. Some of the studies have yielded a good linear correlation between the increase in QLS and the increase in the number of IBCs (Preusser et al., 2006; Pietsch et al., 2008; Zheng et al., 2009; Chang and Zhou, 2019; Li and Zhou, 2020; Bartyik et al., 2021). Nevertheless, several studies demonstrated controversial phenomena in which QLS does not increase with the number of IBCs (Fitzsimmons, 2011; Sawakuchi et al., 2018). There is insufficient evidence to suggest that differences in IBC can be explained by differences between weathering alone. However, the QLS of the eight samples tended to increase gradually with the number of IBCs, while maintaining a good consistency. This indicates that although the quartz has undergone different grades of in-situ chemical weathering, it maintains a consistent response to IBC, which may facilitate the subsequent use of IBC for source tracing or geomorphic process analysis.
The heating rate and the time held at high temperatures together affect the shape and peak position of the TAC (Aitken, 1985). To facilitate comparison, all the TAC data of the current study were obtained by the same thermal treatment. Aitken (1985) assumed that the TAC reflects the distribution of reservoir traps (R) and luminescence traps (L), both of which were proposed by Zimmerman (1971). He also suggested that R traps close to the valence band have their holes transferred to the L centers at a lower temperature than traps that are not as close. Many studies have taken advantage of this feature and concluded that TAC can distinguish the source of sediments (Zheng et al., 2009; Chang and Zhou, 2019; Nian et al., 2019; Li and Zhou, 2020). In contrast, our study shows that the TAC of quartz differs significantly even from that of the same rock mass, especially in the Sanming borehole (Figure 3 and Section 4.3). Considering the large differences between in situ weathering residuals and sediments, we are unable to conclude the TAC characteristics of quartz from the same rock mass after geomorphic processes such as denudation and transport.
In this study, eight samples from areas of intense chemical weathering were used to analyze the constraints of chemical weathering processes on QLS. The quartz 110°C TL sensitivity is more sensitive to chemical weathering relative to OSL sensitivity, although this tendency to enhance with chemical weathering is limited in our drilled samples. The samples from the upper part of the borehole that experienced stronger chemical weathering had more fast component than the samples from the bottom, but not significantly. Using the weathering rates of similar areas, we assumed that the QLS does not receive obvious alterations from in situ chemical weathering within 200 ka. We have found that quartz from the same source undergoes different degrees of in situ chemical weathering, but maintains a consistent response to IBC, which may also be a beneficial tool for geomorphic analysis. The thermal activation curve (TAC) results of the same rock mass show large differences, shaking the reliability of TAC as a provenance indicator. However, considering the differences between sediments and in situ weathering residuals, the reliability of TAC as a provenance indicator needs further study.
The original contributions presented in the study are included in the article/Supplementary Material, further inquiries can be directed to the corresponding author.
ZC contributed to conception and design of the study. ZC, YJ, and JX performed the statistical analysis. JZ organized the fieldwork. ZC, JX, and CZ organized the experiment. ZC wrote the first draft of the manuscript. All authors contributed to manuscript revision, read, and approved the submitted version.
The authors declare that the research was conducted in the absence of any commercial or financial relationships that could be construed as a potential conflict of interest.
All claims expressed in this article are solely those of the authors and do not necessarily represent those of their affiliated organizations, or those of the publisher, the editors and the reviewers. Any product that may be evaluated in this article, or claim that may be made by its manufacturer, is not guaranteed or endorsed by the publisher.
We are grateful to Professor Liping Zhou for his valuable comments and helpful discussions during this work. We also thank the two reviewers, whose constructive comments made the manuscript a great improvement.
The Supplementary Material for this article can be found online at: https://www.frontiersin.org/articles/10.3389/feart.2022.940212/full#supplementary-material
Aitken, M. J. (1998). An Introduction to Optical Dating: The Dating of Quaternary Sediments by the Use of Photon-Stimulated Luminescence. Oxford: Oxford University Press.
Armitage, S. J., Duller, G. A. T., and Wintle, A. G. (2000). Quartz from Southern Africa: Sensitivity Changes as a Result of Thermal Pretreatment. Radiat. Meas. 32 (5-6), 571–577. doi:10.1016/S1350-4487(00)00053-6
Bartyik, T., Magyar, G., Filyó, D., Tóth, O., Blanka-Végi, V., Kiss, T., et al. (2021). Spatial Differences in the Luminescence Sensitivity of Quartz Extracted from Carpathian Basin Fluvial Sediments. Quat. Geochronol. 64, 101166. doi:10.1016/j.quageo.2021.101166
Benny, P. G., Sanjeev, N., Gundu Rao, T. K., and Bhatt, B. C. (2000). Gamma Ray Induced Sensitization of 110°C TL Peak in Quartz Separated from Sand. Radiat. Meas. 32 (3), 247–252. doi:10.1016/S1350-4487(99)00268-1
Bluszcz, A., and Adamiec, G. (2006). Application of Differential Evolution to Fitting OSL Decay Curves. Radiat. Meas. 41 (7), 886–891. doi:10.1016/j.radmeas.2006.05.016
Bøtter-Jensen, L., Agersnap Larsen, N., Mejdahl, V., Poolton, N. R. J., Morris, M. F., and McKeever, S. W. S. (1995). Luminescence Sensitivity Changes in Quartz as a Result of Annealing. Radiat. Meas. 24 (4), 535–541. doi:10.1016/1350-4487(95)00006-z
Bureau of Geology and Mineral Resources of Fujian Province (1985). Regional Geology of Fujian Province. Beijing: Geological Publishing House.
Chang, Z., and Zhou, L. (2019). Evidence for Provenance Change in Deep Sea Sediments of the Bengal Fan: A 7 Million Year Record from IODP U1444A. J. Asian Earth Sci. 186, 104008. doi:10.1016/j.jseaes.2019.104008
Chauhan, N., and Singhvi, A. K. (2019). Changes in the Optically Stimulated Luminescence (OSL) Sensitivity of Single Grains of Quartz During the Measurement of Natural OSL: Implications for the Reliability of Optical Ages. Quat. Geochronol. 53, 101004. doi:10.1016/j.quageo.2019.101004
del Río, I., Sawakuchi, A. O., Góes, A. M., Hollanda, M. H. B. M., Furukawa, L. Y., Porat, N., et al. (2021). Luminescence Signals of Quartz and Feldspar as New Methods for Stratigraphic Discrimination and Provenance Analysis of Siliciclastic Successions: The Case of the Parnaíba Basin (Brazil) of West Gondwana. Basin Res. 33 (6), 2938–2959. doi:10.1111/bre.12590
Duller, G. A. T. (2003). Distinguishing Quartz and Feldspar in Single Grain Luminescence Measurements. Radiat. Meas. 37 (2), 161–165. doi:10.1016/s1350-4487(02)00170-1
Fitzsimmons, K. (2011). An Assessment of the Luminescence Sensitivity of Australian Quartz with Respect to Sediment History. Geochronometria 38 (3), 199–208. doi:10.2478/s13386-011-0030-9
Fuchs, M., and Owen, L. A. (2008). Luminescence Dating of Glacial and Associated Sediments: Review, Recommendations and Future Directions. Boreas 37 (4), 636–659. doi:10.1111/j.1502-3885.2008.00052.x
Guérin, G., Mercier, N., and Adamiec, G. (2011). Dose-Rate Conversion Factors: Update. Anc. TL 29 (1), 5–8.
Gupta, A. S., and Rao, S. K. (2001). Weathering Indices and Their Applicability for Crystalline Rocks. Bull. Eng. Geol. Environ. 60 (3), 201–221. doi:10.1007/s100640100113
Higashimura, T., Ichikawa, Y., and Sidei, T. (1963). Dosimetry of Atomic Bomb Radiation in Hiroshima by Thermoluminescence of Roof Tiles. Science 139 (3561), 1284–1285. doi:10.1126/science.139.3561.1284.b
Ike, P. O., Folley, D. E., Agwu, K. K., Chithambo, M. L., Chikwembani, S., and Ezema, F. I. (2021). Influence of Dysprosium Doping on the Structural, Thermoluminescence and Optical Properties of Lithium Aluminium Borate. J. Lumin. 233, 117932. doi:10.1016/j.jlumin.2021.117932
Jeong, G. Y., Cheong, C.-S., and Choi, J.-H. (2007). The Effect of Weathering on Optically Stimulated Luminescence Dating. Quat. Geochronol. 2 (1-4), 117–122. doi:10.1016/j.quageo.2006.05.023
Kalita, J. M., Thomas, S., and Chithambo, M. L. (2019). Thermally and Optically Stimulated Luminescence of Natural Red and Blue Corundum (Al2O3). J. Luminescence 205, 417–422. doi:10.1016/j.jlumin.2018.09.058
Kortekaas, M., and Murray, A. S. (2005). A Method for the Removal of Mica from Quartz Separates. Anc. TL 23 (2), 43–46.
Lai, Z. (2006). Testing the Use of an OSL Standardised Growth Curve (SGC) for Determination on Quartz from the Chinese Loess Plateau. Radiat. Meas. 41 (1), 9–16. doi:10.1016/j.radmeas.2005.06.031
Li, J., Zhang, Y., Dong, S., and Johnston, S. T. (2014). Cretaceous Tectonic Evolution of South China: A Preliminary Synthesis. Earth-Science Rev. 134, 98–136. doi:10.1016/j.earscirev.2014.03.008
Li, S.-H., Chen, Y.-Y., Li, B., Sun, J., and Yang, L.-R. (2007). OSL Dating of Sediments from Deserts in Northern China. Quat. Geochronol. 2 (1-4), 23–28. doi:10.1016/j.quageo.2006.05.034
Li, S.-H., and Wintle, A. G. (1992). Luminescence Sensitivity Change Due to Bleaching of Sediments. Int. J. Radiat. Appl. Instrum. Part D. Nucl. Tracks Radiat. Meas. 20 (4), 567–573. doi:10.1016/1359-0189(92)90006-h
Li, Y., and Zhou, L. (2020). Variations of Thermally and Optically Stimulated Luminescence Sensitivity of Loess and Pedocomplex Samples from Southern Tajikistan, Central Asia. Geochronometria 48 (1), 242–252. doi:10.1515/geochr-2015-0118
Li, Z.-X., Li, X.-h., Zhou, H., and Kinny, P. D. (2002). Grenvillian Continental Collision in South China: New SHRIMP U-Pb Zircon Results and Implications for the Configuration of Rodinia. Geology 30 (2), 163–166. doi:10.1130/0091-7613(2002)030<0163:gccisc>2.0.co;2
Lü, T., Sun, J., Feathers, J. K., and Sun, D. (2020). Spatiotemporal Variations and Implications of Luminescence Sensitivity of Quartz Grains on the Chinese Loess Plateau since the Last Interglaciation. Quat. Res. 99, 190–203. doi:10.1017/qua.2020.53
Lü, T., Sun, J., Li, S.-H., Gong, Z., and Xue, L. (2014). Vertical Variations of Luminescence Sensitivity of Quartz Grains from Loess/Paleosol of Luochuan Section in the Central Chinese Loess Plateau Since the Last Interglacial. Quat. Geochronol. 22, 107–115. doi:10.1016/j.quageo.2014.04.004
Lü, T., and Sun, J. (2017). Luminescence Sensitivities of Quartz Grains from Eolian Deposits in Northern China and Their Implications for Provenance. Quat. Res. 76 (2), 181–189. doi:10.1016/j.yqres.2011.06.015
Murray, A. S., and Wintle, A. G. (2000). Luminescence Dating of Quartz Using an Improved Single-Aliquot Regenerative-Dose Protocol. Radiat. Meas. 32 (1), 57–73. doi:10.1016/S1350-4487(99)00253-X
Murray, A. S., and Wintle, A. G. (2003). The Single Aliquot Regenerative Dose Protocol: Potential for Improvements in Reliability. Radiat. Meas. 37 (4-5), 377–381. doi:10.1016/S1350-4487(03)00053-2
Nelson, M. S., Eppes, M. C., and Rittenour, T. M. (2022). Quartz Luminescence Sensitivity from Sediment versus Bedrock in Highly Weathered Soils of the Piedmont of North Carolina, South-Eastern USA. Quat. Geochronol. 72, 101343. doi:10.1016/j.quageo.2022.101343
Nesbitt, H. W. (1979). Mobility and Fractionation of Rare Earth Elements During Weathering of a Granodiorite. Nature 279 (5710), 206–210. doi:10.1038/279206a0
Nesbitt, H. W., and Young, G. M. (1982). Early Proterozoic Climates and Plate Motions Inferred from Major Element Chemistry of Lutites. Nature 299 (5885), 715–717. doi:10.1038/299715a0
Nian, X., Zhang, W., Qiu, F., Qin, J., Wang, Z., Sun, Q., et al. (2019). Luminescence Characteristics of Quartz from Holocene Delta Deposits of the Yangtze River and Their Provenance Implications. Quat. Geochronol. 49, 131–137. doi:10.1016/j.quageo.2018.04.010
Parker, A. (1970). An Index of Weathering for Silicate Rocks. Geol. Mag. 107 (6), 501–504. doi:10.1017/s0016756800058581
Peng, J., Dong, Z., Han, F., Long, H., and Liu, X. (2013). R Package numOSL: Numeric Routines for Optically Stimulated Luminescence Dating. Anc. TL 31 (2), 41–48.
Pietsch, T. J., Olley, J. M., and Nanson, G. C. (2008). Fluvial Transport as a Natural Luminescence Sensitiser of Quartz. Quat. Geochronol. 3 (4), 365–376. doi:10.1016/j.quageo.2007.12.005
Pires, E. L., Tatumi, S. H., Mittani, J. C. R., Kinoshita, A., Baffa, O., and Caldas, L. V. E. (2011). TL, OSL and ESR Properties of Nanostructured KAlSi3O8:Mn Glass. Radiat. Meas. 46, 1492–1495. doi:10.1016/j.radmeas.2011.04.041
Preusser, F., Ramseyer, K., and Schlüchter, C. (2006). Characterisation of Low OSL Intensity Quartz from the New Zealand Alps. Radiat. Meas. 41 (7-8), 871–877. doi:10.1016/j.radmeas.2006.04.019
Qiu, F., and Zhou, L. (2015). A New Luminescence Chronology for the Mangshan Loess-Palaeosol Sequence on the Southern Bank of the Yellow River in Henan, Central China. Quat. Geochronol. 30, 24–33. doi:10.1016/j.quageo.2015.06.014
Reiche, P. (1943). Graphic Representation of Chemical Weathering. J. Sediment. Res. 13 (2), 58–68. doi:10.1306/d4269198-2b26-11d7-8648000102c1865d
Rendell, H. M., Townsend, P. D., Wood, R. A., and Luff, B. J. (1994). Thermal Treatments and Emission-Spectra of TL from Quartz. Radiat. Meas. 23 (2-3), 441–449. doi:10.1016/1350-4487(94)90077-9
Richter, D., Pintaske, R., Dornich, K., and Krbetschek, M. (2012). A Novel Beta Source Design for Uniform Irradiation in Dosimetric Applications. Anc. TL 30 (2), 57–63.
Richter, D., Richter, A., and Dornich, K. (2013). Lexsyg - A New System for Luminescence Research. Geochronometria 40 (4), 220–228. doi:10.2478/s13386-013-0110-0
Rink, W. J. (1994). Billion-Year Age-Dependence of Luminescence in Granitic Quartz. Radiat. Meas. 23 (2-3), 419–422. doi:10.1016/1350-4487(94)90074-4
Ruxton, B. P. (1968). Measures of the Degree of Chemical Weathering of Rocks. J. Geol. 76 (5), 518–527. doi:10.1086/627357
Sawakuchi, A. O., Blair, M. W., DeWitt, R., Faleiros, F. M., Hyppolito, T., and Guedes, C. C. F. (2011a). Thermal History versus Sedimentary History: OSL Sensitivity of Quartz Grains Extracted from Rocks and Sediments. Quat. Geochronol. 6 (2), 261–272. doi:10.1016/j.quageo.2010.11.002
Sawakuchi, A. O., DeWitt, R., and Faleiros, F. M. (2011b). Correlation Between Thermoluminescence Sensitivity and Crystallization Temperatures of Quartz: Potential Application in Geothermometry. Radiat. Meas. 46 (1), 51–58. doi:10.1016/j.radmeas.2010.08.005
Sawakuchi, A. O., Jain, M., Mineli, T. D., Nogueira, L., Bertassoli, D. J., Häggi, C., et al. (2018). Luminescence of Quartz and Feldspar Fingerprints Provenance and Correlates with the Source Area Denudation in the Amazon River Basin. Earth Planet. Sci. Lett. 492, 152–162. doi:10.1016/j.epsl.2018.04.006
Sawakuchi, A. O., Rodrigues, F. C. G., Mineli, T. D., Mendes, V. R., Melo, D. B., Chiessi, C. M., et al. (2020). Optically Stimulated Luminescence Sensitivity of Quartz for Provenance Analysis. Methods Protoc. 3 (1), 6. doi:10.3390/mps3010006
Schulz, M. S., and White, A. F. (1999). Chemical Weathering in a Tropical Watershed, Luquillo Mountains, Puerto Rico III: Quartz Dissolution Rates. Geochim. Cosmochim. Acta 63 (3-4), 337–350. doi:10.1016/S0016-7037(99)00056-3
Shu, L. (2012). An Analysis of Principal Features of Tectonic Evolution in South China Block. Geol. Bull. China 31 (7), 1035–1053. (Chinese with English Abstract).
Shu, L. (2006). Predevonian Tectonic Evolution of South China: From Cathaysian Block to Caledonian Period Folded Orogenic Belt. Geol. J. China Univ. 12 (4), 418–431. (Chinese with English Abstract).
Shu, L., Yao, J., Wang, B., Faure, M., Charvet, J., and Chen, Y. (2021). Neoproterozoic Plate Tectonic Process and Phanerozoic Geodynamic Evolution of the South China Block. Earth-Sci. Rev. 216, 103596. doi:10.1016/j.earscirev.2021.103596
Singhvi, A. K., Sharma, Y. P., and Agrawal, D. P. (1982). Thermoluminescence Dating of Sand Dunes in Rajasthan, India. Nature 295 (5847), 313–315. doi:10.1038/295313a0
Smith, B. W., and Rhodes, E. J. (1994). Charge Movements in Quartz and Their Relevance to Optical Dating. Radiat. Meas. 23 (2-3), 329–333. doi:10.1016/1350-4487(94)90060-4
Sueoka, T., Lee, I., Muramatsu, M., and Imamura, S. (1985). “Geomechanical Properties and Engineering Classification for Decomposed Granite Soils in Kaduna District, Nigeria,” in Proceedings of the First International Conference on Geomechanics in Tropical Lateritic and Saprolitic Soils, Brasilia, February 11-14, 1985, 175–186.
Takaku, J., Tadono, T., Doutsu, M., Ohgushi, F., and Kai, H. (2020). Updates of ‘Aw3D30' Alos Global Digital Surface Model with Other Open Access Datasets. Int. Arch. Photogramm. Remote Sens. Spat. Inf. Sci. XLIII-B4-2020, 183–189. doi:10.5194/isprs-archives-XLIII-B4-2020-183-2020
Vaitkus, A., Merkys, A., and Gražulis, S. (2021). Validation of the Crystallography Open Database Using the Crystallographic Information Framework. J. Appl. Cryst. 54 (2), 661–672. doi:10.1107/s1600576720016532
Warr, L. N. (2021). IMA-CNMNC Approved Mineral Symbols. Mineral. Mag. 85 (3), 291–320. doi:10.1180/mgm.2021.43
Yang, H., and Zhou, S. (2019). Application of Uranium Disequilibrium in the Study of the Weathering Rate of the Granite in Northern Guangdong. J. South China Normal Univ. Nat. Sci. Ed. 51 (5), 84–91. (Chinese with English Abstract). doi:10.6054/j.jscnun.2019088
Yukihara, E. G., and McKeever, S. W. S. (2008). Optically Stimulated Luminescence (OSL) Dosimetry in Medicine. Phys. Med. Biol. 53 (20), R351–R379. doi:10.1088/0031-9155/53/20/r01
Zhang, Y., Xu, X., Jia, D., and Shu, L. (2009). Deformation Record of the Change from Indosinian Collision-Related Tectonic System to Yanshanian Subduction-Related Tectonic System in South China During the Early Mesozoic. Earth Sci. Front. 16 (1), 234–247. (Chinese with English Abstract).
Zheng, C., Zhou, L., and Qin, J. (2009). Difference in Luminescence Sensitivity of Coarse-Grained Quartz from Deserts of Northern China. Radiat. Meas. 44 (5-6), 534–537. doi:10.1016/j.radmeas.2009.02.013
Zhou, L., Fu, D., and Zhang, J. (2010). An Analysis of the Components of the Luminescence Signals of Selected Polymineral and Quartz Samples from Loess in Western China and Southern Tajikistan, and Their Suitability for Optical Dating. Quat. Geochronol. 5 (2-3), 149–153. doi:10.1016/j.quageo.2009.05.008
Zhou, L., and Wintle, A. G. (1994). Sensitivity Change of Thermoluminescence Signals After Laboratory Optical Bleaching - Experiments with Loess Fine Grains. Quat. Sci. Rev. 13 (5-7), 457–463. doi:10.1016/0277-3791(94)90058-2
Zimmerman, J. (1971). The Radiation-Induced Increase of the 100°C Thermoluminescence Sensitivity of Fired Quartz. J. Phys. C. Solid State Phys. 4 (18), 3265–3276. doi:10.1088/0022-3719/4/18/032
Keywords: luminescence sensitivity, provenance analysis, weathering index, granite weathering, quartz
Citation: Cao Z, Jiang Y, Xu J, Zhao J and Zhao C (2022) Luminescence Sensitivity of Quartz From Rocks Under in situ Chemical Weathering Conditions. Front. Earth Sci. 10:940212. doi: 10.3389/feart.2022.940212
Received: 10 May 2022; Accepted: 17 June 2022;
Published: 15 July 2022.
Edited by:
Yuxin Fan, Lanzhou University, ChinaReviewed by:
Shugang Kang, Institute of Earth Environment (CAS), ChinaCopyright © 2022 Cao, Jiang, Xu, Zhao and Zhao. This is an open-access article distributed under the terms of the Creative Commons Attribution License (CC BY). The use, distribution or reproduction in other forums is permitted, provided the original author(s) and the copyright owner(s) are credited and that the original publication in this journal is cited, in accordance with accepted academic practice. No use, distribution or reproduction is permitted which does not comply with these terms.
*Correspondence: Jiandong Xu, MjAxODk5MDA1OUBxaHUuZWR1LmNu
Disclaimer: All claims expressed in this article are solely those of the authors and do not necessarily represent those of their affiliated organizations, or those of the publisher, the editors and the reviewers. Any product that may be evaluated in this article or claim that may be made by its manufacturer is not guaranteed or endorsed by the publisher.
Research integrity at Frontiers
Learn more about the work of our research integrity team to safeguard the quality of each article we publish.