- 1Geology Department, Faculty of Science, Assiut University, Assiut, Egypt
- 2Abdullah Alrushaid Chair for Earth Science Remote Sensing Research, Geology and Geophysics Department, College of Science, King Saud University, Riyadh, Saudi Arabia
- 3Geoelectric and Geomagnetism Department, National Research Institute of Astronomy and Geophysics, Helwan, Egypt
- 4Department of Environmental Engineering, Umm Al-Qura University, Makkah, Saudi Arabia
- 5Faculty of Civil Engineering and Geoscience, Delft University of Technology, Delft, Netherlands
Saudi Arabia is seeking fresh groundwater resources to face the increase in anthropogenic activities. The groundwater storage variations and occurrence were investigated and the surface and subsurface structures influencing the groundwater resources in the research area were defined using a combined study of Gravity Recovery and Climate Experiment, aeromagnetic data, and electrical resistivity data with other relevant datasets. Results are: The groundwater storage fluctuation is calculated at −0.34 ± 0.01 mm/yr during the period 04/2002-12/2021. The area is receiving an average annual rainfall rate of 117.6 mm during the period 2002 to 2019. Three structural trends, defined in the directions of NS, NNW, and NNE are cutting the sedimentary cover and the basement rocks. The sedimentary cover ranges from 0 to 1.2 km thick. Vertical electrical sounding results indicate three main geoelectric layers: the surface geoelectrical layer of higher resistivity values (428-9626 Ω. m) is made up of unconsolidated Quaternary sediments; the water-bearing layer of saturated sands with a resistivity range between 5.1 and 153 Ω. m and with depths vary from 1 to 94 m, and highly fractured basement rocks with resistivity values ranging from 813 to 6030 Ω. m. The integrated results are useful in providing a comprehensive image of the study area’s surface and subsurface structures, as well as groundwater potential in the southwestern part of Saudi Arabia. Our integrated approach provides a reproducible model for assessing groundwater potential in arid and semiarid areas.
Introduction
Saudi Arabia is the largest arid country in the Middle East, with an area of 2.24 × 10⁶ km2 in the Arabian Peninsula. Saudi Arabia is an arid country with limited water resources. Due to the increasing demand and unreliable sources of surface water, about 75-85% of water supplies come from groundwater, which is essentially classified as a fossil water resource. Minor natural recharge might occur in the mountainous areas. Therefore, investigating groundwater occurrence plays an important role in the country.
The launch of the Gravity Recovery and Climate Experiment (GRACE) mission opened up new possibilities for monitoring and estimating the terrestrial component of the hydrological cycle, which includes groundwater resources (Tapley et al., 2004). GRACE anomalies in terrestrial water storage (TWS) are widely employed in hydrological applications ranging from regional to global scales (e.g., Wouters et al., 2014; Frappart et al., 2019). In recent years, several studies were carried out to assess the hydrological settings and components of major basins and large aquifers. For instance, GRACE and Global Land Data Assimilation System (GLDAS) data, with other observed data were used to differentiate the Mississippi River basin’s water budget and came up with respectable results (Yeh et al., 1998; Yeh et al., 2006; Rodell et al., 2007). Furthermore, some studies in the Arab world have combined GRACE with other relevant information to quantify groundwater storage variability and estimate aquifer recharge and depletion rates (Mohamed et al., 2014; Mohamed et al., 2015; Fallatah et al., 2017; Mohamed et al., 2017; Fallatah et al., 2019; Mohamed, 2019; Mohamed, 2020a; Mohamed, 2020b; Mohamed, 2020c; Mohamed et al., 2021; Mohamed and Gonçalvès, 2021; Taha et al., 2021; Mohamed et al., 2022b). GRACE can be used to fill the blanks in hydrologically monitoring data (Famiglietti et al., 2011).
It offers global monthly fluctuations in terrestrial water storage (ΔTWS) (Wahr et al., 2004; Syed et al., 2008). GRACE data has a low horizontal resolution, and there is no vertical resolution for GRACE data, which makes this use difficult (e.g., Ahmed et al., 2016). GRACE is unable to distinguish between contributions from TWS’s multiple compartments (for example, surface water, groundwater, and soil moisture). The combination of land surface model outputs with GRACE data is now allowing individual elements from GRACE-derived TWS estimates to be extracted and the data’s horizontal resolution to be improved.
The magnetic method has been widely applied for delineation of the structural trends of the subsurface structures and estimating the depth of the basement crystalline rocks in many regions (Al-Garni, 2004a; Al-Garni, 2004b; Al-Garni et al., 2005; Al-Garni et al., 2006; Sultan et al., 2009; Al-Garni, 2010). The aeromagnetic data is integrated with remote sensing data to investigate groundwater resources (Meneisy and Al Deep, 2020; Mohamed and Ella, 2021). Bakheit et al. (2013) used airborne magnetic data to trace and analyze structural trends to locate the position of tectonic lines and subsurface structures. Eldosouky et al. (2022a) used the analytical signal and the horizontal gradient magnitude to map the structures of Gabal Shilman area. Saada et al. (2022) have applied the regional-residual separation, tilt derivative, and spectral analysis techniques to better understanding the structural features for the east of the Qattara depression area using magnetic and gravity data. Ranganai and Ebinger (2008) assessed the regional groundwater resources using an integrated approach of Landsat images with aeromagnetic data at south-central Zimbabwe Craton.
Separating the deep from the shallow sources of potential field anomalies and recognizing their edges are crucial in geophysics (Eldosouky, 2019; Pham et al., 2021a; Eldosouky and Mohamed, 2021; Eldosouky et al., 2022d). As a result, edge detection is an important analysis direction in pattern recognition for mapping structures, geologic contacts, and ore deposits (Oruç, 2011; Arisoy and Dikmen, 2013; Ibraheem et al., 2018; Eldosouky et al., 2020; Eldosouky and Saada, 2020; Pham et al., 2020; Pham et al., 2021a; Saada et al., 2021a; Pham et al., 2021b; Saada et al., 2021b; Pham et al., 2021c; Pham et al., 2021d; Eldosouky et al., 2021; Eldosouky et al., 2021; Melouah et al., 2021; Eldosouky et al., 2022a; Eldosouky et al., 2022b; Eldosouky et al., 2022c; Sehsah and Eldosouky, 2022).
The geoelectrical resistivity, electromagnetic, seismic refractive, gravity, magnetic, and radioactivity techniques are among the surface geophysical methods utilized in groundwater study. Overburden thickness, aquiferous zones, bedrock architecture, and topography can all be estimated using these methods (Adagunodo et al., 2014; Joel et al., 2016; Adagunodo et al., 2017; Oyeyemi et al., 2017; Adagunodo et al., 2018). The current research is based on the use of electrical resistivity as a geophysical tool for groundwater exploration that is considered the most promising and appropriate technology for groundwater exploration and aids in the identification of the appropriate place for groundwater investigation.
The electrical resistivity method was widely used for issues associated with groundwater exploration (Mousa, 2003; Hosny et al., 2005; Nigm et al., 2008; Mohamaden et al., 2009) in different media by detecting the surface effects produced by the flow of electric current inside the earth and correlation between the electrical properties of geological formations and their fluid content. The aquifer material, pore space volume, fluid quantity, and salinity level all have an impact on electrical resistivity values. Moreover, the water-bearing formations’ geometry has been assessed. (Robain et al., 1995; Robain et al., 1996). This electrical resistivity method was employed to identify the saline-freshwater interface zone (Yechieli, 2000; Choudhury et al., 2001), water-related parameters (Kosinski and Kelly, 1981; Frohlich and Kelly, 1988; Troisi et al., 2000) and water quantity (Kessels et al., 1985). Furthermore, contaminated groundwater zones influence the electrical resistivity approach (Karlik and Kaya, 2001). The resistivity technique has been effectively utilized to determine the formations’ thickness and groundwater potential (Raju and Reddy, 1998) and to study the groundwater potential and the aquifer system of fractured hard rocks (Chandra et al., 2012; Ologe et al., 2014; Al Deep et al., 2021). It has also been combined with borehole data to estimate geohydraulic parameters from Abi’s fractured shales and sandstone aquifers (Ebong et al., 2014). In hard rock environments, geoelectrical resistivity techniques have been widely used to delineae shallow subsurface lineamnets and fractures (Ebong et al., 2014; Almadani et al., 2019) and faults (Suzuki et al., 2000; Fazzito et al., 2009), which are the targets of groundwater investigation (Titus et al., 2009). Ebong et al. (2021) have applied vertical electrical sounding (VES) and electrical resistivity tomography techniques to evaluate the geological features and groundwater potential of the Obudu basement complex in southeastern Nigeria. Because of its availability, simplicity, and developments in computer software and other inversion approaches, VES is the most often used groundwater prospecting technique (Kana et al., 2015).
Morsy and Othman (2021) have applied an integrated approach of electrical resistivity and ground-penetrating radar with topographic data to evaluate the groundwater potential zones in the southwestern part of Makkah city. Their results show that the groundwater accumulation is localized in faulted-bounded depressions and wadis. Sharaf (2011) has integrated the resistivity and seismic measurements with test holes drilled in the As Suqah area, Makkah ditrcit. His findings demonstrate that groundwater is found mostly in two water-bearing zones: alluvial deposits and the Haddat Ash Sham and Ash Shumaysi formations’ clastic sedimentary rocks. Taha et al. (2021) used gravity and electrical resistivity data to investigate the groundwater resources of wadi Sar in Hijaz mountains on a regional and local scale. Their findings reveal a general downward trend in groundwater storage variation computed at −2.00 ± 0.34 mm/yr from 04/2002 to 07/2017, as well as the presence of a water-bearing layer with low resistivity and variable thickness in fractured basement rocks of Wadi Sar. Despite the fact that similar studies may be conducted in various locations in Saudi Arabia’s southwest, no previous studies using our proposed geophysical methodologies have been conducted for the entire study area, which is located between longitudes 41.91° and 45.61° and latitudes 17.26° and 19.12°.
Other satellite and airborne geophysical field datasets have been utilized to explore crustal features at the continental scale (Mohamed and Al Deep, 2021), the geometry of the magma chamber and heat flow (Mohamed et al., 2022a), and land subsidence caused by heavy groundwater withdrawal (Othman, 2019; Othman and Abotalib, 2019).
GRACE and GRACE Follow-On (GRACE-FO) solutions are used in conjunction with other climatic data to track spatial and temporal changes in water storage as a result of climate change and/or anthropogenic activities. The study also aims to investigate the groundwater potential of the study area using airborne magnetic data and electrical resistivity technique. Magnetic data was used to identify structural features and map the depth to underlying crystalline rocks that affect groundwater in the study area, whereas the shallow electrical survey was carried out to investigate the depth of the groundwater and the subsurface geology in the study area.
Geological and Hydrogeological Setting
According to Greenwood et al. (1982), there are two primary subdivisions of layered rocks on the southern Arabian Shield south of latitude 22° N. An older ensimatic-arc complex and a younger marginal-arc complex are involved. Greywacke and mafic to intermediate volcanic rocks of the essentially contemporaneous Baish, Bahah, and Jidah groups make up the older arc complex. The younger arc complex is ensimatic in nature and partly superimposed over the older arc complex. The Halaban group, which was located to the east and northeast of the older ensimatic-arc complex, formed part of the younger arc group’s ensimatic portion. The Ablah, Samran, and maybe Arafat groups reflect the superimposed parts of the younger arc complex. The Halaban group consists of andesitic and dacitic volcanic rocks as well as related clastic sedimentary rocks.
Based on the distribution of layered rock units of various ages and the orientation of overlying structural features, a number of N to NE-trending belts were delineated in the southern part of the Arabian Shield. Major fault zones run the length of these belts, defining their limits. The majority of these boundary faults go north and dip severely. Folds and other lineations in and around them frequently plunge down dip, both shallowly and steeply. Many of these faults are folded in random locations along their strike (Greenwood et al., 1982).
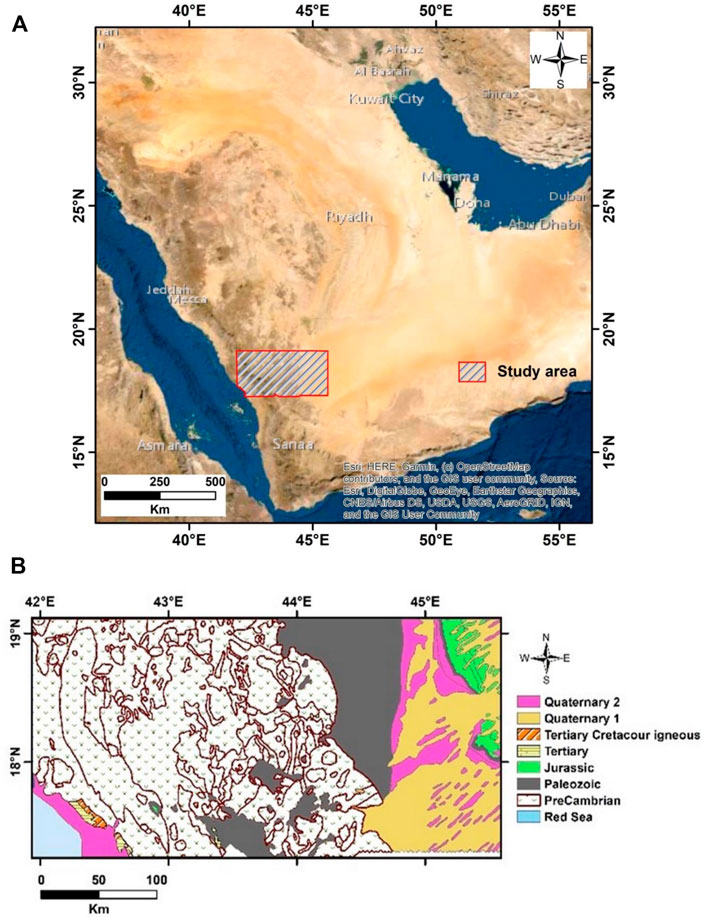
Our study region is located in the southwestern part of Saudi Arabia (Figure 1A). Its geology is shown in Figure 1B. The study region’s exposed basement rocks are made up of two separate units: Khamis Mushayt Gneiss and pegmatites. The Khamis Mushayt Gneiss rocks, which include banded orthogneiss, migmatite with little paragneiss, and amphibolite, are the major basement unit in the area. There are various aplite and pegmatite dikes in this unit. Quartz, orthoclase, plagioclase, and biotite make up the pegmatite unit. Flat-lying Cambrian-Ordovician sandstones and spatially variable alluvial deposits of pebbles, gravels, sands, and clays overlay these two basement layers in some locations. In the western part of the area, the old Wajid Sandstone rocks appear. After the end of late Proterozoic igneous activity, the Cambrian-Ordovician Wajid Sandstone rocks were deposited.
According to field research, the majority of the aquifer in the researched area is made up of cracked and jointed hard rocks, which are then refilled by precipitation via infiltration. Shallow aquifers with varied porosity and permeability are formed by cracked and jointed hard rocks, affecting the aquifer storage coefficient. Groundwater flow is reduced by fine sediments deposited in joints, cracks, and faults in hard rocks, allowing runoff loss and aquifer recharging. By digging the rocks below, the water from these aquifers is pumped through the drilled wells (Khan, et al., 2022).
Materials and Methods
GRACE/FO Data
GRACE is a pair of satellites that measure changes in the Earth’s gravitational field in both spatial and temporal variations. It was launched in 2002 as a collaborative US-German project (Tapley et al., 2004). Changes in water content are the primary cause of changes in the Earth’s gravity field. There are two sources of the GRACE/FO datasets, represented by the spherical harmonic and mass concentration solutions (mascon). In this study, the mascon products were used in the current study. With improved spatial resolution and minimal inaccuracy, these mascons capture all of the signals detected by GRACE within the GRACE noise limits. Smoothing filtering and/or Spectral de-striping are not required with the mascon solutions. Furthermore, there is no need for a scaling technique for the CSR-M. CSR-M (Save et al., 2016; Save, 2020; released from the Center for Space Research; http://www2.csr.utexas.edu/grace/), and JPL-M (Watkins et al., 2015; Wiese et al., 2016, Wiese et al., 2018; Landerer et al., 2020; released from the Jet Propulsion Laboratory; http://grace.jpl.nasa.gov), two versions of GRACE/FO mascon solutions, are used to calculate the ΔTWS that are available from april 2002 to June 2017 for GARCE and from June 2018 to December 2021 for GRCE/FO. Monthly gravity field fluctuations provided by the JPL-M data are of release 06, and with 0.5 ° × 0.5 ° grids (Watkins et al., 2015; Wiese, et al., 2016; Wiese, et al., 2018; Landerer et al., 2020). A subset of these JPL mascons crosses coasts and includes signals from both land and sea mass changes. As a post-processing step, the Coastal Resolution Improvement filter was used for the entire mascon solution to detect land and ocean mass from individual mascons that cross coastlines (Watkins et al., 2015). Therefore, the scaling factor must apply to the JPL-M to recover the leakage signals. In comparison to the RL05 version, the CSR mascon products of release 06, and with 0.25 ° × 0.5 ° grids (Save et al., 2016; Save 2020) use a freshly designed grid. The hexagonal tiles that cover the shoreline in this new grid are split into two tiles along the coast to reduce signal loss between land and sea. The cubic-spine approach was used to interpolate the missing monthly data. The time series and secular trends of TWS and groundwater storage variations (GWS) were constructed using the two potential solutions, and the TWS trend was produced.
GLDAS, TRMM, and SRTM Data
GLDAS is an observational data assimilation system with satellite and ground-based components. It produces optimal fields of land surface states and fluxes using advanced land surface modelling and data assimilation techniques. For soil moisture storage (ΔSMS), outputs of GLDAS (Rodell et al., 2004; https://disc.gsfc.nasa.gov/datasets) are employed. In this work, the averaging of three GLDAS versions (CLSM, VIC and NOAH) was used. To calculate the ΔGWS, the ΔSMS changes are subtracted from the ΔTWS using Eq 1
The Tropical Rainfall Measuring Mission (TRMM; https://disc.gsfc.nasa.gov/datasets) is a collaborative space mission designed to monitor and analyze tropical rainfall (Kummerow, 1998). TRMM and Shuttle radar topography mission (SRTM) data are used. The monthly TRMM data, covering the January 2002-December 2019 period with a spatial resolution of 0.25° × 0.25°, are used to create the average annual rainfall (AAR) and to generate the monthly rainfall time series and the AAR rate over the study area. A Digital Elevation Model (DEM) was created using SRTM data with a 90 m resolution that was used for the delineation of the stream networks in the area. Landsat eight datasets were used to extract the surface lineaments affecting the area.
Aeromagnetic Data
The total magnetic intensity (TMI) map used in the current study was provided from the Saudi Geological Survey. The TMI map was subjected to different filtering techniques such as the reduction to the pole, tilt derivative, and analytical signal. These filters were used to enhance the image’s signal intensity, evaluate the magnetic anomalies qualitatively, and calculate the depth to the magnetic sources. The Geosoft program (Geosoft oasis montaje, V.8.2.4, 2015) was used to handle and analyze the aeromagnetic data. Figure 2 shows the reduced-to-pole (RTP) magnetic map.
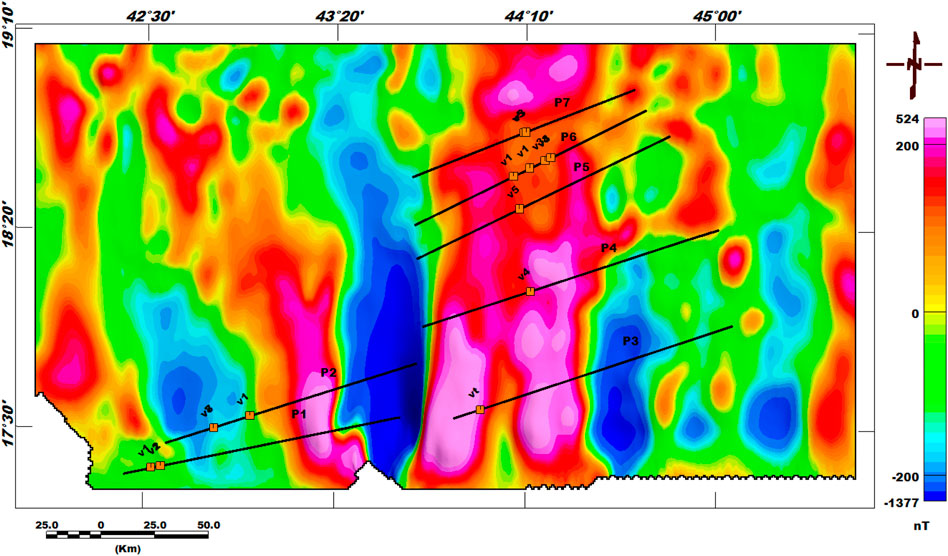
FIGURE 2. The RTP map of the study area shows the locations of the 2D profiles and the Vertical Electrical Soundings.
The RTP filter is used to eliminate the skewness of magnetic anomalies induced by non-vertical magnetization directions. The RTP anomalies’ maxima are directly over the causal bodies, making explanations easier (Lu et al., 2003). The TMI data were corrected for the RTP in this investigation using the Oasis Montaj Fourier transformation approach (Geosoft oasis montaje, V.8.2.4, 2015). The parameters of the International Geomagnetic Reference Field (IGRF) are as follows: The total magnetic field intensity was 39,582 nT, and the inclination and declination were 25.5 and 1.6, respectively. These characteristics were utilized to produce the RTP map (Figure 2) from the TMI field.
The magnetic anomalies’ edges and locations were sharpened using the Tilt angle (TDR) derivative (Mushayandebvu et al., 2001). It is applicable in mapping mineral investigations and shallow basement structures (Geosoft oasis montaje, V.8.2.4, 2015). It was defined by Miller and Singh (1994), as the ratio of a vertical to a combined horizontal derivative as in Eq.2:
The potential field is represented by f, and the vertical derivative of the field is (∂f/∂z). The tilt angle is positive when above the source, at the edge where the vertical derivative is zero and the horizontal derivative is a maximum, and negative when beyond the source region. The tilt angle can be used to trace the pattern of the edges because it produces a zero value over the source edges (Miller and Singh, 1994). The tilt amplitudes are in the range of -π/2 to +π/2.
To detect the borders of the magnetic structures, the total horizontal derivative (THDR) technique was used extensively (Pilkington and Keating, 2004; Cowan et al., 2005; Cooper, 2009). It calculates the potential field’s rate of change in horizontal directions (Cordell, 1979). The faulted boundaries may have high gradient zones, which can be identified using horizontal derivative maps. The horizontal gradient approach has the advantage of being less vulnerable to data noise because it only involves the computation of the field’s two first-order horizontal derivatives (Phillips, 1998). The horizontal gradient’s amplitude (Cordell and Grauch, 1985) is represented as :
The horizontal derivatives of the field in the x and y directions are (∂f/∂x) and (∂f/∂y), respectively. When applied to field observations, TDR and THDR (Figure 3) both operate as an automatic gain control filter.
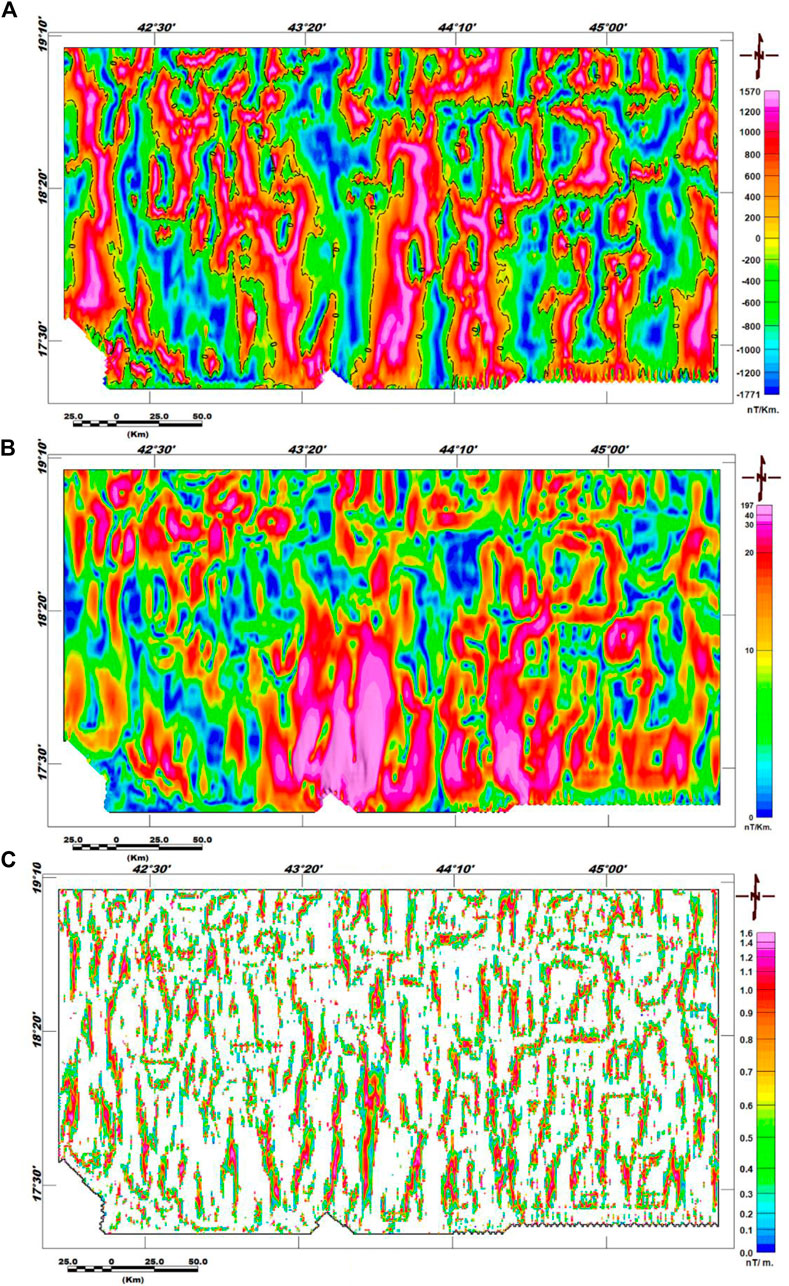
FIGURE 3. Tilt derivative angle (A), Total horizontal derivative (B), and Enhanced horizontal gradient amplitude (C) maps of the study area.
To detect the magnetic and gravity source edges, Pham et al. (2020) designed a new edge detection filter. The real part (R) of an arcsine function (asin) of the ratio of the vertical gradient to the total gradient of the amplitude of the field’s horizontal gradient is used to create the new Enhanced Horizontal Gradient Amplitude (EHGA) filter. They tested its usefulness in defining source edges using synthetic and real data, and compared the results to those produced by other methods. Edges produced by the filter are more accurate and have a higher resolution. Eq 4 gives the EGHA edge detector:
Where HGA is the potential field’s entire horizontal gradient amplitude. HGAx, HGAy, and HGAz are the x, y, and z gradients of the HGA. K is a positive number decided by the interpreter.
Geoelectrical Data
On the local scale, the use of geophysical techniques for groundwater investigation has increased considerably during the previous decade due to the high advances and developments in electronic technology and numerical modeling solutions (Metwaly et al., 2009; Ndlovu et al., 2010). The electrical resistivity is a common method for groundwater exploration due to its low cost, simple operation, and efficiency.
Electrical resistivities of subsurface materials can be measured using geoelectrical techniques. These measurements provide information on underlying geoelectrical layers, structures, and groundwater occurrence (Van Overmeeren, 1989; Dahlin et al., 1999a; Muchingami et al., 2012). Archie’s Law (Archie, 1942) describes the occurrence of fluid in the fluid-bearing formations and suggests that the resistance decreases with increased water content according to an inverse power law as follows:
Where ρo is the fully saturated rock’s resistivity, ρf is the water filling the pores’ resistivity, φ is the porosity, and a and m are empirical parameters (Keller and Frischknecht, 1966).
The cementation exponent is defined by the m parameter, which has values ranging from one to 5. (Glover, 2010). Regarding the soil moisture content, Grellier et al. (2005) demonstrated that Archie’s law can be reduced to Eq 6:
Where θw is the medium’s gravimetric moisture content, and α is a quantity that includes the medium’s bulk density, as in Eq 7:
Passing an electrical current (I) between two metallic electrodes and measuring the potential difference (V) between them is the electrical resistivity method. The apparent resistivity is calculated using the following equation (ρa, Eq 8) (Dahlin, 2001):
K, a geometrical factor, depends only on the position of the electrodes.
Twelve vertical electrical resistivity soundings (VESes), with current electrode (AB) separation, ranging between 200 and 500 m, were conducted along eight profiles (Figure 2) using a Schlumberger array. The apparent resistivity value depends on the geometrical configuration of the electrode array, as defined by the geometric factor.
The IP2WIN (2005) application was used to process the VESes. The experimental data curve has been divided into smaller curves. Each one is a geoelectrical unit with a known resistivity Ω.m) and thickness (m), and it could represent a geologic layer with different physical attributes than the layers above and below it.
Results
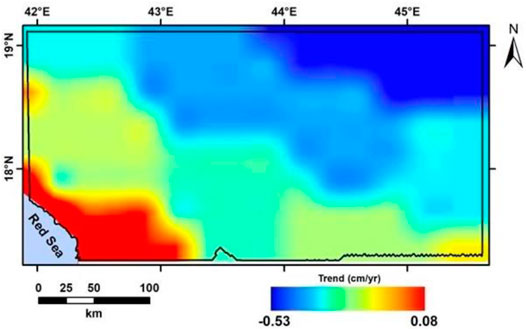
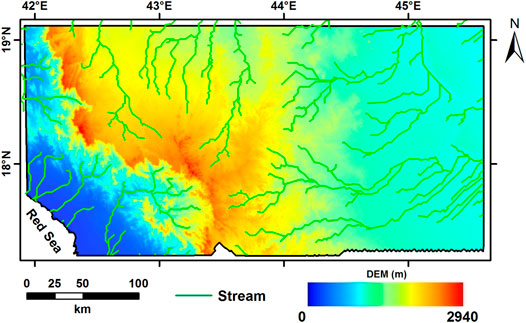
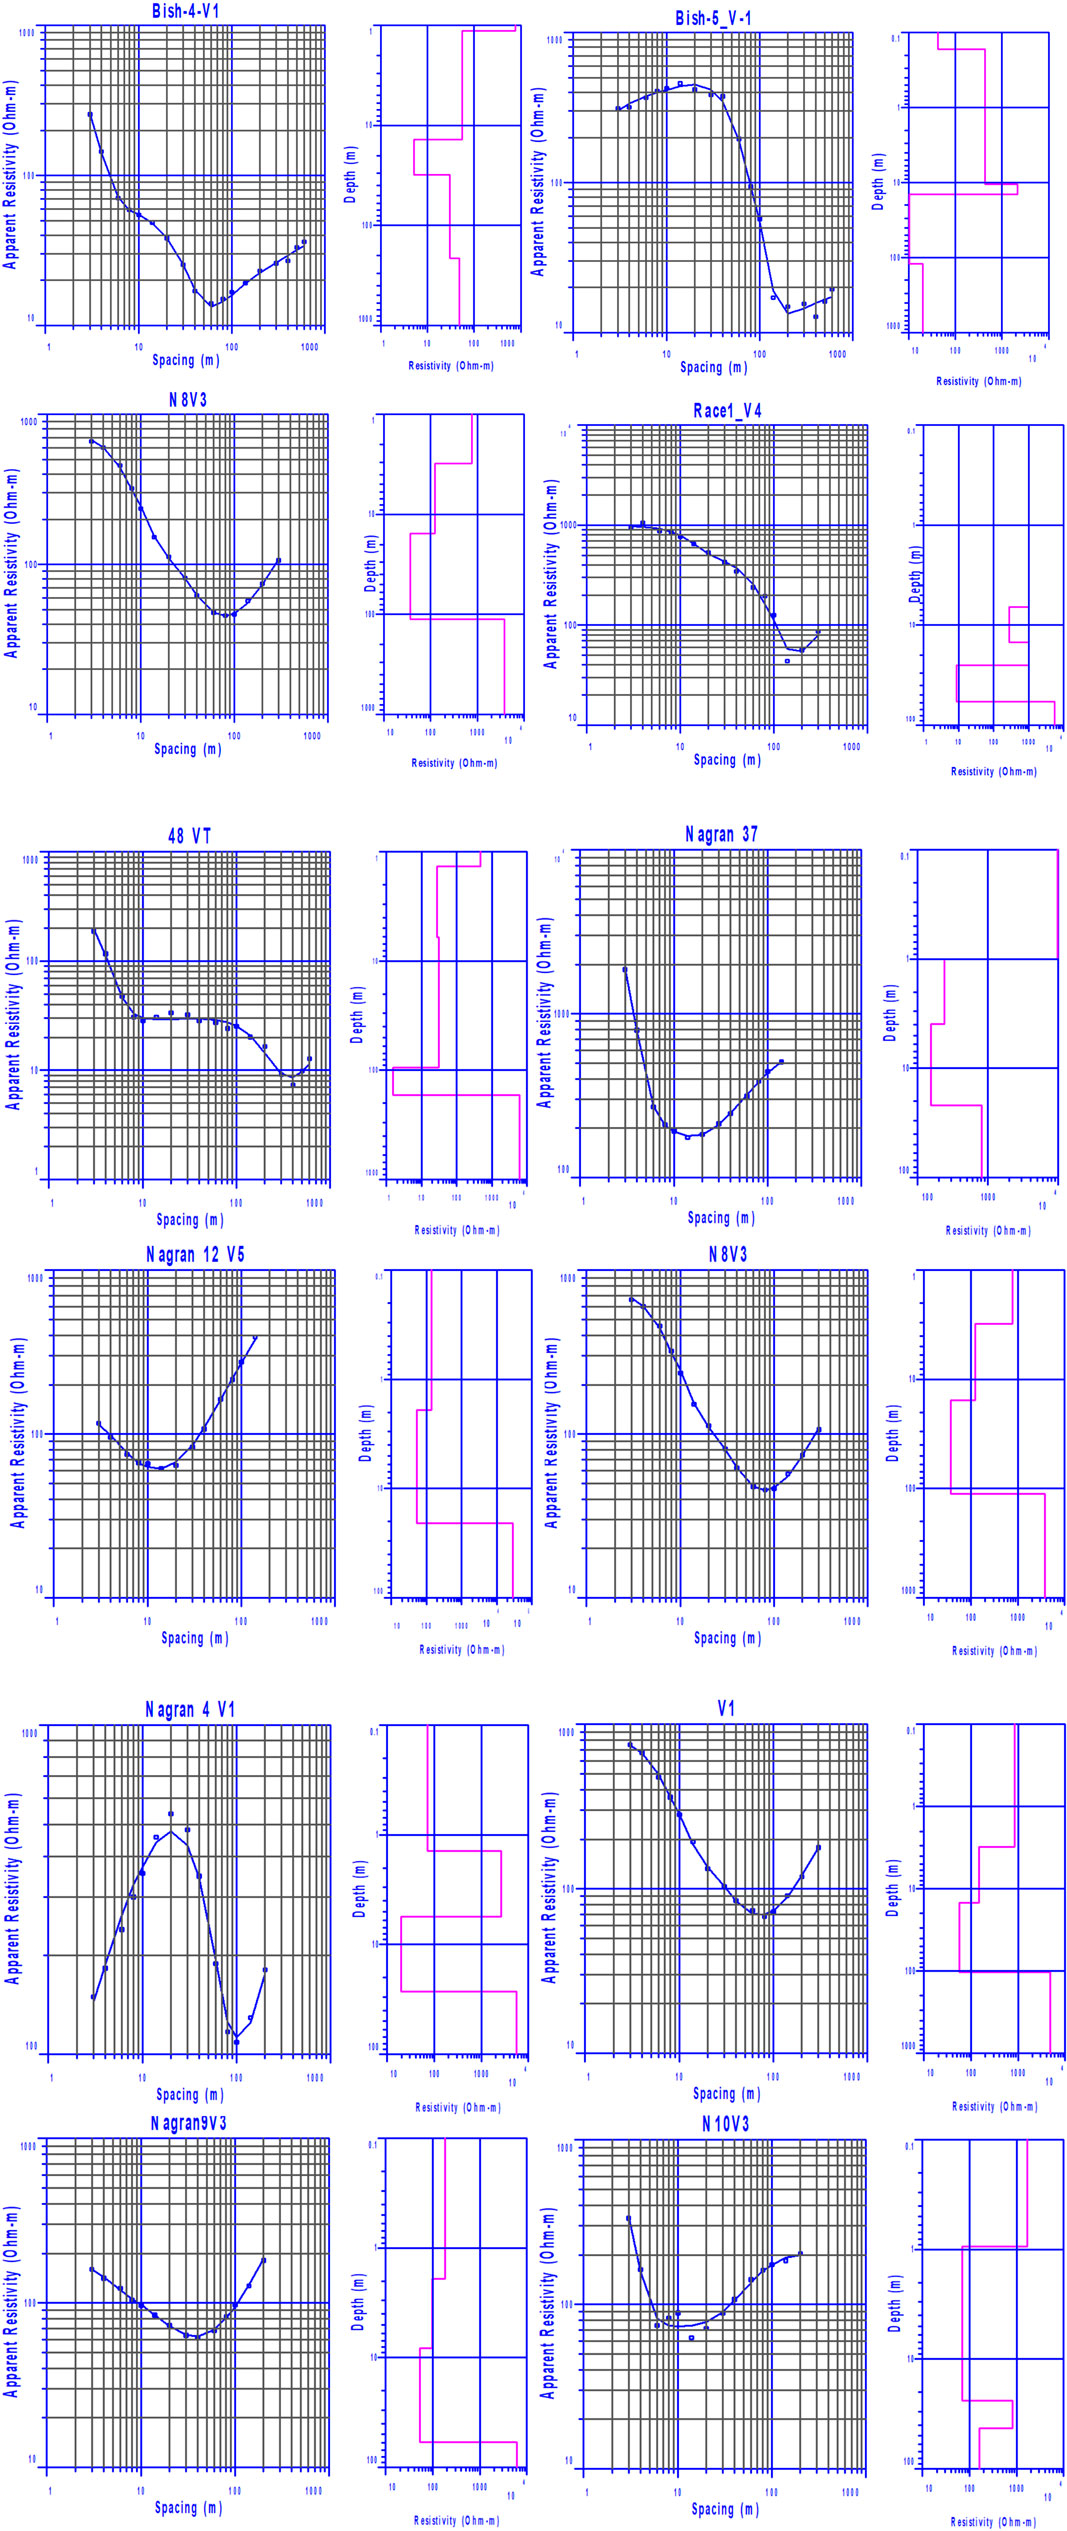
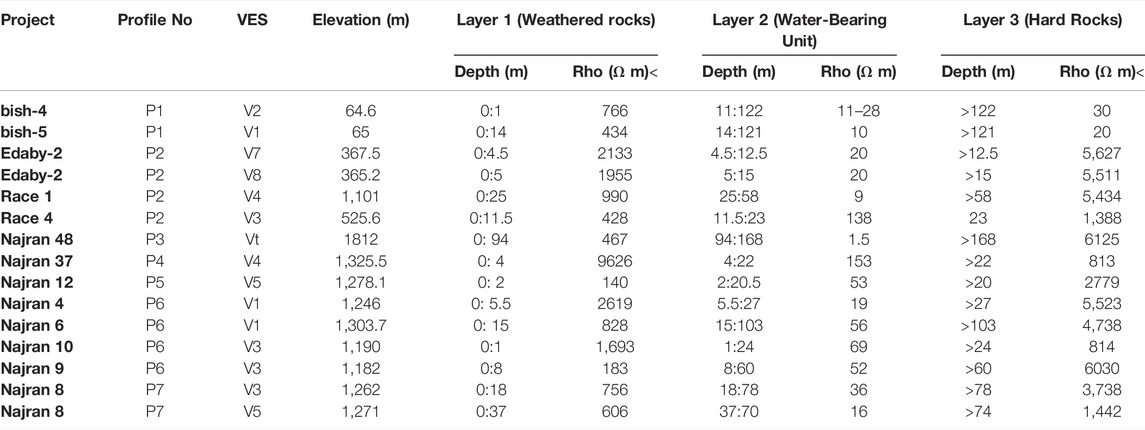
The results of the processed TRMM data are shown in Figure 4. Analyses of the rainfall data show a general positive AAR trend over the study area estimated at 117.6 mm/yr. The results of the spatial distribution of the secular trend in GRACE-derived ΔTWS data and the monthly ΔTWS time series over the study area are shown in Figures 5, 6. Both the ΔTWS and ΔGWS from the two mascon datasets show a negative trend estimated at −0.34 ± 0.01 cm/yr over the entire period. The RTP, TDR, THDR, and EHGA maps are shown in Figures 2, 3. These maps show that the study area is affected by subsurface structural trends in the directions of NS, NNW, and NNE. The ground surface relief is forming streams (Figure 8) taking the surface water away towards the E, N, and W. The surface structures were extracted from the Landsat images (Figure 9). Surface and subsurface main trends in the direction of NNW are delineated from the Landsat images (Figure 9) and the RTP map (Figure 10), respectively. The subsurface geology is represented by two layers (Figure 11) of different magnetic susceptibility values reflecting the top sedimentary cover and the lower basement crystalline rocks. The inversion of the resistivity data resulted in three geoelectrical layers (Figure 12) with varied physical attributes. Higher resistant unconsolidated Quaternary sediments make up the first geolectrical layer, low resistant sands saturated with water make up the second layer, and low to high resistant fractuted and/or massive basement rocks make up the third one (Table 2).

FIGURE 4. (A) Monthly rainfall rate (mm/month) derived from TRMM data over the area. (B) the average annual rainfall (AAR) was taken from TRMM data. (C) Annual rainfall rate (mm) for the research area.
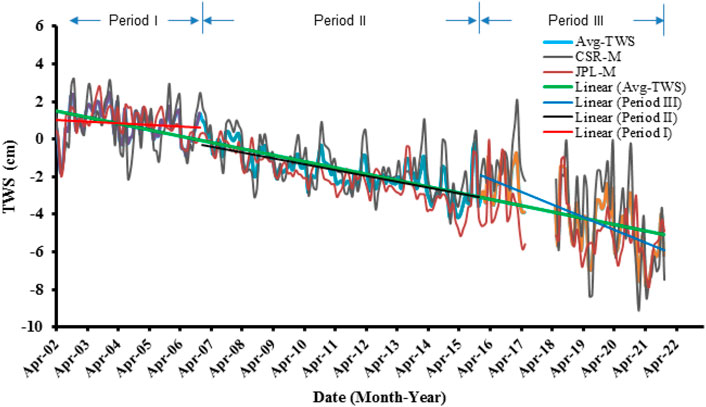
FIGURE 6. ΔTWS from JPL-M and CSR-M mascon products across the study area, as well as their averaging (Avg-TWS) during the investigated time.
Discussion
In this work, we used a combined method using GRACE satellite data with other airborne and ground-based geophysical data to investigate the groundwater potentialities of the southwestern part of Saudi Arabia. The monthly rainfall rate (Figure 4A) is higher in the March to September months and lower in the October to February months. The coastline region had a higher AAR rate of about 300 mm, whilst the eastern parts had lower values of up to 50 mm (Figure 4B). The AAR time series (Figure 4C) shows a generally positive trend with the AAR of 117.6 mm throughout the period 2002-2019. The AAR rate is one of the most important characteristics of a region’s climate, as well as its associated ecosystem types and habitats. The amount of rainfall a region receives has an impact on stream density, water availability, land cover type, and agricultural output. Based on the linear regression analysis of the AAR; three time periods are distinguished (Figure 4C). Period I (2002-2006) shows an AAR of 124.8 mm/yr; Period II (2007-2015) shows a minimal AAR of 97.4 mm/yr; Period III (2016-2019) shows the highest AAR of 161.3 mm/yr. Period II is consistent with the onset of the 2007 drought and the dry climatic conditions that affected the Middle East area (Trigo et al., 2010). As a result, the region has suffered from water scarcity and limited water resources since the beginning of that drought (Wolf and Newton 2007; IRIN 2010; Voss et al., 2013; Mohamed, 2020b). However, the higher AAR rate during Period III indicates that the study area is receiving a substantial precipitation rate.
The research area had an overall negative TWS trend over the entire period (04/2002-12/2021), as shown in Figure 5. The southwestern part of the research area has a little positive TWS rate (+0.08 cm/yr), but the northeastern part has a negative TWS rate (−0.5 cm/yr). Figure 6 shows the monthly time series of TWS fluctuations from the two mascon products, as well as their mean. Witnessing of this figure shows a general depletion in ΔTWS rate estimated at −0.30 ± 0.02, −0.38 ± 0.01, and −0.34 ± 0.01 cm/yr from the CSR-M, JPL-M, and their mean, respectively during the entire period. The ΔTWS time series has three trends throughout the entire study period based on the linear regression analysis of the average (Figure 6). Period I shows a slightly negative trend, calculated at −0.09 ± 0.09 cm/yr (Table 1). A negative TWS Δtrend is estimated at −0.31 ± 0.03 cm/yr for Period II, whereas Period III shows a highly negative trend, calculated at −0.67 ± 0.09 cm/yr.
The GLDAS-derived ΔSMS for Periods I, II, III, and the entire period are +0.12 ± 0.19, +0.04 ± 0.04, −0.18 ± 0.14 and +0.03 ± 0.02 mm/yr, respectively assuming that large crystalline rocks occupy the majority of the surface area. To estimate the fluctuations in the ΔGWS (Figure 7), the non-groundwater component, represented by the ΔSMS, was subtracted from the ΔTWS. During Periods I, II, III, and the entire period, average depletion rates of −0.10 ± 0.08, −0.32 ± 0.03, −0.66 ± 0.09 and −0.34 ± 0.01 cm/yr were obtained for the ΔGWS trend values, respectively. The ΔTWS and ΔGWS trends both follow the same pattern.
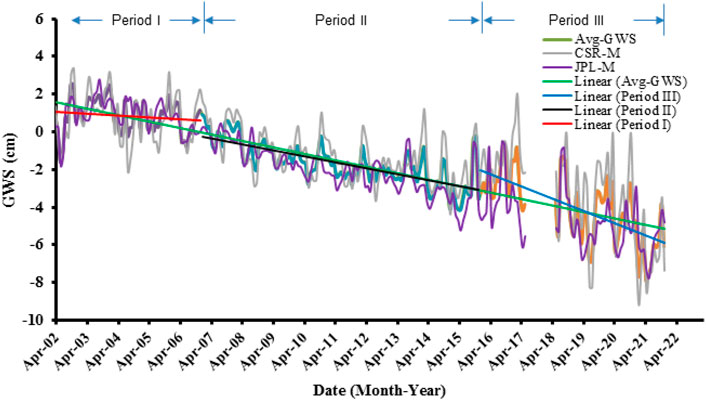
FIGURE 7. Time series and averaging of ΔGWS from JPL-M and CSR-M mascon products across the study area over the investigated time.
Inspection of Figure 4C indicates that there is a general increase in the AAP rate during Period III; however, the highest ΔGWS depletion rate (Figure 7) is observed in that Period. This is largely attributed to the drainage pattern and the surface material of the study area. Inspection of Figure 8 shows the stream networks overlay the DEM. It shows higher relief of about 2000-2900 m in the Mountainous area close to the Red Sea coastal area. It decreases north and eastward to low values of about 1,000 m in its eastern part. It shows a steep slope toward the west at the coastal area. Surface water that may be formed from the substantial rainfall is being drained away from these stream networks toward the east and north. The rest of the surface water drains into the Red Sea’s coastline area. This may explain the negative trend in ΔGWS over the study area. Moreover, the eastern and central parts of the area are occupied by massive crystalline rocks that help the surface water drain away north and eastwards. Part of the surface water is drained toward the coastal area which shows a positive TWS value (Figure 5).
Witnessing Figure 2 shows that the magnetic intensity values vary from −1,377 to +524 nT. The lithological changes, basement relief, and/or faulting and folding may be the cause of the variations in the magnetic intensity values. Lower and higher magnetic anomalies are almost arranged in N-S and NNW directions. The enhanced edges of linear features in the TDR map (Figure 3A) could be attributable to deep and shallow magnetic sources (Miller and Singh, 1994). The most important advantage of the TDR is its zero contour line that suggests the locations of the subsurface structures caused by sharp changes. The magnetic anomalies are practically aligned in definite orientations, generating structural trends in the NS, NNW, and NNE directions, as seen in the TDR map (Figure 3A) and its zero contour line. The edges of the maxima are well-defined in the THDR map (Figure 3B), assuming that amplitude enhancement is preserved. It calculates the potential field’s rate of change in horizontal directions. The structural trend in the NS direction can be detected from the magnetic anomalies that are oriented in a slightly NS direction, according to the THDR (Figure 3B). The EHGA map (Figure 3C) reveals that the structural trends are almost in the NS direction, with higher resolution and sharper responses over the edges of the study area’s magnetic sources.
The surface geologic features (lineaments) of the study area were mapped using Landsat eight images (Figure 9A). The extraction of these lineaments from remote sensing data can be done through automatic extraction (Anwar et al., 2013; Rayan, 2013). Several computer-assisted lineament extraction methods have been proposed. The majority of the methods rely on edge filtering. The PCI Geomatica’s LINE module is the most extensively used software for automatic lineament extraction. The predominant trend derived from the analysis of geological lineaments is in the NNW direction (Figure 9B). The subsurface trends of fault lines were also analyzed using the trend analysis technique according to their lengths, abundance, and magnitude concerning the azimuth. The magnetic structures have a significant relation with the intensity, direction, and geometry of the magnetic anomaly trends (Hall, 1964). Subsurface tectonics are delineated using magnetic trend patterns (Affleck, 1963). The trend analysis technique was applied to delineate the subsurface trends controlling the groundwater flow pathways in the area. The trend analysis shows that the main structural trends are in NNW, NNE, and NE directions (Figure 10). Minor trends are represented in the NS direction. The lineaments could also be interpreted as the edges of geological bodies and directions of structures. The integration of the delineated surface and subsurface structural trends may indicate the continuity of the NNW trend within the basement rocks and the overlying sedimentary deposits. This leads to a connection between the shallow Quaternary and the deeply fractured basement rocks aquifers that may feed the deeper aquifer. The subsurface structural trend and related fractures, on the other hand, are draining groundwater and recharging water away to the north, west, and east. This causes also a depletion in the groundwater storage of the study area, as estimated from the GRACE data at −0.34 ± 0.01 mm/yr during the period 04/2002-12/2021. However, groundwater can be accumulated at the intersection zones of the faults.
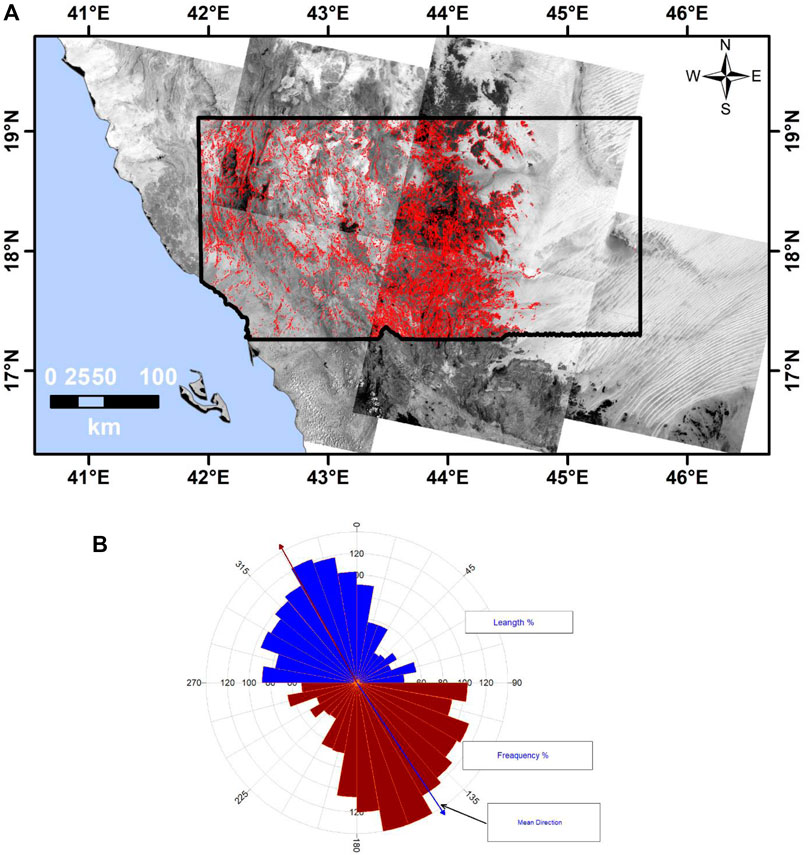
FIGURE 9. (A) Landsat images with extracted surface lineaments, and (B) a rose diagram with the major structural patterns.

FIGURE 10. (A) Magnetic lineaments extracted from the RTP map; (B) a rose diagram highlighting the major structural patterns.
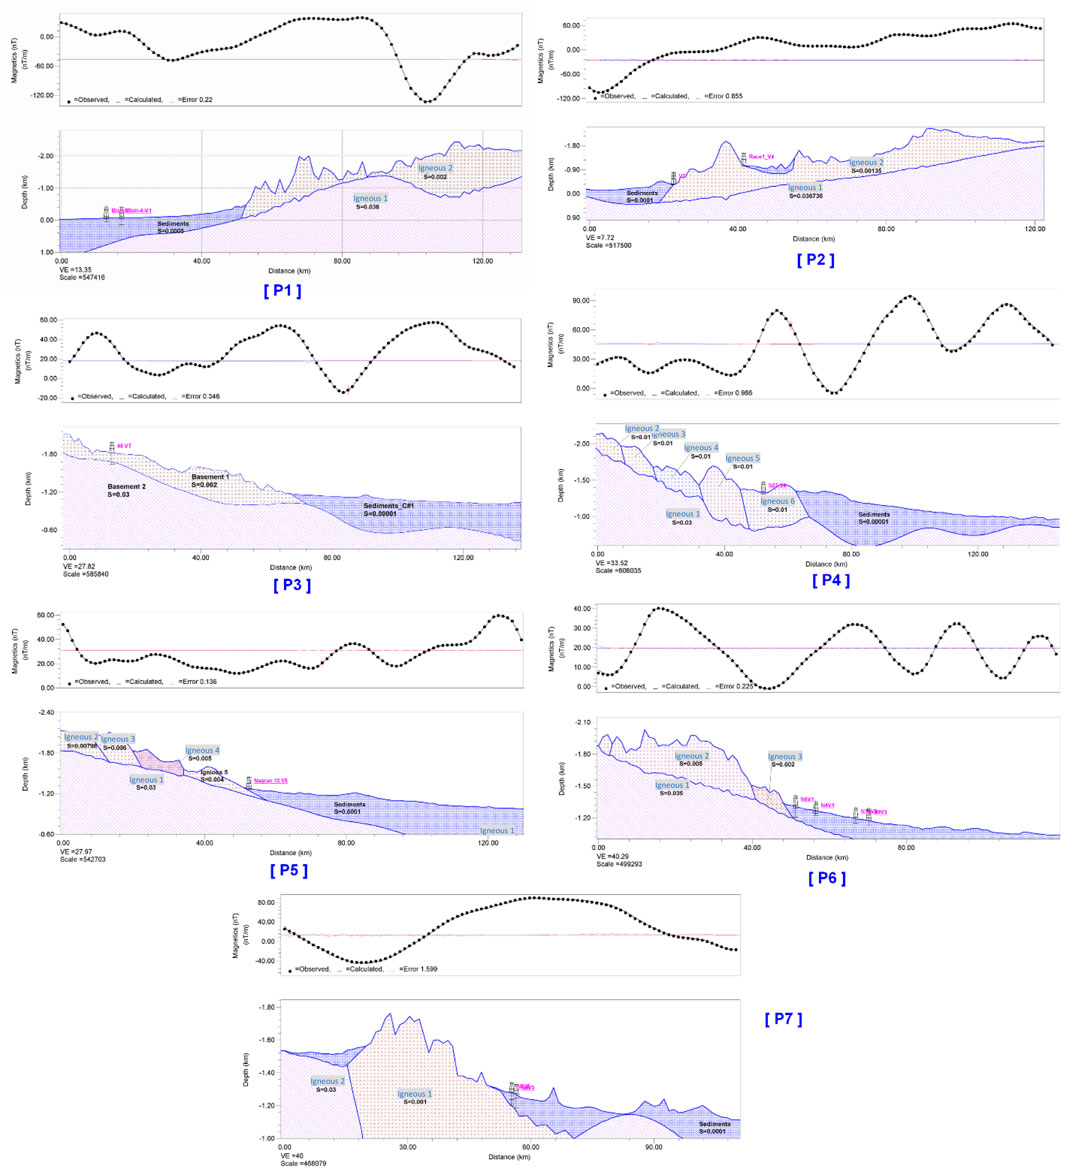
The underlying geology was investigated and the thickness of the sediments overlying the crystalline basement rocks was estimated using 2D modeling of magnetic data along profiles. To create 2D models from magnetic data, we used the Geosoft GM-SYS software package. We can optimize the model using the GM-SYS inversion option. Modeling programs require adequate initial estimations of model parameters such as body form, susceptibility, topography, depth, and magnetization of suspected sources to minimise errors of non-unique solution between observed and calculated magnetic fields. The profiles’ models are illustrated in Figure 11. The geological succession is mostly represented by two rock types, according to these models: (a) the upper sedimentary layer that is composed of Quaternary and/or Paleozoic sediments, and (b) the lower Pre-Cambrian crystalline rocks that are composed of granitic and metamorphic rocks. A two-layer model was applied in the modeling, given that the Quaternary cover is the non-magnetized layer, and the basement is the magnetized layer. The magnetic susceptibility values of 0.00001–0.0005 CGS and 0.001–0.038 CGS units were chosen for the non-magnetized sedimentary and the more magnetized basement rocks, respectively. The thickness of the Quaternary sediments shows wide variations, it varies from 0 to ∼1.2 km in the study area. The fewer thickness of the sedimentary cover in that area is suggesting the presence of lower groundwater potential in the upper sedimentary aquifer.
Three geoelectrical units (Figure 12; Table 2) of known resistivity and thickness values are recognized, which may reflect geologic layers of physical properties that differ from those located above and below. The details of the geoelectrical units are described in the following: The surface geoelectrical layer has different resistivity and thickness values varying from one place to another. The resistivity values of the first layer are varying from 428 Ω m at V3 (Race 4) to 9626 Ω m at V4 (Najran 37), whereas the thickness values are varying from 1 m at VES V1 (bish-4) and VES Vt (Najran 10) to about 94 m at VES 3 (Najran 48). The second geoelectrical layer represents the water-bearing unit in the study area. This layer has resistivity values varying from 5.1 Ω m at V1 (bish-4) to 153 Ω m at V4 (Najran 37), and thickness values varying from 8 m at V7 (Edaby-2) to 107 m at V1 (bish-5). The third geoelectrical layer is represented by low to high resistant basement rocks with resitivity values varying from 20 Ω m at V1 (P1, bish-5) and 30 Ω m at V2 (P1, bish-4) to 6125 Ω m at Vt (P3, Najran 48) and 6030 Ω m at V3 (P6, Najran 9). The lower resistivity values for that layer at particular VES points could result from the presence of fractured basement rocks saturated with water that lowers the resetivity values. In contrast, the higher resistivity values for that layer at certain VES points could indicate the presence of more resistant massive basement rocks. Our current VES interpretation and results are in good agreement with the results of resistivity data at Wadi Sar (Taha et al., 2021), which is located in the northwestern part of the research area. Piezometric wells should be drilled in the wadis of the western portion of the area in the future to test and verify the study’s findings, however, this is dependent on budget availability.
Conclusion
For the study region, an integrated strategy combining gravity, magnetic, and electrical data with other remote sensing datasets was used. The study area is receiving an average rainfall rate of 117.6 mm/yr forming surface stream networks. Part of the surface water is drained to the Red Sea by the streams, while the rest is drained to the eastern and northern parts of the land. The groundwater shows a depletion trend estimated at −0.34 ± 0.01 mm/yr during the entire period 04/2002-12/2021. The surface trends are in NNW, and the deep trends are in NS, NNW, and NNE directions according to an examination of the structural trends retrieved from Landsat images and magnetic data. The thickness of the sediments varies greatly, ranging from a low of 0 in the mountainous areas to a high of 1.2 km in the valleys. The water-bearing unit has a thickness ranging from 8 to 107 m with low resistivity values of 5.1-153 Ω m. The depth of that unit fluctuates between 1 and 94 m. The average yearly rainfall over the research region is ranging between ∼300 mm in the coastal area and up to 50 mm in its eastern parts. The eastern part, as well as the lowlands of the wadies in the west, could be potential areas for agricultural growth and the construction of new villages.
Data Availability Statement
The original contributions presented in the study are included in the article/supplementary material further inquiries can be directed to the corresponding authors.
Author Contributions
All authors listed have made a substantial, direct, and intellectual contribution to the work and approved it for publication.
Conflict of Interest
The authors declare that the research was conducted in the absence of any commercial or financial relationships that could be construed as a potential conflict of interest.
Publisher’s Note
All claims expressed in this article are solely those of the authors and do not necessarily represent those of their affiliated organizations, or those of the publisher, the editors and the reviewers. Any product that may be evaluated in this article, or claim that may be made by its manufacturer, is not guaranteed or endorsed by the publisher.
Acknowledgments
The authors extend their appreciation to the Abdullah Alrushaid Chair for Earth Science Remote Sensing Research for funding.
References
Adagunodo, T. A., Adeniji, A. A., Erinle, A. V., Akinwumi, S. A., Adewoyin, O. O., Joel, E. S., et al. (2017). Geophysical Investigation into the Integrity of a Reclaimed Open Dumsite for Civil Engineering Purpose. Interciencia J. 42, 324–339.
Adagunodo, T. A., Akinloye, M. K., Sunmonu, L. A., Aizebeokhai, A. P., Oyeyemi, K. D., and Abodunrin, F. O. (2018). Groundwater Exploration in Aaba Residential Area of Akure, Nigeria. Front. Earth Sci. 6, 66. doi:10.3389/feart.2018.00066
Adagunodo, T. A., Sunmonu, L. A., and Oladejo, O. P. (2014). “Effect of Constructing High-Rise Buildings without a Geophysical Survey,” in Nigerian J. Phys. Spec. Edition. Abuja: Nigerian Institute, 91–100.
Affleck, J. (1963). Magnetic Anomaly Trend and Spacing Patterns. Geophysics 28 (3), 379–395. doi:10.1190/1.1439188
Ahmed, M., Sultan, M., Yan, E., and Wahr, J. (2016). Assessing and Improving Land Surface Model Outputs over Africa Using GRACE, Field, and Remote Sensing Data. Surv. Geophys. 37 (3), 529–556. doi:10.1007/s10712-016-9360-8
AL Deep, M., Araffa, S. A. S., Mansour, S. A., Taha, A. I., Mohamed, A., and Othman, A. (2021). Geophysics and Remote Sensing Applications for Groundwater Exploration in Fractured Basement: A Case Study from Abha Area, Saudi Arabia. J. Afr. Earth Sci. 184. doi:10.1016/j.jafrearsci.2021.104368
Al-Garni, M. A. (2004b). Application of Magnetic and Electrical Geophysical Methods in Exploration of Groundwater Resources of Wadi Malakan, Saudi Arabia. J. King Abdulaziz Univ. Earth Sci. 16, 67–93. doi:10.4197/Ear.16-1.5
Al-Garni, M. A., Hassanein, H., and Gobashy, M. (2006). Geophysical Investigation of Groundwater in Wadi Lusab, Haddat Ash Sham Area, Makkah Al-Mukarramah, Arab Gulf. J. Sci. Res. 24 (2), 83–93.
Al-Garni, M. A., Hassanein, H. I., and Gobashy, M. (2005). Ground-magnetic Survey and Schlumberger Sounding for Identifying the Subsurface Geologic Factors Controlling the Groundwater Flow along Wadi Lusab, Makkah Al-Mukarramah, KSA. J. Petrophysics Geophys. 4 (2), 59–74. National research institute, Cairo, Egypt.
Al-Garni, M. A. (2010). Magnetic Survey for Delineating Subsurface Structures and Estimating Magnetic Sources Depth, Wadi Fatima, KSA. J. King Saud Univ. - Sci. 22, 87–96. doi:10.1016/j.jksus.2010.02.005
Al-Garni, M. A. (2004a). Schlumberger Sounding and Magnetic Survey in Wadi Al-Damm, Makkah Al-Mukarramah, Saudi Arabia. J. Petroleum Min. Eng. (JPME) 7, 45–60.
Almadani, S., Ibrahim, E., Al-Amri, A., Fnais, M., and Abdelrahman, K. (2019). Delineation of a Fractured Granite Aquifer in the Alwadeen Area, Southwest Saudi Arabia Using a Geoelectrical Resistivity Survey. Arab. J. Geosci. 12 (15), 449. doi:10.1007/s12517-019-4646-z
Anwar, A., Shawki, N., and Abdoh, G. (2013). Landsat ETM-7 for Lineament Mapping Using Automatic Extraction Technique in the SW Part of Taiz Area, Yemen. Glob. J. Hum. Soc. Sci. Geogr. geo-science, Environ. Disaster Manag. 13 (3), 35. VER 1.0.,
Archie, G. E. (1942). The Electrical Resistivity Log as an Aid in Determining Some Reservoir Characteristics. Trans. AIME 146, 54–62. doi:10.2118/942054-g
Arisoy, M., and Dikmen, Ü. (2013). Edge Detection of Magnetic Sources Using Enhanced Total Horizontal Derivative of the Tilt Angle. Bull. Earth Sci. Appl. Res. Cent. Hacet. Univ. 34, 73–82.
Bakheit, A. A., Abdel Aal, G. Z., El-Haddad, A. E., and Ibrahim, M. A. (2013). Subsurface Tectonic Pattern and Basement Topography as Interpreted from Aeromagnetic Data to the South of El-Dakhla Oasis, Western Desert, Egypt. Arabian J. Geoscience 7, 2165–2178. doi:10.1007/s12517-013-0896-3
Chandra, S., Nagaiah, E., Reddy, D. V., Rao, V. A., and Ahmed, S. (20122012). Exploring Deep Potential Aquifer in Water Scarce Crystalline Rocks. J. Earth Syst. Sci. 121, 1455–1468. doi:10.1007/s12040-012-0238-y
Choudhury, K., Saha, D. K., and Chakraborty, P. (2001). Geophysical Study for Saline Water Intrusion in a Coastal Alluvial Terrain. J. Appl. Geophys. 46 (3), 189–200. doi:10.1016/s0926-9851(01)00038-6
Cooper, G. R. (2009). Balancing Images of Potential-Field Data. Geophysics 74, L17–L20. doi:10.1190/1.3096615
Cordell, L., and Grauch, V. J. S. (1985). “Mapping Basement Magnetization Zones from Aeromagnetic Data in the San Juan Basin, New Mexico,” in The Utility of Regional Gravity and Magnetic Anomaly Maps. Editor W. J. Hinze (Oklahoma, USA: Society of Exploration Geophysicists. Society of Exploration Geophysicists), 181–197. doi:10.1190/1.0931830346.ch16
Cordell, L. (1979). “Gravimetric Expression of Graben Faulting in Santa Fe Country and the Espanola Basin, New Mexico,” in Guidebook to Santa Fe Country. Editor R. V. Ingersoll (Socorro: New Mexico Geological Society), 59–64.
Cowan, D., Cooper, G. R. J., and Cooper, G. (2005). Separation Filtering Using Fractional Order Derivatives. Explor. Geophys. 36, 393–396. doi:10.1071/eg05393
Dahlin, T. (2001). The Development of Electrical Imaging Techniques. Comput. Geosci. 27 (9), 1019–1029. doi:10.1016/S0098-3004(00)00160-6
Dahlin, T., Bjelm, L., and Svensson, C. (1999a). Use of Electrical Imaging in Site Investigations for a Railway Tunnel through the Hallandsås Horst, Sweden. Q. J. Eng. Geol. Hydrogeology 32, 163–172. doi:10.1144/gsl.qjeg.1999.032.p2.06
Ebong, E. D., Abong, A. A., Ulem, E. B., and Ebong, L. A. (2021). Geoelectrical Resistivity and Geological Characterization of Hydrostructures for Groundwater Resource Appraisal in the Obudu Plateau, Southeastern Nigeria. Nat. Resour. Res. 30, 2103–2117. doi:10.1007/s11053-021-09818-4
Ebong, E. D., Akpan, A. E., and Onwuegbuche, A. A. (2014). Estimation of Geohydraulic Parameters from Fractured Shales and Sandstone Aquifers of Abi (Nigeria) Using Electrical Resistivity and Hydrogeologic Measurements. J. Afr. Earth Sci. 96, 99–109. doi:10.1016/j.jafrearsci.2014.03.026
Eldosouky, A. M. (2019). Aeromagnetic Data for Mapping Geologic Contacts at Samr El-Qaa Area, North Eastern Desert, Egypt. Arab. J. Geosci. 12, 2. doi:10.1007/s12517-018-4182-2
Eldosouky, A. M., El-Qassas, R. A. Y., Pham, L. T., Abdelrahman, K., Alhumimidi, M. S., El Bahrawy, A., et al. (2022c). Mapping Main Structures and Related Mineralization of the Arabian Shield (Saudi Arabia) Using Sharp Edge Detector of Transformed Gravity Data. Minerals 12, 71. doi:10.3390/min12010071
Eldosouky, A. M., Elkhateeb, S. O., Mahdy, A. M., Saad, A. A., Fnais, M. S., Abdelrahman, K., et al. (2022a). Structural Analysis and Basement Topography of Gabal Shilman Area, South Eastern Desert of Egypt, Using Aeromagnetic Data. J. King Saud. Univ. – Sci. 34 (2), 1018–3647. doi:10.1016/j.jksus.2021.101764
Eldosouky, A. M., and Mohamed, H. (2021). Edge Detection of Aeromagnetic Data as Effective Tools for Structural Imaging at Shilman Area, South Eastern Desert, Egypt. Arab. J. Geosci. 14, 13. doi:10.1007/s12517-020-06251-4
Eldosouky, A. M., Pham, L. T., Abdelrahman, K., Fnais, M. S., and Gomez-Ortiz, D. (2022d). Mapping Structural Features of the Wadi Umm Dulfah Area Using Aeromagnetic Data. J. King Saud. Univ. – Sci. 34 (2), 1018–3647. doi:10.1016/j.jksus.2021.101803
Eldosouky, A. M., Pham, L. T., El-Qassas, R. A. Y., Hamimi, Z., and Oksum, E. (2021). “Lithospheric Structure of the Arabian-Nubian Shield Using Satellite Potential Field Data,” in The Geology of the Arabian-Nubian Shield. Regional Geology Reviews. Editors Z. Hamimi, A. R. Fowler, J. P. Liégeois, A. Collins, M. G. Abdelsalam, and M. Abd EI-Wahed (Cham: Springer), 139–151. doi:10.1007/978-3-030-72995-0_6
Eldosouky, A. M., Pham, L. T., and Henaish, A. (2022b). High Precision Structural Mapping Using Edge Filters of Potential Field and Remote Sensing Data: A Case Study from Wadi Umm Ghalqa Area, South Eastern Desert, Egypt. Egypt. J. Remote Sens. Space Sci. 25 (2), 501–513. doi:10.1016/j.ejrs.2022.03.001
Eldosouky, A. M., Pham, L. T., Mohmed, H., and Pradhan, B. (2020). A Comparative Study of THG, AS, TA, Theta, TDX and LTHG Techniques for Improving Source Boundaries Detection of Magnetic Data Using Synthetic Models: A Case Study from G. Um Monqul, North Eastern Desert, Egypt. J. Afr. Earth Sci. 170, 103940. doi:10.1016/j.jafrearsci.2020.103940
Eldosouky, A. M., and Saada, S. A. (2020). Source Edge Detection (SED) of Aeromagnetic Data: Synthetic Examples and a Case Study from Haimur Area, South Eastern Desert, Egypt. Arab. J. Geosci. 13, 626. doi:10.1007/s12517-020-05653-8
Fallatah, O. A., Ahmed, M., Cardace, D., Boving, T., and Akanda, A. S. (2019). Assessment of Modern Recharge to Arid Region Aquifers Using an Integrated Geophysical, Geochemical, and Remote Sensing Approach. J. Hydrology 569, 600–611. doi:10.1016/j.jhydrol.2018.09.061
Fallatah, O. A., Ahmed, M., Save, H., and Akanda, A. S. (2017). Quantifying Temporal Variations in Water Resources of a Vulnerable Middle Eastern Transboundary Aquifer System. Hydrol. Process 31, 4081–4091. doi:10.1002/hyp.11285
Famiglietti, J. S., Lo, M., Ho, S. L., Bethune, J., Anderson, K. J., Syed, T. H., et al. (2011). Satellites Measure Recent Rates of Groundwater Depletion in California’s Central Valley. Geophys Res. Lett. 38, LO3403. doi:10.1029/2010GL046442
Fazzito, S. Y., Rapalini, A. E., Cortés, J. M., and Terrizzano, C. M. (2009). Characterization of Quaternary Faults by Electric Resistivity Tomography in the Andean Precordillera of Western Argentina. J. S. Am. Earth Sci. 28 (3), 217–228. doi:10.1016/j.jsames.2009.06.001
Frappart, F., Papa, F., Güntner, A., Tomasella, J., Pfeffer, J., Ramillien, G., et al. (2019). The Spatio-Temporal Variability of Groundwater Storage in the Amazon River Basin. Adv. Water Resour. 124, 41–52. doi:10.1016/j.advwatres.2018.12.005
Frohlich, R. K., and Kelly, W. E. (1988). Estimates of Specific Yield with the Geoelectric Resistivity Method in Glacial Aquifers. J. Hydrology 97 (1–2), 33–44. doi:10.1016/0022-1694(88)90064-9
Geosoft oasis montaje, V.8.2.4 (2015). Geosoft Software for the Earth Sciences. Toronto, Canada: Geosoft Inc.
Glover, P. W. J. (2010). A Generalized Archie’s Law for N Phases. Geophysics 75 (6), 85–91. doi:10.1190/1.3509781
Greenwood, W.,R., Stoeser, D. B., Fleck, R. J., and Stacey, J. S. 1982. Late Proterozoic Island-Arc Complexes and Tectonic Belts in the Southern Part of the Arabian Shield, Kingdomof Saudi Arabia: Saudi Arabian Deputy Ministry for Mineral Resources Open-File Report USGSOF-02-8, 46.
Grellier, S., Bouye, J. M., Guerin, R., Robain, H., and Skhiri, N. (2005). “Electrical Resistivity Tomography (ERT) Applied to Moisture Measurements in Bioreactor: Principles, In Situ Measurements and Results,” in Proc. International Workshop on Hydro-Physico-Mechanics of Landfills (Grenoble, France).
Hall, D. H. (1964). Magnetic and Tectonic Regionalization on Texada Island, British Columbia. Geophysics 29 (4), 565–581. doi:10.1190/1.1439394
Hosny, M. M., El-Deen, E. Z. Z., Abdallah Abdel Rahman, A. A., and Barseim, M. S. (2005). Geoelectrical Study on the Groundwater Occurrence in the Area Southwest of Sidi Barrani, Northwestern Coast, Egypt. Egypt. Geophys. Soc. J. 3, 109–118.
Ibraheem, I. M., Elawadi, E. A., and El-Qady, G. M. (2018). Structural Interpretation of Aeromagnetic Data for the Wadi El Natrun Area, Northwestern Desert, Egypt. J. Afr. Earth Sci. 139, 14–25. doi:10.1016/j.jafrearsci.2017.11.036
Integrated Regional Information Networks (2010). Syria: Drought Pushing Millions into Poverty. Available at: http://www.irinnews.org/Report/90442/SYRIA-Drought-pushing-millionsinto-poverty. (Accesses on April, 2022).
IPI2WIN program 2005. version 3.1 2: 17. 10. 08 (1990–2008) Copyright al 1990 (2010). Bobachev A.A, Programs Set for VEs Data Interpretation. Russia: Dep. Of Geophysics, geological fac. Moseeow state VnV. Fussow. 119899.
Joel, E. S., Olasehinde, P. I., De, D. K., and OmejeAdewoyin, M. O. O. (2016). Estimation of Aquifer Transmissivity from Geo-Physical Data. A Case Study of Covennat University and Environs, Southwestern Nigeria. Sci. Int. 28, 3379–3385.
Kana, J. D., Djongyang, N., Raïdandi, D., Njandjock Nouck, P., Nouayou, R., Tabod, T. C., et al. (2015). Geophysical Investigation of Low Enthalpy Geothermal Potential and Ground Water Reservoirs in the Sudano-Sahelian Region of Cameroon. J. Afr. Earth Sci. 110, 81–91. doi:10.1016/j.jafrearsci.2015.06.007
Karlik, G., and Kaya, M. A. (2001). Investigation of Groundwater Contamination Using Electric and Electromagnetic Methods at an Open Waste Disposal Site: a Case Study from Isparta, Turkey. Environ. Geol. 40, 725–731. doi:10.1007/s002540000232
Keller, G. V., and Frischknecht, F. C. (1966). Electrical Methods in Geophysical Prospecting. Oxford: Pergamon Press.
Kessels, W., Flentge, I., and Kolditz, H. (1985). Dc Geoelectric Sounding to Determine Water Content in the Salt Mine Asse (FRG). Geophys. Prospect. 33, 446–456. doi:10.1111/j.1365-2478.1985.tb00444.x
Khan, M. Y. A., ElKashouty, M., Subyani, A. M., Tian, F., and Gusti, W. (2022). GIS and RS Intelligence in Delineating the Groundwater Potential Zones in Arid Regions: a Case Study of Southern Aseer, Southwestern Saudi Arabia. Appl. Water Sci. 12, 3. doi:10.1007/s13201-021-01535-w
Kosinski, W. K., and Kelly, W. E. (1981). Geoelectric Soundings for Predicting Aquifer Properties. Ground Water 19, 163–171. doi:10.1111/j.1745-6584.1981.tb03455.x
Kummerow, C. (1998). Beamfilling Errors in Passive Microwave Rainfall Retrievals. J. Appl. Meteor. 37, 356–370. doi:10.1175/1520-0450(1998)037<0356:beipmr>2.0.co;2
Landerer, F. W., Flechtner, F. M., Save, H., Webb, F. H., Bandikova, T., Bertiger, W. I., et al. (2020). Extending the Global Mass Change Data Record: GRACE Follow‐On Instrument and Science Data Performance. Geophys. Res. Lett. 47, e2020GL088306. doi:10.1029/2020gl088306
Lu, H., Golay, X., Pekar, J. J., and van Zijl, P. C. M. (2003). Functional Magnetic Resonance Imaging Based on Changes in Vascular Space Occupancy. Magn. Reson. Med. 50, 263–274. doi:10.1002/mrm.10519
Melouah, O., Eldosouky, A. M., and Ebong, W. D. (2021). Crustal Architecture, Heat Transfer Modes and Geothermal Energy Potentials of the Algerian Triassic Provinces. Geothermics 96 (2021), 0375–0505. doi:10.1016/j.geothermics.2021.102211
Meneisy, A. M., and Al Deep, M. (2020). Investigation of Groundwater Potential Using Magnetic and Satellite Image Data at Wadi El Amal, Aswan, Egypt. Egypt. J. Remote Sens. Space Sci. 24, 293–309. doi:10.1016/j.ejrs.2020.06.006
Metwaly, M., El-Qady, G., Massoud, U., El-Kenawy, A., Matsushima, J., and Al-Arifi, N. (2009). Integrated Geoelectrical Survey for Groundwater and Shallow Subsurface Evaluation: Case Study at Siliyin Spring, El-Fayoum, Egypt. Int. J. Earth Sci. Geol. Rundsch 99, 1427–1436. doi:10.1007/s00531-009-0458-9
Miller, H. G., and Singh, V. (1994). Potential Field Tilt-A New Concept for Location of Potential Field Sources. J. Appl. Geophys. 32, 213–217. doi:10.1016/0926-9851(94)90022-1
Mohamaden, M. I. I., Abu Shagar, S., and Abdallah, G. A. (2009). Geoelectrical Survey for Groundwater Exploration at the Asyuit Governorates, Nile Valley. Egypt JKAU Mar. Sci. 20, 91–108. doi:10.4197/mar.20-1.7
Mohamed, A., Abdelrahman, K., and Abdelrady, A. (2022b). Application of Time-Variable Gravity to Groundwater Storage Fluctuations in Saudi Arabia. Front. Earth Sci. 10, 873352. doi:10.3389/feart.2022.873352
Mohamed, A., Al Deep, M., Abdelrahman, K., and Abdelrady, A. (2022a). Geometry of the Magma Chamber and Curie Point Depth beneath Hawaii Island: Inferences from Magnetic and Gravity Data. Front. Earth Sci. Sect. Solid Earth Geophys. 10, 847984. doi:10.3389/feart.2022.847984
Mohamed, A., and Al Deep, M. (2021). Depth to the Bottom of the Magnetic Layer, Crustal Thickness, and Heat Flow in Africa: Inferences from Gravity and Magnetic Data. J. Afr. Earth Sci. 179, 104204. doi:10.1016/j.jafrearsci.2021.104204
Mohamed, A., and Ella, E. (2021). Magnetic Applications to Subsurface and Groundwater Investigations: a Case Study from Wadi El Assiuti, Egypt. Int. J. Geosciences 12, 77–101. doi:10.4236/ijg.2021.122006
Mohamed, A., and Gonçalvès, J. (2021). Hydro-geophysical Monitoring of the North Western Sahara Aquifer System's Groundwater Resources Using Gravity Data. J. Afr. Earth Sci. 178, 104188. doi:10.1016/j.jafrearsci.2021.104188
Mohamed, A. (2020b). Gravity Applications in Estimating the Mass Variations in the Middle East: a Case Study from Iran. Arab. J. Geosci. 13, 364. doi:10.1007/s12517-020-05317-7
Mohamed, A. (2020c). Gravity Applications to Groundwater Storage Variations of the Nile Delta Aquifer. J. Appl. Geophys. 182, 104177. doi:10.1016/j.jappgeo.2020.104177
Mohamed, A. (2020a). Gravity Based Estimates of Modern Recharge of the Sudanese Area. J. Afr. Earth Sci. 163, 103740. doi:10.1016/j.jafrearsci.2019.103740
Mohamed, A. (2019). Hydro-geophysical Study of the Groundwater Storage Variations over the Libyan Area and its Connection to the Dakhla Basin in Egypt. J. Afr. Earth Sci. 157, 103508. doi:10.1016/j.jafrearsci.2019.05.016
Mohamed, A., Ragaa Eldeen, E., and Abdelmalik, K. (2021). Gravity Based Assessment of Spatio-Temporal Mass Variations of the Groundwater Resources in the Eastern Desert, Egypt. Arab. J. Geosci. 14, 500. doi:10.1007/s12517-021-06885-y
Mohamed, A., Sultan, M., Ahmed, M., Yan, E., and Ahmed, E. (2017). Aquifer Recharge, Depletion, and Connectivity: Inferences from GRACE, Land Surface Models, and Geochemical and Geophysical Data. Geol. Soc. Am. Bull. 129, 534–546. doi:10.1130/B31460.1
Mohamed, A., Sultan, M., Ahmed, M., and Yan, E. (2014). Quantifying Modern Recharge to the Nubian Sandstone Aquifer System: Inferences from GRACE and Land Surface Models. San Francisco: American Geophysical Union, Fall Meeting. abstract id. G23A-0465.
Mohamed, A., Sultan, M., Yan, E., Ahmed, M., Sturchio, N., and Ahmed, E. (2015). San Francisco: American Geophysical Union, 476. Fall Meeting 2015, abstract id. A11E-0095.Towards a Better Understanding of the Hydrologic Setting of the Nubian Sandstone Aquifer System: Inferences from Groundwater Flow Models, Cl-36 Ages, and GRACE Data.
Morsy, E. A., and Othman, A. (2021). Delineation of Shallow Groundwater Potential Zones Using Integrated Hydrogeophysical and Topographic Analyses, Western Saudi Arabia. J. King Saud Univ. - Sci. 33 (7), 101559. doi:10.1016/j.jksus.2021.101559
Mousa, D. A. (2003). The Role of 1-D Sounding and 2-D Resistivity Inversions in Delineating the Near-Surface Lithologic Variations in Tushka Area, South of Egypt. Geophys. Soc. J. 1, 57–64.
Muchingami, I., Hlatywayo, D. J., Nel, J. M., and Chuma, C. (2012). Electrical Resistivity Survey for Groundwater Investigations and Shallow Subsurface Evaluation of the Basaltic-Greenstone Formation of the Urban Bulawayo Aquifer. Phys. Chem. Earth, Parts A/B/C 50-52, 44–51. doi:10.1016/j.pce.2012.08.014
Mushayandebvu, M. F., van Driel, P., Reid, A. B., and Fairhead, J. D. (2001). Magnetic Source Parameters of Two‐dimensional Structures Using Extended Euler Deconvolution. Geophysics 66, 814–823. doi:10.1190/1.1444971
Ndlovu, S., Mpofu, V., Manatsa, D., and Muchuweni, E. (2010). Mapping Groundwater Aquifers Using Dowsing, Slingram Electromagnetic Survey Method and Vertical Electrical Sounding Jointly in the Granite Rock Formation: a Case of Matshetshe Rural Area in Zimbabwe. J. Sustain. Dev. Afr. 12 (5), 199–208.
Nigm, A. A., Elterb, R. A., Nasr, F. E., and Thobaity, H. M. (2008). Contribution of Ground Magnetic and Resistivity Methods in Groundwater Assessment in Wadi Bany Omair. Holy Makkah Area, Saudi Arabia, Egyptian. Geophys. Soc. J. 6 (1), 67–79.
Ologe, O., Bankole, S. A., and Adeoye, T. O. (2014). Geo-Electric Study for Groundwater Development in Ikunri Estate, Kogi West, Southwestern Nigeria. Ilorin J. Sci. 1 (1), 154–166.
Oruç, B. (2011). Edge Detection and Depth Estimation Using a Tilt Angle Map from Gravity Gradient Data of the Kozaklı-Central Anatolia Region, Turkey. Pure Appl. Geophys 168, 1769–1780. doi:10.1007/s00024-010-0211-0
Othman, A., and Abotalib, A. Z. (2019). Land Subsidence Triggered by Groundwater Withdrawal under Hyper-Arid Conditions: Case Study from Central Saudi Arabia. Environ. Earth Sci. 78 (7), 243. doi:10.1007/s12665-019-8254-8
Othman, A. (2019). “Measuring and Monitoring Land Subsidence and Earth Fissures in Al-Qassim Region, Saudi Arabia: Inferences from InSAR,” in Advances in Remote Sensing and Geo Informatics Applications. Editors H. El-Askary, S. Lee, E. Heggy, and B. Pradhan (Cham: Springer), 287–291. CAJG 2018. Advances in Science, Technology & Innovation (IEREK Interdisciplinary Series for Sustainable Development). doi:10.1007/978-3-030-01440-7_66
Oyeyemi, K. D., Aizebeokhai, A. P., Adagunodo, T. A., Olofinnade, O. M., Sanuade, O. A., and Olaojo, A. A. (2017). Subsoil Characterization Using Geoelectrical and Geotechnical Investigations: Implications for Foundation Studies. Int. J. Civ. Eng. Technol. 8, 302–314.
Pham, L. T., Eldosouky, A. M., Oksum, E., and Saada, S. A. (2020). A New High-Resolution Filter for Source Edge Detection of Potential Field Data. Geocarto Int., 1–18 doi:10.1080/10106049.2020.1849414
Pham, L. T., Kafadar, O., Oksum, E., and Eldosouky, A. M. (2021b). An Improved Approach for Detecting the Locations of the Maxima in Interpreting Potential Field Data. Arab. J. Geosci. 14, 43. doi:10.1007/s12517-020-06399-z
Pham, L. T., Oksum, E., Do, T. D., Nguyen, D. V., and Eldosouky, A. M. (2021c). On the Performance of Phase-Based Filters for Enhancing Lateral Boundaries of Magnetic and Gravity Sources: a Case Study of the Seattle Uplift. Arab. J. Geosci. 14, 129. doi:10.1007/s12517-021-06511-x
Pham, L. T., Oksum, E., Vu, M. D., Vo, Q. T., Du Le-Viet, K., and Eldosouky, A. M. (2021a). An Improved Approach for Detecting Ridge Locations to Interpret the Potential Field Data for More Accurate Structural Mapping: a Case Study from Vredefort Dome Area (South Africa). J. Afr. Earth Sci. 175, 104099. doi:10.1016/j.jafrearsci.2020.104099
Pham, L. T., Vu, M. D., and Thi Le, S. (2021d). Performance Evaluation of Amplitude- and Phase-Based Methods for Estimating Edges of Potential Field Sources. Iran. J. Sci. Technol. Trans. Sci. 45 (4), 1327–1339. doi:10.1007/s40995-021-01122-3
Phillips, J. D. (1998). Processing and Interpretation of Aeromagnetic Data for the Santa Cruz Basin Patahonia Mountains Area. South-Central Arizona: U.S. Geological Survey. Open-File Report 02-98.
Pilkington, M., and Keating, P. (2004). Contact Mapping from Gridded Magnetic Data–A Comparison of Techniques. ASEG Ext. Abstr. 35 (4), 4. doi:10.1071/ASEG2004ab113
Raju, N. J., and Reddy, T. V. K. (1998). Fracture Pattern and Electrical Resistivity Studies for Groundwater Exploration. Environ. Geol. 34, 175–182. doi:10.1007/s002540050269
Ranganai, R. T., and Ebinger, C. J. (20082008). Aeromagnetic and Landsat TM Structural Interpretation for Identifying Regional Groundwater Exploration Targets, South-Central Zimbabwe Craton. J. Appl. Geophys. 65, 73–83. doi:10.1016/j.jappgeo.2008.05.009
Rayan, T. (2013). Automatic Extraction and Geospatial Analysis of Lineaments and Their Tectonic Significance in Some Areas of Northern Iraq Using Remote Sensing Techniques and GIS. Int. J. Enhanc. Res. Sci. Technol. Eng. 2 (2), 1. doi:10.13140/RG.2.2.20851.99363
Robain, H., Braun, J. J., Albouy, Y., and Ndam, J. (1995). “An Electrical Monitoring of an Elementary Watershed in the Rain Forest of Cameroon,” in Proceedings of 1st Environmental and Engineering Geophysics meeting (Torino, Italy. European Association of Geoscientists and Engineers), 411–414.
Robain, H., Descloitres, M., Ritz, M., and Atangana, Q. Y. (1996). A Multiscale Electrical Survey of a Lateritic Soil System in the Rain Forest of Cameroon. J. Appl. Geophys. 34, 237–253. doi:10.1016/0926-9851(95)00023-2
Rodell, M., Chen, J., Kato, H., Famiglietti, J. S., Nigro, J., and Wilson, C. R. (2007). Estimating Groundwater Storage Changes in the Mississippi River Basin (USA) Using GRACE. Hydrogeol. J. 15, 159–166. doi:10.1007/s10040-006-0103-7
Rodell, M., Houser, P. R., Jambor, U., Gottschalck, J., Mitchell, K., Meng, C.-J., et al. (2004). The Global Land Data Assimilation System. Bull. Amer. Meteor. Soc. 85 (3), 381–394. doi:10.1175/bams-85-3-381
Saada, A. S., Eldosouky, A. M., Abdelrahm, K., Al-Otaibi, N., Ibrahim, E., and Ibrahim, A. (2021b). New Insights into the Contribution of Gravity Data for Mapping the Lithospheric Architecture. J. King Saud. Univ. - Sci. 33, 1018–3647. doi:10.1016/j.jksus.2021.101400
Saada, A. S., Mickus, K., Eldosouky, A. M., and Ibrahim, A. (2021a). Insights on the Tectonic Styles of the Red Sea Rift Using Gravity and Magnetic Data. Mar. Pet. Geol. 133, 105253. doi:10.1016/j.marpetgeo.2021.105253
Saada, S. A., Eldosouky, A. M., Kamel, M., Khadragy, A. E., Abdelrahman, K., Fnais, M. S., et al. (2022). Understanding the Structural Framework Controlling the Sedimentary Basins from the Integration of Gravity and Magnetic Data: A Case Study from the East of the Qattara Depression Area, Egypt. J. King Saud Univ. - Sci. 34 (2), 101808. doi:10.1016/j.jksus.2021.101808
Save, H., Bettadpur, S., and Tapley, B. D. (2016). High-resolution CSR GRACE RL05 Mascons. J. Geophys. Res. Solid Earth 121, 7547–7569. doi:10.1002/2016JB013007
Sehsah, H., and Eldosouky, A. M. (2022). Neoproterozoic Hybrid Forearc – MOR Ophiolite Belts in the Northern Arabian-Nubian Shield: No Evidence for Back-Arc Tectonic Setting. Int. Geol. Rev. 64, 151–163. doi:10.1080/00206814.2020.1836523
Sharaf, M. A. M. (2011). Geological and Geophysical Exploration of the Groundwater Aquifers of as Suqah Area, Makkah District, Western Arabian Shield, Saudi Arabia. Arab. J. Geosci. 4, 993–1004. doi:10.1007/s12517-010-0187-1
Sultan, S. A., Mekhemer, H. M., Santos, F. A. M., and Abd Alla, M. (2009). Geophysical Measurements for Subsurface Mapping and Groundwater Exploration at the Central Part of the Sinai Peninsula, Egypt. Arabian J. Sci. Eng. 34, 103–119.
Suzuki, K., Toda, S., Kusunoki, K., Fujimitsu, Y., Mogi, T., and Jomori, A. (2000). “Case Studies of Electrical and Electromagnetic Methods Applied to Mapping Active Faults beneath the Thick Quaternary,” in Developments in Geotechnical Engineering. Editors Y. Kanaori, K. Tanaka, and M. Chigira (Amstredam: Elsevier), 84, 29–45.
Syed, T. H., Famiglietti, J. S., Rodell, M., Chen, J., and Wilson, C. R. (2008). Analysis of Terrestrial Water Storage Changes from GRACE and GLDAS. Water Resour. Res. 44, W02433. doi:10.1029/2006WR005779
Taha, A. I., Al Deep, M., and Mohamed, A. (2021). Investigation of Groundwater Occurrence Using Gravity and Electrical Resistivity Methods: a Case Study from Wadi Sar, Hijaz Mountains, Saudi Arabia. Arab. J. Geosci. 14, 334. doi:10.1007/s12517-021-06628-z
Tapley, B. D., Bettadpur, S., and Watkins, M. (2004). The Gravity Recovery and Climate Experiment : Mission Overview and Early Results. Geophys Res. Lett. 31, L09607. doi:10.1029/2004gl019920
Titus, R., Witthüser, K., and Walters, B. (2009). “Groundwater and Mining in the Bushveld Complex,” in Proceedings of the international mine water conference (Pretoria, South Africa. International Mine Water Association), 178–184.
Trigo, R. M., Gouveia, C. M., and Barriopedro, D. (2010). The Intense 2007–2009 Drought in the Fertile Crescent: Impacts and Associated Atmospheric Circulation. Agric. For. Meteorology 150, 1245–1257. doi:10.1016/j.agrformet.2010.05.006
Troisi, S., Fallico, C., Straface, S., and Migliari, E. (2000). Application of Kriging with External Drift to Estimate Hydraulic Conductivity from Electrical-Resistivity Data in Unconsolidated Deposits Near Montalto Uffugo, Italy. Hydrogeology J. 8, 356–367. doi:10.1007/s100400000083
Van Overmeeren, R. A. (1989). Aquifer Boundaries Explored by Geoelectrical Measurements in the Coastal Plain of Yemen: A Case of Equivalence. Geophysics 54, 38–48. doi:10.1190/1.1442575
Voss, K. A., Famiglietti, J. S., Lo, M., De Linage, C., Rodell, M., and Swenson, S. C. (2013). Groundwater Depletion in the Middle East from GRACE with Implications for Transboundary Water Management in the Tigris-Euphrates-Western Iran Region. Water Resour. Res. 49, 904–914. doi:10.1002/wrcr.20078
Wahr, J., Swenson, S., Zlotnicki, V., and Velicogna, I. (2004). Time-variable Gravity from GRACE: First Results. Geophys Res. Lett. 31, L11501. doi:10.1029/2004gl019779
Watkins, M. M., Wiese, D. N., Yuan, D.-N., Boening, C., and Landerer, F. W. (2015). Improved Methods for Observing Earth’s Time Variable Mass Distribution with GRACE Using Spherical Cap Mascons. J. Geophys. Res. Solid Earth 120, 2648–2671. doi:10.1002/2014jb011547
Wiese, D. N., Landerer, F. W., and Watkins, M. M. (2016). Quantifying and Reducing Leakage Errors in the JPL RL05M GRACE Mascon Solution. Water Resour. Res. 52, 7490–7502. doi:10.1002/2016wr019344
Wiese, D. N., Yuan, D.-N., Boening, C., Landerer, F. W., and Watkins, M. M. (2018). JPL GRACE Mascon Ocean, Ice, and Hydrology Equivalent Water Height Release 06 Coastal Resolution Improvement (CRI) Filtered Version 1.0. Ver. 1.0. CA, USA: PO.DAAC. doi:10.5067/TEMSC-3MJC6
Wolf, A. T., and Newton, J. T. (2007). Case Study Transboundary Dispute Resolution: The Tigris-Euphrates Basin, Transboundary Freshwater Dispute Database (TFDD). Corvallis, OR: Oregon State University. Available at http://www.transboundarywaters.orst.edu/.
Wouters, B., Bonin, J. A., Chambers, D. P., Riva, R. E. M., Sasgen, I., and Wahr, J. (2014). GRACE, Time-Varying Gravity, Earth System Dynamics and Climate Change. Rep. Prog. Phys. 77, 116801. doi:10.1088/0034-4885/77/11/116801
Yechieli, Y. (2000). Fresh-Saline Ground Water Interface in the Western Dead Sea Area. Ground Water 38, 615–623. doi:10.1111/j.1745-6584.2000.tb00253.x
Yeh, P. J.-F., Irizarry, M., and Eltahir, E. A. B. (1998). Hydroclimatology of Illinois: A Comparison of Monthly Evaporation Estimates Based on Atmospheric Water Balance and Soil Water Balance. J. Geophys. Res. 103 (D16), 19823–19837. doi:10.1029/98jd01721
Keywords: gravity data, magnetic data, vertical electrical soundings, satellite data, structural trends, groundwater, saudi arabia
Citation: Mohamed A, Al Deep M, Othman A, Taha AI, Alshehri F and Abdelrady A (2022) Integrated Geophysical Assessment of Groundwater Potential in Southwestern Saudi Arabia. Front. Earth Sci. 10:937402. doi: 10.3389/feart.2022.937402
Received: 06 May 2022; Accepted: 27 May 2022;
Published: 12 July 2022.
Edited by:
Ahmed M. Eldosouky, Suez University, EgyptReviewed by:
Ebong D. Ebong, University of Calabar, NigeriaOmid Memarian Sorkhabi, University of Isfahan, Iran
Copyright © 2022 Mohamed, Al Deep, Othman, Taha, Alshehri and Abdelrady. This is an open-access article distributed under the terms of the Creative Commons Attribution License (CC BY). The use, distribution or reproduction in other forums is permitted, provided the original author(s) and the copyright owner(s) are credited and that the original publication in this journal is cited, in accordance with accepted academic practice. No use, distribution or reproduction is permitted which does not comply with these terms.
*Correspondence: Ahmed Mohamed, YWhtZWRtb2hhbWVkQGF1bi5lZHUuZWc=; Ahmed Abdelrady, QS5SLkEuTWFobW91ZEB0dWRlbGZ0Lm5s
 Ahmed Mohamed
 Mohamed Al Deep
 Abdullah Othman
 Ayman I. Taha3
 Fahad Alshehri
 Ahmed Abdelrady