- 1CMA Earth System Modeling and Prediction Centre, China Meteorological Administration, Beijing, China
- 2State Key Laboratory of Severe Weather, Chinese Academy of Meteorological Sciences, Beijing, China
Based on the 20 years of ensemble hindcast data, we evaluated the performance of the new version climate prediction system developed by the China Meteorological Administration (CMA CPSv3) on the Asian summer monsoon (ASM) seasonal prediction in this study. Many major features of the ASM are well predicted by CPSv3, including the intensity and location of the heavy precipitation centers, large-scale monsoon circulations, monsoon onset, and the interannual variation of dynamical monsoon indices. The model captures realistically interannual variability of the summer western North Pacific subtropical high (WNPSH) and is highly skillful for the WNPSH index. Compared with its predecessor, the prediction skill of summer precipitation over Asia in CPSv3 is obviously improved, especially over eastern China. The improvement mainly benefits from skillful predictions of the tropical Pacific Ocean and tropical Indian Ocean sea surface temperatures and ocean–atmosphere coupling associated with them.
Introduction
The Asian summer monsoon (ASM) rainfall anomalies affect agriculture, transportation, electricity, drinking water, and people’s lives and health of the Asian monsoon region where more than half of the global population lives. It also affects the global climate and weather and brings floods, droughts, and other climate extreme events to areas outside the monsoon region by teleconnections. Therefore, it is crucial to give an accurate prediction of the ASM.
The prediction of the monsoon has a long history (Blanford, 1884; Walker, 1923;Walker, 1924). Dynamical predictions of the ASM have shown significant advancements in recent decades. Charney and Shukla (1981) gave a scientific basis for the prediction of monsoon using an atmospheric general circulation model (AGCM) forced by prescribed lower boundary forcing. Bengtsson et al. (1993) proposed a two-tier approach in which sea surface temperature (SST) was first predicted by coupled models, and then, atmospheric anomalies were predicted by an AGCM forced by the predicted SST. However, the simulation of ASM in the Atmospheric Model Intercomparison Project (AMIP) indicated that the atmosphere-alone model exhibits noticeable deficiencies due to the lack of air–sea interaction, which is especially important for the ASM (Kang et al., 2002; Wang et al., 2004; Wang et al., 2005; Wu and Kirtman, 2005; Zhou et al., 2009). In recent years, coupled atmosphere–land–ocean models have been used in dynamical seasonal prediction and have shown overall better performance for the ASM prediction (Palmer, 2004; Saha et al., 2006; Kug et al., 2008; Kumar and Krishnamurti, 2012; Zhu and Shukla, 2013).
Although there have been encouraging advances in monsoon predictions using coupled climate system models, it is still highly limited by many factors such as model resolution, physics and dynamics, ensemble prediction methods, and initial conditions. Most climate models are unable to accurately reproduce the realistic climatology and spatio-temporal variation of monsoon (Wang et al., 2008; Lee et al., 2010; Rajeevan et al., 2012; Jiang et al., 2013; Liu et al., 2014; Krishnamurthy, 2018; Park et al., 2020). Therefore, the improvement of dynamical monsoon prediction still faces a series of scientific and technological difficulties.
In China, the need for accurate predictions of the Asian monsoon is even more urgent, owing to the location. Many Chinese meteorologists have devoted themselves to predicting the Asian monsoon (Yihui et al., 2004; Wang et al., 2015). The China Meteorological Administration (CMA) has developed three generations of coupled climate prediction systems (CPS) to provide the operational prediction of the Asian monsoon climate since 1996. The performances of the first generation of CPS for the ASM prediction can be found in Yihui et al. (2004) and Li et al. (2005). Liu et al. (2015) provided a thorough evaluation of the ASM prediction by the second version of the CPS (CPSv2), which became operational in June 2016. In March 2021, a new version of the CPS, CPS version 3 (CPSv3) was on pilot. Compared with CPSv2, CPSv3 updates lots of physical packages such as cloud–aerosol–radiation, land surface, ocean, and sea ice processes and develops a new atmosphere–ocean–land data assimilation system. However, many features of the prediction of ASM by CPSv3 remain undocumented. In this study, we attempted to provide a comprehensive assessment for the ability of CPSv3 to predict the ASM rainfall and circulation, including the climatology and interannual variability.
Model, Experiments, and Observational Data
CPSv3 is a fully coupled dynamical climate prediction system, which consists of the high-resolution version of the Beijing Climate Center (BCC) climate system model (BCC-CSM2-HR) (Wu et al., 2021). The atmospheric component is the BCC atmospheric general model with a T266 horizontal resolution and 56 hybrid sigma/pressure levels in the vertical and the top level at 0.1 hPa. The land component is version 2.0 of the BCC atmosphere and vegetation interaction model (AVIM2). The ocean and sea ice components are version 5 of the Geophysical Fluid Dynamics Laboratory Modular Ocean Model and the Sea Ice Simulator, respectively.
To verify the system and calibrate the forecast, CPSv3 runs a set of retrospective seasonal forecasts for past dates that can be compared to the historical record. These sets of re-forecasts start on the first of every month for years 2000–2019, have 21 ensemble members, and integrate for 6 months. In CPSv3 hindcasts, the atmosphere is initialized by ERA-Interim analysis (Dee et al., 2011) from the European Centre for Medium-Range Weather Forecasts (ECMWF). CPSv3 ocean, sea–ice, and land initial conditions (ICs) for re-forecasts are provided by the BCC new coupled data assimilation (CDA) system (Liu et al., 2021). Ensemble member 0 is initialized from unperturbed ICs, and other members are perturbed. Perturbations are applied to represent uncertainty from ICs and unresolved sub-grid-scale processes which have to be parameterized in the atmospheric model using lagged average forecasting (LAF) and stochastically perturbed parameterization tendency (SPPT) schemes. The results from CPSv3 in this study are ensemble means of 21 members, and the climatology is the time average of 2000–2019.
The observations used for the verification are monthly winds and geopotential heights from the ECMWF ERA5 reanalysis (Hersbach, et al., 2020), the precipitation from the Global Precipitation Climatology Project monthly analysis (Adler et al., 2018), and the SST from the National Oceanic and Atmospheric Administration (NOAA) OISST v2 analysis (Reynolds et al., 2002).
Results
Since the rainy season starts from April in China, the summer seasonal prediction starting in March is particularly important. In this section, we will present the climatological features and interannual variations of the ASM, the prediction skill of several dynamic monsoon indexes, rainfall, and the SST index based on the 3-month lead prediction by CPSv3.
Climatology
Summer rainfall is the most abundant in the year in the Asian monsoon region. Figure 1 shows the June–August (JJA) climatology of precipitation and winds at 850 hPa in hindcasts and observation, along with their differences. In observation, there are several rainfall centers over western India (WI), the northern Bay of Bengal (BOB), the Indo-China Peninsula, and the west of the Philippines (WP). There is also heavy rainfall over the tropical eastern Indian Ocean (TEIO) and the tropical western North Pacific (TWNP) Ocean. The subtropical rainband such as Mei-Yu over eastern China, the Baiu over Japan, and the Changma over Korea can be seen as well (Figure 1A). The CPSv2 hindcasts capture the general features and locations of precipitation centers observed in the Asian monsoon region (Figure 1B). However, the magnitude of precipitation centers over WI, BOB, WP, and TWNP is relatively overestimated, and precipitation over TEIO, eastern China, Japan, and Korea is underestimated (Figure 1C). Figure 1D shows that CPSv3 well captures the major features of observed rainfall, such as locations and magnitude of heavy rainfall centers. A merit of CPSv3 appears in predicting the Mei-Yu rainband over eastern China and the rainfall over the TEIO (Figure 1E). In general, many models often fail to produce the subtropical rainband over East Asia (Jiang et al., 2013; Fang et al., 2017). Although CPSv3 overestimates rainfall over the eastern Arabian Sea, the southern slope of Tibet Plateau and Burma underestimates rainfall over northern India, northwestern BOB, and South China Sea (SCS), and it captures the phenomenon of rainfall reasonably better than CPSv2.
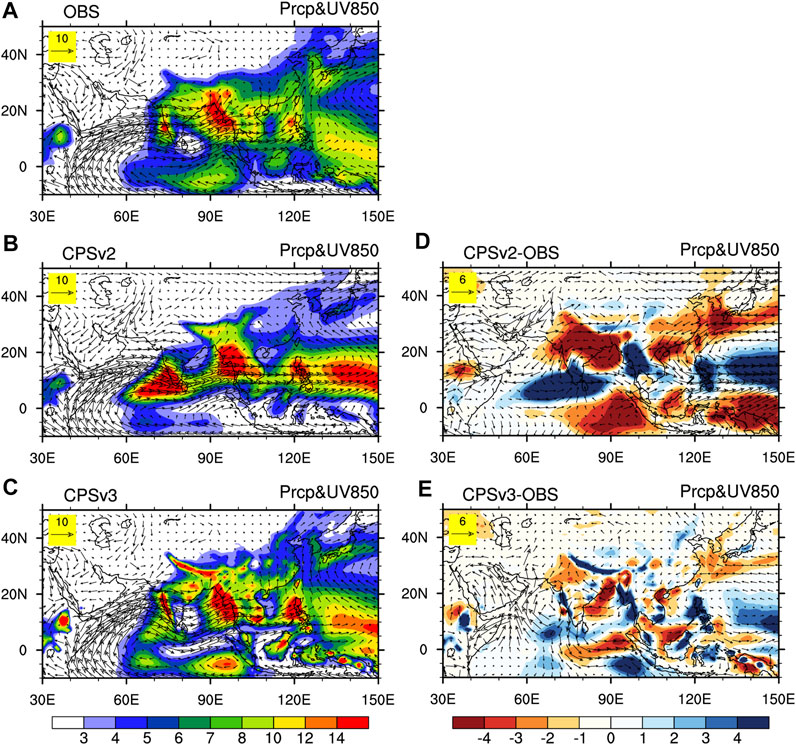
FIGURE 1. Climatology of JJA rainfall (mm day−1, shading) and 850 hPa winds (m s−1, vectors) from (A) observation, (B) CPSv2, and (C) CPSv3 hindcasts. Also, climatological biases of (D) CPSv2 and (E) CPSv3 hindcasts.
In summer, southwesterly wind flows from the Arabian Sea to the western North Pacific prevail in the lower-tropospheric level over the ASM region. The cross-equatorial flow over the western Indian Ocean (IO) and the Maritime Continent, the monsoon troughs over the BOB and the Philippines, and the anticyclonic circulation over the western North Pacific (Figure 1A) are also the main characteristics of the ASM in the lower troposphere. Both CPSv2 and CPSv3 capture general features of the ASM circulation at the lower-tropospheric level (Figures 1B,D). However, CPSv2 predicts a weaker-than-observed anticyclonic circulation over the western North Pacific, which is better predicted in CPSv3 (Figures 1C,E). This brings more realistic Mei-Yu rainband over eastern China.
An important characteristic of the ASM in the upper-troposphere is easterly flows on the south side of the South Asian high (SAH) (Figure 2A). Compared to observation, CPSv2 hindcasts underestimate the intensity of the SAH, along with weaker-than-observed 200 hPa easterlies over tropical Asia (Figures 2B,C). CPSv3 shows an obvious improvement in predicting monsoon flows and intensity of the SAH (Figures 2D,E) in spite of an overestimation.
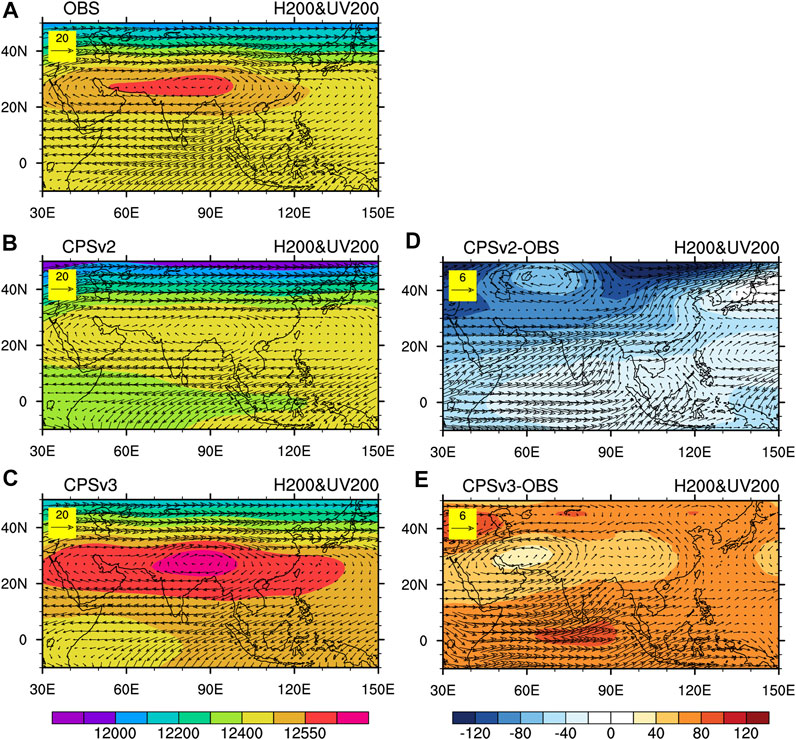
FIGURE 2. Climatology of the JJA geopotential height (gpm, shading) and winds (m s−1, vectors) at 200 hPa from (A) observation, (B) CPSv2, and (C) CPSv3 hindcasts. Also, climatological biases of (D) CPSv2 and (E) CPSv3 hindcasts.
Seasonal Evolution of the Monsoon Rainfall
The Asian monsoon has a notable annual cycle (Wu and Zhang, 1998; Wu and Zhang, 1999). In order to analyze the seasonal evolution of monsoons, we plot the time–latitude cross-sections of rainfall along three sections: 70°–90°E on behalf of the Indian monsoon, 90°–110°E for the BOB monsoon, and 110°–130°E for the East Asian monsoon. Figure 3A shows that the onset of the Indian summer monsoon is characterized by heavy rainfall shifts gradually from the equator in spring to northern India in summer. The monsoon fully breaks in India in June, then advances northward gradually, and reaches northern India in July–August with a maximum of 20°–25°N. CPSv2 successfully captures the Indian summer monsoon onset but overestimates the summer rainfall over India (Figure 3B). In comparison, the annual cycle of the Indian summer monsoon precipitation from the CPSv3 is realistic (Figure 3C), and the pattern correlation coefficient (PCC) of the climatological evolution of the precipitation between CPSv2 and the observations is 0.84, which is higher than 0.71 of the CPSv2.
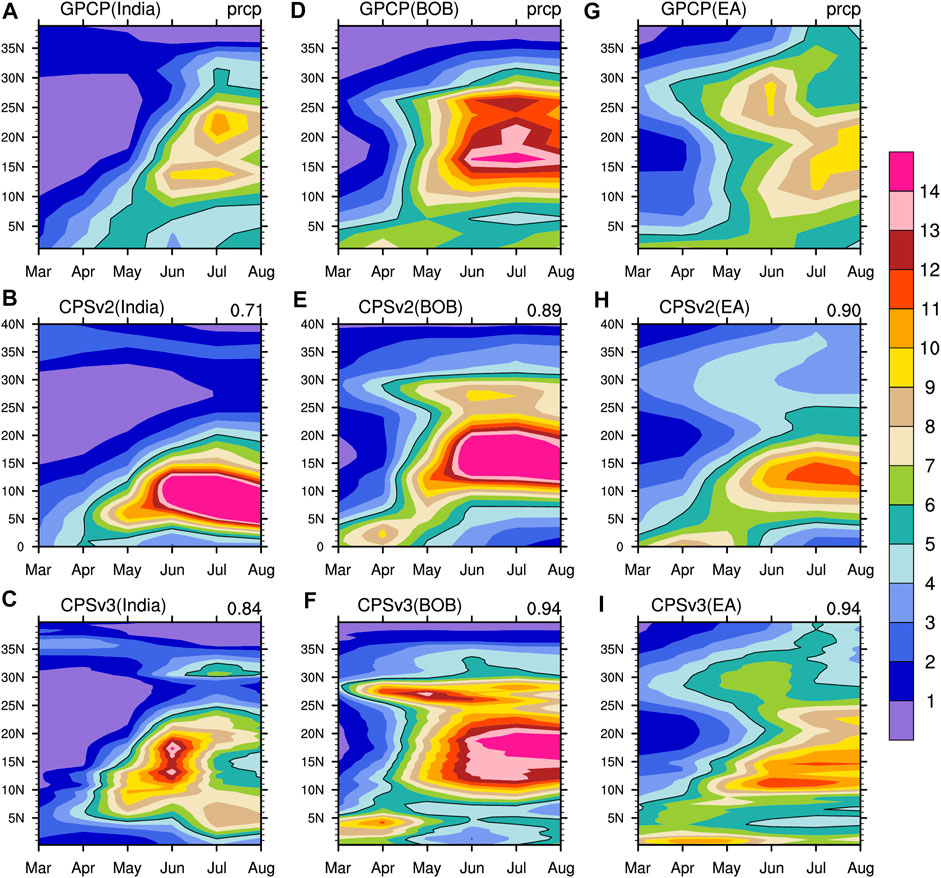
FIGURE 3. Time–latitude sections of climatological precipitation (mm day−1) along (A–C) 70°–90°E, (D–F) 90°–110°E, and (G–I) 110°–130°E from GPCP (the top row), the CPSv2 (the middle row), and the CPSv3 (the bottom row) data (digits in the upper right corner of Figures represent the pattern correlation coefficients between the predicted precipitation and observation).
Over the BOB region (Figure 3D), the summer monsoon onset is characterized by an abrupt northward jump of the heavy rainfall centers from the tropical IO to the north of 10°N in May, which is caused by the inversion of the meridional thermal contrast between land and sea. Both CPSv2 and CPSv3 predict the abrupt onset very well including the timing and the magnitude of rainfall, and PCCs of the climatological evolution of precipitation between the predictions and observations are 0.89 (CPSv2) and 0.94 (CPSv3) (Figures 3E,F).
Over 110°–130°E (Figure 3G), the structure of monsoon precipitation is more complicated than that in other Asian monsoon regions. The heavy rainfall center also indicates an abrupt northward jump from the equator to around 15°N in May, which corresponds to the summer monsoon onset in SCS (Lau and Yang, 1997; Qian and Yang, 2000). After the monsoon onset, the heavy rainfall goes northward steadily and stays near 30°N around June, corresponding to the Mei-Yu period in the middle and lower reaches of the Yangtze River. In mid-July, the maximum precipitation center jumps further northward to 40°N, corresponding to the beginning of the rainy season in North China. There is a premonsoon rainfall over South China in April, mainly caused by frontal systems (Wan and Wu, 2007). CPSv2 fails to capture the abrupt jump of the monsoon onset and underestimates the rainfall over East Asia (Figure 3H). Although the annual cycle of monsoon precipitation along this longitude band is complicated, CPSv3 reasonably predicts the major features, with the maximum precipitation in the north of 25°N being slightly underestimated and the PCC of the climatological evolution of precipitation reaching 0.94 (Figure 3I).
Compared with CPSv2, CPSv3 reasonably captures the onset and seasonal evolution of Indian, BOB, and East Asian monsoons, as well as the premonsoon rainfall and the northern extent of the East Asian monsoon. A revised deep convection scheme employed in CPSv3 contributes most to the improvement. Since northward propagation of MJO over the equatorial eastern Indian Ocean is skillfully depicted when the deep convection scheme is revised in CPSv3 (Wu et al., 2021). However, CPSv3 overestimates the rainfall over the southwest foot of the Tibetan Plateau.
Summer Monsoon Index
We further checked the interannual variability of several popularly used dynamic monsoon indices, including the Webster–Yang monsoon index (WY, Webster and Yang, 1992), the Indian monsoon index (IM, Parthasarathy et al., 1992), the Southeast Asian monsoon index (SEA, Wang and Fan, 1999), and the East Asian monsoon index (EA, Zhang et al., 2003). The WY index is defined as the vertical shear of zonal winds between 850 and 200 hPa levels averaged over (0°–20°N and 40°–110°E), and the IM index is defined as the horizontal shear of 850 hPa zonal winds between the southern region (5°–15°N and 40°–80°E) and the northern region (20°–30°N and 70°–90°E). The SEA and EA are defined as the horizontal shear of zonal winds at 850 hPa between (5°–15°N and 90°–130°E) and (22.5°–32.5°N and 110°–140°E) and between (10°–20°N and 100°–150°E) and (25°–35°N and 100°–150°E), respectively. Figures 4A,C show that CPSv2 and CPSv3 both predict the interannual variation of WY and SEA very well. The temporal correlation coefficients (TCCs) for the WY index reach 0.66 and 0.70, exceeding the 0.01 significance level of the t-test. TCC for the SEA index is 0.52, exceeding the 0.05 significance level of the t-test. Moreover, the two models also predict the weakening trend of the WY since 2000. The interannual variability of the EA index is also skillfully predicted in CPSv3 (R = 0.44, exceeding the 0.05 significance level) (Figure 4D), caused mainly by the improvement of anticyclonic circulation over the western North Pacific. It further indicates that CPSv3 predicts the East Asian summer monsoon flows better than CPSv2. CPSv3 does not perform well in capturing the variability of IM, with a moderate TCC value (R = 0.37) (Figure 4B). When observation is the NCEP–DOE reanalysis 2 (R2) data (Kanamitsu et al., 2002), the TCC of IM is 0.48 in CPSv3 (Figure 4F), which is skillful and exceeds the 0.05 significance level. This indicates that the correlation calculation between the predicted monsoon indexes and the observations depends on the observational data and has certain uncertainties. The results of other monsoon indices (Figures 4E–H) are in good agreement with those obtained from ERA5 data.
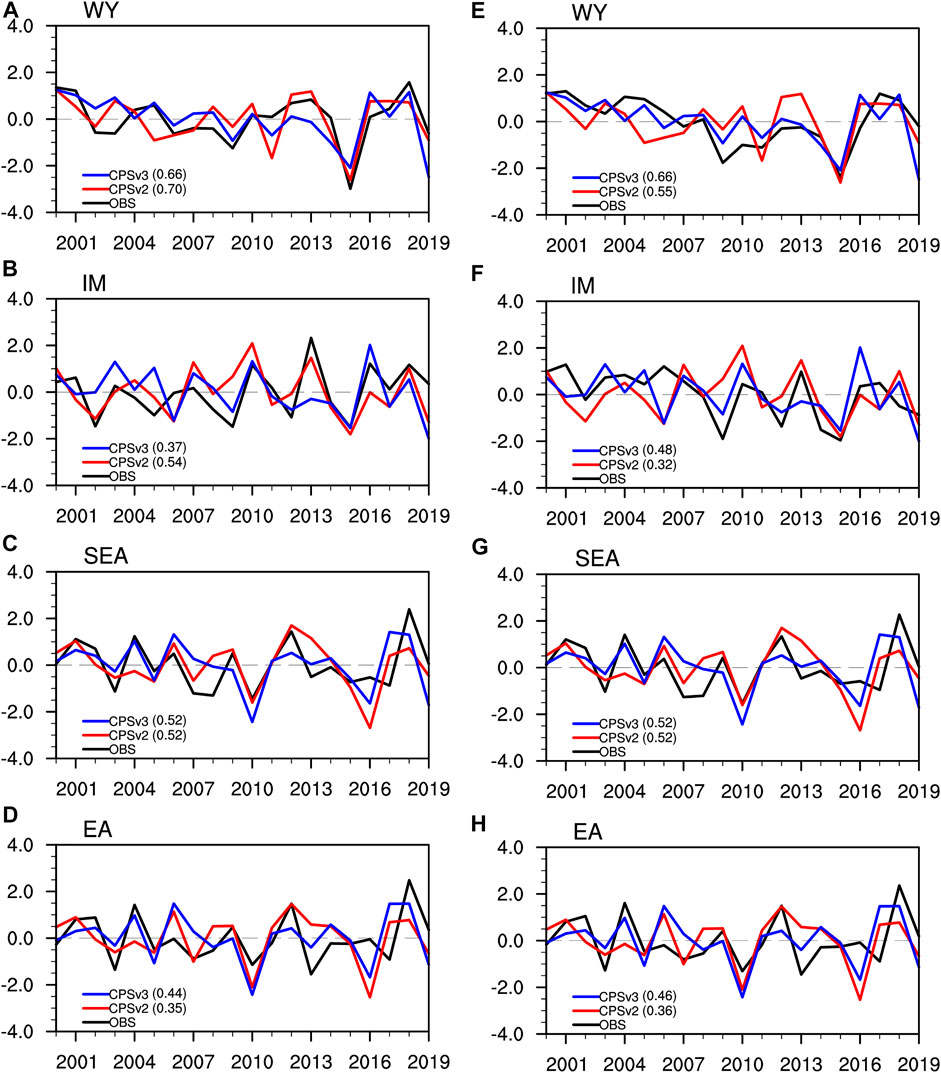
FIGURE 4. Time evolution of dynamical ASM indices: (A,E) WY, (B,F) IM, (C,G) SEA, and (D,H) EA monsoon indices. Left panels: observation is ERA5 data; right panels: observation is NCEP2 data. (The decimals shown in brackets are the temporal correlation coefficients between observation and predictions).
Western North Pacific Subtropical High
The western North Pacific subtropical high (WNPSH) is an essential driver of Asian summer climate. Summer rainfall over much of East Asia is strongly influenced by the WNPSH (Wang and Wu, 1997; Wu et al., 2002). Figures 5A–C compare the interannual variability of JJA 500 hPa geopotential height (GPH500) from the ERA5 reanalysis with hindcasts. The variability is larger in CPSv3 than that in CPSv2 and closer to that found in the observational reanalysis. We calculated the area mean value of JJA GPH500 over the region of maximum variability (120°–140°E and 10°–30°N; Sui et al., 2007; Wu and Zhou, 2008) and used its anomaly from the climatological mean as an index for studying the interannual variability of the WNPSH (Figure 5D). The correlation score for this index in CPSv3 is 0.74, which is highly significant. Moreover, CPSv3 predicts the strengthening tendency of the WNPSH since 2000.
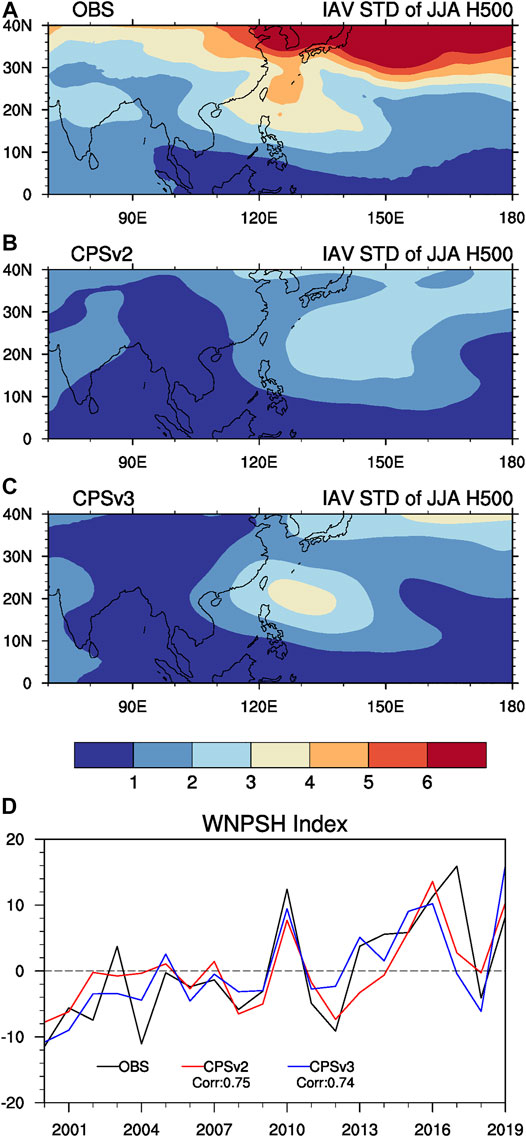
FIGURE 5. Standard deviations of interannual variability of the JJA 500 hPa geopotential height (gpm) from (A) observation, (B) CPSv2 and (C) CPSv3 hindcasts, and (D) interannual variations of the WNPSH index (gpm).
Skill of Precipitation and Sea Surface Temperature
Due to the great impact of droughts and floods on agriculture, it is necessary to obtain predictions and early warnings of summer precipitation anomalies a season in advance. Many meteorological scientists strive to provide predictions, but its accuracy has been one of the challenges of monsoon science.
Figure 6 gives the temporal anomaly correlation (TCC) between the observation and predicted summer precipitation by CPSv2 and CPSv3 3 months in advance. CPSv2 has a significant skill for the summer precipitation only in North China, central India, the western Arabian Sea, and the Maritime continent (Figure 6A). CPSv3 has a higher skill for the summer precipitation in eastern China, northern Indo-China Peninsula, southern and central India, the eastern Arabian Sea, the tropical eastern IO, and parts of the western North Pacific (Figure 6B). Compared with CPSv2, CPSv3 has notable improvements in the prediction skill of the summer precipitation in parts of East Asia (Figure 6C), especially in eastern China. Because of the complexity of the geography of East Asia, it is difficult to predict the summer precipitation over East Asia using the global climate model (Singh, et al., 2015; Wang et al., 2015). Figure 7 presents PCCs of the summer precipitation anomalies between predictions and observation over eastern China (105°–122°E and 20°–45°N) from 2001 to 2019. The skill of CPSv3 is obviously higher than that of CPSv2 in most years (13/20).
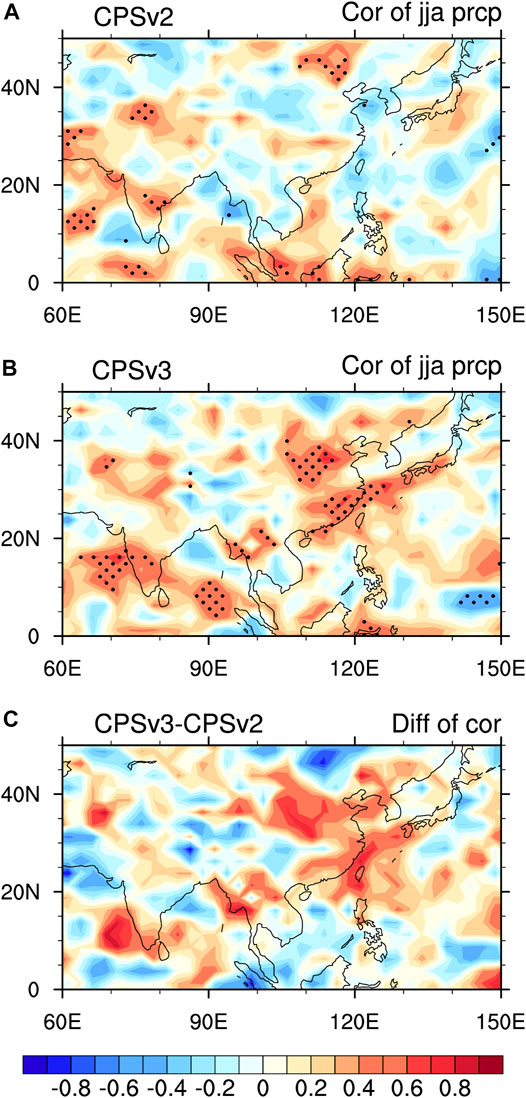
FIGURE 6. Temporal correlation coefficients (TCC) of JJA rainfall between predictions and observations for (A) CPSv2, (B) CPSv3, and (C) difference between (A) and (B). (locations with correlation values at the 5% significance level are highlighted by dots)
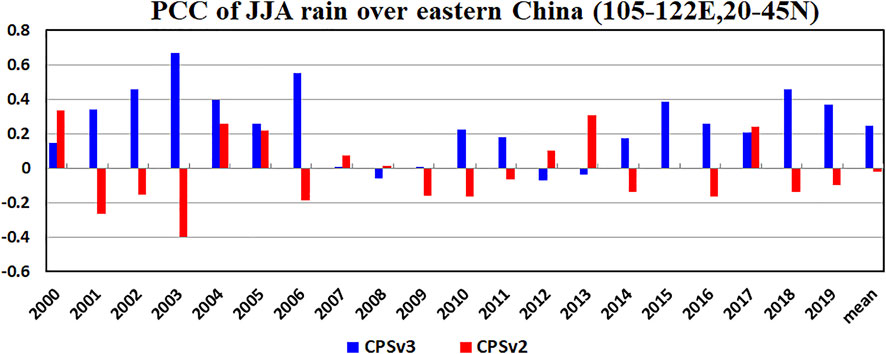
FIGURE 7. Pattern correlation coefficients (PCC) of the JJA rainfall anomaly between predictions and observations over eastern China (105°–122°E and 20°–45°N).
The basic premise of seasonal prediction is the existence of the slowly varying boundary conditions (Charney and Shukla, 1981); thus, it is very crucial to examine the model’s ability to predict the variability of SST. The TCC of the SST between observation and predictions (Figure 8) indicates that both CPSv3 and CPSv2 have high skills for the tropical SST in most of the central and eastern Pacific Ocean and the central and western Atlantic Ocean (Figures 8A,B). In the tropical Indian Ocean, some improvement in JJA SST skill is found, especially in the tropical eastern Indian Ocean (Figure 8C).
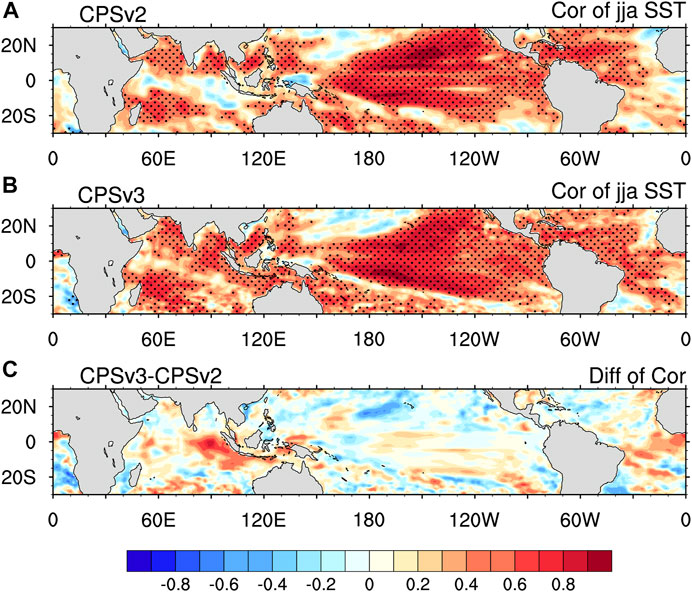
FIGURE 8. TCC of JJA SST between predictions and observations. (A) CPSv2, (B) CPSv3, (C) difference between (A) and (B) (locations with correlation values at the 5% significance level are highlighted by dots).
ENSO, Indian Ocean Dipole, and Their Connections With Monsoon
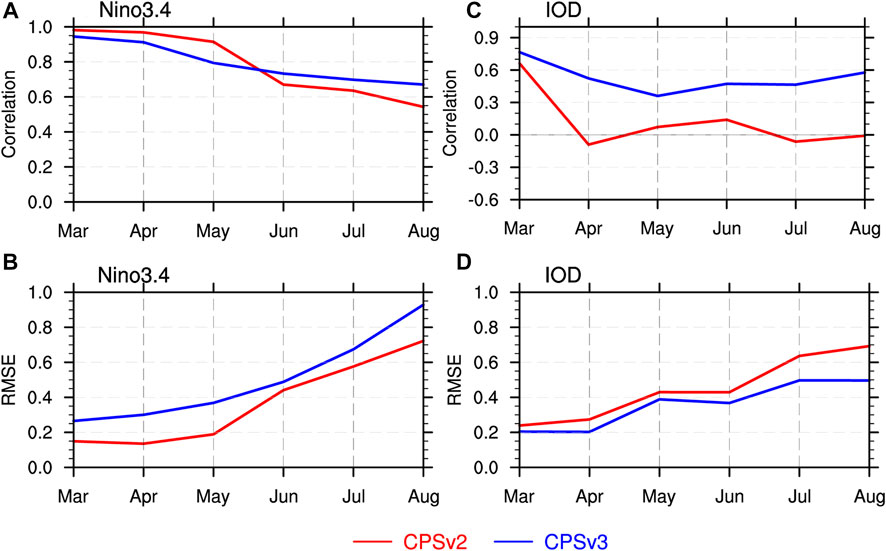
In this study, we also examined the prediction skill of the Nino3.4 index and Indian Ocean dipole (IOD) index, two commonly used SST indices. The Nino3.4 index is defined as the SST averaged over 5°S–5°N and 170°–120°W, and the IOD index is defined as the difference of SST between 10°S–10°N and 50°–70°E and 10°S–0° and 90°–110°E (Saji et al., 1999). Figures 9A,B show the TCC and root mean square error (RMSE) of the Nino3.4 index. The skill is improved in CPSv3 in summer, with an improved anomaly correlation, although the skills of CPSv3 are slightly lower than those of CPSv2 in the first 3 months. Figure 9C shows the skill of IOD in CPSv2 is significant only in the first month and then is almost zero. The TCC values in CPSv3 are significant in the six forecast months except for May, which are also much higher than those of CPSv2. RMSEs of IOD in CPSv3 are also smaller than those of the CPSv2 at all six forecast months (Figure 9D). Combined with Figure 8, it shows that the CPSv3 has a noticeable improvement in the prediction skill for the Indian Ocean SST. There are two reasons for this improvement, that is, the BCC new CDA has a good assimilation in the Indian Ocean to provide a more reasonable ocean initial condition, and the MOM5 has a better ability to simulate SST in the Indian Ocean.
As an important source of seasonal predictability, tropical SST gives substantial contributions to the interannual variability of monsoon. Thus, it is important to examine to what extent the variations of rainfall and air circulation patterns of the ASM related to tropic SST can be skillfully predicted using the model. Figure 10 shows correlations between the Nino3.4 SST and IOD indices and precipitation and regressions of low-level atmospheric circulation with the Nino3.4 SST and IOD indices. The correlations between the Nino3.4 index and rainfall and air circulation are significant over the Maritime continent and the equatorial Pacific in observations (Figure 10A). When the Nino3.4 SST is warmer than normal (e.g., El Nino events), the westerly anomaly is triggered over the tropical central and western Pacific, which weakens the Walker circulation there. Simultaneously, cyclonic circulation anomaly appears over the subtropical northwestern Pacific Ocean, the westerly anomaly appears over India, the Indo-China Peninsula, and South Asia, and the northerly anomaly prevails over southern East Asia. Thus, changes in the lower-level circulation have resulted in more rainfall in the tropical central and eastern Pacific, subtropical eastern Pacific, equatorial western Indian Ocean, northern BOB, and southern China and drought or less precipitation in the Maritime continent, the eastern Indian Ocean, India, the Indo-China Peninsula, and most areas of northern China in summer. CPSv2 captures low-level flow anomalies over South Asia and Southeast Asia but fails to capture precipitation anomalies over these regions and Indian Ocean response to the Nino3.4 region SST anomaly (Figure 10B). CPSv3 basically captures the relationships in observation, with obviously overestimated magnitudes, especially over the subtropical Pacific of the northern and southern hemispheres, implying that a stronger-than-observed feedback of the subtropical circulation to the tropical SST is predicted (Figure 10C).
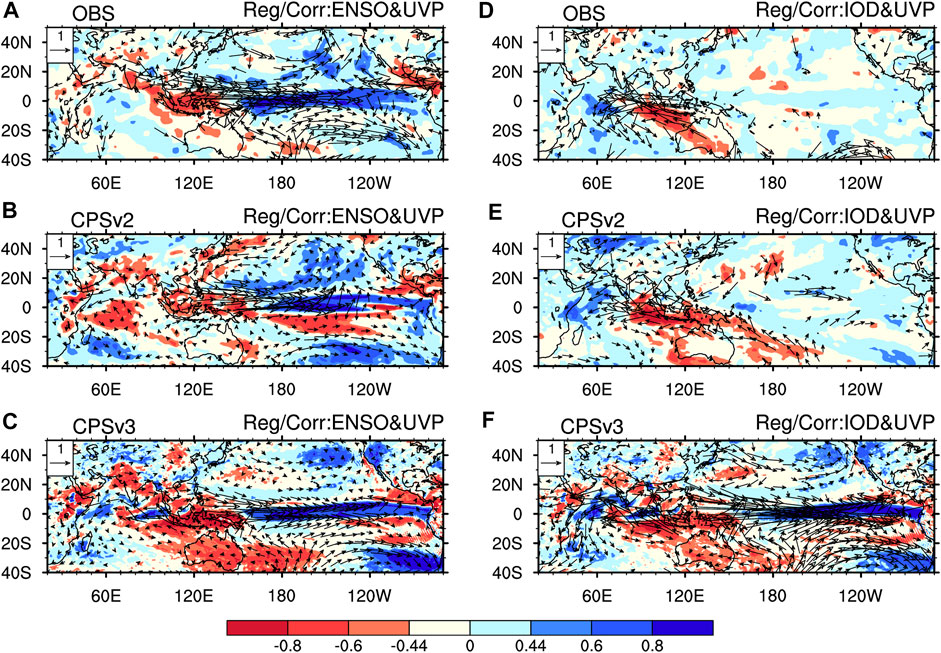
FIGURE 10. Correlation coefficients (shading) between the SST index and rainfall and regression of 850 hPa winds (m s−1, vectors) against the SST index. (A–C) Nino3.4 index and (D–F) IOD index (the shading level above 0.44 represents the statistical significance of correlation above the 5% significance level).
Due to the small magnitude of the SST anomalies in the Indian Ocean, the strong responses of circulation and precipitation to the SST anomalies are limited to the Indian Ocean and the nearby Asian–African continent (Figure 10D) CPSv2 predicts good responses of the Asian monsoon circulation and precipitation to the tropical Indian Ocean SS anomalies (Figure 10E). CPSv3 also predicts the local response of circulation and precipitation over the tropical Indian Ocean but has an exaggerated atmospheric circulation action over the tropical and subtropical Pacific Ocean (Figure 10F). CPSv3 not only predicts the response of the Asian monsoon circulation to the SST anomalies in the tropical Pacific and the tropical Indian Ocean but also has a higher prediction skill for the SST anomalies in the two regions. Maybe, this is one of reasons that CPSv3 has an improvement in the East Asian summer precipitation prediction. There are complex physics involved in the summer precipitation variations over the East Asia, and IOD is just one of the factors.
Summary and Discussion
In this work, we evaluated the performance of CPSv3 in terms of its seasonal forecasting of the ASM. The differences in skills between CPSv3 and CPSv2 are compared to understand the improvement of the ASM prediction.
CPSv3 can well predict many major features of the ASM, including the intensity and locations of the heavy rainfall centers, lower- and higher-level monsoon flows, anticyclonic circulation over the western North Pacific, and monsoon onset. Large-scale South Asian summer monsoon and the Southeast Asian summer monsoon are more realistically predicted than the Indian summer monsoon. The interannual variation of the WNPSH, which greatly impacts the East Asian summer precipitation, is predicted skillfully in CPSv3. The tropical Pacific Ocean SST and tropical Indian Ocean SST indices and their associated anomalies of rainfall and circulation can be predicted 3 months in advance.
Compared with CPSv2, the prediction skill of CPSv3 for the summer precipitation in Asia is significantly improved, especially for the precipitation in eastern China. The benefits may be from the CPSv3 performs well in predicting SST anomalies in the tropical Pacific and Indian Oceans and the relationships of the Asian monsoon circulation and precipitation to the SST anomalies in these regions. There are complex physics involved in the summer precipitation variations over the East Asia. There is a need for further study into this improvement.
The performance of the IOD index prediction in CPSv3 is obviously improved compared with CPSv2 due to the BCC new CDA having a good assimilation in the Indian Ocean to provide a more reasonable ocean initial condition, and the MOM5 has a better ability to simulate SST in the Indian Ocean.
In summary, the improvement of CPSv3’s prediction skills compared with CPSv2 primarily comes from four aspects: first, the revised deep convection scheme brings northward propagation of MJO to be well described, which intensifies East Asian subtropical summer monsoon rainfall; second, the ocean model is upgraded from MOM4 to MOM5, and the ability of MOM5 to depict the tropical ocean is improved; third, the BCC new CDA system provides CPSv3 a more matched and realistic initial condition; last, with the increase in horizontal and vertical resolution, the ability to simulate mesoscale and stratospheric weather processes, which are important in monsoon regions, is improved.
The prediction skill of the Nino3.4 SST index in CPSv3 is 0.94 in the first month, it is slightly lower than 0.98 of CPSv2. It is needed to conduct further analysis in terms of the ocean initial condition of CPSv3 obtained from the BCC new CDA system and the ability of the MOM5 on simulating the tropic Pacific SST. For seasonal prediction models, the ability to accurately predict tropical ocean anomalies is critical.
A basin-wide warming mode of the Indian Ocean is an important source more extending the influence of ENSO on the summer Asian monsoon variations, and it actually tends to be better predicted than IOD (Zhu et al., 2015). The fact whether CPSv3 can skillfully predict it and the atmospheric response associated with it needs to be investigated.
Some major biases exist in CPSv3, such as the exaggerated strong links of the ASM to ENSO and IOD. In fact, the ASM is affected not only by the remote central and eastern Pacific Ocean SST but also by the Indian Ocean SST (Yoo et al., 2006). Thus, further studies focusing on how to produce a realistic relationship between the ASM and Indian Ocean and Pacific SSTs and their impacts on each other in CPSv3 are important for improving the seasonal prediction of ASM.
Data Availability Statement
The original contributions presented in the study are included in the article/Supplementary Material; further inquiries can be directed to the corresponding author.
Author Contributions
XL conceived the idea in discussion with QL and TW and wrote the initial manuscript. QL and XL performed the data analyses and plotted the figures. QL and TW contributed substantially to improving the research and manuscript revision.
Funding
This work was jointly supported by the Guangdong Major Project of Basic and Applied Basic Research (2020B0301030004), the Second Tibetan Plateau Scientific Expedition and Research (STEP) program (Grant No. 2019QZKK0102), and the China Meteorological Administration Special Public Welfare Research Fund (Grant No. GYHY201406001).
Conflict of Interest
The authors declare that the research was conducted in the absence of any commercial or financial relationships that could be construed as a potential conflict of interest.
Publisher’s Note
All claims expressed in this article are solely those of the authors and do not necessarily represent those of their affiliated organizations, or those of the publisher, the editors, and the reviewers. Any product that may be evaluated in this article, or claim that may be made by its manufacturer, is not guaranteed or endorsed by the publisher.
References
Adler, R., Sapiano, M., Huffman, G., Wang, J.-J., Gu, G., Bolvin, D., et al. (2018). The Global Precipitation Climatology Project (Gpcp) Monthly Analysis (New Version 2.3) and a Review of 2017 Global Precipitation. Atmosphere 9 (4), 138. doi:10.3390/atmos9040138
Bengtsson, L., Schlese, U., Roeckner, E., Latif, M., Barnett, T. P., and Graham, N. (1993). A Two-Tiered Approach to Long-Range Climate Forecasting. Science 261, 1026–1029. doi:10.1126/science.261.5124.1026
Blanford, H, F. (1884). On the Connexion of Himalayan Snowfall with Dry Winds and Seasons of Drought in India. Proc. R. Soc. Lond. 37, 3–22. doi:10.1098/rspl.1884.0003
Charney, J. G., and Shukla, J. (1981). “Predictability of Monsoons,” in Predictability of Monsoons. Monsoon Dynamics. Editors J. Lighthill, and R. P. Pearce (Cambridge: Cambridge University Press), 99–110. doi:10.1017/cbo9780511897580.009
Dee, D. P., Uppala, S. M., Simmons, A. J., Berrisford, P., Poli, P., Kobayashi, S., et al. (2011). The ERA-Interim Reanalysis: Configuration and Performance of the Data Assimilation System. Q.J.R. Meteorol. Soc. 137, 553–597. doi:10.1002/qj.828
Fang, Y., Wu, P., Mizielinski, M. S., Roberts, M. J., Li, B., Xin, X., et al. (2017). Monsoon Intra-seasonal Variability in a High-Resolution Version of Met Office Global Coupled Model. Tellus A Dyn. Meteorology Oceanogr. 69 (1), 1354661. doi:10.1080/16000870.2017.1354661
Hersbach, H., Bell, B., Berrisford, P., Hirahara, S., Horányi, A., Muñoz‐Sabater, J., et al. (2020). The ERA5 Global Reanalysis. Q.J.R. Meteorol. Soc. 146, 1999–2049. doi:10.1002/qj.3803
Jiang, X., Yang, S., Li, Y., Kumar, A., Liu, X., Zuo, Z., et al. (2013). Seasonal-to-interannual Prediction of the Asian Summer Monsoon in the NCEP Climate Forecast System Version 2. J. Clim. 26, 3708–3727. doi:10.1175/jcli-d-12-00437.1
Kanamitsu, M., Ebisuzaki, W., Woollen, J., Yang, S.-K., Hnilo, J. J., Fiorino, M., et al. (2002). NCEP-DOE AMIP-II Reanalysis (R-2). Bull. Amer. Meteor. Soc. 83, 1631–1644. doi:10.1175/bams-83-11-1631
Kang, I. S., Jin, K., Wang, B., Lau, K.-M., Shukla, J., Krishnamurthy, V., et al. (2002). Intercomparison of the Climatological Variations of Asian Summer Monsoon Precipitation Simulated by 10 GCMs. Clim. Dyn. 19, 383–395. doi:10.1007/s00382-002-0245-9
Krishnamurthy, V. (2018). Seasonal Prediction of South Asian Monsoon in CFSv2. Clim. Dyn. 51, 1427–1448. doi:10.1007/s00382-017-3963-8
Kug, J.-S., Kang, I.-S., and Choi, D.-H. (2008). Seasonal Climate Predictability with Tier-One and Tier-Two Prediction Systems. Clim. Dyn. 31, 403–416. doi:10.1007/s00382-007-0264-7
Kumar, V., and Krishnamurti, T. N. (2012). Improved Seasonal Precipitation Forecasts for the Asian Monsoon Using 16 Atmosphere-Ocean Coupled Models. Part I: Climatology. J. Clim. 25, 39–64. doi:10.1175/2011jcli4125.1
Lau, K. M., and Yang, S. (1997). Climatology and Interannual Variability of the Southeast Asian Summer Monsoon. Adv. Atmos. Sci. 14, 141–162. doi:10.1007/s00376-997-0016-y
Lee, J.-Y., Wang, B., Kang, I.-S., Shukla, J., Kumar, A., Kug, J.-S., et al. (2010). How Are Seasonal Prediction Skills Related to Models' Performance on Mean State and Annual Cycle? Clim. Dyn. 35, 267–283. doi:10.1007/s00382-010-0857-4
Li, W. J., Zhang, P. Q., and Li, Q. Q. (2005). Research and Operational Application of Dynamical Climate Model Prediction System. J. Appl. Meteor. 16, 1–11. doi:10.1002/0471707724.ch1
Liu, X., Wu, T., Yang, S., Li, Q., Cheng, Y., Liang, X., et al. (2014). Relationships between Interannual and Intraseasonal Variations of the Asian-Western Pacific Summer Monsoon Hindcasted by BCC_CSM1.1(m). Adv. Atmos. Sci. 31, 1051–1064. doi:10.1007/s00376-014-3192-6
Liu, X., Wu, T., Yang, S., Jie, W., Nie, S., Li, Q., et al. (2015). Performance of the Seasonal Forecasting of the Asian Summer Monsoon by BCC_CSM1.1(m). Adv. Atmos. Sci. 32 (8), 1156–1172. doi:10.1007/s00376-015-4194-8
Liu, X., Yao, J., Wu, T., Zhang, S., Xu, F., Zhang, L., et al. (2021). Development of Coupled Data Assimilation with the BCC Climate System Model: Highlighting the Role of Sea‐Ice Assimilation for Global Analysis. J. Adv. Model. Earth Syst. 13, e2020MS002368. doi:10.1029/2020MS002368
Palmer, T. N., Alessandri, A., Andersen, U., Cantelaube, P., Davey, M., Délécluse, P., et al. (2004). Development of a European Multimodel Ensemble System for Seasonal-To-Interannual Prediction (DEMETER). Bull. Amer. Meteor. Soc. 85, 853–872. doi:10.1175/BAMS-85-6-853
Park, J., Kim, H., Simon Wang, S.-Y., Jeong, J.-H., Lim, K.-S., LaPlante, M., et al. (2020). Intensification of the East Asian Summer Monsoon Lifecycle Based on Observation and CMIP6. Environ. Res. Lett. 15, 0940b9. doi:10.1088/1748-9326/ab9b3f
Parthasarathy, B., Kumar, K. R., and Kothawaie, D. R. (1992). Indian Summer Monsoon Rainfall Indices: 1871–1990. Meteor. Mag. 121, 174–186.
Qian, W., and Yang, S. (2000). Onset of the Regional Monsoon over Southeast Asia. Meteorology Atmos. Phys. 75, 29–38. doi:10.1007/s007030070013
Rajeevan, M., Unnikrishnan, C. K., and Preethi, B. (2012). Evaluation of the ENSEMBLES Multi-Model Seasonal Forecasts of Indian Summer Monsoon Variability. Clim. Dyn. 38, 2257–2274. doi:10.1007/s00382-011-1061-x
Reynolds, R. W., Rayner, N. A., Smith, T. M., Stokes, D. C., and Wang, W. (2002). An Improved In Situ and Satellite SST Analysis for Climate. J. Clim. 15, 1609–1625. doi:10.1175/1520-0442(2002)015<1609:aiisas>2.0.co;2
Saha, S., Nadiga, S., Thiaw, C., Wang, J., Wang, W., Zhang, Q., et al. (2006). The NCEP Climate Forecast System. J. Clim. 19 (15), 3483–3517. doi:10.1175/jcli3812.1
Saji, N. H., Goswami, B. N., Vinayachandran, P. N., and Yamagata, T. (1999). A Dipole Mode in the Tropical Indian Ocean. Nature 401, 360–363. doi:10.1038/43854
Singh, U. K., Singh, G. P., and Singh, V. (2015). Simulation Skill of APCC Set of Global Climate Models for Asian Summer Monsoon Rainfall Variability. Theor. Appl. Climatol. 120, 109–122. doi:10.1007/s00704-014-1155-6
Sui, C.-H., Chung, P.-H., and Li, T. (2007). Interannual and Interdecadal Variability of the Summertime Western North Pacific Subtropical High. Geophys. Res. Lett. 34, L11701. doi:10.1029/2006GL0292010.1029/2006gl029204
Walker, G. T. (1923). Correlation in Seasonal Variations of Weather III: A Preliminary Study of Worldwide Weather. Mem. Indian Meteor. Dep. 23, 75–131.
Walker, G. T. (1924). Correlation in Seasonal Variations of Weather IX: a Further Study of World Weather. Mem. Indian Meteor. Dep. 24, 275–332. doi:10.1175/1520-0493(1925)53<252:cisvow>2.0.co;2
Wan, R., and Wu, G. (2007). Mechanism of the Spring Persistent Rains over Southeastern China. Sci. China Ser. D. 50, 130–144. doi:10.1007/s11430-007-2069-2
Wang, B., and Fan, Z. (1999). Choice of South Asian Summer Monsoon Indices. Bull. Amer. Meteor. Soc. 80, 629–638. doi:10.1175/1520-0477(1999)080<0629:cosasm>2.0.co;2
Wang, X. C., and Wu, G. X. (1997). The Analysis of the Relationship between the Spatial Modes of Summer Precipitation Anomalies over China and the General Circulation. Chin. J. Atmos. Sci. 21 (2), 161–169.
Wang, B., Kang, I.-S., and Lee, J.-Y. (2004). Ensemble Simulations of Asian-Australian Monsoon Variability by 11 AGCMs*. J. Clim. 17, 803–818. doi:10.1175/1520-0442(2004)017<0803:esoamv>2.0.co;2
Wang, B., Ding, Q. H., Fu, X. H., Kang, I. S., Jin, K., Shukla, J., et al. (2005). Fundamental Challenge in Simulation and Prediction of Summer Monsoon Rainfall. Geophys. Res. Lett. 32, L15711. doi:10.1029/2005gl022734
Wang, B., Lee, J.-Y., Kang, I.-S., Shukla, J., Kug, J.-S., Kumar, A., et al. (2008). How Accurately Do Coupled Climate Models Predict the Leading Modes of Asian-Australian Monsoon Interannual Variability? Clim. Dyn. 30, 605–619. doi:10.1007/s00382-007-0310-5
Wang, B., Lee, J.-Y., and Xiang, B. (2015). Asian Summer Monsoon Rainfall Predictability: a Predictable Mode Analysis. Clim. Dyn. 44, 61–74. doi:10.1007/s00382-014-2218-1
Webster, P. J., and Yang, S. (1992). Monsoon and ENSO: Selectively Interactive Systems. Q.J R. Mater. Soc. 118, 877–926. doi:10.1002/qj.49711850705
Wu, R., and Kirtman, B. P. (2005). Roles of Indian and Pacific Ocean Air-Sea Coupling in Tropical Atmospheric Variability. Clim. Dyn. 25, 155–170. doi:10.1007/s00382-005-0003-x
Wu, G. X., and Zhang, Y. S. (1998). Thermal and Mechanical Forcing of the Tibetan Plateau and the Asian Monsoon Onset. Part I: Situating of the Onset. Chin. J. Atmos. Sci. 22 (6), 825–838. doi:10.3878/j.issn.1006-9895.1998.06.03
Wu, G. X., and Zhang, Y. S. (1999). Thermal and Mechanical Forcing of the Tibetan Plateau and the Asian Monsoon Onset. Part II: Timing of the Onset. Chinese. J. Atmos. Sci. 23 (1), 51–61.
Wu, B., and Zhou, T. (2008). Oceanic Origin of the Interannual and Interdecadal Variability of the Summertime Western Pacific Subtropical High. Geophys. Res. Lett. 35, L13701. doi:10.1029/2008GL034584
Wu, G. X., Chou, J. F., Liu, Y. M., and He, J. H. (2002). Dynamic Issues on Formation and Variation of Subtropical High. Beijing: Science press.
Wu, T., Yu, R., Lu, Y., Jie, W., Fang, Y., Zhang, J., et al. (2021). BCC-CSM2-HR: a High-Resolution Version of the Beijing Climate Center Climate System Model. Geosci. Model Dev. 14 (5), 2977–3006. doi:10.5194/gmd-14-2977-2021
Yihui, D., Qingquan, L., Weijing, L., Yong, L., Peiqun, Z., Zuqiang, Z., et al. (2004). Advance in Seasonal Dynamical Prediction Operation in China. Acta Meteor. Sin. 62 (5), 598–612. doi:10.1080/07924259.1996.9672530
Yoo, S.-H., Yang, S., and Ho, C.-H. (2006). Variability of the Indian Ocean Sea Surface Temperature and its Impacts on Asian-Australian Monsoon Climate. J. Geophys. Res. 111, D03108. doi:10.1029/2005JD006001
Zhang, Q., Tao, S., and Chen, L. (2003). The Inter-annual Variability of East Asian Summer Monsoon Indices and its Association with the Pattern of General Circulation over East Asia. Acta Meteor Sin. 61 (5), 559–568. doi:10.3321/j.issn:0577-6619.2003.05.005
Zhou, T., Wu, B., and Wang, B. (2009). How Well Do Atmospheric General Circulation Models Capture the Leading Modes of the Interannual Variability of the Asian-Australian Monsoon? J. Clim. 22, 1159–1173. doi:10.1175/2008jcli2245.1
Zhu, J., and Shukla, J. (2013). The Role of Air-Sea Coupling in Seasonal Prediction of Asia-Pacific Summer Monsoon Rainfall. J. Clim. 26, 5689–5697. doi:10.1175/jcli-d-13-00190.1
Keywords: Asian summer monsoon, seasonal prediction, climate model, CPSv3, Asian summer monsoon index, western North Pacific subtropical high
Citation: Liang X, Li Q and Wu T (2022) Dynamical Seasonal Prediction of the Asian Summer Monsoon in the China Meteorological Administration Climate Prediction System Version 3. Front. Earth Sci. 10:934248. doi: 10.3389/feart.2022.934248
Received: 02 May 2022; Accepted: 23 May 2022;
Published: 01 July 2022.
Edited by:
Haishan Chen, Nanjing University of Information Science and Technology, ChinaReviewed by:
Jieshun Zhu, University of Maryland, College Park, United StatesBaoqiang Tian, Institute of Atmospheric Physics (CAS), China
Copyright © 2022 Liang, Li and Wu. This is an open-access article distributed under the terms of the Creative Commons Attribution License (CC BY). The use, distribution or reproduction in other forums is permitted, provided the original author(s) and the copyright owner(s) are credited and that the original publication in this journal is cited, in accordance with accepted academic practice. No use, distribution or reproduction is permitted which does not comply with these terms.
*Correspondence: Qiaoping Li, bGlxcEBjbWEuZ292LmNu
 Xiaoyun Liang
 Qiaoping Li
 Tongwen Wu