- 1College of Geosciences, China University of Petroleum (Beijing), Beijing, China
- 2CNOOC China Limited, Zhanjiang Branch, Zhanjiang, China
- 3State Key Laboratory of Petroleum Resource and Prospecting, China University of Petroleum (Beijing), Beijing, China
- 4School of Earth Resources, China University of Geosciences (Wuhan), Wuhan, China
- 5Key Laboratory of Petroleum Resources Research, Institute of Geology and Geophysics, Chinese Academy of Sciences, Beijing, China
- 6CNOOC China Limited, Hainan Branch, Haikou, China
Research on the characteristics and distribution of natural fractures is of great importance for the exploration and development of low-permeability sandstone gas reservoirs. In this study, fracture identification and characterization were carried out using cores and imaging logging. Then, comprehensive fracture development indicators were constructed to predict the distribution of fractures in wells by conventional logging. The main factors that affect the development of natural fractures and the implications of fractures on hydrocarbon exploration and development were discussed. The results showed that the natural fractures were mainly low-angle tectonic fractures in sandstone reservoirs. Most of fractures are unfilled, but the distribution of the fractures in the thin sections has a discrete fracture structure, indicating that the connectivity of the fracture system is poor. The development of natural fractures is mainly influenced by rock strength, petrographic composition, and petrology, and the fractures are more developed in sandstones with a higher content of brittle minerals. The fracture densities are mainly distributed below 0.05 m/m and up to 0.1 m/m. In the present in situ stress state, all of the natural fractures in the LD-A gas field are invalid fractures. The critical pressure of the natural fracture is approximately 16.5–25.4 MP/km; when the pore pressure exceeds this value, the fractures become effective fractures. These results provide new geological knowledge and guidance for the exploration and development of LD-A gas fields and other low-permeability tight sandstone reservoirs.
1 Introduction
As oil exploration and development continue to expand, the proportion of low-permeability hydrocarbon reservoirs is increasing in the energy supply. Therefore, the effective development of low-permeability hydrocarbon resources is of great importance for improving oil and gas self-sufficiency (Shanley et al., 2004; Das et al., 2020). Due to poor reservoir properties and low productivity, a series of challenges are faced in the exploration and development of low-permeability hydrocarbon reservoirs. These challenges include the accurate identification and prediction of the effective reservoir (Deepa et al., 2019), the evaluation of the non-Darcy fluid flow characteristics in low-permeability reservoirs (Lecampion et al., 2017; Hawez et al., 2021), and the reconstruction of these reservoirs (Bhattacharya et al., 2012; Aljuboori et al., 2021). Generally, natural fractures commonly develop in sandstone reservoirs with low porosity and low permeability (Lavenu et al., 2013; Sufian and Russell, 2013), which connects the matrix pores in low-permeability reservoirs and improve reservoir permeability (Fall et al., 2015; Masoudian et al., 2018). The degree of natural fracture development is a key for establishing the high-stability production of low-permeability reservoirs (Gale et al., 2010; Hawez et al., 2021). Thus, research on fractures in low-permeability reservoirs runs through the whole process of hydrocarbon exploration and development.
Researchers have carried out many studies on the genetic types, formation mechanisms, control factors, and distribution-prediction factors of natural fractures. It is proposed to classify the fractures in tight sandstone in terms of fracture mode, mechanical properties, and geological origin (Nelson, 2001; Laubach et al., 2009). Quantitative characterization methods of multiscale natural fractures based on outcrops, cores, thin sections, SEM, and CT were established (Fall et al., 2015; Zeng et al., 2022). Natural fractures were identified and evaluated using logging and drilling data with production performance data (Ezati et al., 2018; Fernández-Ibáez et al., 2018; Stockmeyer et al., 2018), and methods including the curvature method, geomechanical simulation, and geophysical methods have been proposed (Olson et al., 2009; Yin et al., 2016; Hooker et al., 2018; Gong et al., 2021). Additionally, the fracture effectiveness and influencing factors are investigated to analyze the effects of fractures on fluid flow (Alghalandis et al., 2015). However, the study of fractures in low-permeability reservoirs remains a difficult problem. The characterization of fracture connectivity is incomplete, and the contribution of fractures to the reservoir needs further study, while the effectiveness of natural fractures remains unclear (Lahiri, 2021).
Most of the natural gas reservoirs discovered in the Yinggehai Basin are found in diapir areas or diapir-affected areas, while great discoveries have also been made in the eastern slope area (Yang et al., 2018). The Yinggehai Basin is characterized by high temperature and high pressure (HTHP) (Fan et al., 2021), and once the stress intensity reached a certain level under the conditions of HTHP and deep burial, natural fractures developed in sandstones (Luo et al., 2003). The low-permeability sandstone reservoirs in the Yinggehai Basin are characterized by poor physical properties, and the distribution of natural fractures in low-permeability sandstones controls the accumulation of natural gas, as well as the location of favorable reservoirs (Yang et al., 2018; Li et al., 2020). The LD-A gas field is a key block of offshore exploration and development in the Yinggehai Basin in recent years, and the deep Miocene Huangliu Formation is the key target interval for natural gas exploration. However, due to poor matrix porosity and permeability, natural fractures are very important for reservoir reconstruction (Yang and Huang, 2019). However, there have been few published studies on fractures, and their distribution in the low-permeability sandstones of the LD-A gas field or even the entire Yinggehai Basin. This means that the geologic characteristics, spatial distribution, and effectiveness of fractures in the study area remain unclear, which leads to great difficulty in the exploration and development of low-permeability sandstone gas reservoirs in the LD-A gas field.
In this study, the fracture identification and characterization of single wells was carried out based on cores, thin sections, and imaging logging, assessed with multivariate discriminant methods and identification methods with rock integrity evaluation, allowing the distribution of natural fractures to be predicted from conventional logging. The main controlling factors for natural fractures are analyzed, and the effectiveness of natural fractures in exploration and development is evaluated. The results will provide guidance for the prediction of reservoir fractures and a reference for the future exploration and development of LD-A gas fields.
2 Geological Setting
The Yinggehai Basin is a Cenozoic strike-slip extensional basin, developed along the passive continental margin in the northern South China Sea, adjacent to the Beibu Gulf Basin in the northeast and connected to the Qiongdongnan Basin in the southeast (Zhu et al., 2009). The basin is NWW-SSW trending, and it can be divided into four first-level structural units, including the Yingdong Slope, the Lingao Uplift, the Central Depression, and the Yingxi Slope (Figure 1A). Due to the influence of very thick fine-grained sediments, HTHP in the basin, and the control of the late right-lateral strike-slip stress field, a large-scale nearly north-south trending and en echelon distribution of diapir structures developed in the Central Depression (Figure 1A). The LD-A gas field is located in the southeastern Central Depression of the Yinggehai Basin and is close to the southern Yingdong Slope (Figure 1B).
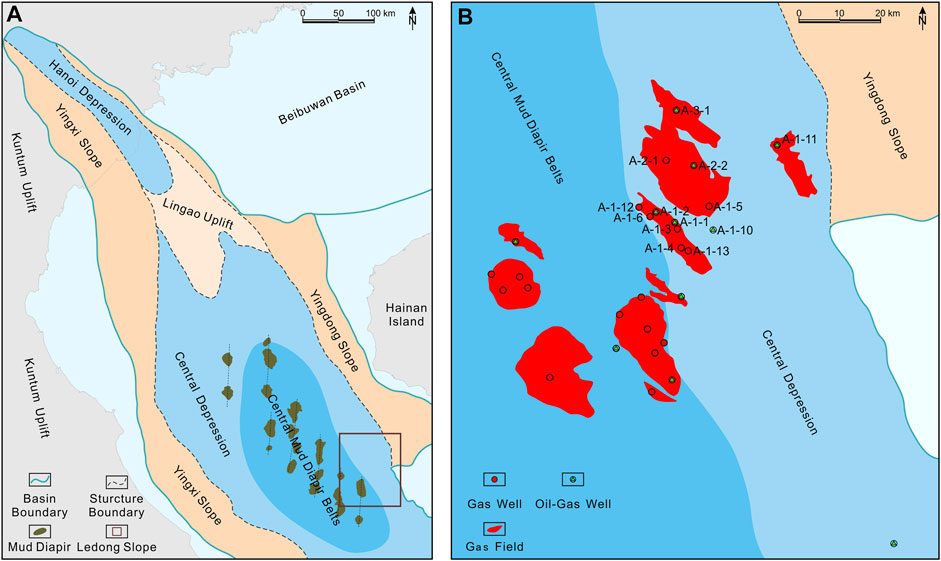
FIGURE 1. Structural division of the Yinggehai Baisn and well location of the LD-A gas field. (A) Simplified structural map of the Yinggehai Basin and the LD-A Gas Field, and (B) the distribution of wells in the LD-A gas field.
The maximum sedimentary thickness of the Cenozoic exceeds 17 km and consists of the Paleogene Oligocene Yacheng Formation (E3y) and the Lingshui Formation (E3l), the Neogene Miocene Sanya Formation (N1s), the Meishan Formation (N1m) and Huangliu Formation (N1h), the Pliocene Yinggehai Formation (N2y) and the Quaternary Ledong Formation (Qld) (Figure 2). The E3y formation is characterized by continental sedimentation, and marine sediments began to develop after E3l formation. Neogene-Quaternary deposits rapidly accumulated ,with a thickness of approximately 8,000–10,000 m (Huang et al., 2019). From the edge to the center of the basin, coastal plains, fan deltas, shore facies, and semi-deep-sea facies develop in turn, and bottom fans and slump deposits also develop in the center of the basin (Xie et al., 2006).
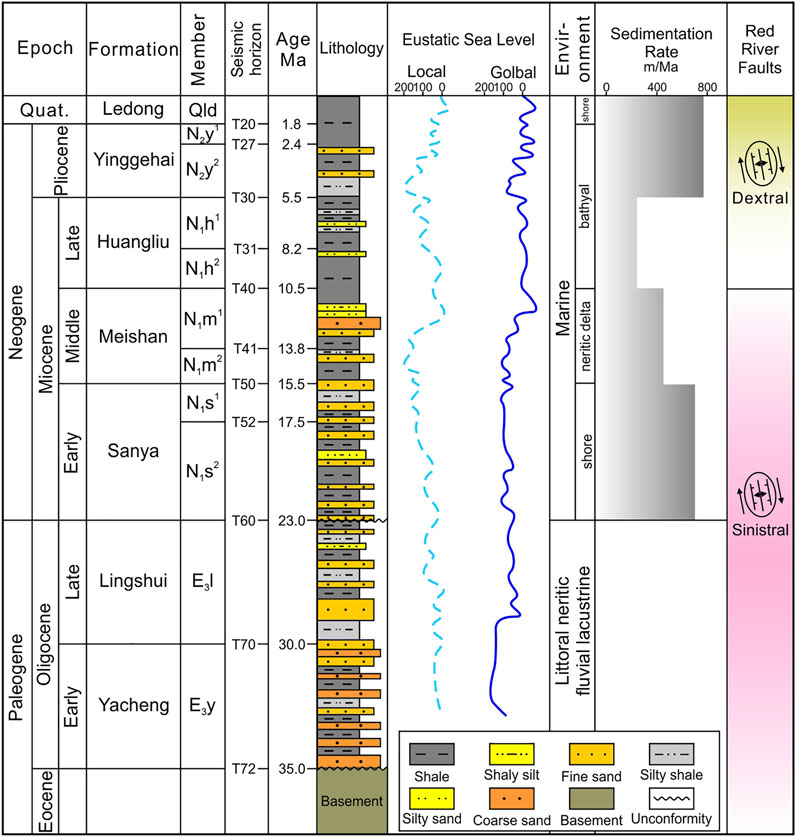
FIGURE 2. Comprehensive stratigraphic profile of the Yinggehai Basin, showing the formation and symbols, seismic horizons, and main lithology (Modified from Fan et al., 2021).
The temperature of the gas-bearing layer is over 180°C, and the maximum pressure coefficient is 2.27 in the LD-A gas field (Li et al., 2022). The reservoir is mainly gravity flow channel-subsea fan sandstone of the Upper Miocene N1h formation. The N1h formation is buried at a depth of 3,800–4300 m, and the lithology is mainly silt-fine sandstone and medium sandstone. The reservoir is characterized by ultralow to low permeability, with a porosity of 8.5–12.3% and a permeability of 0.04–10.00 × 10⁻³ μm2 (Li et al., 2020). A large set of thick mudstones in the second member of the N2y and sandstones in the N1h formation constitute a mud-encapsulated sand assemblage type, forming a lithologic gas reservoir against the background of a large nose structure. The dextral strike-slip tensional faults and fractures provide the migration pathway for natural gas in the area, forming a large HTHP lithological gas reservoir (Yang and Huang, 2019).
3 Data and Methods
3.1 Fracture Description From Cores and Thin Sections
The macroscopic characteristics of natural fractures can be clearly expressed through drilling cores, including the mechanical properties of fractures, group relations, filling, oil and gas possibility, opening degree, and linear density. Thin sections can be used to observe the characteristics of fractures from a microscopic perspective. The description results of fractures can also provide constraints for fracture identification from logging data.
In this study, the core samples were mainly collected from the N1h formation sandstone reservoirs in the LD-A gas field. Observations were based on 80 m of core, 30 thin sections from five cored wells and borehole image logs from six wells. The depth range of the core samples was 3,800–4,200 m, and all the cores were vertical and unoriented. In addition, relevant to lithology and in situ stress from Zhanjiang Branch of the CNOOC database and published literature were used accordingly to complement core and logging data.
3.2 Fracture Identification From Imaging Logging
It is difficult to obtain the orientation of the fractures from core observations, but imaging logging interpretation can provide accurate orientation of natural fractures. Natural fractures show low resistance and low propagation speeds in the imaging logging due to mud intrusion (Folkestad et al., 2012). Effective fractures appear as dark sinusoidal fringes on the imaging logging, obtained by comparing fractures identified from cores. The amplitude of the sine wave curve increases with fracture inclination. The lowest point of the fracture curve indicates the direction of the fracture tendency, and the inclination angle of the fracture can be obtained from the highest and lowest points of the curve and the diameter of the wellbore.
Two kinds of ineffective fractures can be identified in the imaging logging. The first type is the filling fracture, including high-resistance filling fracture and low-resistance filling fracture. A high-resistance filling fracture shows bright sinusoidal fringe, and low-resistance filling fracture is mostly filled with low-resistance mud. These fractures can be eliminated by combining their high-gamma multiperformance with conventional logging curves (Folkestad et al., 2012). The second is the drilling-induced type, which is commonly vertical or feather-like in the symmetry direction of the borehole wall, commonly in the longitudinal and lateral directions. The drilling-induced fracture extends a short distance and is easy to identify (Rajabi et al., 2016).
3.3 Fracture Identification From Conventional Logging
Although imaging logging can provide an accurate identification of the fracture, it cannot reflect the fracture development characteristics of the entire study area, as not all wells have imaging logging. However, conventional logging data are abundant in the study area, and the natural fractures identified by cores and imaging logging can be used to constrain the identification of fractures from conventional logging.
The logging curves that can be used for fracture identification mainly includes natural gamma radiation, deep and shallow resistivity curve, neutron, density, and sonic transit time (DTSM and DTCO). For intervals developed with intensive fractures, the conventional logging response to the fractures is more obvious, which shows a sudden increase in sonic transit time and a certain difference in deep and shallow resistivity. For intervals developed without intensive fractures, the logging response is relatively inconspicuous. Hence, some ambiguity exists in the use of conventional logs to directly identify fractures. Combining fracture-sensitive conventional logs with methods to enhance fracture-response intensity and eliminate nonfracture influence could enable fracture identification (Lyu et al., 2016).
There are some differences in the logging series for each well collected in this study, but all of the sensitive logging data are used to identify fractures as far as possible. It is necessary to establish different fracture identification models according to the differences in the logging series of different wells. In this study, the fracture identification was carried out based on cores and imaging logging, and the multivariate discriminant model and the identification method based on rock integrity evaluation are comprehensively used to predict fracture distribution from conventional logging. It is worth noting that conventional logging cannot identify the number of fractures and can only identify effective fractures. Ineffective fractures are generally filled fractures and have no mud intrusion, which is basically the same as that of the surrounding rock in the nonfracture development section.
3.3.1 Multivariate Discriminant Method
If the logging response of fractured intervals is greatly influenced by other factors (such as wellbore, surrounding rock, drilling fluid, etc.), the logging response of the fracture will be masked, which makes it difficult to identify the fracture. Therefore, since the method of mathematical statistics is to be used for fracture identification, the sampling statistics should be carried out on typical samples, and predictions should also be carried out for typical fracture samples. The fractures observed from the cores and imaging loggings were mapped to the conventional logging through core location. Then, each logging electrical signal was extracted according to the interval where it was located, and each sample was normalized using range normalization on a single well.
Taking the differences in logging data into account, the Bayesian discriminant analysis method can be used to establish a variety of fracture discrimination models in combination with the reconstruction curves to enable all wells to identify fractures from conventional logging as far as possible (Qamar et al., 2022). Combining the data in the study area and using the principle of discriminant analysis, three main discriminant models were established this time (Figure 3): the full-parameter model (including the relative density ratio, relative neutron ratio, relative acoustic wave ratio, and absolute value of deep-shallow resistivity), the pore-electric discriminant model (including the relative density ratio, relative neutron ratio, and absolute value of deep-shallow resistivity), and the acoustic-electrical discriminant model (including the relative acoustic ratio and absolute value of deep-shallow resistivity).
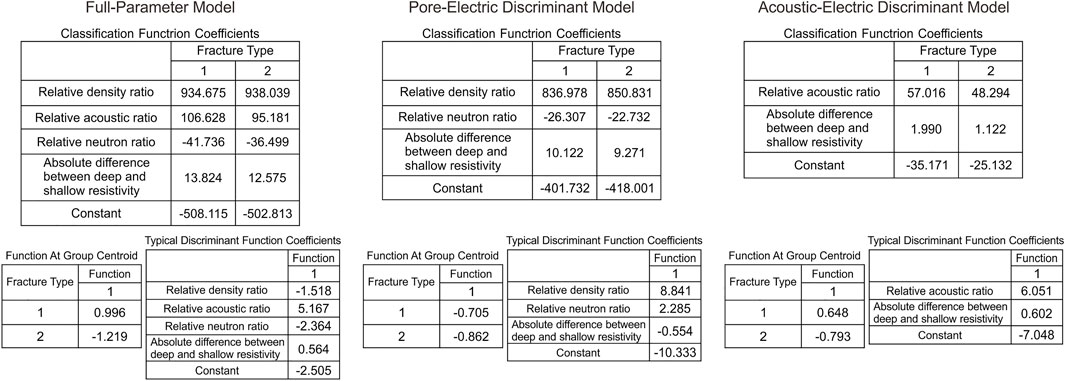
FIGURE 3. The establishment of the fracture multivariate discriminant model and the typical discriminant functions.
The relationship of the discriminant criterion for identifying fractures using each discriminant model was determined based on the different discriminant criterion coefficients of the fractures and the nonfractures (Figure 4).

FIGURE 4. Three fractures discriminant methods with the critical discriminant criterion coefficient of fracture and nonfracture.
The typical discriminant function expression for the full-parameter model is:
where RDE is the relative density ratio; RDT is the relative acoustic wave ratio; RTH is the relative neutron ratio, and ΔRR is the absolute difference between deep and shallow resistivity.
When the GF-P is between 0 and 4, it can be judged as a fracture. The recognition results of the full-parameter model are 88.9% in agreement with the fractures in the core and imaging logging.
The discriminant function expression for the pore-electricity discriminant model is:
When GP-E is between 0 and −4, fracture development is indicated. The recognition result of this model is 80.0% compatible with fractures in the core and imaging logging.
The discriminant function of the acoustic-electrical discriminant model is:
It can be considered a fracture when GP-E is between 0 and −4, and the accuracy rate of this model is 78.1%. When using the discriminant model to identify fractures, the most suitable model should be selected according to the logging data and curve conditions.
3.3.2 Identification Method Based on Rock Integrity Evaluation
Although fracture identification models based on the conventional logging curve have been established, to improve fracture identification accuracy as much as possible, an alternative fracture identification model is established to facilitate the selection of an appropriate method according to actual drilling data.
The change in the mechanical properties of the rock reflects the difficulty degree of fracture development, so it is feasible to carry out fracture identification from the perspective of the rock mechanical properties (Zeng et al., 2022). Based on the sonic transit time logging of the compression and shear waves, the mechanical parameters of the rock can be calculated, and a stability coefficient reflecting the rock fracture characteristics can be constructed. The R/S analysis method was introduced to identify possible fracture development sections (Hu, 2000).
The mechanical elastic parameters of the rock, such as Poisson’s ratio (μ), Young’s modulus (E), shear modulus, and bulk modulus, are calculated by using the compression and shear wave velocity and density logging data, and then the rock mechanical strength parameters are calculated, including compressive strength cohesion and tensile strength (Wayne, 2006). However, the compressional wave transit time (DTCO) is generally measured during logging, but the shear wave transit time (DTSM) is generally not. The DTCO and DTSM in two wells with full-wave train logging data in the LD-A gas field show a good linear relationship (Figure 5).
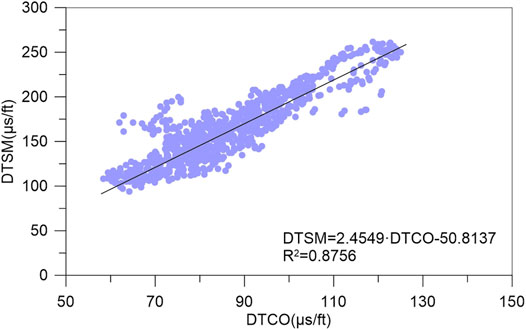
FIGURE 5. The relationship between the compressional wave transit time and shear wave transit time in the LD-A gas field.
The relationship between DTCO and DTSM was established by the full-wave sonic logging data collected in two wells:
Researchers have established an index reflecting rock integrity, which can evaluate the possibility of rock breakage (Wayne, 2006). They define the rock stability factor (RG) as the product of the bulk modulus (G) and shear modulus (K). Using the same lithology and burial depth, the larger the stability coefficient is, the more stable the rock.
R/S analysis is a nonlinear statistical method. In this method, R represents the range, calculated as the difference between the maximum and minimum cumulative deviation. S is the standard deviation, which represents the average trend of the time series (Perez and Chopra, 1997). R/S reflects the degree of change in time series, and the existence of fractures often leads to an increase in the complexity of logging curves. Therefore, R/S analysis can be used to evaluate the degree of fracture development in an interval (Hu, 2000). The variation with depth in the R/S curve of rocks in ideal homogeneous strata is uniform. However, when the reservoir heterogeneity changes abruptly, the R/S curve of the rock with depth shows a sudden change. If the curve included in the analysis has identified fracture information, the sudden change can be considered as the fracture development section (Hu, 2000).
The R/S analysis method is used to establish a fracture identification model based on the rock stability coefficient RG to quantitatively evaluate the possibility of vertical fracture development. The sampling point interval of the concave curve may be the fracture development section of the reservoir. The slope of the critical point is calculated by the slope limit evaluation method, and the fractal dimension (fracture identification curve) reflecting the possibility of fracture development is obtained from D=2-K, which can be used to judge the possibility of fractures. If K becomes negative, D is greater than 2, indicating that fractures may exist; otherwise, if D is less than 2, the possibility of fractures is low.
4 Results
4.1 Fracture Characteristics in Cores and Thin Sections
Core observations show that tectonic fractures mainly developed in low-permeability sandstone reservoirs in the LD-A gas field, and shear fractures are the most common. The fracture surfaces are relatively straight, and the opening degree is small (Figures 6A,B). Tension fractures are less common in cores, the fracture surfaces are curved and uneven and extend in waves on the core, and the change in occurrence is larger than that of shear fractures (Figure 6C). Diagenetic fractures occasionally develop in core samples, which have limited extension and narrow widths (Figure 6D). Fractures are mainly low-angle (15–45°) fractures and rarely high-angle (45–75°) and vertical (>75°) fractures. The degree of fracture filling is relatively low, the fractures are occasionally filled with organic matter or carbonate minerals, and the effectiveness of the fractures is relatively high.
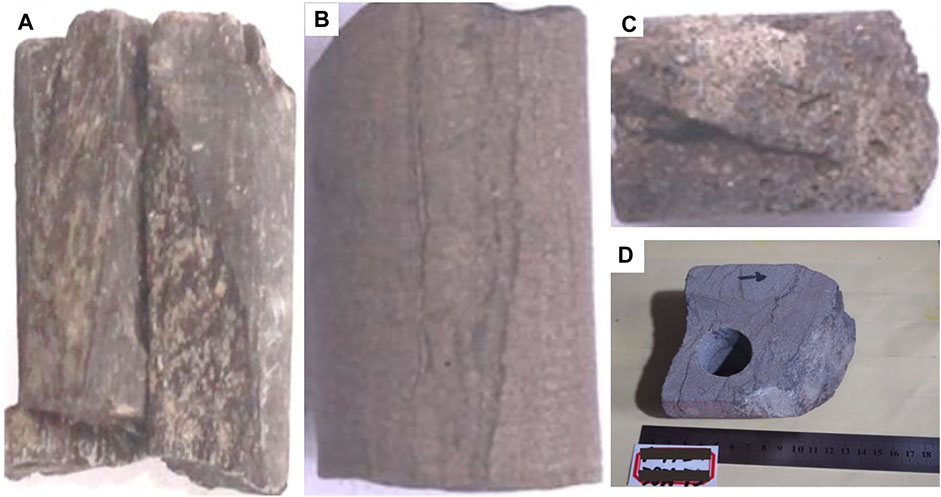
FIGURE 6. Fractures in the cores of low-permeability sandstone reservoirs in the LD-A gas field. (A) natural fracture in well LD-A-1-6, depth 4,093.80 m, (B) low-angle shear fracture in well LD-A-1-5, depth 4,000.40 m, (C) low-angle tension fractures in well LD-A-1-5, depth 4,031.70 m, and (D) diagenetic fractures in well LD-A-2-1, depth 3,882.70 m.
The observation results of the thin sections also show that the natural fractures are dominated by tectonic fractures (Figure 7). Shear fractures are mainly developed with a relatively straight fracture surface. Some fractures are filled with calcite and dislocated by late tectonic fractures (Figures 7B,C). Nontectonic fractures, such as diagenetic shrinkage fractures, are observed in the few samples, which show curved surfaces and small openings (Figure 7D).
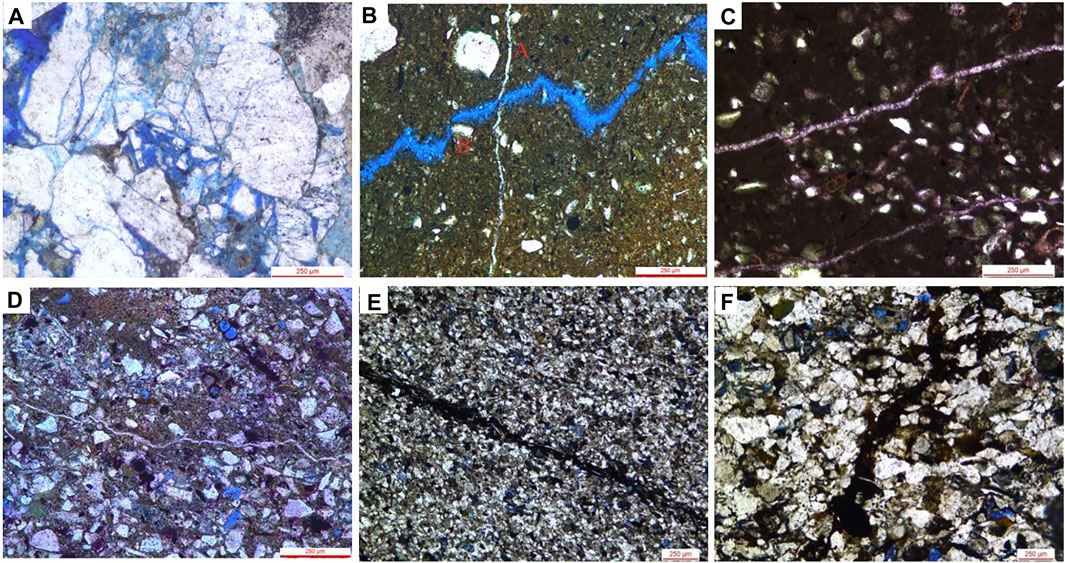
FIGURE 7. Fractures in the thin sections of low-permeability sandstone reservoirs in the LD-A gas field. (A) Unfilled shear fracture in well LD-A-2-1, depth 4,093.70 m, (B) shear fracture in well LD-A-1-1, depth 3,785.56 m, the fracture B is cut up by fracture A, (C) filled shear fracture in well LD10-1-1, depth 4,083.05 m, (D) diagenetic fractures in well LD-A-1-1, depth 2,235.50 m, (E) microfractures in well LD-A-1-1, depth 3,675.25 m, and (F) fracture filled with asphalt in well LD-A-1-1, depth 4,107.05 m.
Microfractures can also be observed in wells LD-A-3-1 and LD-A-2-1, which are partly filled with asphaltene and carbonate minerals, and the fracture surfaces are relatively straight and should be formed by tectonic effects (Figure 7E). The microfractures have poor elongation, and the observed microfracture openings are between 10 and 80 μm. Some fractures are filled with retained asphalt formed during hydrocarbon migration (Figure 7F). These fractures typically extend along weak regions at the edges of mineral grains and do not break individual high-strength grains such as quartz, indicating that they were formed by fluid intrusion rather than the product of tectonic stress.
4.2 Characteristics of Natural Fractures by Imaging Logging
The shape, color, and morphological characteristics of the sinusoid curves on the imaging logging of six wells can be used to accurately identify the main types of natural fractures, and occurrence information, such as fracture trend and dip angle, can be quantitatively established. The types of natural fractures in the actual formation are more complex, and the sinusoidal images can be divided into four types: continuous dark, discontinuous dark, continuous bright, and discontinuous bright. Four fracture types can be identified according to the characteristics of the image, namely, continuous conduction fractures, discontinuous conduction fractures, continuous high-resistivity fractures, and discontinuous high-resistivity fractures.
Due to the high degree of fracture effectiveness, continuous conduction fractures exhibit an abnormally high electrical conductivity due to mud immersion during drilling. Natural fractures developed at depths between 4,219 m and 4,220 m in well HE10-1-13, mainly continuous conduction fractures. The fractures were mainly at low to moderate angles and correspond to open fractures identified on cores and thin sections. There was an obvious dark sine wave curve on the dynamic and static imaging loggings. The images were clear with good continuity and cut the entire wellbore. The color of the intervals with fractures is clearly different in its upper and lower sections (Figure 8A).
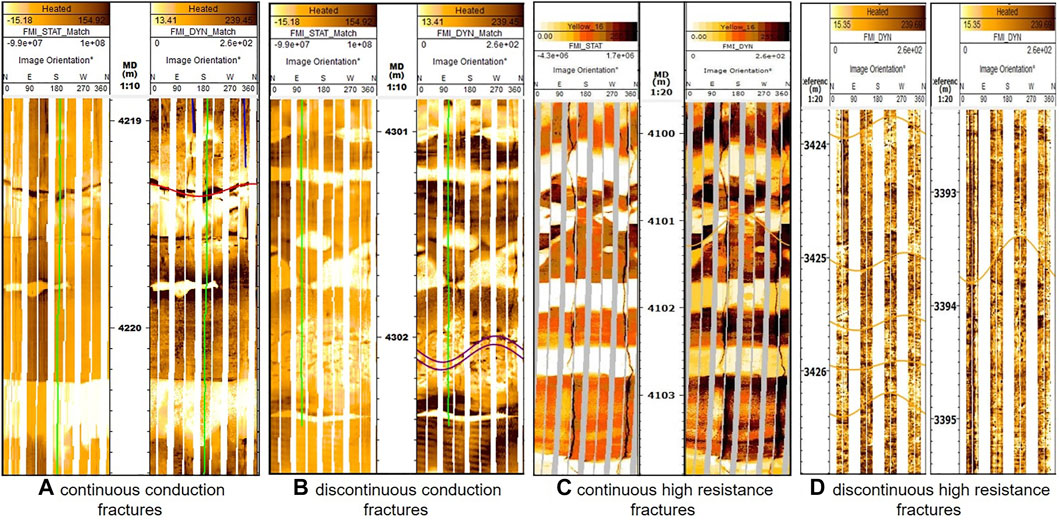
FIGURE 8. Fractures in the borehole image logs from wells in the LD-A gas field. (A) Continuous conduction fractures in well LD-A-1-13, (B) discontinuous conduction fractures in well LD-A-1-13, (C) continuous high-resistance fractures in well LD-A-1-6, and (D) discontinuous high-resistance fractures in well LD-A-2-1.
Discontinuous conduction fractures show abnormally high electrical conductivity, and their basic features are similar to those of continuous conduction fractures. However, the dark image of the sine curve shows irregular, discontinuous, and fuzzy features. Nevertheless, in general, the continuity of the dark images is higher than that of the bright ones. This type of fracture also has a certain effectiveness and can still be classified as open fractures. Well LD-A-1-13 developed three discontinuous conduction fractures at 4,303 m, and the image loggings were discontinuous and mainly dark (Figure 8B).
Continuous high-resistivity fractures can be found in Well LD-A-1-6, show high-resistivity anomalies, mainly oblique and vertical, and generally complete sinusoidal waveform images with continuous light color (Figure 8C). Such fractures are generally filled with high-resistance minerals (such as carbonate minerals) in cores and thin sections, and the degree of effectiveness is low.
Discontinuous high-resistivity fractures in well LD-A-2-1 show abnormal high-resistivity and are sinusoidal curves and horizontal images (Figure 8D). The color of the image was dark and light, and the light-colored image representing high resistance was more continuous than dark-colored images.
Low-angle fractures are mainly developed in the study area, and a few high-angle fractures and vertical fractures are locally developed (Figure 9A), which is consistent with the core observations. The strike direction distribution of fractures was concentrated mainly to the NW or NWW, and a small number of fractures show NE and NW trends (Figure 9B). Induced fractures developed in the LD-A gas field, in a mainly NW-SE direction, indicating that the direction of the maximum horizontal principal stress should be NW-SE (Figure 9C).
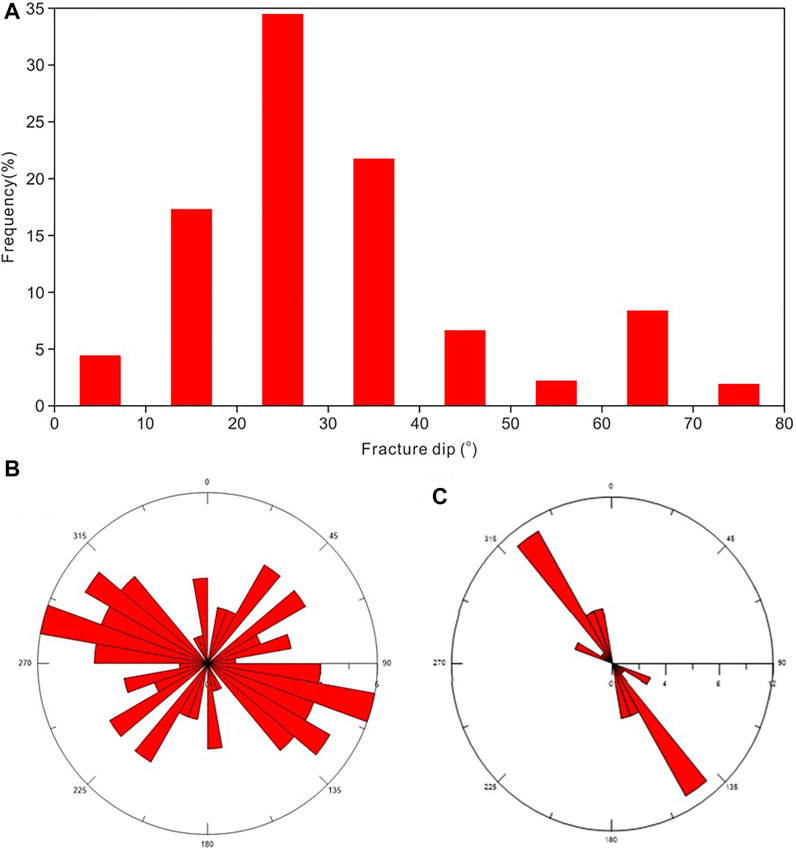
FIGURE 9. The characteristics of natural fractures identified by imaging logging in the LD-A gas field. (A) Frequency distribution histogram of the inclination of fractures, (B) rose diagrams of natural fracture strikes, and (C) rose diagrams of induced fracture strikes.
4.3 Identification Results of Natural Fractures From Conventional Logging
The fractures are mainly effective fractures and with relatively low filling degrees. Therefore, the fractures identified by conventional logging can represent the overall fracture distribution in the study area.
The fractures identified by the discriminant model show that the predicted result matches well with the results identified by core and imaging logging (Figure 10A), indicating that the discriminant model can be extended to other wells for fracture identification. The fracture identification results obtained by the R/S analysis are also very consistent in the imaging logging fracture development section. The mechanical properties of the rock in the fracture development interval changed significantly, and the fracture identification curve exhibits a jagged distribution greater than 2 (Figure 10B).
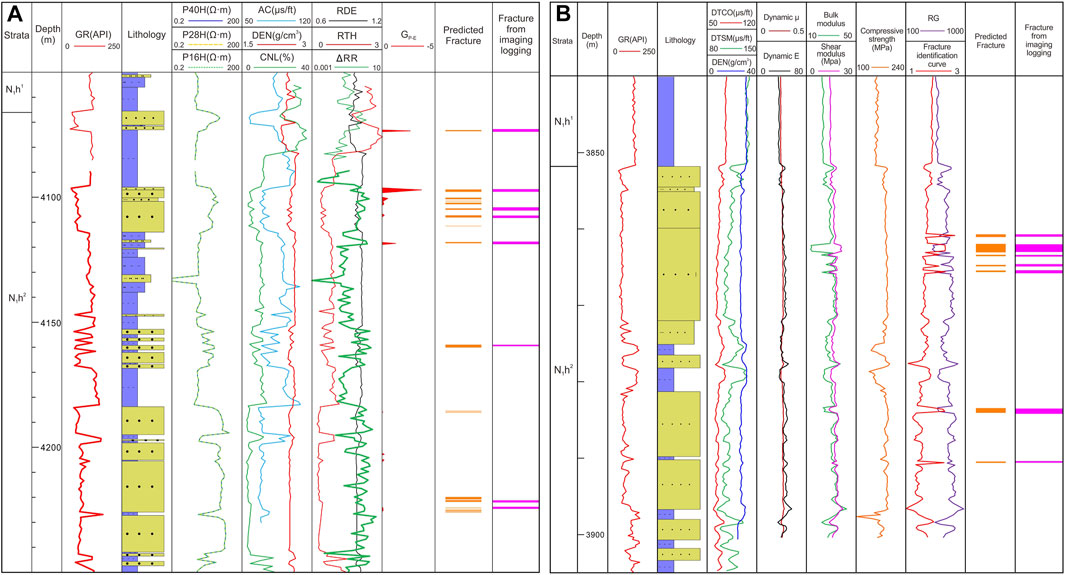
FIGURE 10. Comparison of fracture identification result from conventional logging and the fractures identified from imaging logging. (A) Identified fractures based on the multivariate discriminant method in well LD-A-1-6, and (B) the fracture identification result by the identification method based on rock integrity evaluation in well LD-A-2-1.
Two fracture identification modes were established in this study and were used to identify the fracture in 10 single wells. The thicknesses of the identified formations are more than 2000 m, and the cumulative thickness of the fracture development intervals is 152 m. The average relative density of fractures in the study area is 0.076 m/m, indicating that the overall fracture development rate is relatively low.
For the convenience of analysis and evaluation, the relative fracture density is defined as the ratio of the thickness of the fractured intervals to the thickness of the identified statistical intervals. The statistical results for the fracture identification show that the relative fracture density is mainly distributed between 0.05 m/m and 0.1 m/m. The results also reveal that the natural fractures easily develop in shallow rock due to the low strength, and the relative fracture density of deeper rocks is lower than that of shallow rocks due to the enhancement of rock strength (Figure 11).
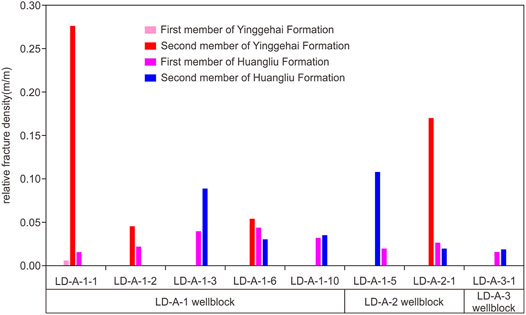
FIGURE 11. Statistical results of relative fracture density for low-permeability sandstone reservoirs from conventional logging in the LD-A gas field.
The fractures in the LD-A-1 wellblock are mainly developed in the middle and deep lower part of the second member of the N2y formation and the N1h formation. The fractures in the N2y formation are mainly developed in mudstone, while the fractures in the N1h formation are mainly developed in sandstone. The average relative fracture densities in the first and second members of the N1h formation are 0.03 m/m and 0.058 m/m, respectively (Figure 12). Fractures mainly developed in the middle and deep layers of the N1h formation and N1m formation in the LD-A-2 wellblock and LD-A-3 wellblock. The fractures mainly occur in relatively thin sand layers, and the average relative development density of fractures is 0.015 m/m (Figure 12).
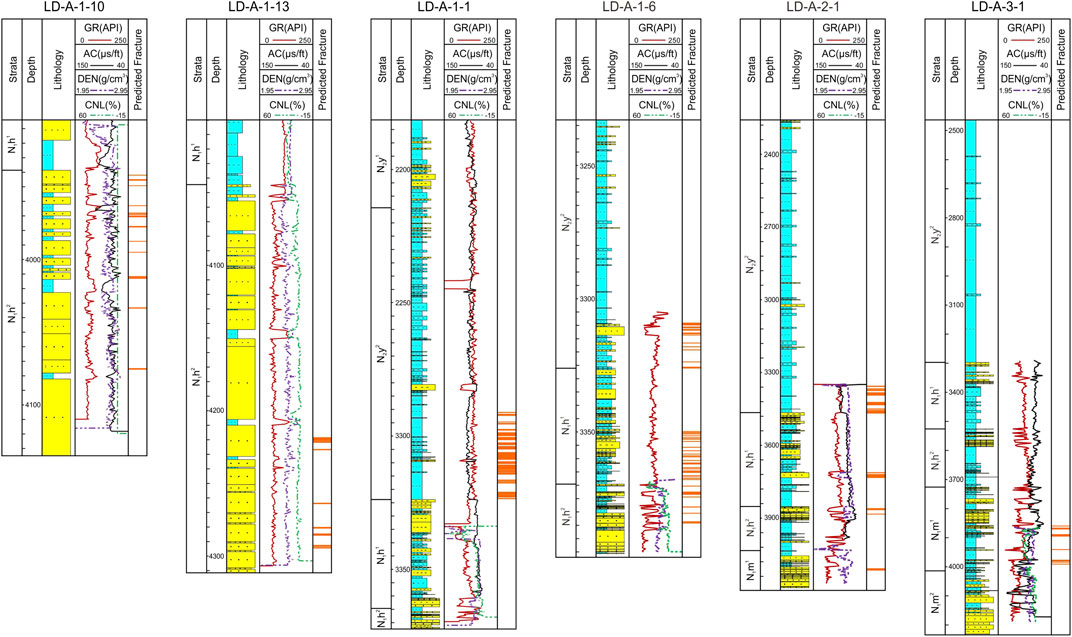
FIGURE 12. Well section profile showing the fracture-developed intervals identified from conventional logging in the LD-A gas field.
5 Discussion
5.1 Main Factors Influencing Fracture Development
5.1.1 Influence of Rock Mechanics Parameters
The dynamic mechanical parameters of the rock are calculated by using the velocity of compressional and shearing waves. Using these with the imaging logging interpretation results, the relationship between rock mechanical parameters (Young’s modulus and Poisson’s ratio) and the line density of tectonic fractures was analyzed.
The development degree of tectonic fractures in the study area shows a trend of first increasing and then decreasing with increasing Young’s modulus (Figure 13A). Young’s modulus is a basic parameter of rock mechanics, and its value directly affects the stress state of the rock. Within a certain range, rocks with high Young’s modulus show high brittleness and are prone to fracture when subjected to the same tectonic stress (Douma et al., 2019). However, the rock expresses high strain energy when the Young’s modulus is too high. When subjected to stress, a large amount of energy is used to break through the confining pressure, resulting in macroscopic fracture of the rock and destruction of the rock matrix. Poisson’s ratio reflects the plasticity of the rock; with increasing Poisson’s ratio, the degree of fracture development first decreases and then increases (Figure 13A).
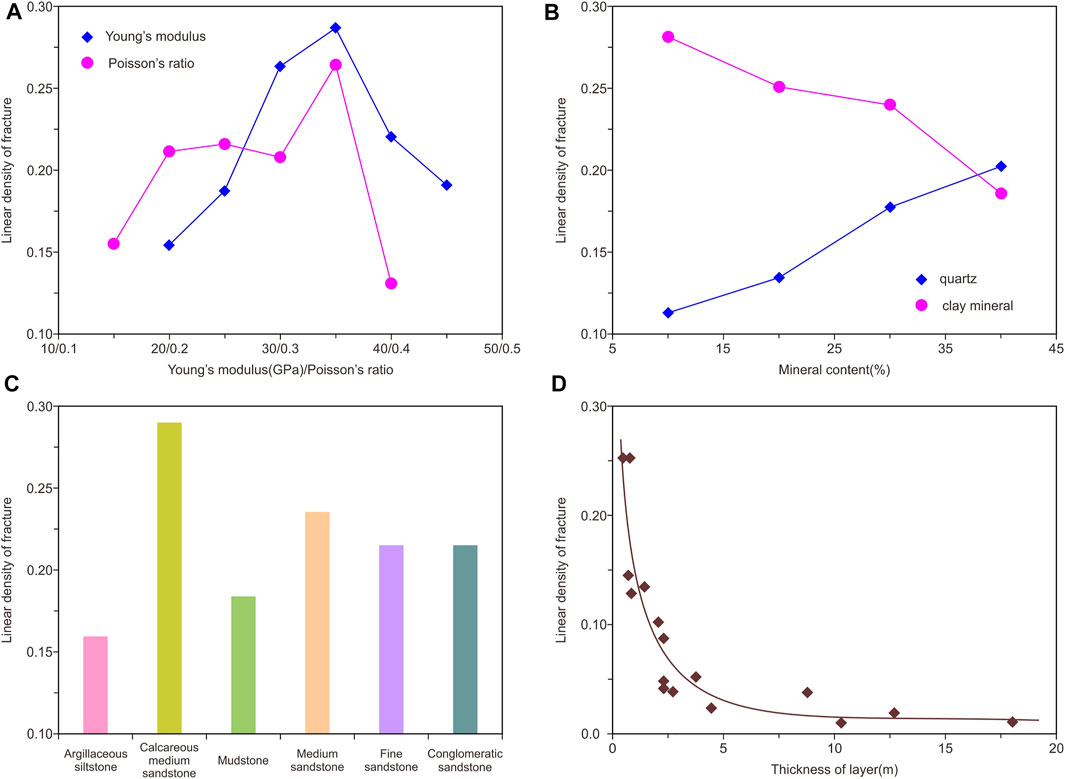
FIGURE 13. Relationship between linear density of fractures and influencing factors in LD-A gas field. (A) The rock mechanics parameters and linear density of fractures, (B) the mineralogy versus linear density of fractures, (C) the lithology and linear density of fractures, and (D) the relationship between linear density of fractures and the thickness.
5.1.2 Influence of Mineralogy and Lithology
In low-permeability sandstone reservoirs, the linear density of tectonic fractures is positively correlated with their quartz content (Figure 13B). Because the brittleness of the rock increases with increasing brittle mineral content while the tensile strength and compressive strength of the rock decrease, fracture formation is easy (Fall et al., 2015). With increasing clay mineral content, the plasticity of rocks increases gradually, which results in a decrease in the degree of fracture development. The linear density of fractures in the LD-A gas field gradually decreases with increasing clay mineral content (Figure 13B).
Lithology controls the development of natural fractures by changing the content of the plastic and brittle minerals and grainsize (Lyu et al., 2016). The fractures in the LD-A gas field are mainly developed in calcareous medium sandstone and medium sandstone (Figure 13C), which contain more brittle minerals. According to the analysis of whole-rock minerals, the carbonate mineral content is 20–28% in the calcareous medium sandstones. However, the plastic mineral content is relatively high in fine sandstone and conglomeratic sandstone, so the fracture development is relatively low. Due to its high mud content, fractures are least developed in argillaceous siltstones and mudstones.
5.1.3 Influence of the Thickness
Through the statistics of the imaging logging interpretation results, the relationship between the thickness of the rock layer and the linear density of natural fractures is obtained, which shows that with increasing thickness of the rock layer, the linear density of fractures gradually decreases (Figure 13D). Overall, where the thickness of the rock layer is greater than 5 m, the linear density of structural fractures is significantly reduced. This is because, for the same lithology, the greater the thickness of the rock layer, the more dispersed the rock fractures are with the same stress. With increased thickness of the single layer in the fracture development section, the spacing of different fractures increases, and density decreases.
5.2 Characterization of Natural Fracture Connectivity
The fracture networks that sometimes appear to be very dense are not necessarily hydraulically connected. Only by solving the fracture connectivity characterization can the effective fracture distribution and its permeability be evaluated, and the distribution of high-quality reservoirs can be further clarified.
Fracture nodes can be classified into different types, which have different effects on fracture connectivity. To quantitatively characterize the connectivity of fractures, according to the spatial arrangement of fractures, fracture nodes are divided into three types: isolated nodes (I-type), adjacent nodes (Y-type), and intersecting nodes (X-type). Therefore, connectivity in one, three, and four directions can be achieved, indicating that the connectivity is also improving (Sanderson and Nixon, 2018).
First, a photo of the fracture distribution under the thin section is obtained, and then the microscopic fracture distribution is delineated to obtain the microscopic fracture distribution pattern (Figures 14A,B). Then, the number of different types of nodes (NI, NY, and NX) and the number of fractures (NL) were counted, and the proportion of different types of nodes was calculated. The statistical data are plotted on a quantitative characterization of the fracture connectivity triangle diagram. Then, the number of nodes occupied by each fracture (CL) is calculated to analyze the probability of fracture connectivity. Studies have confirmed that the fracture network dominated by I-type nodes is disconnected; that is, when the CL<2, it is difficult for the fracture network to reach a connected state (Figure 14C). As the number of Y-type and/or X-type nodes increases, CL will increase, and the connectivity of the fracture network will improve. When CL is greater than 3.57, the fracture network reaches the seepage threshold and enters a connected state. Therefore, the three node-type triangles can be divided into three regions to characterize fracture connectivity, namely, the unconnected region, critical connected region, and connected region (Lahiri, 2021).
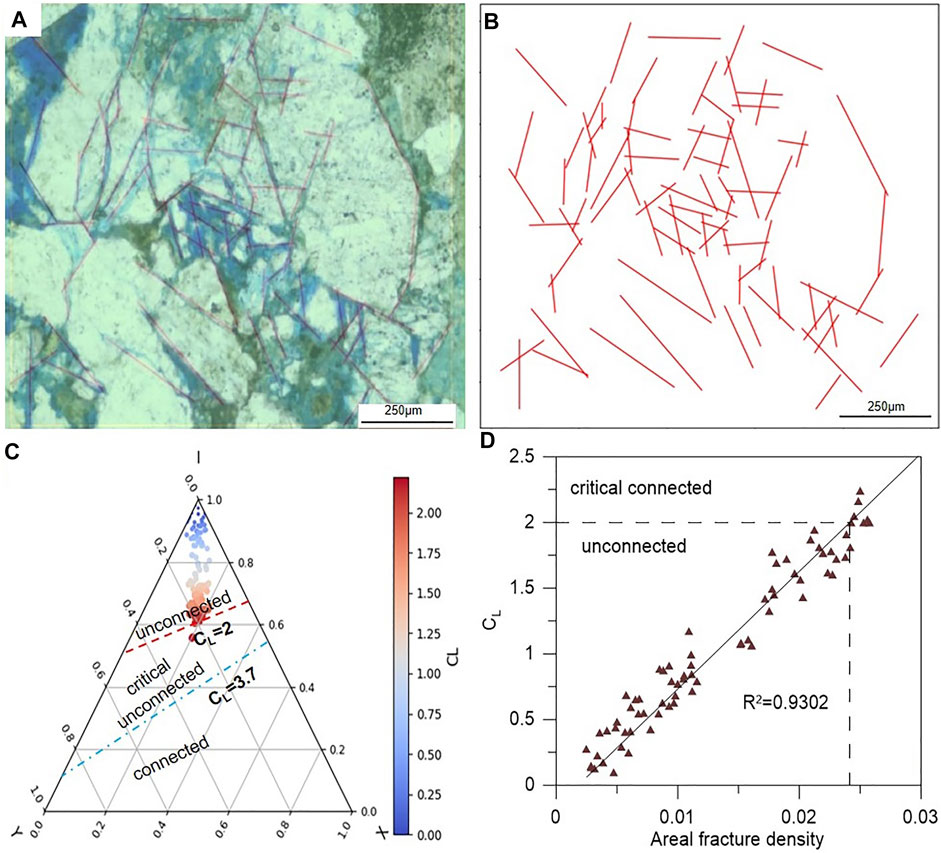
FIGURE 14. Characterization of natural fracture connectivity in low-permeability sandstones in LD-A gas field. (A) Spatial topological relation of fractures in well LD-A-2-1, depth of 4,093.70 m, (B) the fracture connectivity characterization of (A), (C) the type of fracture node and fracture connectivity characterization of samples in LD-A gas field, and (D) the relationship between area fracture density and fracture connectivity.
The statistical results show that the distribution of the natural fractures in thin sections on the triangular diagram is concentrated in the upper part of the triangular diagram, meaning that most points are closer to I-type fractures (Figure 14C). We suggest that the natural fractures in low-permeability sandstones in the LD-A gas field are part of discrete fracture networks, indicating that the lateral connectivity of the fracture system is poor.
Based on the fracture identification results of thin sections, the fracture density of the area was calculated by calculating the total length of fractures per unit area in thin sections. The relationship between area fracture density and fracture connectivity showed a good positive correlation, and fracture connectivity in the study area was generally poor (Figure 14D). As fracture density increases, fracture connectivity gradually improves. When the area fracture density is less than 0.024 m/m2, only a few fractures are connected with each other, and the fractures are in an unconnected as a whole. When the area fracture density is 0.024–0.03 m/m2, the number of connected fractures increases significantly, and the fracture is in a critical state.
5.3 Effectiveness Analysis of Natural Fractures
Natural fractures will change the seepage state of the reservoir due to fluid injection. In the process of oil and gas development, the continuous injection of fluids causes changes in the internal stress state of the reservoir and the state of the natural fractures. With increases in water injection pressure, the fracture gradually changes from an ineffective fracture to an effective one. To quantify the effectiveness of natural fractures under the present state of in situ stress, natural fractures were analyzed based on the Coulomb-Navier failure criterion (Tingay et al., 2003; Ju et al., 2020).
The effectiveness of natural fractures under the in situ stress field and fluid injection conditions is discussed. In the stereographic projection map, small circles represent fractures, and the location of the fractures in the circle is related to the fracture occurrence. The distance of the point from the center of the circle represents the inclination angle, which is 0° at the center of the circle and 90° at the edge. The orientation of the fracture in the projection map represents the normal projection of the fracture surface. The black points in the projection map represent invalid fractures, and the white points represent valid fractures. Different colors indicate the Coulomb stress data. The larger the value is, the more stable the natural fracture system and the more difficult it is to be an effective fracture.
In the current state of in situ stress, the natural fractures in the reservoir are generally inactive and are ineffective fractures (Figure 15A). Then, fluid is injected to change the stress state of the reservoir. With this injection of fluid, the pore pressure increases in the reservoir, which leads to a continuous decrease in effective stress. The decrease in the effective stress reduces the normal stress acting on the fracture surface, and Mohr’s circle shifts to the left. When the pore pressure in the reservoir increases to 19.8 MPa/km, some natural fractures with a small angle to the current horizontal maximum principal stress direction and a large fracture dip angle are first to become effective fractures (Figure 15B). When the pore pressure reaches 65.2 MPa/km due to fluid injection, all fractures in the well become effective fractures (Figure 15C).
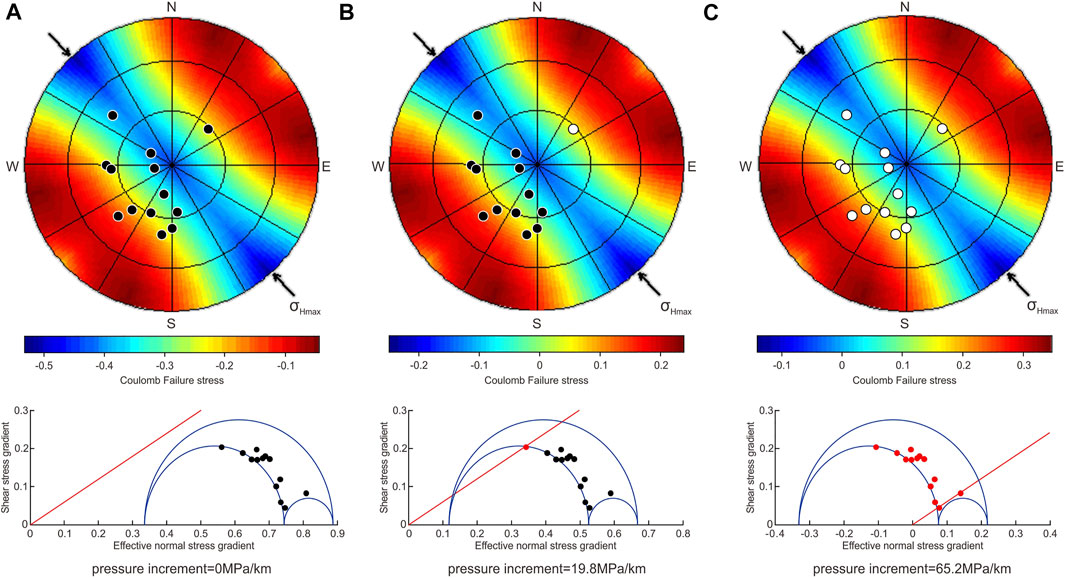
FIGURE 15. Fracture effective analysis in low-permeability sandstones in LD-A gas field. (A) The pressure increment is 0 MPa/km, (B) The pressure increment is 19.8 MPa/km, and (C) The pressure increment is 65.2 MPa/km.
Different fractures show different properties due to the relationship between their occurrence and in situ stress. According to the analysis of the in situ stress from the logging interpretation, the maximum horizontal principal stress gradient (SH) is approximately 23.42 MPa/m, the vertical principal stress gradient (Sv) is approximately 22.15 MPa/m, and the minimum horizontal principal stress gradient (Sh) is approximately 19.12 MPa/m, indicating the strike-slip stress model (Liu et al., 2016). The induced fractures in the LD-A gas field indicate that the direction of the maximum horizontal main in situ stress is NW-SE. The results of fluid injection indicate that when the pore pressure is 19.8 MPa/km, the dip of the effective fracture is approximately 30°, and the dominant normal projection is the NE direction (Figure 15B). Thus, fractures with a larger angle between the normal projection and the horizontal maximum principal stress direction first become effective fractures.
Quantitative analysis of the effectiveness of multiple drilling fractures in the area is performed according to the same method. The effective critical pressure of natural fractures in the N1h formation in the LD-A gas field is 16.5–25.4 MPa/km, and the fractures are considered effective when critical pressure is reached.
6 Conclusion
Natural fractures in low-permeability sandstone reservoirs in the LD-A gas field are mainly tectonic fractures, dominated by low-angle shear fractures. The degree of fracture filling is low, and there are occasional fractures filled with organic matter or carbonate minerals. The fractures are network-shaped in the thin sections, but the distribution of the fractures in the thin slices shows a discrete fracture structure, indicating that the fracture connectivity is poor. The development of natural fractures is mainly influenced by rock strength, petrographic composition, and petrology. Natural fractures are more developed in sandstone with a higher content of brittle minerals.
The natural fractures are divided into four types in imaging logging, namely, continuous conduction fractures, discontinuous conduction fractures, continuous high-resistance fractures, and discontinuous high-resistance fractures. Low-angle fractures are mainly developed in the study area, and a few high-angle fractures and vertical fractures are locally developed. The main direction of natural fractures is NW or NWW, followed by NE and NW trends.
Two fracture identification modes were established in this study to analyze the distribution characteristics of natural fractures in the LD-A gas field. The overall linear fracture density was mainly distributed below 0.05 m/m and up to 0.1 m/m. The average relative fracture densities in the first and second members of the N1h formation are 0.03 m/m and 0.058 m/m, respectively, in the LD-A-1 wellblock. The fractures mainly occur in relatively thin sand layers, and the average relative development density of fractures was 0.015 m/m in the LD-A-2 and LD-A-3 wellblocks.
Under the current state of in situ stress, the natural fractures in low-permeability sandstone reservoirs in the LD-A gas field are invalid fractures. With the progress of fluid injection, when the increase in pore pressure in the reservoir exceeds the effective critical pressure, 16.5–25.4 MPa/km, the fractures were considered effective. The research results provide a valuable reference for fracture effectiveness and natural gas development measures.
Data Availability Statement
The original contributions presented in the study are included in the article/supplementary material, and further inquiries can be directed to the corresponding author.
Author Contributions
HL: Conceptualization, Methodology, Writing—original draft, Visualization. CF: Resources, Investigation, Supervision. ZJ: Writing—review and editing, Investigation, Supervision. JL: Conceptualization, Visualization, Investigation. CL: Methodology, Investigation, Formal analysis, Writing—review and editing. XX: Formal analysis, Resources; FL: Data curation, Visualization. GH: Project administration, Data curation.
Funding
This study is supported by the Evaluation of Exploration Potential in Marginal Sags of Beibuwan Basin-Pearl River Mouth West Basin (ZYKY-2022-ZJ-01).
Conflict of Interest
Authors HL and CF are employed by CNOOC China Limited, Zhanjiang Branch. Authors FL and GH are employed by CNOOC China Limited, Hainan Branch.
The remaining authors declare that the research was conducted in the absence of any commercial or financial relationships that could be construed as a potential conflict of interest.
Publisher’s Note
All claims expressed in this article are solely those of the authors and do not necessarily represent those of their affiliated organizations, or those of the publisher, the editors, or the reviewers. Any product that may be evaluated in this article or claim that may be made by its manufacturer is not guaranteed or endorsed by the publisher.
Acknowledgments
Editor Radwan AE and two reviewers are appreciated for their critical comments and insightful suggestions, which have significantly improved the quality of this work.
References
Alghalandis, Y. F., Dowd, P. A., and Xu, C. (2015). Connectivity Field: A Measure for Characterising Fracture Networks. Math. Geosci. 47, 63–83. doi:10.1007/s11004-014-9520-7
Aljuboori, F. A., Lee, J. H., Elraies, K. A., and Stephen, K. D. (2021). The Impact of Diagenesis Precipitation on Fracture Permeability in Naturally Fractured Carbonate Reservoirs. Carbonates Evaporites 36, 1–12. doi:10.1007/s13146-020-00664-8
Bhattacharya, S., Nikolaou, M., and Economides, M. J. (2012). Unified Fracture Design for Very Low Permeability Reservoirs. J. Nat. Gas Sci. Eng. 9, 184–195. doi:10.1016/j.jngse.2012.06.005
Das, A., Nguyen, N., and Nguyen, Q. P. (2020). Low Tension Gas Flooding for Secondary Oil Recovery in Low-Permeability, High-Salinity Reservoirs. Fuel 264, 116601. doi:10.1016/j.fuel.2019.116601
Deepa, J., Nagaraju, J., Chetia, B., Tandon, R., Chaudhuary, P. K., and Bhardwaj, A. (2019). Integrated Study of a Fractured Granitic Basement Reservoir with Connectivity Analysis and Identification of Sweet Spots: Cauvery Basin, India. Lead. Edge 38, 254–261. doi:10.1190/tle38040254.1
Douma, L. A. N. R., Regelink, J. A., Bertotti, G., Boersma, Q. D., and Barnhoorn, A. (2019). The Mechanical Contrast between Layers Controls Fracture Containment in Layered Rocks. J. Struct. Geol. 127, 103856. doi:10.1016/j.jsg.2019.06.015
Ezati, M., Azizzadeh, M., Riahi, M. A., Fattahpour, V., and Honarmand, J. (2018). Characterization of Micro-fractures in Carbonate Sarvak Reservoir, Using Petrophysical and Geological Data, SW Iran. J. Petroleum Sci. Eng. 170, 675–695. doi:10.1016/j.petrol.2018.06.058
Fall, A., Eichhubl, P., Bodnar, R. J., Laubach, S. E., and Davis, J. S. (2015). Natural Hydraulic Fracturing of Tight-Gas Sandstone Reservoirs, Piceance Basin, Colorado. Geol. Soc. Am. Bull. 127, 61–75. doi:10.1130/B31021.1
Fan, C., Xu, C., Li, C., Liu, A., Li, H., Hou, J., et al. (2021). Identification and Prediction of Allo-Source Overpressure Caused by Vertical Transfer: Example from an HTHP Gas Reservoir in the Ledong Slope in the Yinggehai Basin. Geofluids 2021, 1–20. doi:10.1155/2021/6657539
Fernández-Ibáñez, F., DeGraff, J. M., and Ibrayev, F. (2018). Integrating Borehole Image Logs with Core: A Method to Enhance Subsurface Fracture Characterization. Bulletin 102, 1067–1090. doi:10.1306/0726171609317002
Folkestad, A., Veselovsky, Z., and Roberts, P. (2012). Utilising Borehole Image Logs to Interpret Delta to Estuarine System: a Case Study of the Subsurface Lower Jurassic Cook Formation in the Norwegian Northern North Sea. Mar. Petroleum Geol. 29, 255–275. doi:10.1016/j.marpetgeo.2011.07.008
Gale, J. F. W., Lander, R. H., Reed, R. M., and Laubach, S. E. (20102010). Modeling Fracture Porosity Evolution in Dolostone. J. Struct. Geol. 32 (9), 1201–1211. doi:10.1016/j.jsg.2009.04.018
Gong, L., Gao, S., Liu, B., Yang, J., Fu, X., Xiao, F., et al. (2021). Quantitative Prediction of Natural Fractures in Shale Oil Reservoirs. Geofluids 2021, 1–15. doi:10.1155/2021/5571855
Hawez, H. K., Sanaee, R., and Faisal, N. H. (2021). A Critical Review on Coupled Geomechanics and Fluid Flow in Naturally Fractured Reservoirs. J. Nat. Gas Sci. Eng. 95, 104150. doi:10.1016/j.jngse.2021.104150
Hooker, J. N., Laubach, S. E., and Marrett, R. (2018). Microfracture Spacing Distributions and the Evolution of Fracture Patterns in Sandstones. J. Struct. Geol. 108, 66–79. doi:10.1016/j.jsg.2017.04.001
Hu, Z. Q. (2000). Application of R/S Analysis in the Evaluation of Vertical Reservoir Heterogeneity and Fracture Development. Exp. Pet. Geol. 22, 382–385. doi:10.11781/sysydz200004382
Huang, Y., Yao, G., and Fan, X. (2019). Sedimentary Characteristics of Shallow-Marine Fans of the Huangliu Formation in the Yinggehai Basin, China. Mar. Petroleum Geol. 110, 403–419. doi:10.1016/j.marpetgeo.2019.07.039
Ju, W., Niu, X. B., Feng, S. B., You, Y., Xu, H. R., and Wang, S. Y. (2020). The Present-Day In-Situ Stress State and Fracture Effectiveness Evaluation in Shale Oil Reservoir: A Case Study of the Yanchang Formation Chang 7 Oil-Bearing Layer in the Ordos Basin. J. China Univ. Min. Technol. 49, 931–940. doi:10.13247/j.cnki.jcumt.001138
Lahiri, S. (2021). Estimating Effective Permeability Using Connectivity and Branch Length Distribution of Fracture Network. J. Struct. Geol. 146, 104314. doi:10.1016/j.jsg.2021.104314
Laubach, S. E., Olson, J. E., and Gross, M. R. (2009). Mechanical and Fracture Stratigraphy. Bulletin 93, 1413–1426. doi:10.1306/07270909094
Lavenu, A. P. C., Lamarche, J., Gallois, A., and Gauthier, B. D. M. (2013). Tectonic versus Diagenetic Origin of Fractures in a Naturally Fractured Carbonate Reservoir Analog (Nerthe Anticline, Southeastern France). Bulletin 97, 2207–2232. doi:10.1306/04041312225
Lecampion, B., Desroches, J., Jeffrey, R. G., and Bunger, A. P. (2017). Experiments versus Theory for the Initiation and Propagation of Radial Hydraulic Fractures in Low-Permeability Materials. J. Geophys. Res. Solid Earth 122, 1239–1263. doi:10.1002/2016JB013183
Li, C., Luo, X., Zhang, L., Fan, C., Xu, C., Liu, A., et al. (2022). New Understanding of Overpressure Responses and Pore Pressure Prediction: Insights from the Effect of Clay Mineral Transformations on Mudstone Compaction. Eng. Geol. 297, 106493. doi:10.1016/j.enggeo.2021.106493
Li, X. S., Yang, J. H., Fan, C. W., Deng, Y., and Li, H. (2020). New Progress and Key Technologies for High Temperature and Overpressure Natural Gas Exploration in the Northern Part of South China Sea: Taking the Ledong Slope Belt of Yinggehai Basin as an Example. China Offshore Oil Gas 32, 23–31. doi:10.11935/j.issn.16731506.2020.01.003
Liu, R., Liu, J., Zhu, W., Hao, F., Xie, Y., Wang, Z., et al. (2016). In Situ stress Analysis in the Yinggehai Basin, Northwestern South China Sea: Implication for the Pore Pressure-Stress Coupling Process. Mar. Petroleum Geol. 77, 341–352. doi:10.1016/j.marpetgeo.2016.06.008
Luo, X., Dong, W., Yang, J., and Yang, W. (2003). Overpressuring Mechanisms in the Yinggehai Basin, South China Sea. Bulletin 87, 629–642. doi:10.1306/10170201045
Lyu, W., Zeng, L., Liu, Z., Liu, G., and Zu, K. (2016). Fracture Responses of Conventional Logs in Tight-Oil Sandstones: A Case Study of the Upper Triassic Yanchang Formation in Southwest Ordos Basin, China. Bulletin 100, 1399–1417. doi:10.1306/04041615129
Masoudian, M. S., Hashemi, M. A., Tasalloti, A., and Marshall, A. M. (2018). Elastic-brittle-plastic Behaviour of Shale Reservoirs and its Implications on Fracture Permeability Variation: an Analytical Approach. Rock Mech. Rock Eng. 51, 1565–1582. doi:10.1007/s00603-017-1392-y
Nelson, R. A. (2001). Geologic Analysis of Naturally Fractured Reservoirs. 2nd ed. Houston: Gulf Professional Publishing.
Olson, J. E., Laubach, S. E., and Lander, R. H. (2009). Natural Fracture Characterization in Tight Gas Sandstones: Integrating Mechanics and Diagenesis. Bulletin 93, 1535–1549. doi:10.1306/08110909100
Pérez, G., and Chopra, A. K. (1997). Evaluation of Fractal Models to Describe Reservoir Heterogeneity and Performance. SPE Form. Eval. 12, 65–72. doi:10.2118/22694-PA
Rajabi, M., Tingay, M., and Heidbach, O. (2016). The Present-Day State of Tectonic Stress in the Darling Basin, Australia: Implications for Exploration and Production. Mar. Petroleum Geol. 77, 776–790. doi:10.1016/j.marpetgeo.2016.07.021
Sanderson, D. J., and Nixon, C. W. (2018). Topology, Connectivity and Percolation in Fracture Networks. J. Struct. Geol. 115, 167–177. doi:10.1016/j.jsg.2018.07.011
Shanley, K. W., Cluff, R. M., and Robinson, J. W. (2004). Factors Controlling Prolific Gas Production from Low-Permeability Sandstone Reservoirs: Implications for Resource Assessment, Prospect Development, and Risk Analysis. Bulletin 88, 1083–1121. doi:10.1306/03250403051
Stockmeyer, J. M., Shaw, J. H., Billingsley, L. T., Plesch, A., Wales, M., Lavin, L. C., et al. (2018). Geomechanical Restoration as a Tool for Fractured Reservoir Characterization: Application to the Permian Basin, West Texas. Bulletin 102, 103–128. doi:10.1306/03231716076
Sufian, A., and Russell, A. R. (2013). Microstructural Pore Changes and Energy Dissipation in Gosford Sandstone during Pre-failure Loading Using X-Ray CT. Int. J. Rock Mech. Min. Sci. 57, 119–131. doi:10.1016/j.ijrmms.2012.07.021
Tingay, M. R. P., Hillis, R. R., Morley, C. K., Swarbrick, R. E., and Okpere, E. C. (2003). Pore Pressure/stress Coupling in Brunei Darussalam - Implications for Shale Injection. Geol. Soc. Lond. Spec. Publ. 216, 369–379. doi:10.1144/GSL.SP.2003.216.01.24
Wayne, N. (2006). Naturally Fractured Reservoir Characterization. Houston: Society of Petroleum Engineers.
Xie, X., Müller, R. D., Li, S., Gong, Z., and Steinberger, B. (2006). Origin of Anomalous Subsidence along the Northern South China Sea Margin and its Relationship to Dynamic Topography. Mar. Petroleum Geol. 23, 745–765. doi:10.1016/j.marpetgeo.2006.03.004
Yang, J. H., Huang, B. J., and Chen, D. Y. (2018). Accumulation Condition and Exploration Potential of Low Porosity and Ultra-low Permeability Sandstone Gas Reservoirs on the Depression Slope Belt of Yinggehai Basin. China Offshore Oil Gas 30, 11–21. doi:10.11935/j.issn.1673-1506.2018.01.002
Yang, J., and Huang, B. (2019). Origin and Migration Model of Natural Gas in L Gas Field, Eastern Slope of Yinggehai Sag, China. Petroleum Explor. Dev. 46, 471–481. doi:10.11698/PED.2019.03.0410.1016/s1876-3804(19)60028-5
Yasin, Q., Ding, Y., Baklouti, S., Boateng, C. D., Du, Q., and Golsanami, N. (2022). An Integrated Fracture Parameter Prediction and Characterization Method in Deeply-Buried Carbonate Reservoirs Based on Deep Neural Network. J. Petroleum Sci. Eng. 208, 109346. doi:10.1016/j.petrol.2021.109346
Yin, S., Ding, W., Zhou, W., Shan, Y., Wang, R., Liu, J., et al. (2016). Logging Assessment of Tight Clastic Rock Reservoir Fractures via the Extraction of Effective Pore Aspect Ratios: A Case Study of Lower Permian Strata in the Southern Qinshui Basin of Eastern China. J. Nat. Gas Sci. Eng. 36, 597–616. doi:10.1016/j.jngse.2016.11.001
Zeng, L., Gong, L., Guan, C., Zhang, B., Wang, Q., Zeng, Q., et al. (2022). Natural Fractures and Their Contribution to Tight Gas Conglomerate Reservoirs: A Case Study in the Northwestern Sichuan Basin, China. J. Petroleum Sci. Eng. 210, 110028. doi:10.1016/j.petrol.2021.110028
Keywords: natural fracture, tectonic fracture, low-permeability sandstone reservoir, fracture effectiveness, Yinggehai basin
Citation: Li H, Fan C, Jiang Z, Li J, Li C, Xu X, Li F and Hu G (2022) Natural Fractures in Low-Permeability Sandstone Reservoirs in the LD-A HPHT Gas Field, Yinggehai Basin: Implications for Hydrocarbon Exploration and Development. Front. Earth Sci. 10:934097. doi: 10.3389/feart.2022.934097
Received: 02 May 2022; Accepted: 03 June 2022;
Published: 15 July 2022.
Edited by:
Ahmed E. Radwan, Jagiellonian University, PolandReviewed by:
Shuai Yin, Xi’an Shiyou University, ChinaYiming Yan, China University of Petroleum (Huadong), China
Copyright © 2022 Li, Fan, Jiang, Li, Li, Xu, Li and Hu. This is an open-access article distributed under the terms of the Creative Commons Attribution License (CC BY). The use, distribution or reproduction in other forums is permitted, provided the original author(s) and the copyright owner(s) are credited and that the original publication in this journal is cited, in accordance with accepted academic practice. No use, distribution or reproduction is permitted which does not comply with these terms.
*Correspondence: Zhenxue Jiang, amlhbmd6eEBjdXAuZWR1LmNu
 Hui Li1,2
 Zhenxue Jiang
 Jun Li
 Chao Li