 Prohelika Dalal1
 Bhaskar Kundu
 Jagabandhu Panda
 Shuanggen Jin
- 1Department of Earth and Atmospheric Sciences, National Institute of Technology Rourkela, Rourkela, Odisha, India
- 2School of Surveying and Land Information Engineering, Henan Polytechnic University, Jiaozuo, China
- 3Shanghai Astronomical Observatory, Chinese Academy of Sciences, Shanghai, China
The atmospheric Lamb wave induced by the Hunga Tonga (South Pacific) volcanic eruption on 15 January 2022 was recorded as atmospheric pressure fluctuations at various meteorological stations around the globe, and persisted for several days after the eruption. This Lamb wave had not been reported from any eruption in the last two decades. In the present study, the barometric pressure change induced by the Lamb wave is used as a direct proxy to quantify the volcanic explosivity index (VEI) of this eruption. An empirical equation, which is used as a function of the size of the eruption and the distance of the barometric station from the source of eruption, determined from pressure-change data that the volume of the eruption was ∼8.6 km3. Accordingly, the VEI of the eruption is found to be 5. The VEI derived from the barometric pressure change is consistent with the VEI estimated through seismic waveforms, and hence can be considered a first-order parameter of the eruption.
1 Introduction
Estimating the exact size and strength of volcanic eruptions in remote places or underwater is difficult to constrain due to their complex nature and the poor coverage of seismic instruments (Poli and Shapiro, 2022). Thus, monitoring remote or underwater volcanoes is only possible with the support of satellite observations (Vaughan and Webley, 2010) and global networks of geophysical instruments (Poli and Shapiro, 2022; Vergoz et al., 2022). The volcanic explosivity index (VEI) is widely used to quantify the size of eruptions (Newhall and Self, 1982). The VEI scale ranges from 0 to 8 and is computed by considering five quantitative and qualitative parameters of a volcanic eruption: magnitude (volume of eruption), intensity (volume of eruption per unit time), dispersive power (estimated from column height), violence (rate of kinetic energy release), and destructive potential (extent of devastation) (Walker, 1980; Newhall and Self, 1982). The 15 January 2022 Hunga Tonga–Hunga Ha’apai underwater eruption provided us with an opportunity to rapidly quantify its size from modern dense instrumental networks.
Hunga Tonga and Hunga Ha’apai, two small uninhabited islands of 0.4–0.65 km2 located in the Southwest Pacific, cover a large submarine volcano named Hunga Tonga–Hunga Ha’apai (Figure 1). On 15 January 2022 (∼4:02 UTC), this volcano erupted so violently that it was heard in Alaska, some 9,700 km away. The plume of ash, gas, and steam ejected from this undersea volcano reached up to 58 km into the atmosphere (https://earthobservatory.nasa.gov/images/149474/tonga-volcano-plume-reached-the-%20mesosphere[10.7.2022 09:57:05) and expanded in a mushroom-shaped cloud with a radius of up to 600 km; it was captured from space by the Himawari-8 satellite (https://himawari8.nict.go.jp) (Andrews, 2022; Musu, 2022; Ramesh, 2022; Vergoz et al., 2022). This submarine volcano is part of the active Tonga–Kermadec intra-oceanic island arc formed by the subduction of the Pacific plate beneath the Indo-Australian plate (Schellart et al., 2006). The subaerial part of the volcano is the volcano’s summit and comprises two transient islands of pyroclastic material formed in several eruptions dating back to 1770 CE (Brenna et al., 2022). The two islands are scraps of a large volcanic cone that was demolished by an eruption about 1040–1180 CE. In 2009, due to a two-month eruption sequence, a small cone of pyroclastic material formed above sea level but was removed very quickly by wave action (Brenna et al., 2022). Due to several eruptions from December 2014 to January 2015, the islands were connected by the accumulation of pyroclastic deposits and formed a tombolo. Because of the large explosive eruption on 15 January 2022, this tombolo was destroyed. The amount of material ejected into the upper atmosphere from this catastrophic eruption was ∼6.5×10¹² kg (Poli and Shapiro, 2022) about ten times higher than that of the 1707 CE Mt. Fuji volcanic eruption (https://asia.nikkei.com/Economy/Natural-disasters/Satellite-images-show-explosive-power-of-Tonga-underwater-volcano) and more than 500 times the force of the atomic bomb dropped on Hiroshima, Japan, in 1945 (Mallapaty, 2022). The 2022 eruption generated a tremendous shock wave through the atmosphere and triggered tsunami waves a long way, including to Hawaii, the West Coast of the United States, Alaska, and Chile (Somerville et al., 2020). A sequential change in atmospheric pressure rippling through the Earth’s atmosphere was recorded from this eruption by several weather stations across the globe (https://www.eri.u-tokyo.ac.jp/en/news/4824/). Such shock waves that travel around the world are also called “Lamb waves” (Heki, 2022; Zhang H et al., 2022). A Lamb wave is a type of acoustic gravity wave that propagates along the Earth’s surface and travels at the velocity of sound. It propagates horizontally and maintains hydrostatic equilibrium in a vertical direction (Nishida et al., 2014; Matoza et al., 2022). The concept of acoustic Lamb waves was first proposed by Horace Lamb in 1917. This type of guided wave mainly propagates through solid plates, both symmetrically and asymmetrically, under traction-free surfaces (Lamb, 1917). The velocity of the Lamb wave depends on the acoustic frequency and the thickness of the medium. Several laboratory-based experiments have investigated the characteristics of this complex wave. When the Lamb wave propagates through any medium, it has sometimes been found that some of its energy is emitted into the surrounding medium—also known as a “leaky Lamb wave” or “leakage of Lamb wave” (Deighton et al., 1981). Leaky Lamb waves propagate along the Earth’s surface and emit energy into the upper atmosphere through atmospheric resonance at acoustic and gravity wave frequencies (Zhang et al., 2022a). This causes atmospheric pressure change, which is detected by barometric stations.
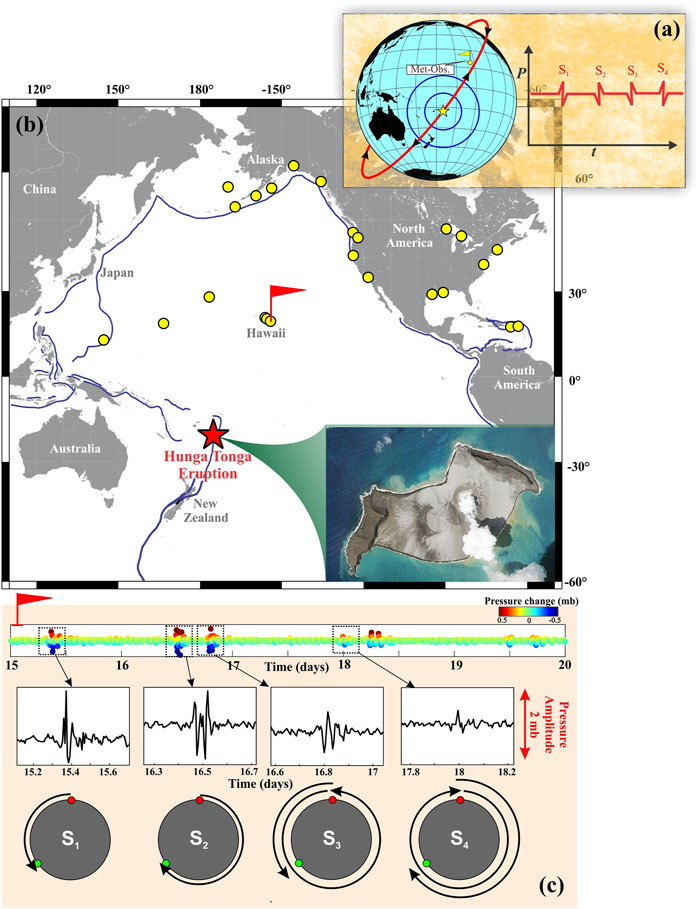
FIGURE 1. 2022 Hunga Tonga volcanic eruption and atmospheric pressure disturbance. (A) Schematic representation of the Lamb wave, which was induced by the volcanic eruption and traveled around the globe several times. Different meteorological stations recorded the atmospheric pressure changes at almost four significant phases. (B) Location of volcanic eruption and meteorological stations are marked by red star and yellow circles, respectively. Bottom panel shows aerial view of before the eruption (taken from: Planet Labs PBC/EYEPRESS/Shutterstock). (C) Representative atmospheric pressure fluctuation data from Kahului, Hawaii meteorological station (location represented in (a) by red flag), showing the four pressure fluctuations (S1–S4) from 15–19 January. Enlarged versions of four individual signals are shown in the middle panel. Lowest panel shows the representative travel path of the Lamb wave around the globe. Red dot represents the location of the volcano and green dot represents the station’s location.
After large volcanic eruptions or large nuclear explosions, acoustic gravity waves propagate a long way in the atmosphere, equivalent to several times around the Earth. It has been observed that, in the lower atmosphere, acoustic gravity waves are attenuated by radiative heat exchange and turbulence effects (Pierce and Posey, 1971). Super long-range gravity waves generated from large explosions that can circle the globe have been studied systematically: their average velocity was found to be equal to the average speed of sound in the atmosphere—324 m/s (Kulichkov, 1987). Therefore, acoustic gravity waves which pass along the surface of the Earth are an analog of two-dimensional Lamb waves for atmospheric stratification (ReVelle and Kulichkov, 1998). It has been found that Lamb waves are generated by large-scale atmospheric turbulence in the atmosphere (Nishida et al., 2014). Lamb waves were documented during the Krakatau volcanic eruption in 1883, the Siberian meteorite impact in 1908, the 1970 Solar eclipse (Chimonas, 1973), large nuclear tests (Donn and Shaw, 1967), and great earthquakes (Mikumo, 1968). During the Mt. Pinatubo (Philippines) volcanic eruption in 1991, long trains of infrasonic and acoustic-gravity waves were recorded by several ground based stations in Japan and around the globe (Kanamori and Mori, 1992). The atmospheric waves caused by the 2022 Hunga Tonga eruption propagated upwards and disturbed the ionosphere—a feature captured by ground-based GNSS networks across the globe (Kundu et al., 2022; Themens et al., 2022; Zhang et al., 2022a). This disturbance was recorded as total electron content change in the upper atmosphere. It has been observed that ionospheric disturbance propagates at the same velocity as atmospheric Lamb waves (Zhang et al., 2022a). This ionospheric disturbance has a strong contribution from acoustic and gravity waves. The gravity wave produced by this eruption was observed before the tsunami wave, which can support early tsunami warning systems (Kundu et al., 2022).
We report that the Lamb wave generated by 2022 Hunga Tonga eruption circulated about five to six times across the glove and was recorded by several barometric pressure stations over 15–19 January 2022. In the present study, barometric pressure change is considered across several weather stations of the Pacific Ocean and the US coast, caused by the Lamb waves from the Hunga Tonga eruption, to quantify its size and represent it on the VEI scale. We also evaluate the relationship between the change in barometric pressure induced by the Lamb waves and the distance of barometric stations from the eruption point, with the availability of a denser network for rapid estimation of the size of the volcanic eruption. Two recent studies by Matoza et al. (2022) and Yuen et al. (2022) also estimate the volume of the Hunga Tonga eruption by using barometric pressure change data. Although this study considers identical barometric datasets to quantify the VEI for the Hunga Tonga eruption, it adopts a distinct methodology.
2 Data and methods
2.1 Barometric data
We collected barometric data from different stations operated by the Center for Operational Oceanographic Products and Services (CO-OPS) and controlled by the National Oceanographic and Atmospheric Administration (NOAA) which are located around Pacific Ocean coastlines (Figure 1). Barometric data can be openly accessed and archived from https://tidesandcurrents.noaa.gov/. All the barometric stations (∼440) are mostly located along coastlines (Figure 1B). Some are equipped with meteorological sensors that collect different physical observations (e.g., water level, air temperature, water temperature, wind speed and direction, relative humidity, and visibility). However, we exploit only barometric pressure data from various locations with good geometrical coverage from the source in order to calculate the VEI of the 2022 Hunga Tonga volcanic eruption. The standard sampling rate of 6 min of real-time series of barometric pressure data is used to quantify the variation in pressure changes in the five consecutive days from 15–19 January, induced by the leaky Lamb wave (or atmospheric Lamb wave) oscillation after the eruption.
2.2 Estimation of the eruption's volume from barometric pressure as a proxy for the volcanic explosivity index (VEI)
To quantify the VEI of the Hunga Tonga–Hunga Ha’apai volcanic eruption, we considered barometric pressure change as a proxy to estimate the magnitude (i.e., volume of eruption) using an empirical equation proposed by Danard and Murty (1988). They proposed an empirical relation between the amplitude of atmospheric pressure changes (considering Reed’s (1987) datasets; see Supplementary Table S1) as a function of the intensity of the eruption and the distance of the barometric station from the eruption epicenter. The empirical relation underlies an equation of the straight line of the logarithmic value of barometric pressure amplitude changes (p) versus the logarithmic value of the distance of the station from the source of eruption (S) (Figure 2). This can be expressed as:
where d1 and d2 are two empirical constants. The constant d1 depends on the strength of the explosion and d2 is considered constant for all the explosions. To derive the values of d1 independently, various explosion datasets are considered in this study (from Reed (1987) and see Supplementary Table S2 in the supplementary file). To compute the ratio of pressure amplitudes and explosive force we assume that
where V indicates the volume of material ejected by any explosion/eruption. Considering the logarithmic expression in Eq. 2, this equation can be expanded as follows:
After solving Eqs. 1, 2, the following expression can be obtained:
Since V does not depend upon the distance (S) between the barometric station and volcanic eruption, Eq. 4 can expressed as
where k1 is another constant, as d1 is dependent on Log10V. Now, substituting Eq. 5 into Eq. 4, we can derive
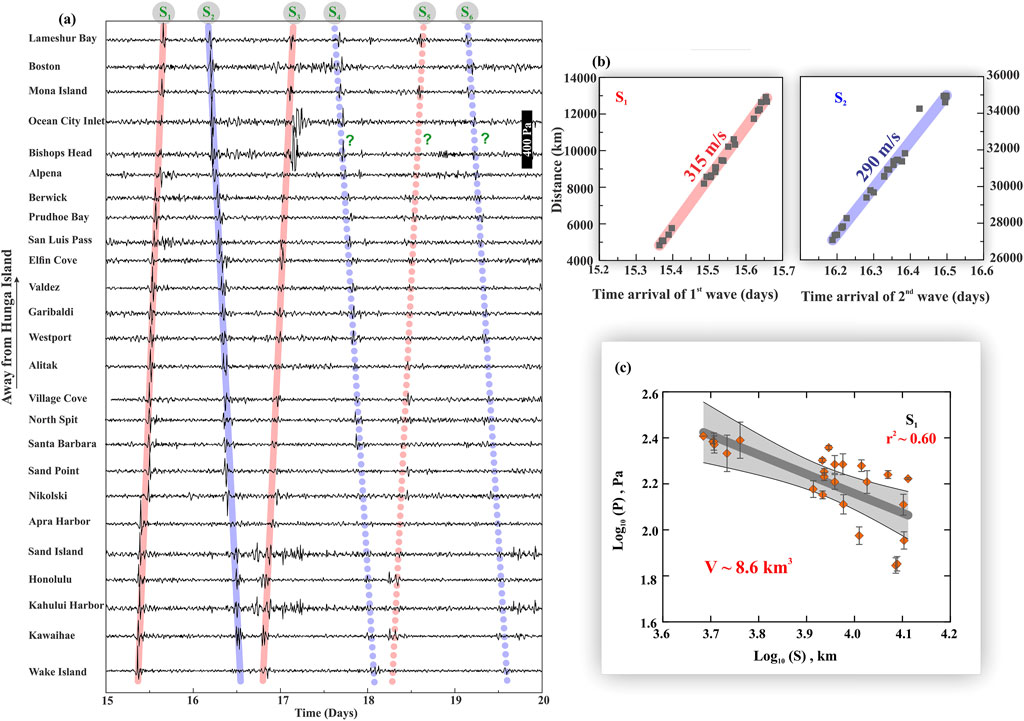
FIGURE 2. (A) Barograms of 25 weather stations mapped after the volcanic explosion from 15 to 20 January 2022. Barograms are arranged by increasing distance from the location of the eruption, through which the shift of the pressure disturbance with time is indicated clearly. (B) Distance versus arrival time of the first two waves S1 and S2 in all 25 weather stations. (C) Logarithmic value of pressure change on the arrival of first wave S1 versus the logarithmic value of the distance of the stations from Hunga Tonga. Note that the volume of the material ejected from the eruption is ∼8.6 km3, derived from pressure change data.
The value of k1 is evaluated as ∼ 4.42 from the datasets of the 1980 Mt. St. Helens and 1883 Krakatau eruptions (Danard and Murty, 1988) and the Hunga Tonga eruption of January 2022, considering the volume of ejected material calculated from the equation proposed by Mastin et al. (2009) (see Supplementary Document and Supplementary Table S3). Eq. 6 can further be expressed as
The value of d2 is estimated by considering datasets of the 1980 Mt. St. Helens eruption (Washington), Tunguska meteorite impact (Russia) in 1908, US 15-megaton nuclear test (USA) of 1954, Soviet 57-megaton nuclear test (USSR) of 1961 (Danard and Murty, 1988, Supplementary Table S3), and the Hunga Tonga eruption. Finally, the weighted average value of d2 is calculated as ∼ -0.84, consistent with Danard and Murty’s (1988) estimate. The final expression of Eq. 1 is as follows:
This indicates that the pressure changes captured through the barometric stations (p in Pascal) are linearly related to the respective distance of the stations (S in km) from the source in log–log plots. Moreover, we also acknowledge that there are several limitations to this method for estimating the volume of an eruption. First, there are several other meteorological parameters (e.g., wind speed, temperature, and humidity) that may affect the amplitude of pressure change. Second, a volcanic eruption is a complex process which does not occur in a single phase—it may last hours, days, or for a much longer period. Nevertheless, this method provides a rapid quantitative approach to estimate the size of large volcanic explosions during the most intensive phase of an eruption. Hence, we considered the intensive phase (4:20–8:40 UTC) of the Hunga Tonga volcanic eruption to estimate its volume.
3 Results
We present an analytical approach and an empirical relationship was used to quantify the volcanic explosivity index (VEI) of the 15 January 2022, Hunga Tonga volcanic eruption, as this index is directly linked to the volume of material ejected by an eruption. Hunga Tonga eruption generated an atmospheric Lamb wave, which was captured by the global barometric stations of NOAA. It affected atmospheric pressure fluctuations and persisted for several days even after the eruption (Figure 1B). The raw time-series from all barometric stations were filtered using a 1–10 min band-pass filtering approach to capture and magnify the variation in atmospheric pressure triggered by the atmospheric Lamb wave (Figure 1C) and also to align them sequentially with the increasing order of distance of the stations from the source of eruption (Figure 2A). From this observation, several phases of atmospheric Lamb wave cycles were identified (S1, S2, S3, and so on), showing noticeable oscillations in the next few days (15–19 January 2022). The first atmospheric Lamb wave cycle, captured by barometric stations on 15th January, is named ‘S1’, and traveled through the shortest path from the source. The second wave cycle (as S2) traveled in the opposite direction of the volcano with a longer path and arrived at the barometric stations on 16 January (Figure 1C; Figure 2A). Gradually, the waves kept rotating several times around the globe; subsequently, six prominent cycles were identified (S1, S2, S3, S4, S5, and S6). The signatures of the first three cycles (S1, S2, and S3) were found to be more prominent than the next three (S4, S5, and S6), possibly due to the gradual attenuation of the signal (Figures 2A,2C).
We also plotted the time series of barometric pressure for the period 1 –31 January 2022 (i.e., a much longer temporal duration). We observed that the abrupt change in barometric pressure was only seen after the eruption. In fact, before the eruption, there is no such change in barometric pressure (Supplementary Figure S1). We noticed that, 6 days after the eruption, there is no change in the barometric pressure in the NOAA stations (Supplementary Figure S1). Hence, we argue that the signatures in barometric pressure fluctuations observed after the eruption are explicitly caused by the atmospheric Lamb wave, triggered by the 2022 Hunga Tonga volcanic eruption. Furthermore, we checked other meteorological parameters (e.g., wind speed, tide, and air temperature) recorded in the NOAA observatory stations during our investigation period for this eruption but we noticed no such change in those meteorological parameters. Hence, we argue that the change in barometric pressure presented in our case was not affected by any other meteorological phenomenon.
The overall amplitude of pressure fluctuation was reported in the order of ∼30–260 Pa (Figure 2A). From the spatial distance of the barometric stations and the arrival times of the first two cycles of the atmospheric Lamb waves, the velocity of the waves is computed as ∼315 m/s for S1 and ∼290 m/s for S2 (Figure 2B). Interestingly, the velocity of both phases of the Lamb wave (S1 and S2) is similar to the velocity of the acoustic sound wave. An identical speed of the pressure wave was also reported after the 1883 eruption of Krakatau and the 1980 Mt. St. Helens eruption (Danard and Murty, 1988). Moreover, it should be noted that the Lamb waves in the Earth’s atmosphere propagate non-dispersively in the horizontal direction with velocity of about 310 m/s while maintaining hydrostatic balance in the vertical direction (Bretherton 1969; Lindzen and Blake 1972; Gossard and Hooke 1975).
Considering the empirical expression presented in Eq. 8, a log–log statistical linear relationship (r2 ∼0.60) was obtained between the pressure changes (p, in Pascal) captured by the barometric stations by station distance (S, in km) (Figure 2C). The obtained slope of the straight line is also consistent with the empirical equation proposed by Danard and Murty, (1988). We determined that about 8.6 km3 of material was ejected during this eruption. This estimated volume of material ejected may be associated with a VEI scale of 5.
Furthermore, the pressure changes of the arrival of later Lamb wave phases (e.g., S2, S3, and S4) were examined to determine the ejecta volume from the volcanic eruption in an identical manner as that obtained for S1 (Figure 3). However, we observed that the pressure changes and station distances for the later phases of the Lamb wave do not demonstrate a good statistical correlation for determining V. Hence, the value of V ∼8.6 km3 as determined from the first Lamb wave (Figure 2C) is considered the final one. We crosschecked the volume of material ejected from the Hunga Tonga eruption by adopting the methodology proposed by the Mastin et al. (2009):. The volume of magma ejected during any eruption and the ash column height (Hc) is related as (Mastin et al., 2009):
where v is the volumetric magma flow rate during the time of eruption (in m3 per second). Mastin et al. (2009) derived this equation from the plot of plume height versus the eruption rate of some historical volcanic eruptions (Supplementary Table S5). By considering the average ash column height as ∼39 km (Figure 4A, Table S4), we estimate that the volume of material ejected from the Hunga Tonga eruption during its most intense phase is ∼8.9 km3 and that the associated VEI of the January 2022 Hunga-Tonga eruption is ∼5 (Figure 4B).
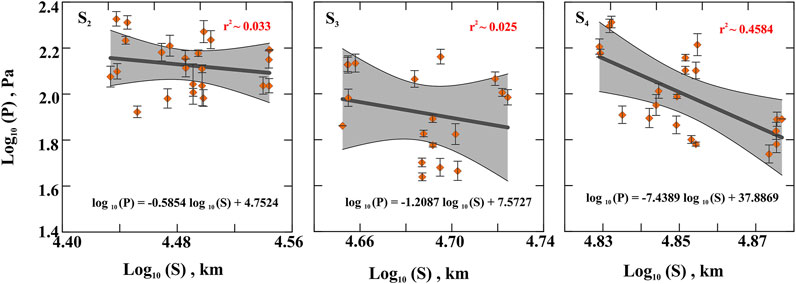
FIGURE 3. Logarithmic value of pressure change by arrival of second wave S2, third wave S3, and fourth wave S4 versus logarithmic value of the distance of the Lamb wave traveled around the globe in different phases (shown in Figure 1C) to reach the same stations from the Hunga Tonga eruption location/source. Gray areas represent the 95% confidence level area of the dataset.
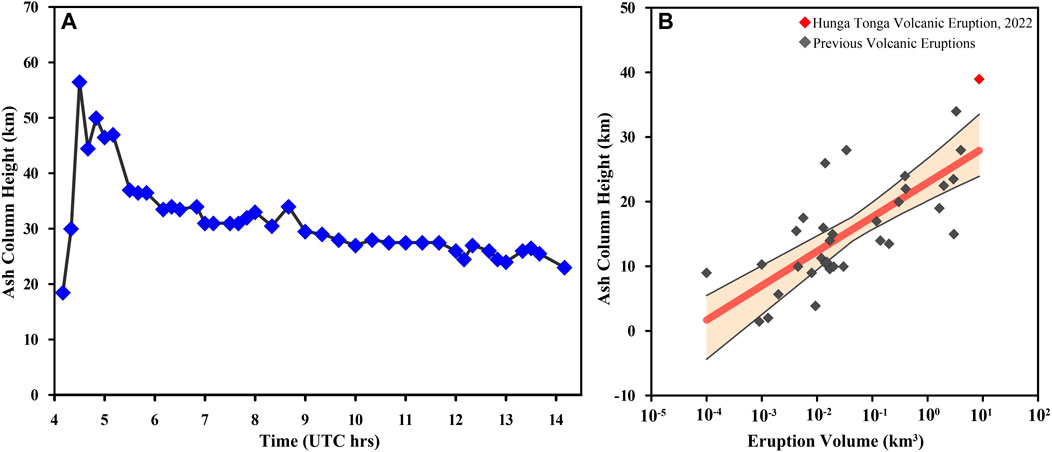
FIGURE 4. (A) Time series of the ash column height of the main phase of the Hunga Tonga eruption on 15 January 2022 (see Supplementary Table S5). (B) Ash column height (in km) versus VEI plot of some known volcanic eruptions. Previous eruptions are denoted by gray symbols (see Supplementary Table S5); the Hunga Tonga eruption is denoted by red symbols. Red line represents the linear regression line of the data. Black lines above and below the red line indicate the 95% confidence level.
The overall statistical correlation value of our dataset for the 2022 Hunga Tonga eruption is ∼0.60, which might not look like a good fit. Thus, to check if our data are statistically acceptable for the equation of Danard and Murty (1988) to estimate the eruption's volume, we considered the barometric data from the Mt. St. Helens eruption (from Reed, 1987) and divided the datasets into three groups according to the distance of the stations from the eruption: stations within a 1,000 km radius of the eruption, stations outside a 1,000 km radius of the eruption, and all combined data with respect to epicenter of Mt. St. Helens eruption. We present the logarithmic value of barometric pressure amplitude changes (p) versus the logarithmic value of the distance of the station (S) from Mt. St. Helens for those three respective datasets in Supplementary Figure S2. From this analysis, we noticed that the overall statistical correlation value is in the range of ∼0.30 –0.50; however, the nearest datasets (from stations within a 1,000 km radius of the eruption) provide a higher statistical significance than the farther datasets (from stations outside 1,000 km radius of the eruption) (Supplementary Figure S2). Moreover, when we combine all the datasets, the correlation value becomes higher (r2∼0.70). Hence, we argue that the log–log statistical correlation between the pressure changes with station distance for Hunga Tonga appears to be robust with respect to the 1980 Mt. St. Helens eruption, although variation in station distance may play a significant role in the statistical significance.
4 Discussion
4.1 Comparison with other reported VEIs for the Hunga Tonga volcanic eruption
Poli and Shapiro (2022) use the back projection approach of recorded surface waves for quick analysis to detect and locate volcanic eruptions. They suggest that the seismic waves generated by the January 2022 Hunga Tonga massive volcanic explosion can be considered an important first-order parameter. From their rapid quantitative approach to the estimation of the size of large volcanic explosions, they suggested that Hunga Tonga had a VEI of 6. Vergoz et al. (2022) consider the 53 infrasound stations data to study the effect of this eruption on atmospheric pressure. They suggest that the eruption had an equivalent TNT yield of 100–200 megatons. This implies that the VEI value is in a range of 5–6. Similarly, Yuen et al. (2022) analyze 117 infrasound and 584 barometric data from January 13–20, 2022, and measure the amplitude of the Lamb wave at each station of the Incorporated Research Institute for the Seismology Data Management Center (IRIS DMC). They observe that the maximum amplitude of the Lamb wave is about ∼780 Pa. By comparing their results with other eruptions, Yuen et al. (2022) suggest that the VEI of Hunga Tonga was in the range of 5–6. Based on the amplitude of the Lamb waves, Matoza et al. (2022) suggest the size of the eruption to be comparable to the 1883 Krakatau eruption. Zhang et al. (2022b) suggest that the VEI of Hunga Tonga was ∼5, based on the volume of the ejection, column height, qualitative description, classification of volcanism, duration of the continuous blast, and the tropospheric and stratospheric injections. Additionally, Cronin et al. (2022) propose the VEI of this eruption to be equivalent to 5–6 using the ash column height. All aforementioned estimated VEIs for Hunga Tonga are consistent with our result (i.e., VEI ∼5). Therefore, we suggest that the estimated VEI for this eruption in the present study appears to be consistent. Moreover, we also acknowledge that the volume of the eruption presented in this study mainly represents only the intensive phase of Hunga Tonga (i.e., 15 January 2022).
4.2 Impact on global climate of the Hunga Tonga eruption
Another matter of concern after this eruption is the global cooling of the Earth’s atmosphere (Supplementary Figure S3). Notably, after the 1991 Mt. Pinatubo eruption, the global mean temperature lowered by 0.4°–0.5° for over a year (McCormick et al., 1995). In 1815, the Mt. Tambora eruption resulted in “years without summer” (Raible et al., 2016). Large volcanic eruptions lead to global cooling due to large SO2 emissions into the stratosphere. The sulfur, water, halogens, ash, and associated chemical compounds from large volcanic eruptions could contribute significantly to stratospheric aerosol loading—especially sulfate aerosols like SO2 (Robock, 2000; Kravitz and Robock, 2011; Brühl et al., 2012; Laakso et al., 2016). The sulfate aerosols emitted into the stratosphere by such eruptions reside there for 1–3 years, resulting in negative radiative forcing (Aubry et al., 2021). This results in fewer incoming and outgoing radiation components of the Earth’s surface energy budget (Langmann 2014) and global temperature may thus fall substantially (Kremser et al., 2016), resulting in a detectable climatic effect (Kravitz and Robock, 2011; Langmann, 2014; LeGrande et al., 2016; Watanabe and Tatebe, 2019). Large eruptions like the 1991 Mt. Pinatubo eruption and the 2022 Hunga Tonga eruption may affect different climatic circulations like the tropical monsoon, the El Niño oscillation, and the Atlantic meridional overturning circulation. (Themens et al., 2022). In the context of such observations, it may be argued that a similar global cooling effect may be possible in the near future because of Hunga Tonga with a VEI ∼5. However, Zhang et al. (2022b) suggest that global mean surface air temperature will only decrease by about 0.0315°C–0.1118 °C in the next 1–2 years. This will slow global warming slightly over a short period and will not change the long-term trend of global warming. Zuo et al. (2022) predict that this eruption, with an intensity of 0.4 Tg SO2 injection, will cause a 0.004 °C drop in the global mean surface temperature in the first year after the eruption. These values fall within the amplitude of internal variability at the inter-annual time scale. Thus, the global mean surface temperature and SO2 injection of this eruption are not strong enough to have a significant impact on the global climate.
5 Conclusion
From the study based on the pressure change on the barometric stations induced by the Lamb wave from the 15 January 2022 Hunga Tonga–Hunga Ha’apai eruption, we summarize the following salient points:
1. The Lamb wave generated from this eruption circulated around the globe several times. We calculate the velocity of the Lamb wave from the barometric pressure change to be ∼300 m/s—similar to the velocity of the sound wave.
2. From the empirical equation based on the pressure change in the barometric stations, we quantify the material ejected during this eruption to be approximately 8.6 km3—equivalent to ∼5 in the VEI scale and also consistent with the seismic wave estimated VEI.
Data availability statement
The original contributions presented in the study are included in the article/Supplementary Material; further inquiries can be directed to the corresponding author.
Author contributions
BK provided the research idea. PD performed barometric data analysis and estimated the VEI. BK and PD wrote the original manuscript. JP and SJ revised and edited the manuscript. All authors took part in finalizing the manuscript.
Funding
This work was supported by the National Natural Science Foundation of China (NSFC) Project (Grant No. 12073012).
Acknowledgments
The authors thank Steve Self (co-founder of the VEI), Roland Burgmann, and Tushar Mittal for stimulating discussion/input that significantly improved the present work. PD was supported by the NITR research fellowship. The authors thank Batakrushna Senapati from the Tectonic Geodesy Lab (https://www.tectonicgeodesylab.in/) who helped analyze the barometric data. The authors thank Chief Editor Valerio Acocella, Associate Editor Thorvaldur Thordarson, and two reviewers for their constructive comments, which helped improve the quality of the manuscript.
Conflict of interest
The authors declare that the research was conducted in the absence of any commercial or financial relationships that could be construed as a potential conflict of interest.
Publisher’s note
All claims expressed in this article are solely those of the authors and do not necessarily represent those of their affiliated organizations, or those of the publisher, the editors, and the reviewers. Any product that may be evaluated in this article, or claim that may be made by its manufacturer, is not guaranteed or endorsed by the publisher.
Supplementary material
The Supplementary Material for this article can be found online at: https://www.frontiersin.org/articles/10.3389/feart.2022.931545/full#supplementary-material
References
Andrews, R. (2022). Scientists are racing to understand the fury of Tonga’s volcano. Available at: https://www.wired.com/story/tonga-volcano-eruption-science/
Aubry, T. J., Staunton-Sykes, J., Marshall, L. R., Haywood, J., Abraham, N. L., and Schmidt, A. (2021). Climate change modulates the stratospheric volcanic sulfate aerosol lifecycle and radiative forcing from tropical eruptions. Nat. Comm. 12 (1), 4708–4716. doi:10.1038/s41467-021-24943-7
Brenna, M., Cronin, S. J., Smith, I. E. M., Pontesilli, A., Tost, M., Barker, S., et al. (2022). Post-caldera volcanism reveals shallow priming of an intra-ocean arc andesitic caldera: Hunga volcano, Tonga, SW Pacific. Lithos 412, 106614. doi:10.1016/j.lithos.2022.106614
Bretherton, F. P. (1969). Lamb waves in a nearly isothermal atmosphere. Q. J. R. Meteorol. Soc. 95 (406), 754–757. doi:10.1002/qj.49709540608
Brühl, C., Lelieveld, J., Crutzen, P. J., and Tost, H. (2012). The role of carbonyl sulphide as a source of stratospheric sulphate aerosol and its impact on climate. Atmos. Chem. Phys. 12 (3), 1239–1253. doi:10.5194/acp-12-1239-2012
Chimonas, G. (1973). Lamb waves generated by the 1970 solar eclipse. Planet. Space Sci. 21, 1843–1854. doi:10.1016/0032-0633(73)90115-3
Cronin, S., Kula, T., Brenna, M., Ukstins, I., Adams, D., White, J., et al. (2022) Insights into a large volcanic explosion: Hunga Volcano, Tonga. Available at: https://www.youtube.com/watch?v=4N2U8h92OPI. Accessed 2022.
Danard, M. B., and Murty, T. S. (1988). Atmospheric pressure changes due to volcanic eruptions and possible water level fluctuations. Nat. Hazards 1, 15–26. doi:10.1007/bf00168219
Deighton, M. O., Gillespie, A. B., Pike, R. B., and Watkins, R. D. (1981). Mode conversion of Rayleigh and Lamb waves to compression waves at a metal-liquid interface. Ultrasonics 19, 249–258. doi:10.1016/0041-624x(81)90014-7
Donn, W. L., and Shaw, D. M. (1967). Exploring the atmosphere with nuclear explosions. Rev. Geophys. 5 (1), 53–82. doi:10.1029/rg005i001p00053
Heki, K. (2022). Ionospheric signatures of repeated passages of atmospheric waves by the 2022 Jan. 15 Hunga Tonga-Hunga Ha’apai eruption detected by QZSS-TEC observations in Japan. Earth Planet Space 74, 112. doi:10.1186/s40623-022-01674-7
Kanamori, H., and Mori, J. (1992). Harmonic excitation of mantle Rayleigh waves by the 1991 eruption of Mount Pinatubo, Philippines. Geophys. Res. Lett. 19, 721–724. doi:10.1029/92gl00258
Kravitz, B., and Robock, A. (2011). Climate effects of high-latitude volcanic eruptions: Role of the time of year. J. Geophys. Res. Atmos. 116 (D1), D01105. doi:10.1029/2010jd014448
Kremser, S., Thomason, L. W., von Hobe, M., Hermann, M., Deshler, T., Timmreck, C., et al. (2016). Stratospheric aerosol—observations, processes, and impact on climate. Rev. Geophys. 54 (2), 278–335. doi:10.1002/2015rg000511
Kulichkov, S. N., Chunchuzov, I. P., and Popov, O. I. (1987). Simulating the influence of an atmospheric fine inhomogeneous structure on long-range propagation of pulsed acoustic signals. Izv. Atmos. Ocean. Phys. 28, 60–68. doi:10.1134/s0001433810010093
Kundu, B., Senapati, B., Burgman, R., and Ray, S. (2022). Detecting the January 15, 2022 Hunga Tonga volcanic eruption (SW Pacific) high up in the sky through “ionospheric resonance”. Geophys. J. Int., ggac492. (in Press). doi:10.1093/gji/ggac492
Laakso, A., Kokkola, H., Partanen, A. I., Niemeier, U., Timmreck, C., Lehtinen, K. E. J., et al. (2016). Radiative and climate impacts of a large volcanic eruption during stratospheric sulfur geoengineering. Atmos. Chem. Phys. 15, 305–323. doi:10.5194/acp-16-305-2016
Langmann, B. (2014). On the role of climate forcing by volcanic sulphate and volcanic ash. Adv. Meteorol. 2014. doi:10.1155/2014/340123
Legrande, A. N., Tsigaridis, K., and Bauer, S. E. (2016). Role of atmospheric chemistry in the climate impacts of stratospheric volcanic injections. Nat. Geosci. 9 (9), 652–655. doi:10.1038/ngeo2771
Lindzen, R. S., and Blake, D. (1972). Lamb waves in the presence of realistic distributions of temperature and dissipation. J. Geophys. Res. 77, 2166–2176. doi:10.1029/jc077i012p02166
Mallapaty, S. (2022). How the Tonga eruption is helping space scientists understand Mars. Nature. doi:10.1038/d41586-022-00137-z
Mastin, L. G., Guffanti, M., Servranckx, R., Webley, P., Barsotti, S., Dean, K., et al. (2009). A multidisciplinary effort to assign realistic source parameters to models of volcanic ash-cloud transport and dispersion during eruptions. J. Volcanol. Geotherm. Res. 186 (1-2), 10–21. doi:10.1016/j.jvolgeores.2009.01.008
Matoza, R. S., Fee, D., Assink, J. D., Iezzi, A. M., Green, D. N., Kim, K., et al. (2022). Atmospheric waves and global seismoacoustic observations of the January 2022 Hunga eruption, Tonga. Science 377 (6601), 95–100. doi:10.1126/science.abo7063
McCormick, M. P., Thomason, L. W., and Trepte, C. R. (1995). Atmospheric effects of the Mt Pinatubo eruption. Nature 373, 399–404. doi:10.1038/373399a0
Mikumo, T. (1968). Atmospheric pressure waves and tectonic deformation associated with the Alaskan earthquake of March 28, 1964. J. Geophys. Res. 73 (6), 2009–2025. doi:10.1029/jb073i006p02009
Musu, A. (2022). An overview on the 15 jan 2022 Hunga Tonga-huna Ha’pai eruption. Available at: https://blogs.egu.eu/divisions/gmpv/2022/02/09/an-overview-on-the-15-jan-2022-hunga-tonga-huna-haapai-eruption/#:∼:text=Hunga%20Ha’pai%20in%20foreground,Alaska%2C%20over%209000%20km%20away.
Newhall, C. G., and Self, S. (1982). The volcanic explosivity index (VEI) an estimate of explosive magnitude for historical volcanism. J. Geophys. Res. Oceans 87, 1231–1238. doi:10.1029/jc087ic02p01231
Nishida, K., Kobayashi, N., and Fukao, Y. (2014). Background Lamb waves in the Earth’s atmosphere. Geophys. J. Int. 196, 312–316. doi:10.1093/gji/ggt413
Pierce, A. D., and Posey, J. W. (1971). Theory of the excitation and propagation of lamb’s atmospheric edge mode from nuclear explosions. Geophys. J. R. Ustr. Soc. 26, 341–368. doi:10.1111/j.1365-246x.1971.tb03406.x
Poli, P., and Shapiro, N. M. (2022). Rapid characterization of large volcanic eruptions: Measuring the impulse of the Hunga Tonga Ha’apai explosion from teleseismic waves. Geophys. Res. Lett. 49, e2022GL098123. doi:10.1029/2022GL098123
Raible, C. C., Brönnimann, S., Auchmann, R., Brohan, P., Frölicher, T. L., Graf, H. F., et al. (2016). Tambora 1815 as a test case for high impact volcanic eruptions: Earth system effects. Wiley Interdiscip. Rev. Clim. Change 7 (4), 569–589. doi:10.1002/WCC.407
Ramesh, S. (2022). Volcanic eruption on tiny Tonga shook the world: What we know about the causes and impact so far. Available at: https://theprint.in/science/volcanic-eruption-on-tiny-tonga-shook-the-world-what-we-know-about-the-causes-and-impact-so-far/809422/
Reed, J. W. (1987). Air pressure waves from Mount St. Helens eruptions. J. Geophys. Res. 92 (D1011), 11979992–11980011. doi:10.1029/jd092id10p11979
ReVelle, D. O., and Kulichkov, S. N. (1998). “On Lamb wave propagation from small surface explosions in the atmospheric boundary layer,” in Proceedings of 9th International Symposium on Acoustic Remote Sensing and Associated Techniques of the Atmosphere and Oceans, Vienna, 6-10 July.
Robock, A. (2000). Volcanic eruptions and climate. Rev. Geophys. 38, 191–219. doi:10.1029/1998RG000054
Schellart, W., Lister, G., and Toy, V. (2006). A late cretaceous and cenozoic reconstruction of the Southwest Pacific region: tectonics controlled by subduction and slab rollback processes. Earth Sci. Rev. 76, 191–233. doi:10.1016/j.earscirev.2006.01.002
Somerville, P., Blong, R., and Gissing, A. (2020). Why the Tonga tsunami arrived much earlier and much larger than expected. Available at: https://www.preventionweb.net/news/why-tonga-tsunami-arrived-much-earlier-and-much-larger-expected
Themens, D. R., Watson, C., Žagar, N., Vasylkevych, S., Elvidge, S., Mccaffrey, A., et al. (2022). Global propagation of ionospheric disturbances associated with the 2022 Tonga Volcanic Eruption. Geophys. Res. Lett. 49 (7), e2022GL098158. doi:10.1029/2022gl098158
Vaughan, R. G., and Webley, P. W. (2010). Satellite observations of a surtseyan eruption: Hunga Ha’apai, Tonga. J. Volcanol. Geotherm. Res. 198 (1-2), 177–186. doi:10.1016/j.jvolgeores.2010.08.017
Vergoz, J., Hupe, P., Listowski, C., Le Pichon, A., Garcés, M. A., Marchetti, E., et al. (2022). IMS observations of infrasound and acoustic-gravity waves produced by the january 2022 volcanic eruption of Hunga, Tonga: A global analysis. Earth Planet. Sci. Lett. 591, 117639. doi:10.1016/j.epsl.2022.117639
Walker, G. P. L. (1980). The taupo pumice: product of the most powerful known (ultraplinian) eruption? J. Volcanol. Geoth. Res. 8, 69–94. doi:10.1016/0377-0273(80)90008-6
Watanabe, M., and Tatebe, H. (2019). Reconciling roles of sulphate aerosol forcing and internal variability in Atlantic multidecadal climate changes. Clim. Dyn. 53 (7), 4651–4665. doi:10.1007/s00382-019-04811-3
Yuen, D. A., Scruggs, M. A., Spera, F. J., Zheng, Y., Hu, H., McNutt, S. R., et al. (2022). Under the surface: Pressure-induced planetary-scale waves, volcanic lightning, and gaseous clouds caused by the submarine eruption of Hunga Tonga-Hunga Ha’pai volcano. Earthq. Res. Adv. 100134. doi:10.1016/j.eqrea.2022.100134
Zhang, H., Wang, F., Li, J., Duan, Y. H., Zhu, C. W., and He, J. Y. (2022a). Potential impact of Tonga volcano eruption on global mean surface air temperature. J. Meteorol. Res. 36, 1–5. doi:10.1007/s13351-022-2013-6
Zhang, S. R., Vierinen, J. A. E., Goncharenko, L., Erickson, P., Rideout, W., Coster, A., et al. (2022b). 2022 Tonga volcanic eruption induced global propagation of ionospheric disturbances via Lamb waves. Front. Astron. Space Sci. 9, 871275. doi:10.3389/fspas.2022.871275
Keywords: atmospheric Lamb wave, Hunga Tonga, VEI, barometric pressure, volcanic eruption
Citation: Dalal P, Kundu B, Panda J and Jin S (2023) Atmospheric Lamb wave pulse and volcanic explosivity index following the 2022 Hunga Tonga (South Pacific) eruption. Front. Earth Sci. 10:931545. doi: 10.3389/feart.2022.931545
Received: 29 April 2022; Accepted: 12 December 2022;
Published: 06 January 2023.
Edited by:
Thorvaldur Thordarson, University of Iceland, IcelandReviewed by:
Sudipta Sasmal, Institute of Astronomy Space and Earth Science, IndiaMicol Todesco, Istituto Nazionale di Geofisica e Vulcanologia (INGV), Italy
Copyright © 2023 Dalal, Kundu, Panda and Jin. This is an open-access article distributed under the terms of the Creative Commons Attribution License (CC BY). The use, distribution or reproduction in other forums is permitted, provided the original author(s) and the copyright owner(s) are credited and that the original publication in this journal is cited, in accordance with accepted academic practice. No use, distribution or reproduction is permitted which does not comply with these terms.
*Correspondence: Bhaskar Kundu, cmlsYmhhc2thckBnbWFpbC5jb20=