 Dongdong Sun1,2
 Xiangang Hou2,3*
 Tianhong Yang1,2*
 Yong Zhao1,2
 Penghai Zhang1,2Bin Yang4Yilong Liu1,2Ka Ma1,2
- 1Key Laboratory of Ministry of Education on Safe Mining of Deep Metal Mines, Northeastern University, Shenyang, China
- 2Center for Rock Instability and Seismicity Research, School of Resources and Civil Engineering, Northeastern University, Shenyang, China
- 3School of Mining Engineering, Heilongjiang University of Science and Technology, Harbin, China
- 4School of Civil Engineering, University of Science and Technology Liaoning, Anshan, China
The surrounding rock of a coal mine roof fractures with the excavation of the underground working face in coal mining. These mining-induced fractures are connected and extended upward to form water inrush channels. A water inrush accident may occur when there is a sufficiently large water source. To elucidate the formation mechanisms of the roof water inrush channel and the characteristics of water inrush in goafs, we performed a case study of No.18401 Panel of Xiqu Coal Mine in China and determined whether the roof water inrush channel is connected by theoretical calculation and microseismic monitoring. The modified mechanical parameters of rock masses were embedded into the numerical model based on microseismic data. Microseismic monitoring and numerical simulation were organically combined to analyze the connection process of the water inrush channel, after which the roof water inrush channel is calibrated on the No.18401 Panel. We established a non-Darcy flow model for water inrush in the water-conducting fractured zone of mines by coupling the Darcy, Forchheimer, and Navier–Stokes equations. Finite element language and its compiler (FELAC) was used to study the water inrush mechanism of non-Darcy seepage. The results show that the pressure, velocity, and porosity in the water-conducting fractured zone are non-uniform in water inrush occurrence and development, and the mixed fluid mainly passes through the “dominant channel.” The development of water inrush is accompanied by the release of the hydrostatic pressure in the aquifer, the sudden increase of the velocity at the water inrush position, and the increase in fluid concentration. Hence, the underground water inrush can be predicted and prevented by monitoring the aforementioned indicators. This research is of great significance for the calibration of the water inrush channel of the roof and the prediction of water inrush disasters.
Introduction
China’s coal reserves rank third in the world, and it is the world’s largest coal producer and consumer. Coal accounts for about 60% of China’s energy consumption (Li and Cui, 2019). Currently, about 90% of coal mines in China employ underground mining (Zhang, 2019). Underground water inrush disaster poses one of the most serious safety risks in coal mines, which directly affects the safety of production in mines as well as economic and social benefits. Among more than 600 key state-owned coal mines in China, 285 mines are threatened by water disasters, accounting for about 47.5%, and the reserves threatened by water disasters reach 2.5×10¹¹ t (Yang et al., 2007). In particular, the water inrush accidents in the goaf have an annually increasing trend, and the difficulty of water prevention and control in coal mines is gradually escalating. In the past ten years, the proportion of water inrush accidents in goafs has reached more than 70% (Hou et al., 2020). Therefore, the study of underground water inrush is of great significance for the safe mining of coal mines.
Identifying and monitoring water inrush channels in the mining rock mass are key problems in mine water disaster prevention and control. Due to the nature of rock mass and the complexity of the geological environment, theoretical analysis of the actual formation process and spatial distribution of the water inrush channel is challenging, namely, the analysis must be combined with field monitoring, laboratory similarity tests, and numerical simulation (Jiang et al., 2008). The monitoring methods of the water inrush channel mainly include the drilling method, geophysical method, and microseismic method. Gao et al. (2018) applied borehole television to realize a “quasi-dynamic” observation of the evolution of rock overburden fissures and the change in the connectivity rate during mining. Xu et al. (2012) used the parallel network electrical method to monitor the damage of the bottom plate in real-time, delineated the key areas, and enriched the dynamic monitoring means of the water inrush channels. This method lacks an in-depth interpretation of the rock mass failure mechanism. Microseismic monitoring can obtain the spatial location, mechanical parameters, and fracture mechanism of cracks in the process of rock mass rupture and can monitor the formation process of water inrush channels. Zhang et al. (2016) and Zhou et al. (2017; 2021) revealed the formation mechanism of seepage channels based on focal mechanism analysis and spatiotemporal evolution of microseismic events. Zhao et al. (2019) and Zhao et al. (2021) constructed a fracture network derived from microseismic data based on seismological theory and employed graph theory to identify the main channel of fracture seepage. The method of inversion of rock mass damage by microseismic energy has been continuously improved, and the apparent volume is introduced to determine the damage radius. Considering the effect of cumulative microseismic damage, a dynamic damage model was established based on primary and microseismic-derived cracks. Cai et al. (2001) and Cai et al. (2005) inverted the spatial geometric information of the fractures based on the acoustic emission data of the surrounding rock of the tunnel. The rock mass geometric damage model was established based on the fracture density. The inversion analysis of the tunnel surrounding rock displacement and damage area was realized. Yang et al. (2013) proposed a dynamic calibration method for rock mass strength parameters based on the number of microseismic events, amount of energy, and minimum distance between events, which was applied to the stability analysis of rock masses. Due to the complexity of the rock mass structure and monitoring environment, there are deficiencies in high-quality microseismic monitoring data. Therefore, the evolution mechanism of water inrush channels cannot be fully interpreted only by microseismic monitoring. The numerical simulation method has low cost and intuitive calculation results. It is a powerful tool for water inrush channel calibration. Scholars have applied continuum calculation software (Yang et al., 2011; Lu and Wang, 2015; Ma et al., 2019) to define and identify water inrush channels through the plastic zone (damage value) or to locate permeability change. The dynamic development process of water inrush fractures is obtained using discontinuous medium calculation methods (Chen et al., 2014; Lisjak et al., 2014; Poulsen et al., 2018; Ju et al., 2019; Ma and Liu, 2022). The aforementioned research results provide an important reference for the fracture of the mined rock stratum and the identification of the water inrush channel. Reasonable selection of mechanical parameters of rock mass is a difficult problem in numerical simulation. Numerical simulation should be combined with field monitoring, and the mechanical parameters of rock mass should be corrected according to field monitoring results. How to establish the characterization method of the water inrush channel penetration process of mining rock masses coupled with microseismic monitoring data demands further study.
Numerous underground water inrush accidents in coal mines show that the water inrush channel forms when water inrush occurs, and its seepage behavior no longer meets the linear Darcy’s law but shows nonlinear characteristics, that is, the non-Darcy seepage phenomenon (Cherubini et al., 2012). Relevant scholars have carried out extensive research on non-Darcy seepage phenomenon: Kohl et al. (1997) elucidated non-Darcy flow through field tests and used the non-laminar flow analysis method to transiently monitor the hydraulic field in the fractured rock mass. Yang et al. (2008) established a numerical model of water inrush fluid flow based on mass conservation and pressure balance and proposed to use the Brinkman equation to calculate the water inrush flow field in the rock fracture zone. Zhou et al. (2015) conducted laboratory seepage experiments on fractured granite and sandstone under different surrounding rock conditions. They found that Forchheimer’s law fully describes the nonlinear deviation of fluid flowing through rough fractures and proposed the empirical power function of fluid flow in rock fractures for the first time. Shi et al. (2016) established a non-Darcy flow model of water inrush coupled with the non-Darcy, Forchheimer, and Navier–Stokes equations, and used FEPG software to simulate the whole process of water inrush transient flow. They concluded that the inertial effect of high-speed water flow in the water inrush channel is the main cause of water inrush. Yang et al. (2021) used the FELAC to simulate the water inrush in the fracture zone of the Jiangjiawan Mine. This study reproduced the whole dynamic process of water inrush and revealed the distribution and variation characteristics of the pressure field, velocity field, porosity, and concentration, as well as the mechanisms underlying the sudden change in water flow. Scholars have less research and understanding of the water inrush characteristics of the water-conducting fractured zone, and the water inrush model is relatively too simplified. The spatial distribution of the water inrush channel lacks the calibration of the measured data.
In summary, this study takes No.18401 Panel of Xiqu Coal Mine as an engineering case. First, the connectivity of the roof water inrush channel was determined based on theoretical calculation and field microseismic monitoring. Second, microseismic monitoring and numerical simulation are combined to calibrate the water inrush channel. Finally, we establish a three-field coupling non-Darcy seepage model and employ FELAC finite element software for numerical simulation analysis of non-Darcy seepage to provide a scientific basis for calibrating the water inrush channel of the mine roof and prevent the water inrush disaster.
Engineering Background
The Xiqu Coal Mine is located in the north of Gujiao City, Shanxi province, China, about 0.5 km from Gujiao City. The mine field is 6.5 km long from north to south and 6 km wide from east to west, spanning an area of 39.5 km2. The main coal-bearing seams are Taiyuan Formation of the Carboniferous System and Shanxi Formation of the Permian System, with 14 coal seams. No.2 + 3, No.4, No.8, and No.9 coal seams are mainly mined (the buried depth increases). No.2 + 3 and No.4 coal seams have been mined out, and the No.9 coal seam has not been mined. The geological reserve amounts to 530 million tons, the occurrence of coal seams is gentle, and the dip angle is 5º–8º.
As the accumulated water in the goaf of No.2 + 3 and No.4 coal seams was pumped out in advance, there was no water inrush accident in the roof goaf of No.18401 Panel. However, according to the mine report, No. 18203 Panel of the mine had communicated with water in the goaf of the No.2 + 3 coal seam during the mining process, resulting in flooding of the working face. The average burial depth of the No. 8 coal seam working faces to be mined is 78 m, and the overlying old goaf of No.2 + 3 and No. 4 coal seams have been supplied by the surface Fanshigou river water and rainy season precipitation for a long time. Therefore, during the mining of No.8 coal seam, it is easy to connect the ponding in the overlying old goaf of No.2 + 3 and No.4 coal seams and even directly connect the surface riverbed. Therefore, choosing No.18401 Panel with detailed monitoring data to study the law of roof water inrush has important practical and theoretical significance for preventing and controlling water disasters in this and similar mines.
Overview of No.18401 Panel
No.18401 Panel is located in the south fourth plate of No.8 coal seam, with a buried depth of 212–255 m, a coal seam dip angle of 2º–9º, thickness of 3.75–4.40 m, and an average thickness of 4.00 m. The working face length (coal seam strike) is 220 m, and the advancing length (coal seam dip direction) is 456.5 m. The immediate roof of the working face is 1.4 m of limestone, and the main roof is 5.6 m of medium-grained sandstone. The overlying rock is mainly mudstone and sandstone, which has the characteristics of a “mudstone–sandstone” interbedding structure (Figure 1).
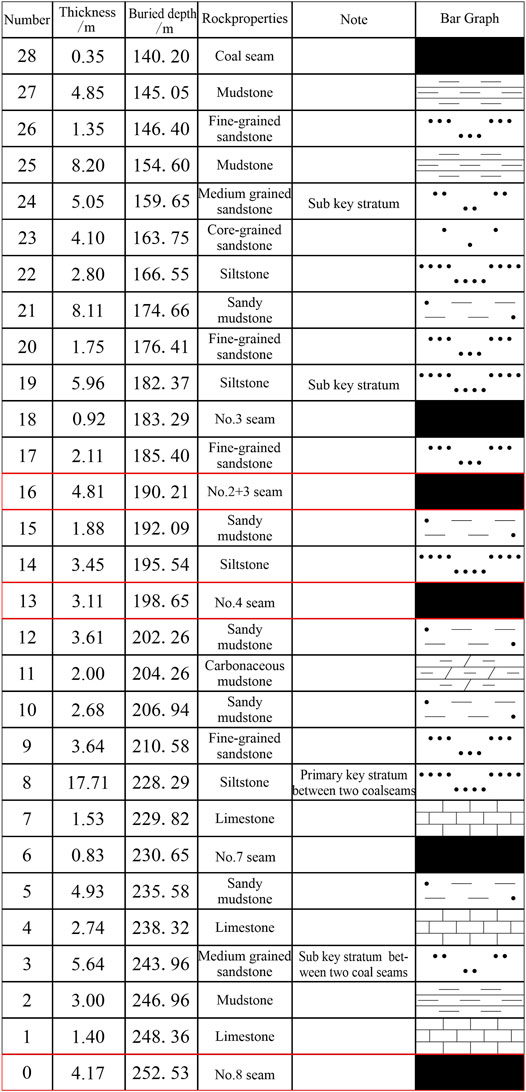
FIGURE 1. Borehole columnar section and the key stratum for ZK1 borehole.
Characteristics of Roof Water Filling Source
The direct water filling water source of No.8 coal seam roof is Taiyuan Formation sandstone and thin limestone aquifer. The water richness is weak and has little effect on mine water filling; therefore, it is not considered in this study. No.2 + 3 and No.4 coal seam goaf waters are the indirect water filling sources of the No.8 coal seam roof. No.2 + 3 and No.4 coal seam goafs are large, 1.2788 and 1.9015 million m2, respectively. In the rainy season, the rainwater infiltrates directly into the goaf through the water-conducting fracture, which is the main water filling source for the goaf of No.2 + 3 and No.4 coal seams. The roof cracks continue to develop with the mining of No.18401 Panel. The water inrush channel will be connected when the fracture develops to the floor of No.4 coal seam, and then the water in the goaf of No.2 + 3 and No.4 coal seams will flood into No.18401 Panel through the water inrush channel. This forms the underground water inrush accident, seriously threatening the safe and efficient production of the mine.
Height Discrimination of Water Conduction Fractured Zone
The water inrush channel connects the aquifer and mining space, which is the cause of the water inrush disaster. To determine the roof failure of the No.18401 Panel and the penetration of the water inrush channel; first, the thickness of the coal seam, distance between coal seams, and height of the fractured and caving zones are determined by drilling data and theoretical calculation. Then, the key stratum damage is determined. Finally, we verify whether the water-conducting fractured zone is connected based on the microseismic monitoring method.
Determining the Height of the Water Inrush Channel Based on Theoretical Calculations
The histogram of the ZK1 borehole (Figure 1) shows that in the vertical direction of No.18401 Panel, the distances between No.2 + 3 coal seam, No.4 and No. 8 coal seams are 58.15 and 49.71 m, respectively. The thickness of No.8 coal seam is 4.17 m, and the main roof is limestone, which is a hard rock. According to the “regulations for coal pillar reservation and coal pressure mining of buildings, water bodies, railways, main shafts, and roadways,” the height of the caving zone (Hm) and water-conducting fractured zone (Hli) of hard roof coal seam can be calculated by the following equation.
First, calculate the height of the caving zone:
Then, calculate the height of the water-conducting fractured zone:
Equation 1:
Equation 2:
where M is the cumulative mining thickness.
This result shows that the height of the caving zone is 19.34 m, and the height of the water-conducting fractured zone is 68.44 and 71.26 m, respectively. The result we selected was 71.26 m. Therefore, according to the calculation results, the cracks generated by the mining of No.8 coal seam will connect to the floor of No.2 + 3 and No.4 coal seams and also cause secondary disturbance to the overburden failure area of No.2 + 3 and No.4 coal seams.
Determining Key Stratum Damage Based on Microseismic Monitoring
The conditions to be met by the key stratum (Ju and Xu, 2015; Cheng et al., 2017): 1) compared with other strata, the thickness of the key stratum is thicker; 2) compared with other strata, the elastic modulus is large and the strength is high; 3) when the key stratum sinks and deforms, the subsidence deformation of all or part of the overlying strata is synchronous with it; and 4) the breaking of the key stratum leads to the breaking of all or part of the overlying strata, resulting in a large range of strata movement and deformation.
Layout of the Microseismic Monitoring System
The layout of the microseismic monitoring system for No.18401 Panel is shown in Figure 2. Five holes were arranged on both sides of the transportation and ventilation roadways respectively, and ten microseismic sensors were installed. One of the sensors is three-component, located in the middle of the side of the ventilation roadway, and the other sensors are single-component. The sensors on both sides are staggered. The sensor transmits the surrounding rock fracture signal in the mining process to the data acquisition instrument through cable, which then transmits it to the server on the ground through optical fiber for data processing and analysis. The sampling frequency of the data acquisition instrument is 60 kHz, 24-bit AD conversion, and GPS combined with optical fiber network synchronization to ensure time accuracy.
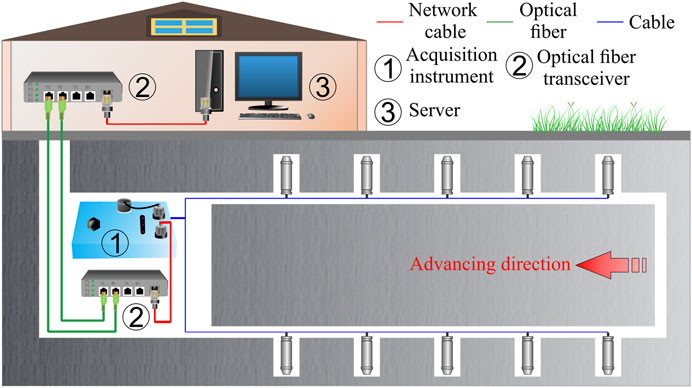
FIGURE 2. Sketch map of microseismic monitoring system in Xiqu Coal Mine.
Microseismic Monitoring Results
Mining of Panel No.18401 started on October 27, 2018, when it was advanced to about 88.2 m on November 30, the third periodic weighting came to the working face. According to the field measured data, the first weighting step is about 31.5 m, and the average periodic weighting step is 19.3 m. Therefore, the microseismic data monitored in November was selected as the research object, as shown in Figure 3.
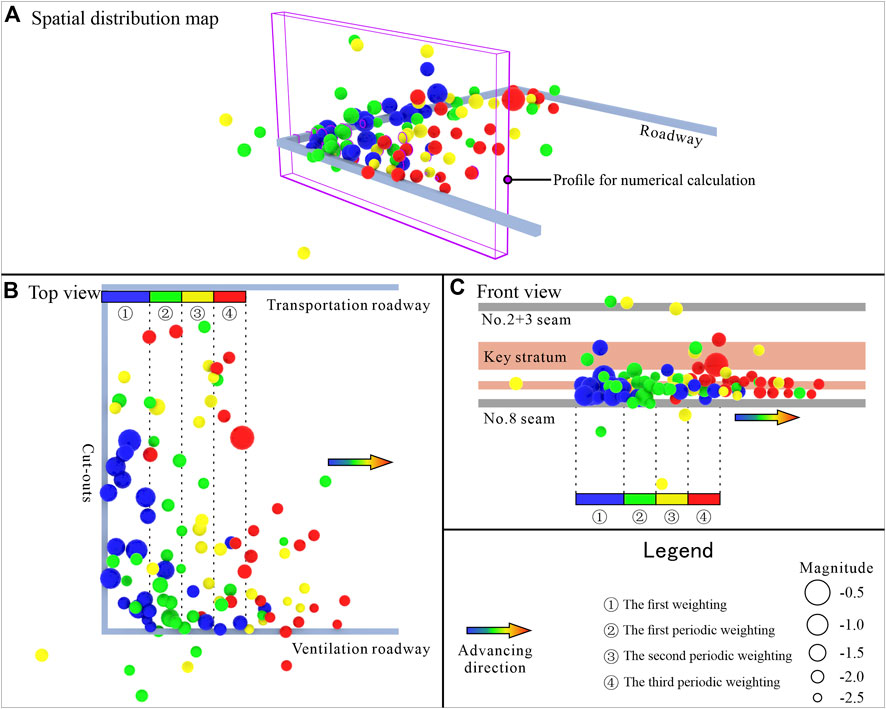
FIGURE 3. Distribution of microseismic events of the No. 18401 Panel.
Analysis along the coal seam strike direction of the working face shows that the microseismic events are mainly concentrated on the side of the ventilation roadway. This is related to the faults F10 and F2 on the side of the ventilation roadway. Analysis along the advancing direction of the working face shows that the microseismic activity area is about 50 m ahead of the working face. Analysis along the vertical direction shows that the microseismic events are mainly distributed in the coal seam roof below the primary key stratum between two coal seams because the primary key stratum inhibits the upward expansion of cracks. However, with the continuous advancement of the working face, the number of microseismic events in the primary key stratum and the overlying rock stratum increased. When advancing to about 88.2 m, a high-energy microseismic event occurred in the bottom region of the primary key stratum. The occurrence of high-energy events is generally a precursor of rock mass failure.
The expansion and connection of mining-induced cracks are the necessary conditions and precursory information for the fracture of rock strata and the formation of the water inrush channel. Zhao et al. (2020) proposed a novel method for inversing the water inrush channel based on microseismic-derived fractures. The prerequisite for forming the water inrush channel is that the derived fractures are interconnected. Therefore, this method and the moment tensor inversion theory are used to analyze the failure mechanism of the overlying rock strata. The failure type and direction of the source are shown in Figure 4. The rock mass fracture monitored by the microseismic system is mainly high-angle shear and tension. When the working face is advanced to 88.2 m (the third periodic weighting), for the primary key stratum between two coal seams, shear cracks develop on the open-off cut side, while tensile cracks appear on the working face side. Combined with the previous analysis of the high-energy microseismic events at the bottom of the primary key stratum between two coal seams, when the working face advances to 88.2 m, the primary key stratum between two coal seams exhibits partial failure.
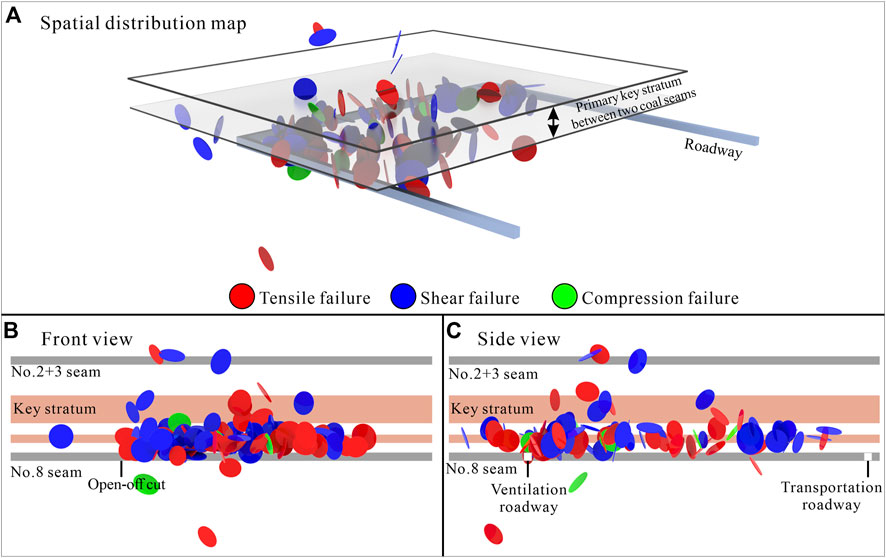
FIGURE 4. Distribution of fractures derived from microseismic data of No. 18401 Panel.
Calibration of Water Inrush Channel
Using numerical simulation and field monitoring to reveal the process of the channel connection is a hot spot in mine water disaster research. Field microseismic monitoring provides the measured information on rock mass damage and failure. Numerical simulation provides theoretical and technical support for analyzing rock mass damage. Therefore, the numerical model and field monitoring are organically combined such that the formation mechanism of the water inrush channel has both theoretical support and measured data verification. The core problem is how to quantitatively embed the microseismic monitoring data into the numerical calculation model. Microseismic activity is the external manifestation of damage and deterioration inside the rock mass (Cui et al., 2021). Therefore, embedding the microseismic data into the numerical calculation model through damage model is a feasible method to solve the aforementioned problems (Zhao et al., 2017).
Characterization Method of Water Inrush Channel Connection Process
Based on the existing FDM–DEM method (Zhang et al., 2018), this study identifies the deterioration law of rock mass mechanical parameters based on microseismic data. The modified mechanical parameters of rock masses are embedded into the numerical model to analyze the connection process of the water inrush channel. The method is implemented using the Universal Distinct Element Code (UDEC). The numerical model consists of blocks and joints (contacts). When building the numerical model, a certain number of random or custom joints are set up. After the block is divided into elements, a single joint will be automatically divided into multiple contacts according to the corners. This is called virtual contact, and the initial value of the strength parameter of virtual contact is significantly higher than that of the rock block element. The initial value of the strength parameter of virtual contact was set to 1000 MPa. In this study, the existing FDM–DEM method is developed by realizing the function of activating the adjacent joints after the failure element penetrates through the block. The activation joint in the original method is extended to the activation contact. The corresponding contact is found and activated through the corner of the failure element. It is assigned a lower strength parameter, and subsequently the progressive fracture of the rock stratum is realized. When using microseismic monitoring data to modify the numerical model, first, the scale and orientation of the mining-induced fracture are obtained based on the moment tensor inversion theory. Second, the density of secondary fractures (microseismic-derived fractures) in the rock mass is calculated, and the mechanical parameters of rock masses are modified according to the quantitative expression between secondary fracture density and rock mass damage. On this basis, the rock mechanics parameters modified by the microseismic data are embedded into the numerical calculation model. The specific process is shown in Figure 5.
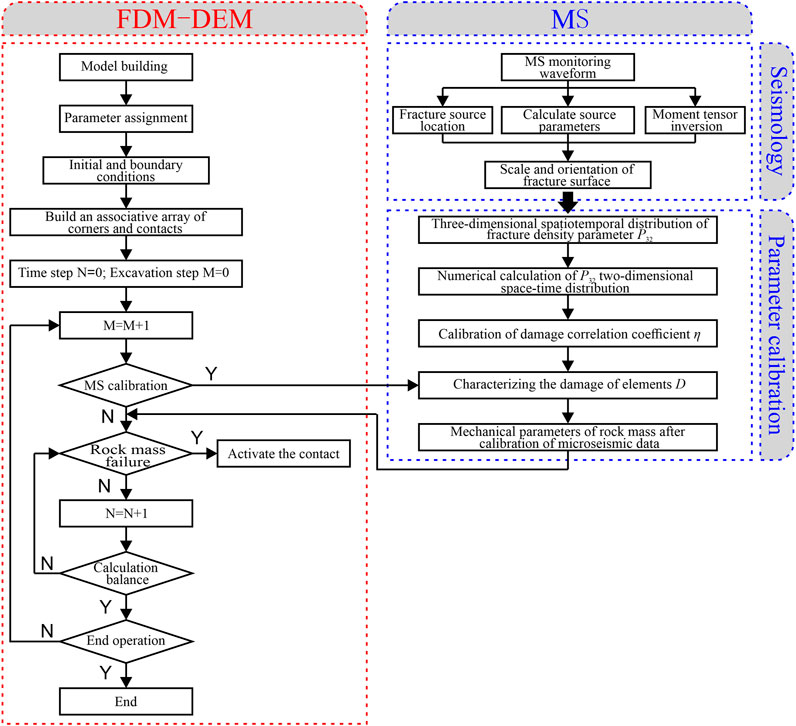
FIGURE 5. Characterization flow chart of water inrush channel formation process.
Mechanical Behavior of Blocks and Contacts
In this characterization method, the elastoplastic constitutive model is chosen to characterize the mechanical behavior of the block, and the adjacent contacts are activated according to the failure state of the element. The elastic–plastic block can not only reflect the stress path effect, shear dilatancy and strain characteristics in the deformation and failure process of engineering rock mass but also make up for the deficiency that the fracture position of rock mass depends on the preset joints to a certain extent. Therefore, an appropriate element failure criterion must be selected. Referring to relevant research (Jin et al., 2011), this study selects plastic strain to determine whether the element is damaged. When the plastic strain of the element reaches the critical value, the element is considered to be damaged, and then the virtual contact around the element is activated.
The tensile strength and cohesion of the virtual contact are set to large values. When the virtual contact is activated, the tensile strength and cohesion of the virtual contact are reduced, and the stiffness remains the same. At this time, the normal force deformation relationship of contact is described by the normal stiffness and tensile strength, which satisfies Eq. 4. The tangential force deformation relationship is described by the tangential stiffness and shear strength, which satisfy Eq. 5.
where
Rock Mass Damage Inversion and Mechanical Parameters Modified Based on Microseismic Data
Damage is an effective approach to establish a quantitative relationship between microseismic data and rock mass mechanics parameters. The damage of rock masses, that is, the deterioration law of mechanical parameters, can be characterized by the parameter of fracture density. Scholars (Schlotfeldt and Carter, 2018) summarized the quantitative description methods of fracture density parameters in different dimensions. Among them, P32 is the fracture area in the unit volume, which contains the frequency and size information of the fracture. P32 can characterize the transition from intact rock mass to fractured rock mass, which is a non-directional inherent measure of the degree of rock mass fracture (Rogers et al., 2015). In this study, the density P32 of the microseismic-derived fracture is used to characterize rock mass damage.
Transformation Method of Three-Dimensional P32 Data
The fracture density parameter P32 obtained based on the microseismic data is a three-dimensional spatial data. Before using P32 data to invert damage, P32 must be mapped to a two-dimensional numerical model. The position of the numerical calculation profile is determined by comprehensively considering factors, such as the spatial form of the water inrush channel in the mining rock mass and the spatial distribution of microseismic events. Using the direction along the X-axis, the local P32 3D data in the range of △LX are mapped to the 2D plane.
Rock Mass Damage Inversion
The mechanical parameters of rock mass decrease with the increase in the structural surface density. However, when the density of the structural surface increases to a certain extent, the mechanical parameters of rock mass gradually tend to a stable value. At present, there is still a lack of universal relationship between rock mass damage D and fracture density P32. D is generally believed to be directly proportional to P32 (Ni et al., 2017). Due to the difference between the secondary fracture density P32 obtained by microseismic monitoring and the actual secondary fracture density of the mining rock mass (Zhao et al., 2020), in this study, the correlation parameter η is introduced to characterize the effect of microseismic fracture density on rock mass damage. For the mining rock mass, the damage variable D = 1 is only the theoretical complete failure standard of the rock mass. When the rock mass loses its bearing capacity, the damage D does not reach one. Hence, there is a critical value of damage variable Dc for the rock mass failure. Based on this, the relationship between microseismic-derived fracture density P32 and damage variable D is established, as shown in Eq. 6. The variation curve of D with P32 is shown in Supplementary Figure S1.
When the damage inversion is based on microseismic data, Dc and η must be determined first. Scholars have carried out extensive research on the critical value of the damage variable Dc (Peng et al., 2014; Zhao et al., 2019; Liu et al., 2020), and the value is between 0.4 and 0.8. In this study, the value of Dc is 0.6. The correlation parameter η controls the evolution law of damage. It not only considers the conversion relationship between P32 and D but also considers the influence of the microseismic monitoring system on the recognition rate of rock mass real failure signal. The specific value can be determined by numerical simulation inversion.
Modification of Rock Mass Mechanics Parameters
The damage of rock mass will lead to the deterioration of elastic modulus and strength parameters. The difference of deterioration degree of mechanical parameters is not considered in this study. Hence, it is assumed that the elastic modulus, cohesion, and tensile strength obey the same damage deterioration law. When the time is t, the elastic modulus
where
Calibration of Roof Water Inrush Channel in No.18401 Panel
The water inrush channel of the roof of No.18401 Panel is calibrated according to the characterization method of the water inrush channel described previously. The rock mass REV size for calculating the microseismic-derived fracture density parameter P32 of No.18401 Panel is 10 × 10 m × rock stratum thickness. Figure 6 shows the spatial distribution of P32 at the time of the first weighting and each periodic weighting, which can intuitively display the evolution law of rock mass unit P32. The profile location used for subsequent numerical calculations is also given in the figure. Supplementary Figure S2 shows the statistical results of P32 during the study period.
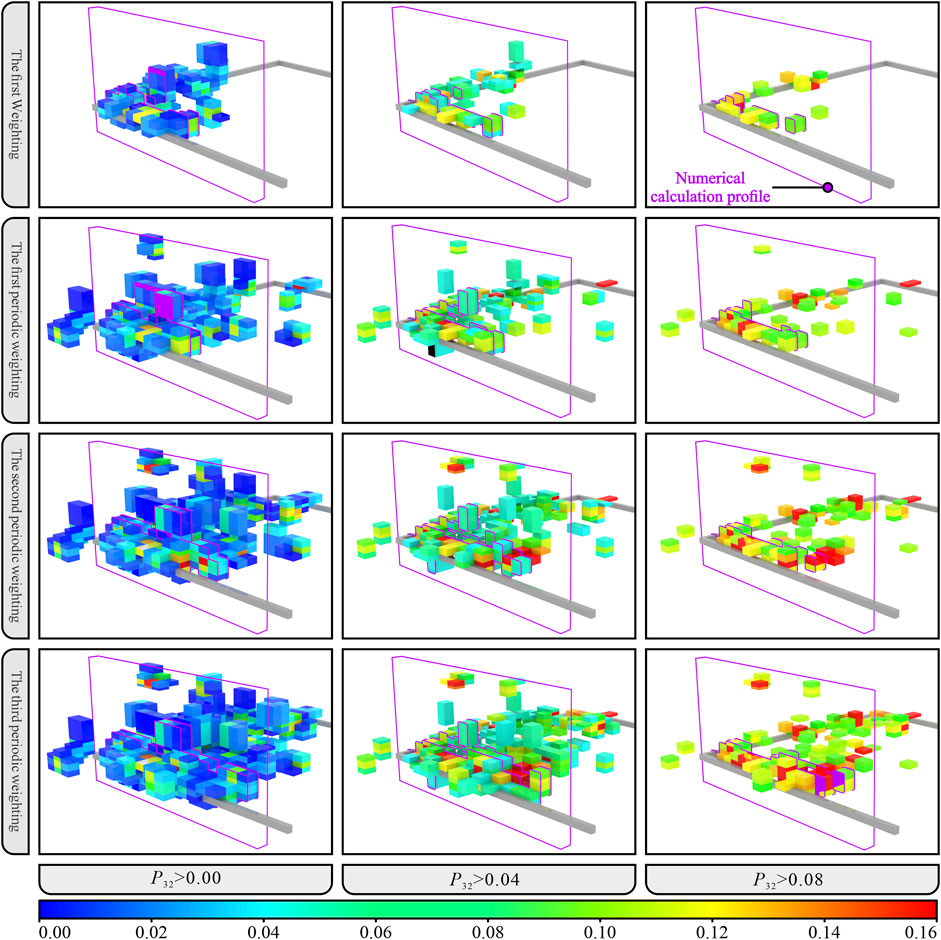
FIGURE 6. Spatial and temporal evolution of P32 in No. 18401 Panel.
The ZK1 borehole nearest to the study area is selected. A numerical calculation model is established according to the coal seam occurrence conditions and the overburden structure information revealed by the borehole (Figure 1). The model dimensions and boundary conditions are shown in Figure 7. The equivalent load of 2.4 MPa is applied to the top boundary of the model. The bottom boundary of the model is set as a vertical displacement constraint. Left and right boundaries are set as a horizontal displacement constraint. The simulated excavation of the No.8 coal seam is 5 m/step, with a total excavation of 150 m.
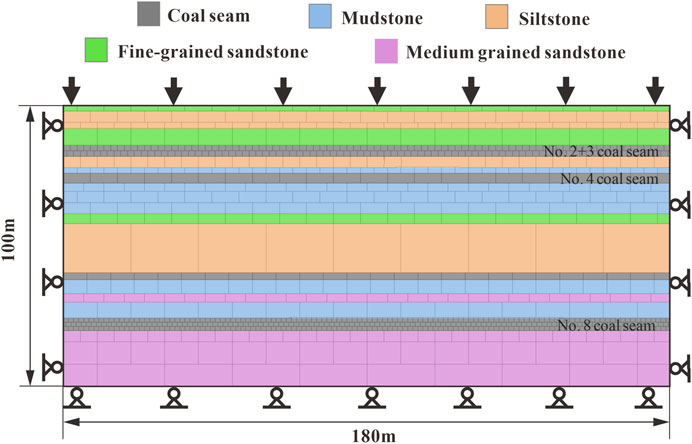
FIGURE 7. Numerical simulation model for No. 18401 Panel.
On the basis of the rock mechanic test, combined with the RQD obtained from the geological engineering survey and empirical formula, the mechanical parameters of the coal and rock mass are calculated and obtained (Table 1). On this basis, based on the first weighting step of No.18401 Panel, the damage correlation parameter η is determined as 17.71 by numerical simulation inversion. Then, according to Eqs 6–9, the damage value of mining rock mass and the modified mechanical parameters of rock mass are calculated and obtained. Supplementary Figure S3 shows the damage distribution of the numerical model at each typical time of the first weighting and the periodic weighting.
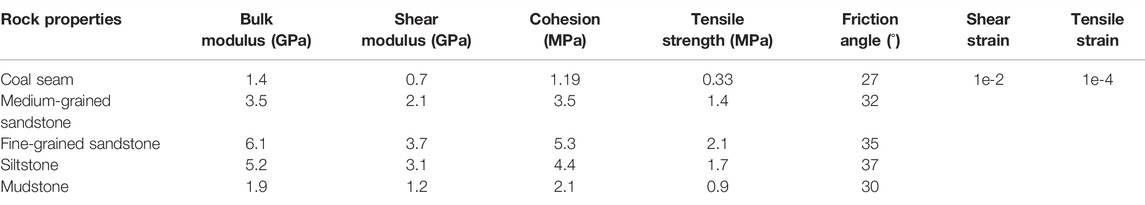
TABLE 1. Mechanical properties for No. 18401 Panel numerical model.
The distribution map of the overburden failure area and mining fracture of the No.8 coal seam under the influence of mining is obtained through numerical simulation calculation (Figure 8). Combined with the stratum damage area and mining fracture, the spatial form of the water inrush channel can be identified and obtained, which can be used for to analyze the seepage and water inrush process in the following.
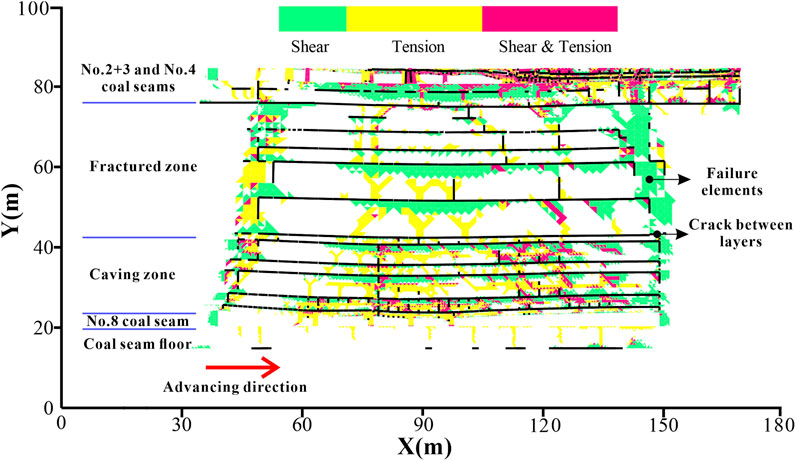
FIGURE 8. Distribution of failed zones in the roof of No.18401 Panel.
Numerical Simulation of Non-Darcy Seepage Water Inrush
Non-Darcy Seepage Model and Control Equation
For the water inrush problem in the water-conducting fractured zone of mines, Yang et al. (2021) established a numerical model integrating water inrush source Darcy flow, fracture zone Forchheimer high-speed flow, and roadway Navier–Stokes (N–S) turbulence. Adjacent flow fields satisfy the boundary conditions of continuous flow velocity and pressure.
Control Equation for Darcy Fluid in an Aquifer
When water flows slowly in aquifer, the driving force is mainly fluid pressure and the resistance is mainly viscous resistance, which can be characterized by Darcy law. Its motion equation and continuity equation can be expressed as:
where P is the fluid pressure; u is the fluid velocity; μw is the dynamic viscosity coefficient of the water flow; and kD is the permeability of the aquifer. In the non-steady state, the flow continuity equation is as follows:
where ρw is the water flow density; ϕ is the porosity; t is the time variable; and
Control Equation for Forchheimer Fluid in a Water Inrush Channel
The mixed fluid of broken rock mass is used to describe the non-Darcy seepage characteristics in the water-conducting fractured zone because the particle fluidization in the fracture zone impacts on the formation of the water inrush channel. The fluid is assumed to be incompressible in the unsteady state and is described by the following equation. The continuity equation of the mixed fluid is:
where ρ is the density of the mixed fluid; and ρf is the particles density of filler. The non-Darcy equation of motion is:
where μ is the dynamic viscosity coefficient of the mixed fluid; kF is the permeability of broken rock mass; and β is a non-Darcy factor. The concentration transfer equation of mixed fluid is:
where c is the concentration of movable fine particles in the mixed fluid. The porosity evolution equation is:
where ϕm is the maximum porosity of broken rock mass; and λ is the suffusion coefficient that represents the migration ability of fine particles. The dimension is the inverse of length, [λ] = L−1, which can be obtained by the experiment. The auxiliary equation is:
where kr is the coefficient related to the average particle size, and the dimension is L2; C is the dimensionless coefficient.
Control Equation for Navier–Stokes Fluid in a Roadway
The convection–dispersion equation is used to describe the convective deposition characteristics of the mixed fluid in the roadway. The diffusion effect is very weak compared to the convection effect because the mixed fluid flows at high speed in the roadway. The transport process of the mixed fluid in the roadway is expressed as:
where Kdep is the deposition coefficient. The N–S equation and the continuity equation of the motion of the passive incompressible mixed fluid can be expressed as:
where F is the fluid body force.
Boundary Conditions for Adjacent Flow Fields
On the interface of Darcy flow, Forchheimer flow, and N–S flow, the conditions of velocity continuity and pressure balance are satisfied at the same time. The volume concentration of fluidized particles at the interface between the water inrush channel and roadway needs to meet the continuity conditions. The adjacent boundary conditions between aquifer and water inrush channel are:
The adjacent boundary conditions of water inrush channel and roadway are:
where
Numerical Simulation Calculation of Non-Darcy Seepage
To study the non-Darcy seepage mechanism of groundwater in the whole process of water inrush occurrence and development in the roof water-conducting fracture zone of No.18401 Panel, based on the established non-Darcy seepage model of water inrush in the water-conducting fracture zone, FELAC software is used to simulate and analyze the water inrush. FELAC software is a finite element language and its compiler. Its design idea is to use the componentized programming method and artificial intelligence technology (He et al., 2017; Li et al., 2021). The weak solution integral forms of the Darcy, Forchheimer, and N–S equations were constructed by the principle of virtual displacement. Shi (2018) provides the details of the derivation of the weak form of the fluid mechanics equation, the discrete form of the equation, time discretization, iteration control, and other contents.
The failure of the rock mass unit and the separation fracture in Figure 8 are recognized based on the image recognition program(Li et al., 2021; Li et al., 2022), and the generalized diagram of the roof water inrush channel of No.18401 Panel is determined. The longitudinal and transverse fractures in the rock stratum intersect to form a water-conducting fractured network, as shown in Figure 9. Among them, the rock stratum below the primary key stratum between two coal seams are caving zones, and the primary key stratum between two coal seams and the above rock stratum are fracture zones. The transverse water inrush channel is determined according to the spatial distribution of crack between layers. The longitudinal water inrush channel is determined according to the spatial distribution of the failure area of the rock mass unit. The size and shape of the water inrush channel are adjusted and determined in combination with the characteristics of the water inrush channel revealed by the existing research.
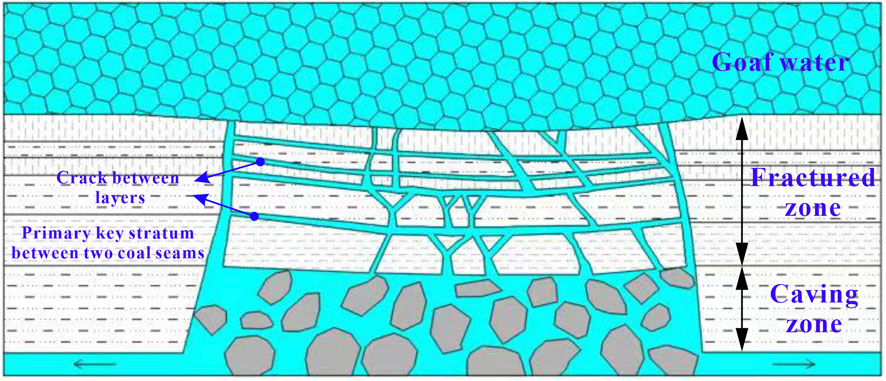
FIGURE 9. Diagram of water inrush from the superjacent goaf of No. 18401 Panel.
According to Figure 9, the numerical calculation model of water inrush seepage in the water-conducting fracture zone was established. The model consists of the aquifer in the upper goaf, the middle water-conducting fractured zone, and the roadway in the lower No. 8 coal seam, as shown in Figure 10.
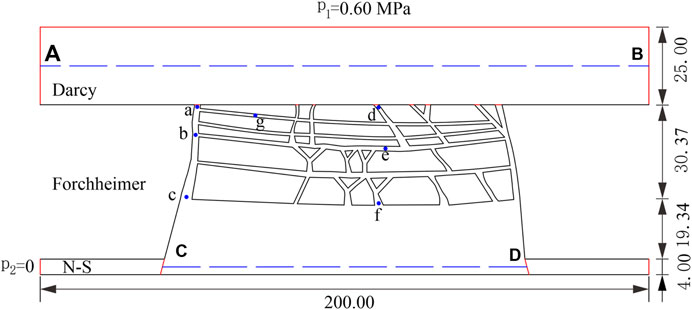
FIGURE 10. Numerical model of water inrush in No. 18401 Panel.
According to the hydrologic conditions of the study area, a fixed water pressure of 0.6 MPa was applied to the top, left, and right boundaries of the goaf, which was equivalent to the hydrostatic pressure of the water-logged goaf. The boundary at the roadway exit was a fixed water pressure boundary, and the relative pressure was zero. The remainder of the outer boundaries was water-retaining boundaries. To monitor the dynamic change process of parameters such as fluid pressure, flow velocity, and porosity, a monitoring line AB and CD were set at the center line of goaf and roadway, respectively. Seven monitoring points a, b, c, d, e, f, and g were set at the typical position of the water-conducting fractured zone. The hydrodynamic calculation parameters used in the simulation are shown in Table 2.
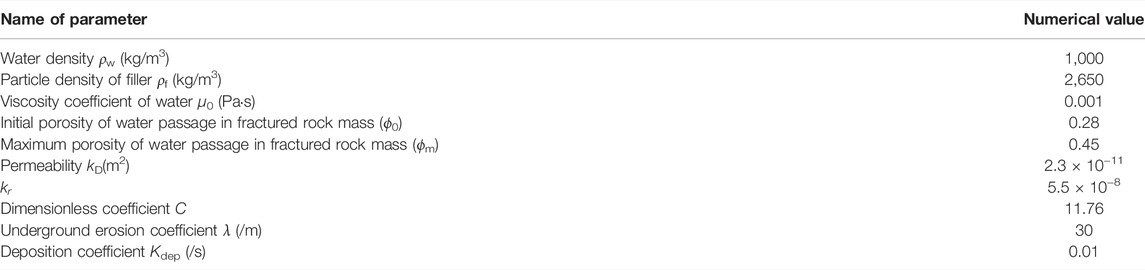
TABLE 2. Hydrodynamic parameters employed for numerical calculations.
Analysis of Numerical Simulation Results
Evolution Law of Pressure
Supplementary Figure S4 shows the cloud chart of the fluid pressure spatiotemporal evolution during the whole process of water inrush. From the top goaf to the middle water-conducting fractured zone to the lower roadway, the pressure shows a trend of continuous change and gradual decrease. The area with the most obvious changes in fluid pressure is the junction between the top water goaf and the water-conducting fractured zone.
Figure 11 shows the pressure change curve at measuring line AB and the monitoring points. The fluid pressure at the center line of the goaf presents a “funnel-like” distribution. The fluid pressure drop is evident at the point of contact with the water-conducting fracture. Multiple local extreme points appear on the pressure curve of line AB. At time t = 200 s, the fluid pressure in the goaf enters the stage of slow change. For the water-conducting fractured zone, although affected by the complex geometric structure of the water-conducting fissures, there is a slight difference in the fluid pressure at the same level (measurement points a and d). However, macroscopically, the closer to the goaf, the greater the fluid pressure (measurement points a, b, and c). The closer to the caving zone, the less evident the change in the fluid pressure (measuring points e and f). In terms of time, before t = 200 s, the pressure changes at each monitoring point are evident, and then enter the slow change stage. From 200 to 800 s, the fluid pressure change at each monitoring point is only about 0.02 MPa, such that the pressure cloud chart after 200 s fails to fully show the change of pressure. From the point of view of water pressure monitoring, the change of fluid pressure at the water inlet of the water conduction–fractured zone must be monitored to predict water damage in the roof goaf.
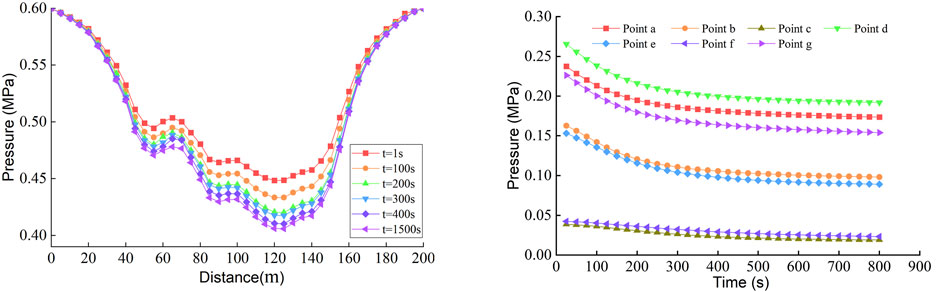
FIGURE 11. Pressure evolution at the measuring line and typical positions.
Evolution Law of Flow Velocity
Supplementary Figure S5 is the cloud chart of the flow velocity spatiotemporal evolution during the whole process of the water inrush. Figure 12 shows the flow velocity change curve at the monitoring points. On the whole, the fluid flow velocity in each flow area changes dynamically and continuously. For the goaf, the flow velocity of the fluid is at a low level as a whole, and the change of velocity is small. For the water-conducting fracture zone, the flow velocity presents a non-uniform distribution due to the difference in the fracture opening. Several flow velocity extremum points appear in narrow water-conducting fractures, but the main channel of fluid is still located on the side of the open-off cut and the working face, which is consistent with the existing research results (Cao et al., 2019). For the fracture between strata, the flow velocity at measuring point g is only 0.0022 m/s, while that at measuring point e is 0.014 m/s, and the difference between the two monitoring points is about a factor of six. The flow velocity distribution of the fracture between strata presents a strong non-uniformity. A few fractures between strata, (such as measurement point e) serve as water flow channels to supply adjacent vertical dominant water-conducting fractures, while most the fracture between strata (such as measurement point g) have no evident fluid flow. Therefore, the flow velocity in the fracture between strata is controlled by the geometric space shape of adjacent vertical fractures.
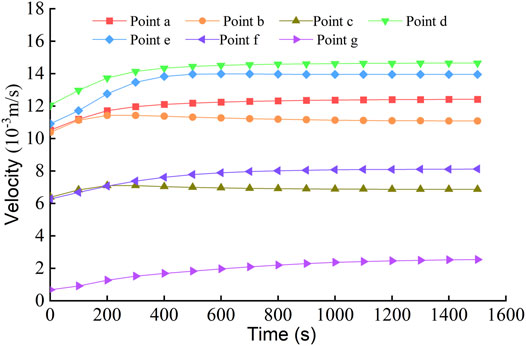
FIGURE 12. Flow velocity evolution at typical positions.
Evolution Law of Porosity
Supplementary Figure S6 shows the spatiotemporal evolution cloud chart of porosity in the water-conducting fracture zone during the whole process of water inrush. The figure shows that the change of porosity is non-uniform. The porosity in the “dominant channel” increases rapidly and changes preferentially. However, the porosity in the fracture between strata (non-dominant channel) increases slowly and relatively lags behind.
Figure 13 shows the porosity change curve at the measuring line CD and the monitoring points. The porosity increases continuously during the occurrence and development of water inrush, which is a necessary condition for the water-conducting fracture zone to act as a water inrush channel to induce water inrush. At the same time, the change of porosity and flow velocity in the water-conducting fracture zone is an interactive positive feedback process. Under the action of erosion, ore, and rock in the fracture is granulated and flows into the roadway space with the water flow. The loss of particles leads to the decrease of mixed fluid resistance and the flow velocity increase. Subsequently, if more particles are removed the porosity increases. Therefore, in the initial underground water inrush accident stage, the fluid is in a turbid state. According to this characteristic, the occurrence of water inrush can be predicted by monitoring the change of fluid concentration. From the perspective of time, when t = 200 s, the porosity in the “dominant channel” of the water-conducting fracture zone reaches the set maximum value and does not change anymore. When t = 600 s, the porosity at measuring point g in the “non-dominant channel” tends to be stable. The change in porosity also lags behind the “dominant channel.” When t = 800 s, the porosity in the caving zone tends to be stable.
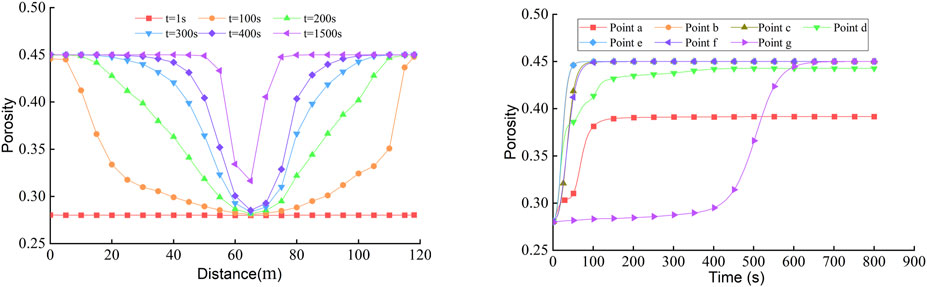
FIGURE 13. Porosity evolution at measuring line and typical positions.
Discussion
In this study, the calibration of the water inrush channel in the coal mine roof and its water inrush characteristics were studied. A method combining numerical calculation and field microseismic monitoring was used to calibrate the water inrush channel. On the basis of the FDM–DEM method, the rock mass mechanical parameters are modified based on the microseismic data and embedded into the numerical model to analyze the connection process of the water inrush channel. Although the size and shape of the water inrush channel are adjusted and determined in combination with the characteristics of the water inrush channel revealed by existing research (Poulsen et al., 2018), this calibration method has both theoretical support and measured data verification. Compared with previous studies (Yang et al., 2021), the accuracy of the water inrush channel calibration is significantly improved. It solves the shortcomings of the oversimplification of the water inrush model and the lack of calibration of the measured data for the spatial distribution of the water inrush channel. At the same time, the characteristics of water inrush in the roof water-conducting fracture zone are studied, which enriches the understanding of underground water inrush. This has important guiding significance for predicting and preventing mine water inrush.
The accuracy of the microseismic sensor has a great influence on the calibration results of the water inrush channel. When the microseismic data is embedded in the numerical calculation, the location accuracy of microseismic events should be meeting the research needs. The arrangement of the microseismic sensor is limited by the underground construction conditions and operating space, and the location effect is affected by the occurrence conditions of the mining rock mass and the distribution shape of the mined-out areas. Therefore, there is a certain error in the location effect of microseismic events. High-quality location of microseismic events can be achieved by using high-precision sensors, optimizing layout, and sensor consistency correction. The formation of the water inrush channel is a complex process of rock failure and instability, which is affected by numerous factors, such as mining stress and water pressure. Based on the two-dimensional numerical calculation platform, this study analyzed the seepage law in the whole process of water inrush on the basis of calibrating the water inrush channel without considering the seepage-stress coupling effect in the formation of the water inrush channel. Therefore, following research can use the 3D numerical calculation platform to calibrate the water inrush channel and study the failure process of the mining rock mass under the coupling effect of seepage and stress.
Conclusion
For the water inrush of the coal mine roof, with No.18401 Panel of Xiqu Coal Mine as the case study, we investigated the calibration of the roof water inrush channel and its water inrush characteristics. The following main conclusions are drawn:
1) Using drilling data and theoretical calculation, the thickness of the coal seam, distance between coal seams, the height of the fractured and caving zones in the study area are determined as 4.17, 49.71, 30.37, and 19.34 m, respectively. This lays a foundation for the establishment of the numerical calculation model. Next, based on the microseismic monitoring method, the damage of the key stratum is determined and verified whether the water-conducting fractured zone is connected. When the working face is advanced to about 88.2 m, the primary key stratum is destroyed, and the water inrush channel is connected.
2) In this study, numerical calculation and field microseismic monitoring are organically combined to analyze the connection process of the roof water inrush channel. Based on the existing FDM–DEM method, the deterioration law of rock mass mechanical parameters is identified based on microseismic data. Based on the existing FDM–DEM method, this method identifies the deterioration law of rock mass mechanical parameters based on microseismic data and embeds the modified rock mass mechanical parameters into the UDEC numerical model. This method calibrates the roof water inrush channel of No.18401 Panel. The advantage of this method is that it has both theoretical support and measured data verification.
3) Based on the numerical model integrating water inrush source Darcy flow, fractured zone Forchheimer high-speed flow, and roadway Navier–Stokes turbulence, the non-Darcy seepage numerical simulation analysis of water inrush in roof water-conducting fractured zone of No.18401 Panel was carried out using FELAC software. The results show that the pressure, flow velocity, and porosity in the water-conducting fracture zone are non-uniformly distributed in water inrush occurrence and development. The mixed fluid mainly flows through the “dominant channel” in the water-conducting fractured zone, and the water flow in non-dominant channels such as fractures between strata is small or even does not flow. The occurrence and development of underground water inrush are accompanied by the release of the hydrostatic pressure of the aquifer, the sudden increase of flow velocity at the water inrush point and the increase of fluid concentration. Therefore, the underground water inrush can be predicted by monitoring the aforementioned indicators.
Data Availability Statement
The original contributions presented in the study are included in the article/Supplementary Material; further inquiries can be directed to the corresponding authors.
Author Contributions
TY, DS, and XH conceived and designed the study. DS wrote the first draft of the manuscript. DS, XH, and BY carried out numerical simulation analysis of the water inrush. YZ and PZ analyzed the microseismic data. YL and KM conducted mine data collection. All authors contributed to manuscript revision and read and approved the submitted version.
Funding
This study was financially supported by the National Natural Science Foundation of China (U1903216, U1710253, and 52004052), supported by “the Fundamental Research Funds for the Central Universities” (N2201003 and N2101027).
Conflict of Interest
The authors declare that the research was conducted in the absence of any commercial or financial relationships that could be construed as a potential conflict of interest.
Publisher’s Note
All claims expressed in this article are solely those of the authors and do not necessarily represent those of their affiliated organizations, or those of the publisher, the editors, and the reviewers. Any product that may be evaluated in this article, or claim that may be made by its manufacturer, is not guaranteed or endorsed by the publisher.
Supplementary Material
The Supplementary Material for this article can be found online at: https://www.frontiersin.org/articles/10.3389/feart.2022.931508/full#supplementary-material
References
Cai, M., and Kaiser, P. K. (2005). Assessment of Excavation Damaged Zone Using a Micromechanics Model. Tunn. Undergr. Space Technol. 20 (4), 301–310. doi:10.1016/j.tust.2004.12.002
Cai, M., Kaiser, P. K., and Martin, C. D. (2001). Quantification of Rock Mass Damage in Underground Excavations from Microseismic Event Monitoring. Int. J. Rock Mech. Min. Sci. 38 (8), 1135–1145. doi:10.1016/S1365-1609(01)00068-5
Cao, Z., Ju, J., and Xu, J. (2019). Distribution Model of Water-Conducted Fracture Main Channel and its Flow Characteristics. J. China Coal Soc. 44 (12), 3719–3728. doi:10.13225/j.cnki.jccs.SH19.0446
Chen, L., Li, T., Wang, G., Wu, X., Jiang, Y., and Han, Z. (2014). Crack Expansion Judgment Method in Overlying Strata and its Application for Coal Mining under Aquifers. J. China Coal Soc. 39 (S2), 301–307. doi:10.13225/j.cnki.jccs.2013.1832
Cheng, G., Ma, T., Tang, C., Liu, H., and Wang, S. (2017). A Zoning Model for Coal Mining - Induced Strata Movement Based on Microseismic Monitoring. Int. J. Rock Mech. Min. Sci. 94, 123–138. doi:10.1016/j.ijrmms.2017.03.001
Cherubini, C., Giasi, C. I., and Pastore, N. (2012). Bench Scale Laboratory Tests to Analyze Non-linear Flow in Fractured Media. Hydrol. Earth Syst. Sci. 9 (4), 2511–2522. doi:10.5194/hess-16-2511-2012
Cui, S., Pei, X., Jiang, Y., Wang, G., Fan, X., Yang, Q., et al. (2021). Liquefaction within a Bedding Fault: Understanding the Initiation and Movement of the Daguangbao Landslide Triggered by the 2008 Wenchuan Earthquake (Ms = 8.0). Eng. Geol. 295, 106455. doi:10.1016/j.enggeo.2021.106455
Gao, M. Z., Zhang, R., Xie, J., Peng, G. Y., Yu, B., and Ranjith, P. G. (2018). Field Experiments on Fracture Evolution and Correlations between Connectivity and Abutment Pressure under Top Coal Caving Conditions. Int. J. Rock Mech. Min. Sci. 111, 84–93. doi:10.1016/j.ijrmms.2018.01.003
He, Y., and Kusiak, A. (2018). Performance Assessment of Wind Turbines: Data-Derived Quantitative Metrics. IEEE Trans. Sustain. Energy 9 (1), 65–73. doi:10.1109/TSTE.2017.2715061
Hou, X., Yang, T., Li, Z., Sun, Y., and Jin, Y. (2020). Types and Main Characteristics of Old Goaf Water Disaster in Shanxi Province. J. Min. Saf. Eng. 37 (05), 1009–1018. doi:10.13545/j.cnki.jmse.2020.05.018
Jiang, F., Ye, G., Wang, C., Zhang, D., and Guan, Y. (2008). Application of High-Precision Microseismic Monitoring Technique to Water Inrush Monitoring in Coal Mine. Chin. J. Rock. Mech. Eng. 27 (09), 1932–1938. doi:10.3321/j.issn:1000-6915.2008.09.023
Jin, F., Hu, W., Zhang, C., and Wang, J. (2011). A Fracture Simulation Using 3-D Mode Distinct Element Method (3MDEM) with Elastoplastic Constitutive Method. Eng. Mech. 28 (05), 1–7.
Ju, J., and Xu, J. (2015). Surface Stepped Subsidence Related to Top-Coal Caving Longwall Mining of Extremely Thick Coal Seam under Shallow Cover. Int. J. Rock Mech. Min. Sci. 78, 27–35. doi:10.1016/j.ijrmms.2015.05.003
Ju, Y., Wang, Y., Su, C., Zhang, D., and Ren, Z. (2019). Numerical Analysis of the Dynamic Evolution of Mining-Induced Stresses and Fractures in Multilayered Rock Strata Using Continuum-Based Discrete Element Methods. Int. J. Rock Mech. Min. Sci. 113, 191–210. doi:10.1016/j.ijrmms.2018.11.014
Kohl, T., Evans, K. F., Hopkirk, R. J., Jung, R., and Rybach, L. (1997). Observation and Simulation of Non-darcian Flow Transients in Fractured Rock. Water Resour. Res. 33 (3), 407–418. doi:10.1029/96WR03495
Li, H., Deng, J., Feng, P., Pu, C., Arachchige, D. D. K., and Cheng, Q. (2021a). Short-Term Nacelle Orientation Forecasting Using Bilinear Transformation and ICEEMDAN Framework. Front. Energy Res. 9, 780928. doi:10.3389/fenrg.2021.780928
Li, H., Deng, J., Yuan, S., Feng, P., and Arachchige, D. D. K. (2021b). Monitoring and Identifying Wind Turbine Generator Bearing Faults Using Deep Belief Network and EWMA Control Charts. Front. Energy Res. 9, 799039. doi:10.3389/fenrg.2021.799039
Li, H., He, Y., Xu, Q., Deng, j., Li, W., and Wei, Y. (2022). Detection and Segmentation of Loess Landslides via Satellite Images: a Two-phase Framework. Landslides 19, 673–686. doi:10.1007/s10346-021-01789-0
Li, X., and Cui, T. (2019). Supportability Analysis of Sustainable Development for Coal Resources in China. China coal. 45 (01), 33–37. doi:10.19880/j.cnki.ccm.2019.01.005
Lisjak, A., Figi, D., and Grasselli, G. (2014). Fracture Development Around Deep Underground Excavations: Insights from FDEM Modelling. J. Rock Mech. Geotechnical Eng. 6 (6), 493–505. doi:10.1016/j.jrmge.2014.09.003
Liu, F., Yang, T., Zhou, J., Deng, W., Yu, Q., Zhang, P., et al. (2020). Spatial Variability and Time Decay of Rock Mass Mechanical Parameters: A Landslide Study in the Dagushan Open-Pit Mine. Rock Mech. Rock Eng. 53, 3031–3053. doi:10.1007/s00603-020-02109-z
Lu, Y., and Wang, L. (2015). Numerical Simulation of Mining-Induced Fracture Evolution and Water Flow in Coal Seam Floor above a Confined Aquifer. Comput. Geotechnics 67, 157–171. doi:10.1016/j.compgeo.2015.03.007
Ma, D., Wang, J., and Li, Z. (2019). Effect of Particle Erosion on Mining-Induced Water Inrush Hazard of Karst Collapse Pillar. Environ. Sci. Pollut. Res. 26 (19), 19719–19728. doi:10.1007/s11356-019-05311-x
Ma, K., and Liu, G. (2022). Three-dimensional Discontinuous Deformation Analysis of Failure Mechanisms and Movement Characteristics of Slope Rockfalls. Rock Mech. Rock Eng. 55, 275–296. doi:10.1007/s00603-021-02656-z
Ni, P., Wang, S., Wang, C., and Zhang, S. (2017). Estimation of Rev Size for Fractured Rock Mass Based on Damage Coefficient. Rock Mech. Rock Eng. 50 (3), 555–570. doi:10.1007/s00603-016-1122-x
Peng, R., Ju, Y., Wang, J. G., Xie, H., Gao, F., and Mao, L. (2014). Energy Dissipation and Release during Coal Failure under Conventional Triaxial Compression. Rock Mech. Rock Eng. 48 (2), 509–526. doi:10.1007/s00603-014-0602-0
Poulsen, B. A., Adhikary, D., and Guo, H. (2018). Simulating Mining-Induced Strata Permeability Changes. Eng. Geol. 237, 208–216. doi:10.1016/j.enggeo.2018.03.001
Rogers, S., Elmo, D., Webb, G., and Catalan, A. (2015). Volumetric Fracture Intensity Measurement for Improved Rock Mass Characterisation and Fragmentation Assessment in Block Caving Operations. Rock Mech. Rock Eng. 48, 633–649. doi:10.1007/s00603-014-0592-y
Schlotfeldt, P., and Carter, T. G. (2018). A New and Unified Approach to Improved Scalability and Volumetric Fracture Intensity Quantification for GSI and Rockmass Strength and Deformability Estimation. Int. J. Rock Mech. Min. Sci. 110, 48–67. doi:10.1016/j.ijrmms.2018.06.021
Shi, W. (2018). A Non-darcy Flow Model for Water Inrush through Broken Rock Mass and its Engineering Application. Shenyang, IL: Northeastern University. [PhD Thesis].
Shi, W., Yang, T., Liu, H., Yang, B., Yang, X., and Zhou, Y. (2016). Non-Darcy Flow Model and Numerical Simulation for Water-Inrush in Fractured Rock Mass. Chin. J. Rock Mech. Eng. 35 (3), 446–455. doi:10.13722/j.cnki.jrme.2015.0389
Xu, Z., Sun, Y., Gong, S., and Zhu, Z. (2012). Monitoring and Numerical Simulation of Formation of Water Inrush Pathway Caused by Coal Mining above Confined Water with High Pressure. Chin. J. Rock Mech. Eng. 31 (08), 1698–1704.
Yang, B., Yang, T., and Hu, J. (2021). Numerical Simulation of Non-darcy Flow Caused by Cross-Fracture Water Inrush, Considering Particle Loss. Mine Water Environ. 40 (2), 466–478. doi:10.1007/s10230-021-00762-6
Yang, T., Chen, S., Zhu, W., Meng, Z., and Gao, Y. (2008). Water Inrush Mechanism in Mines and Nonlinear Flow Model for Fracture Rocks. Chin. J. Rock Mech. Eng. 27 (7), 1411–1416. doi:10.3321/j.issn:1000-6915.2008.07.014
Yang, T., Tang, C., Tan, Z., Zhu, W., and Feng, Q. (2007). State of the Art of Inrush Models in Rock Mass Failure and Developing Trend for Prediction and Forecast of Groundwater Inrush. Chin. J. Rock Mech. Eng. 26 (2), 268–277. doi:10.3321/j.issn:1000-6915.2007.02.007
Yang, T., Zheng, C., Zhang, P., Yu, Q., Liu, H., Nan, S., et al. (2013). Research on Dynamic Calibration Method of Rock Mass Strength of Mine Based on Microseismic Monitoring. J. Min. Saf. Eng. 30 (04), 548–554.
Yang, T., Zhu, W., Yu, Q., and Liu, H. (2011). The Role of Pore Pressure during Hydraulic Fracturing and Implications for Groundwater Outbursts in Mining and Tunnelling. Hydrogeol. J. 19 (5), 995–1008. doi:10.1007/s10040-011-0731-4
Zhang, H. (2019). Analysis on the Present Situation of Coal Mining Technology in China. Mod. Chem. Res. 10, 7–8. doi:10.3969/j.issn.1672-8114.2019.10.004
Zhang, K., Yang, T., Bai, H., and Pathegama Gamage, R. (2018). Longwall Mining-Induced Damage and Fractures: Field Measurements and Simulation Using FDM and DEM Coupled Method. Int. J. Geomech. 18 (1), 04017127. doi:10.1061/(ASCE)GM.1943-5622.0001040
Zhang, P., Yang, T., Yu, Q., Xu, T., Shi, W., and Li, S. (2016). Study of a Seepage Channel Formation Using the Combination of Microseismic Monitoring Technique and Numerical Method in Zhangmatun Iron Mine. Rock Mech. Rock Eng. 49 (9), 3699–3708. doi:10.1007/s00603-016-1007-z
Zhao, Y., Yang, T., Liu, H., Wang, S., Zhang, P., Jia, P., et al. (2021). A Path for Evaluating the Mechanical Response of Rock Masses Based on Deep Mining-Induced Microseismic Data: A Case Study. Tunn. Undergr. Space Technol. 115, 104025–104119. doi:10.1016/j.tust.2021.104025
Zhao, Y., Yang, T., Yu, Q., and Zhang, P. (2019). Dynamic Reduction of Rock Mass Mechanical Parameters Based on Numerical Simulation and Microseismic Data - A Case Study. Tunn. Undergr. Space Technol. 83, 437–451. doi:10.1016/j.tust.2018.09.018
Zhao, Y., Yang, T., Zhang, P., Xu, H., and Wang, S. (2020). Inversion of Seepage Channels Based on Mining-Induced Microseismic Data. Int. J. Rock Mech. Min. Sci. 126, 104180. doi:10.1016/j.ijrmms.2019.104180
Zhao, Y., Yang, T., Zhang, P., Zhou, J., Yu, Q., and Deng, W. (2017). The Analysis of Rock Damage Process Based on the Microseismic Monitoring and Numerical Simulations. Tunn. Undergr. Space Technol. 69, 1–17. doi:10.1016/j.tust.2017.06.002
Zhou, J.-Q., Hu, S.-H., Fang, S., Chen, Y.-F., and Zhou, C.-B. (2015). Nonlinear Flow Behavior at Low Reynolds Numbers through Rough-Walled Fractures Subjected to Normal Compressive Loading. Int. J. Rock Mech. Min. Sci. 80, 202–218. doi:10.1016/j.ijrmms.2015.09.027
Zhou, J.-R., Yang, T.-H., Zhang, P.-H., Xu, T., and Wei, J. (2017). Formation Process and Mechanism of Seepage Channels Around Grout Curtain from Microseismic Monitoring: A Case Study of Zhangmatun Iron Mine, China. Eng. Geol. 226, 301–315. doi:10.1016/j.enggeo.2017.07.002
Keywords: water-conducting fractured zone, water inrush, non-Darcy flow, numerical simulation, microseismic monitoring
Citation: Sun D, Hou X, Yang T, Zhao Y, Zhang P, Yang B, Liu Y and Ma K (2022) Calibration of Water Inrush Channel and Numerical Simulation of Water Inrush Process in Coal Mine Roof. Front. Earth Sci. 10:931508. doi: 10.3389/feart.2022.931508
Received: 29 April 2022; Accepted: 25 May 2022;
Published: 06 July 2022.
Edited by:
Huajin Li, Chengdu University, ChinaReviewed by:
Ang Li, Chang’an University, ChinaWu Cai, China University of Mining and Technology, China
Copyright © 2022 Sun, Hou, Yang, Zhao, Zhang, Yang, Liu and Ma. This is an open-access article distributed under the terms of the Creative Commons Attribution License (CC BY). The use, distribution or reproduction in other forums is permitted, provided the original author(s) and the copyright owner(s) are credited and that the original publication in this journal is cited, in accordance with accepted academic practice. No use, distribution or reproduction is permitted which does not comply with these terms.
*Correspondence: Xiangang Hou, eGlhbmdhbmdob3VAMTI2LmNvbQ==; Tianhong Yang, eWFuZ3RpYW5ob25nQG1haWwubmV1LmVkdS5jbg==