 Xiuying Liu
 Xiao Li1
 Baolin Pan
- 1College of Resource Environment and Tourism, Capital Normal University, Beijing, China
- 2Key Laboratory of Tourism and Resources Environment in Universities of Shandong, Taishan University, Tai’an, China
Alluvial fan deposits are identified as evidence of regional climatic variations and tectonic events; therefore, it is crucial to establish absolute time series by dating alluvial fan deposits. Limited exposure to light poses a challenge to accurately estimating the buried ages for alluvial deposits with optically stimulated luminescence (OSL). This challenge has been positively developed by controlling the number of grains on each disk to measure and choosing suitable statistical models for the equivalence dose (De) distribution to analyze. In this research, three modern alluvial samples and one modern loess-like sample were collected from the Dashuigou alluvial fan of Helan Mountain, China. The De distributions of these four samples were studied by the application of small aliquots (1-, 3-, and 5-mm aliquots) of quartz OSL with the average dose model, central age model, unlogged minimum age model (MAM), lowest 5%, internal/external consistency criterion minimum age model (IEU), and finite mixture model. It is concluded that an overestimation of De lower than 1 Gy can be obtained using quartz OSL dating of 1-mm aliquots (∼50 grains) with MAM and IEU for the alluvial sediments. The lowest 5% method may underestimate the De values of the 1-mm aliquots for young samples. This research makes the dose dependency of aliquot sizes and age models more definite and opens up the possibility of dating paleoalluvial deposits to establish a chronological framework to decipher the implications of paleoclimates and tectonics.
Introduction
Alluvial fans are depositional landforms that form in areas where steep high-power channels enter a zone of reduced stream power (Goudie, 2004). It is associated with rapid and short-term flood sedimentation, which sometimes results in natural disasters (Fiorillo and Wilson, 2004; Tang et al., 2012). In addition, alluvial fans are closely related to tectonic activities (Yang et al., 1985; Han, 1992; Hou and Han, 1995; Cui et al., 2007) and climate changes (Ritter et al., 1995; Cui, 1999). To research the historic process of delivering sediment to an alluvial fan (by debris flows or fluvial processes, Goudie, 2004), dating depositional events is particularly important.
Over the last 2 decades, optically stimulated luminescence (OSL) has been increasingly applied for dating alluvial deposits, including debris flow deposits and flash flood deposits (Jain et al., 2004; Rittenour, 2008; Fuchs et al., 2010; Kenworthy et al., 2014; Sewell et al., 2015; Zhao et al., 2015, 2017; Palstra et al., 2021). However, the applicability of OSL dating from alluvial deposits remains uncertain, especially because incomplete resetting is known as one of the major problems (Olley et al., 1998; Fuchs and Lang, 2001; Stokes et al., 2001). Thus, there would be a significant dose overestimation in the determination of the equivalent dose (De) of alluvial sediments. To reduce the effects related to incomplete bleaching, there are a number of studies on the factors associated with De, including mineral types (Wallinga et al., 2001; Fiebig and Preusser, 2007), grain sizes (Olley et al., 1998; Hu et al., 2010), transport distance (Stokes et al., 2001; Rodnight et al., 2006), measurement procedures (Wintle, 1997; Wallinga, 2002), aliquot sizes (Duller, 2008), and statistical methods (age models) (Galbraith and Roberts, 2012; Medialdea et al., 2014) in OSL measurements and data analyses.
The OSL signal from quartz is reset more quickly than the infrared-stimulated luminescence from feldspar when the minerals are exposed to sunlight (Godfrey-Smith et al., 1988; Yang et al., 2012). In addition, in many cases, coarser grains are generally better bleached than finer fractions (Olley et al., 1998; Hu et al., 2010; Yang et al., 2017). Moreover, De could decrease with increasing transport distance due to the longer time to bleach (Alexanderson, 2007; Vandenberghe et al., 2007; Hu et al., 2010; Zhao et al., 2015). Compared with the multiple-aliquot procedures and the initial single aliquot procedures (Duller, 1994, 1995; Wintle and Murray., 1998), the single aliquot regenerative dose (SAR) protocol (Murray and Wintle, 2000, 2003) does not need to be normalized and can correct the sensitivity change. In general, the SAR protocol with coarser quartz grains is a fairly reliable method of OSL dating for alluvial deposits.
For incompletely bleached sediments, the greater the number of grains on each aliquot that are measured at the same time, the less variation in De that will be observed because of the impact of averaging (Olley et al., 1999; Wallinga, 2002; Duller, 2008). A better way to reduce the impact of averaging is to lessen the number of grains on each aliquot (Duller, 2008). It now becomes possible to measure the luminescence from a single grain of quartz to distinguish between well-bleached grains (Thomas et al., 2005; Duller, 2008; Wu et al., 2010; Zhao et al., 2015; Zhao et al., 2017). However, the single grain technique requires considerable time, labor, and specific equipment, which restricts its wide application (Tooth et al., 2007; Yang et al., 2017). Many studies have shown that the application of a specific aliquot size can identify well-bleached populations of sediments with different De values (Olley et al., 1999; Tooth et al., 2007; Duller, 2008) and obtain accurate burial doses for modern and old sediments (Medialdea et al., 2014). In addition to the impact of the aliquot sizes, studies on statistical methods have shown that some different age models can be used for the analysis of De values to obtain the true deposition ages. The application of statistical methods is essential for incomplete bleaching sediments to identify well-bleached populations (Duller, 2006, 2008; Wu et al., 2010; Yang et al., 2017; Zhao et al., 2015, 2017).
The selection of aliquot sizes and statistical methods is crucial for the OSL dating of incompletely bleached sediments. However, there is a lack of systematic research on the dose dependency of aliquot sizes and age models. It is still unclear from which combination of aliquot sizes and age models the De values obtained can be consistent with known ages within the limit of error, especially for fast-accumulating sediments. This work aims to study the dependency of aliquot sizes and age models on De using poorly bleached modern alluvial sediments. A series of alluvial fans have developed on the eastern piedmont of Helan Mountain, providing a good location and materials for our research. In this study, the equivalent doses were measured using three aliquot sizes (1, 3, and 5 mm) of 90–125 μm quartz grains for modern deposits from the alluvial fan and calculated by applying six different age models. It is worthwhile to test whether there is a suitable combination of “aliquot sizes and age models” to obtain accurate buried ages for the alluvial deposits.
Geological setting and sampling
The Dashuigou (DSG) alluvial fan is located at the eastern piedmont of Helan Mountain (Figure 1A) in northwestern China with longitudes and latitudes of 106°10′–106°13′E and 38°51′–38°53′N. The Helan Mountains, lithologically, are mainly composed of granite, limestone, quartzite, sandstone, slate, and conglomerate. The general elevation is 2000–3,000 m, and the annual precipitation is 200–400 mm in this area, but the precipitation from June to September accounts for 62% of the annual precipitation (Jiang, 2016). The length of the DSG alluvial fan is ∼2.5 km, the width is ∼4 km (Figure 1B), and the length of the main stream is approximately 17 km. The sediments from the apex to the middle of the fan are gravelly sand, those from the middle to the edge of the fan are fine gravel and sand, and those at the edge of the fan are sand and soil. In the vertical direction, the sediment at the bottom of a fan is mainly composed of clay or silty material, and the grain size gradually increases to gravel. The structure of the alluvial fan is often composed of interbedded sand and gravel, with sandy lenses in gravel layers or gravelly lenses in sand layers.
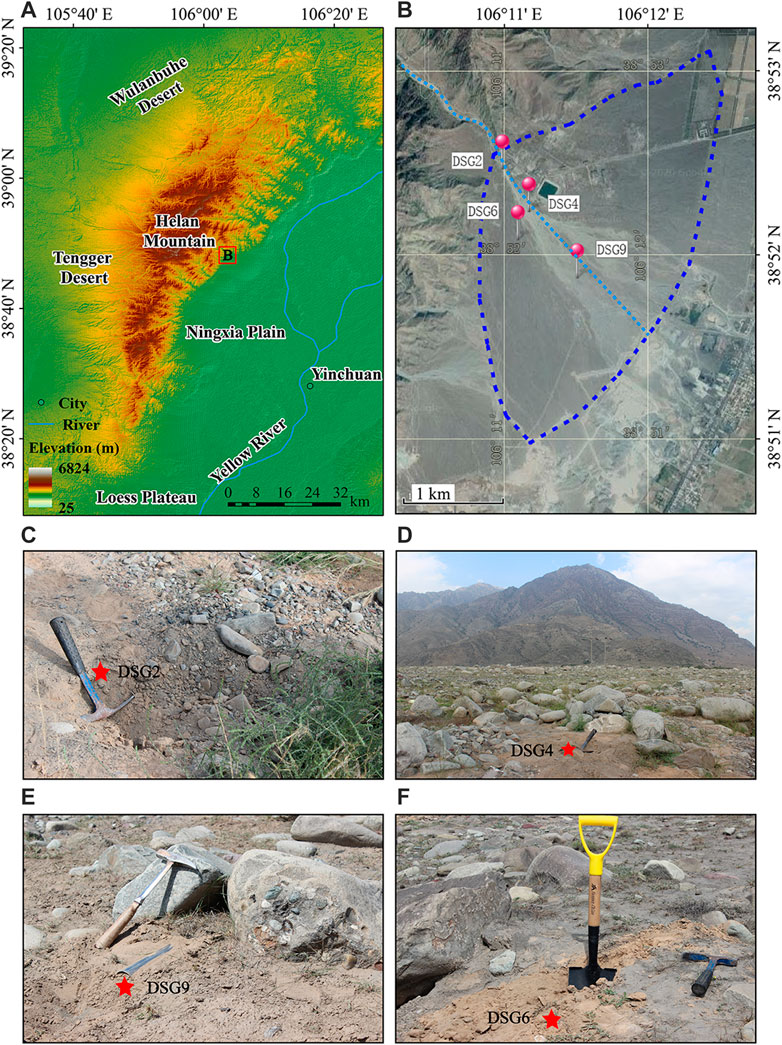
FIGURE 1. Location map of the study site. (A) Topographic map of Helan Mountain. (B) Satellite map of alluvial fan (sampling points are highlighted in red). (C–F) Photos showing the landscape and the sections from which samples were collected: three alluvial deposit samples (DSG2, DSG4, and DSG9) and one loess-like deposit sample (DSG6).
All samples were collected from the DSG alluvial fan with a steel horizontal tube into a fresh outcrop of the sediments and sealed to avoid exposure and moisture loss. The depths of all the samples (top of the steel tubes) are 5 mm below the surface. According to news reports, large floods or sparse debris flows have occurred several times in the DSG and its neighboring areas during the last 20 years, and their recurrence period is 5–10 years (Li and Chen, 2006). Therefore, the samples collected from DSG can be regarded as modern sediments (Li et al., 2018). Three alluvial deposit samples (DSG2, DSG4, and DSG9) (Figures 1C–E) and one loess-like deposit sample (DSG6) (Figure 1F) on the alluvial fan surface were collected. DSG2 and DSG4 were taken from the fan head trench gully, and DSG9 was collected from the matrix of the diamicton at the edge of the alluvial fan surface (Figure 1B).
Sample preparation and instrumentation
Sample preparation was performed under subdued red-light conditions. The fraction of 90–125 μm was obtained by wet sieving from samples and then treated with 10% HCl to remove carbonates and 30% H2O2 to remove organic matter. After this, quartz-rich grains were separated by heavy liquid densities of 2.58 and 2.70 g cm−3. This fraction was then etched with 40% HF for 40 min and washed with 10% HCl for 40 min to extract the pure quartz grains. Resieving was needed after chemical treatment to a fraction of 90–125 μm for all samples. The remaining feldspar contamination in quartz grains of all samples was checked using IR measurement (Duller et al., 2003). Quartz grains were glued in a single layer on 9.7 mm stainless steel discs but with different aliquot sizes using silicone oil. To compare the dependency of De on aliquot sizes, all the De values were measured by 1-, 3 -, and 5-mm aliquots. The number of grains (∼50 grains) on the 1-mm aliquot is the average value of six aliquots counted under a microscope, and those of 3 mm (∼450 grains) and 5 mm (∼1,250 grains) are calculated based on their areas relative to 1-mm aliquots (Duller, 2008).
OSL measurements were carried out on Risø TL/OSL DA-20 readers (Bøtter-Jensen et al., 2010) at Capital Normal University. Optical stimulation used an array of blue (470 nm) LEDs providing a power density of ∼40 mW cm−2 at the sample position. OSL was measured using blue LED stimulation at 125°C for 40 s. Laboratory irradiation employed a90Sr/90Y beta source (∼0.117 Gy s−1) fitted on the readers at the quartz grain discs. The beta source had good spatial uniformity (<5% standard deviation across the sample area).
Equivalent dose determination
Equivalent dose estimates were measured using the SAR protocol (Murray and Wintle, 2000, 2003; Murray et al., 2021). The relative contributions of individual components as a function of the stimulation time for sample DSG2 show that luminescence signals of quartz are provided by the fast component before 0.48 s (Figure 2A). Therefore, early background subtraction (Cunningham and Wallinga, 2010) was used to analyze the De values, which means that the OSL signals were derived from the summation of the first 0.48 s (0.16 s per channel) of stimulation minus the summation of the following 0.48 s. The decay curve corresponds to the natural dose and to a given dose of ∼5.85 Gy, and the growth curve is shown in Figure 2B. Dose estimates were accepted if 1) the relative error on the test dose signal (STn) did not exceed 30%, 2) the recycling ratio was equal to unity within two standard deviations, and 3) the recuperation dose was less than 5% of the natural dose (Duller, 2008).
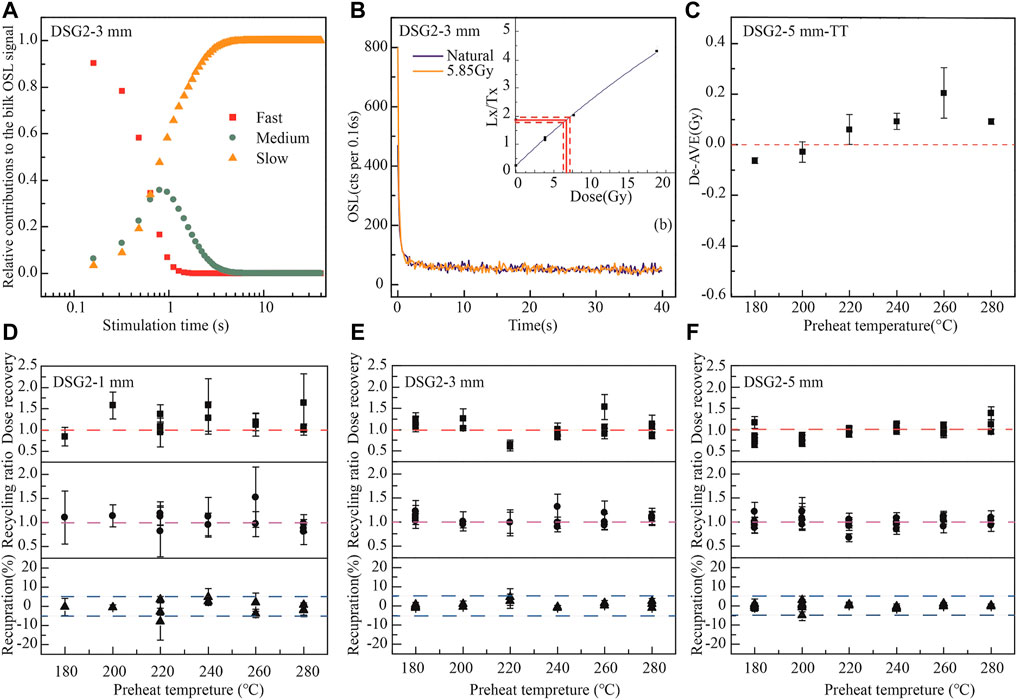
FIGURE 2. (A) Relative contributions from individual components to the bulk optically stimulated luminescence (OSL) signals as a function of the stimulation time for DSG2 with a 3-mm aliquot. (B) Decay curve of DSG2 and growth curve (interpolated B). (C) Thermal transfer (TT) of DSG2 with 5-mm aliquots. (D–F) Dose recovery–preheat plateau of DSG2 with different aliquot sizes (1, 3, and 5 mm).
To establish an appropriate thermal treatment, the dependency of De on preheat temperatures was investigated using a preheat temperature range of 180°C–280°C with 20°C as the step, which is 20°C higher than a cut heat range of 160°C–260°C (Murray and Wintle, 2003), and ∼20% of the expected natural dose was used as the test dose. Thermal transfer (TT) has been considered a limitation to the equivalent dose for young sediments (Rhodes, 2000; Jain et al., 2004). To test the dependency of TT on the preheat temperatures, DSG2 with 5-mm aliquots was used to assess the contribution of TT at different preheat temperatures, and three aliquots were measured at each preheat temperature. Aliquots were bleached twice for 100 s using blue diodes at room temperature (∼20°C), and the two bleaching steps were separated by a 10,000 s pause (Vandenberghe et al., 2007). Then, the SAR protocol was performed at different preheat temperatures, and three aliquots were measured at each preheat temperature. Although the TT doses (Figure 2C) increase with the preheat temperatures ranging from 180°C to 260°C, they are insignificant when the preheat temperature is not higher than 200°C. To determine the preheat temperature, a dose recovery test was conducted at different preheat temperatures (dose recovery–preheat plateau test). The first three steps of the dose recovery–preheat plateau were the same as those of the TT test. After the second bleaching, the aliquots were given a laboratory dose that was equal to the expected natural dose (for DSG2, the laboratory dose was ∼5.85 Gy) before the SAR protocol was performed at different preheat temperatures. Dose recovery–preheat plateau tests for the 1-, 3-, and 5-mm aliquots of DSG2 were carried out, and the results showed that the dose recovery ratios were independent of the preheat temperatures (Figures 2D–F). The dose recovery ratios of the 1-, 3-, and 5-mm aliquots were 1.14 ± 0.28 (n = 18), 1.03 ± 0.13 (n = 18) and 0.94 ± 0.08 (n = 27), respectively. The corresponding recycling ratios were 0.99 ± 0.34, 1.09 ± 0.19 and 1.00 ± 0.13, respectively, and the recuperation dose was less than 5% of the natural dose (−1.51 ± 2.18%, 0.51 ± 0.32% and 0.04 ± 0.27% of the given dose). Combined with the TT results, the preheat temperature of 180°C and a corresponding cut heat temperature of 160°C were adopted in all further De measurements.
It is known that statistical analysis of De values is essential when calculating Des and ages. The average dose model (ADM, Guérin et al., 2017) and central age model (CAM, Galbraith et al., 1999) have been commonly used to analyze the De distribution for well-bleached sediments with normal distributions of De values. The minimum age model (MAM, Galbraith et al., 1999; Arnold et al., 2009) assumes that only a proportion of the De values belong to the burial dose distribution and that the other De values are part of a normal distribution truncated at the burial dose. This statistical method has been applied to modern earthquake-related sediments to identify the lower Des, which is related to the true ages (Fattahi et al., 2016; Yang et al., 2017). The internal/external consistency criterion (IEU, Thomsen et al., 2003, 2007) was used to identify the lowest normal dose population, which is presumed to be the population of grains most likely to have been well-bleached at deposition (Zhao et al., 2015, 2017). The lowest 5% (Olley et al., 1998) has been applied to modern debris flow deposits in which the dose distribution includes negative De values (Wu et al., 2010). The finite mixture model (FMM, Galbraith and Green, 1990; Galbraith, 2005) has been used to analyze glaciofluvial and debris flow deposits to isolate the dominant well-bleached population (Duller, 2006, 2008).
These six dose statistical analysis methods were applied to estimate the dose distributions of three aliquot sizes in the luminescence package R-project (Burow, 2020a, 2020b, 2020c; Christophe et al., 2020; Smedley, 2020). The ADM and CAM are commonly used to calculate the doses when there is only a single population of grains, which means that the sediments are homogeneous and well-bleached. The MAM assumes that only a part of the measured doses was from well-bleached grains before burial and that the others were from poorly bleached grains. The De values appropriate for determining the burial dose of the sediments are defined by the grain population at the lower distribution (Duller, 2008). The FMM is commonly used to estimate the De of different components with multipeak distribution. σm in the ADM and σb in the MAM and FMM represent the expected overdispersion (OD) in the data of the well-bleached samples (Cunningham and Wallinga, 2012). The OD of CAM in the dose recovery experiment was applied as the expected OD in the ADM, MAM, and FMM. In the De calculation of the ADM, CAM, and FMM, the negative dose estimations were removed. The lowest 5% can be used to calculate the Des when the dose distribution includes negative De values (Bailey and Arnold, 2006). The IEU is usually used to identify the minimum normal dose population that is most likely well-bleached before being buried. The parameter values of a (slope) and b (intercept) in the IEU were found to be 0.13 ± 0.02 and 0.04 ± 0.02 Gy with beta dose recovery (0 and 5.85 Gy) tests, respectively.
Results and discussion
The choice of STn is an influencing factor in an acceptable number of aliquots to determine De distributions. To test the importance of the STn to the De values, the CAM, ADM, MAM, and FMM Des were calculated with the STn ranging from 10 to 30%. For the MAM and FMM, the De values are independent of the STn for all aliquot sizes (Figures 3A–C). Thus, application of the STn range from 10 to 30% has no impact on the absolute MAM and FMM doses determined. Similar appearances have been described for CAM by Thomsen et al., 2012, 2016. However, in our study, the precision is increased for the CAM and ADM when the STn is higher than 15%, which may be due to the small quantity (fewer than 10) of the aliquots accepted to calculate Des. Furthermore, the De values as a function of the number of aliquots with the different age models are shown in Figures 3D–F. This indicates that the De values are stable when the number of aliquots used to calculate De is more than 10 in the MAM and FMM, but the precision of equivalent dose estimation improves with the increase in the number of aliquots for the ADM and CAM. However, it has been shown that both the precision and accuracy of dose estimations from heterogeneously bleached samples are improved with the increasing number of aliquots with the MAM (Peng et al., 2020). In this research, such variations in MAM were not observed; therefore, more than 15 aliquots accepted in the dose estimations are enough to determine the Des.
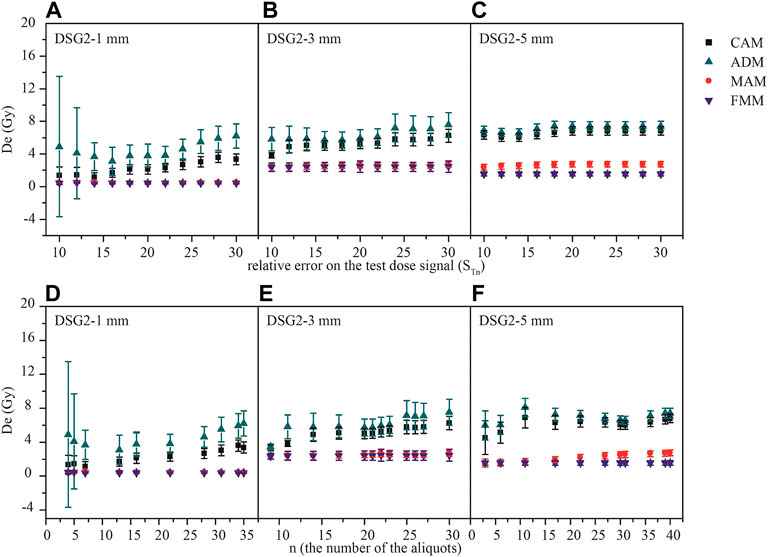
FIGURE 3. (A–C) Effect of rejection criteria of the relative error on the test dose signal (STn). (D–F) Quantity of the aliquots accepted on the dose of the CAM, ADM, MAM, and FMM with different aliquot sizes.
More than 1,000 aliquots were measured for the Des of the four samples. A kernel density estimate (KDE, Dietze and Kreutzer, 2020) plot for each sample with 1-, 3-, and 5-mm aliquots was constructed to visualize the dose distribution (Figure 4). KDE plots of the three alluvial samples with different aliquot sizes show wide distributions and obvious multiple peaks and wide ranges of De values, whereas that of the loess-like sample DSG6 shows a normal distribution with only one peak in Figure 4. This indicates that the alluvial sediments are poorly bleached and contain complex components. However, the presence of probability peaks of 1-mm aliquots close to 0 Gy indicates success in identifying well-bleached populations. According to the KDE plots, n (components) was set as 6, and the results of the De were obtained by the lowest dose component of the FMM.
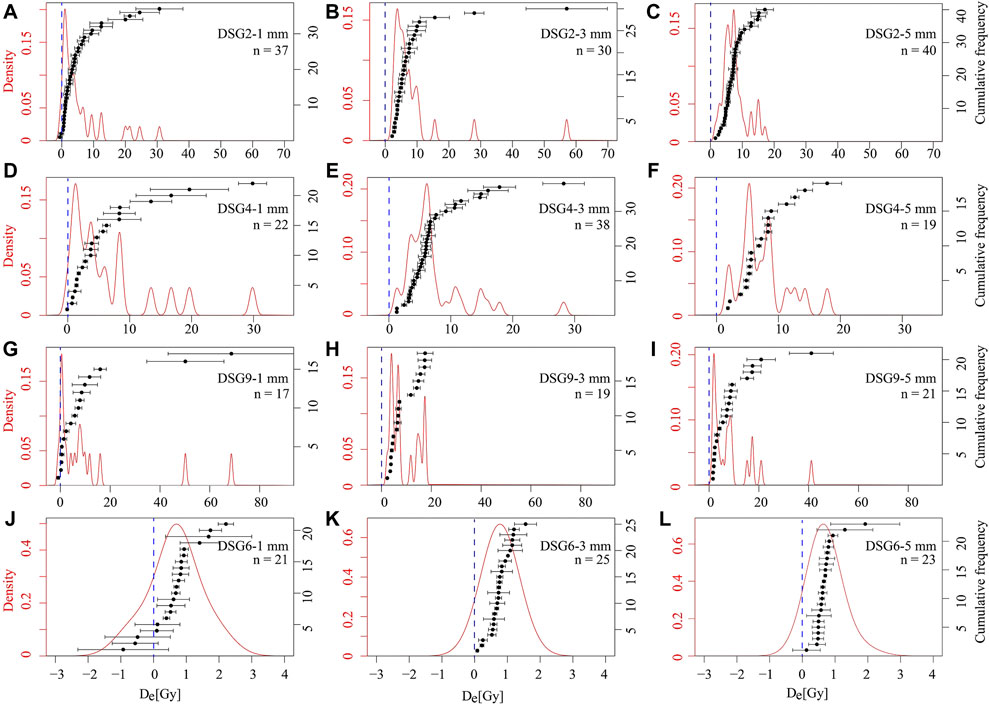
FIGURE 4. Kernel density estimate plots of natural dose distributions from DSG2 with 1-, 3-, 5-mm aliquots (A–C); DSG4 with 1-, 3-, 5-mm aliquots (D–F); DSG9 with 1-, 3-, 5-mm aliquots (G–I) and DSG6 with 1-, 3-, 5-mm aliquots (J–L).
A summary of equivalent doses and ages with different aliquot sizes and age models of four samples is shown in Table 1. For all samples, the Des obtained with ADM of 1-, 3-, and 5-mm aliquot sizes are consistent within one standard error. The same results are calculated from all the CAM Des but from DSG2 with 1 mm. The CAM and ADM Des from the three alluvial samples (DSG2, DSG4, and DSG9) overestimate ∼6 and ∼3 Gy at least even when a 1-mm aliquot is applied, respectively (Figures 5, 6). Some studies show that the Des from debris flows and fluvial deposits with small aliquots are overestimated compared to the expected dose, which may be due to the application of CAM or ADM to calculate Des (Thomsen et al., 2007; Zhao et al., 2015, 2017). Therefore, for incompletely bleached sediments, the application of CAM and ADM needs to be done carefully. Therefore, the MAM, FMM, IEU, and the lowest 5% are applied to estimate the Des in the following research.
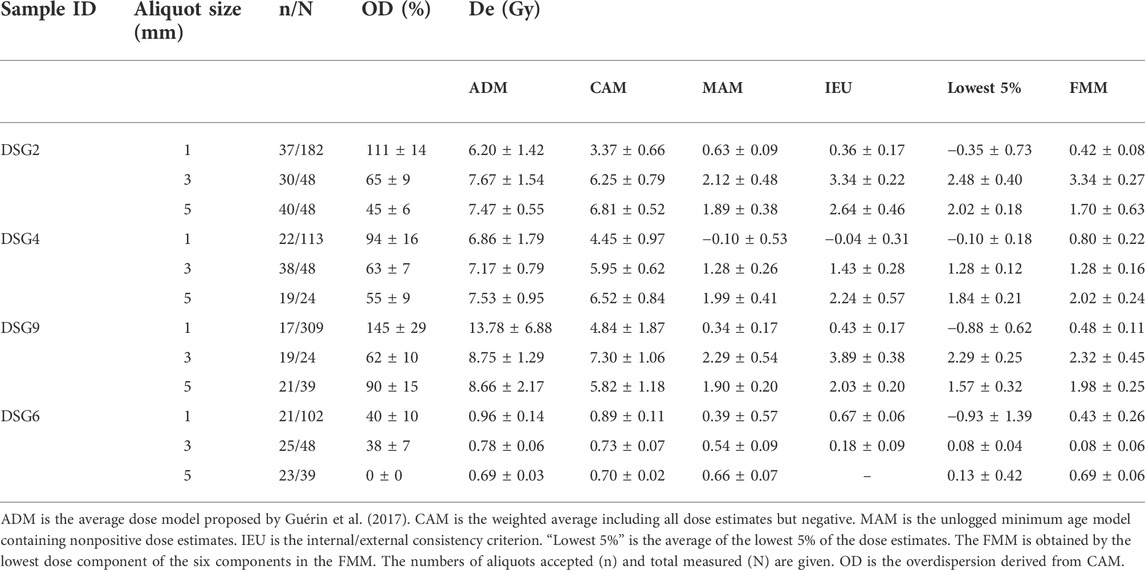
TABLE 1. Summary of equivalent doses and ages for different aliquot sizes and age models.
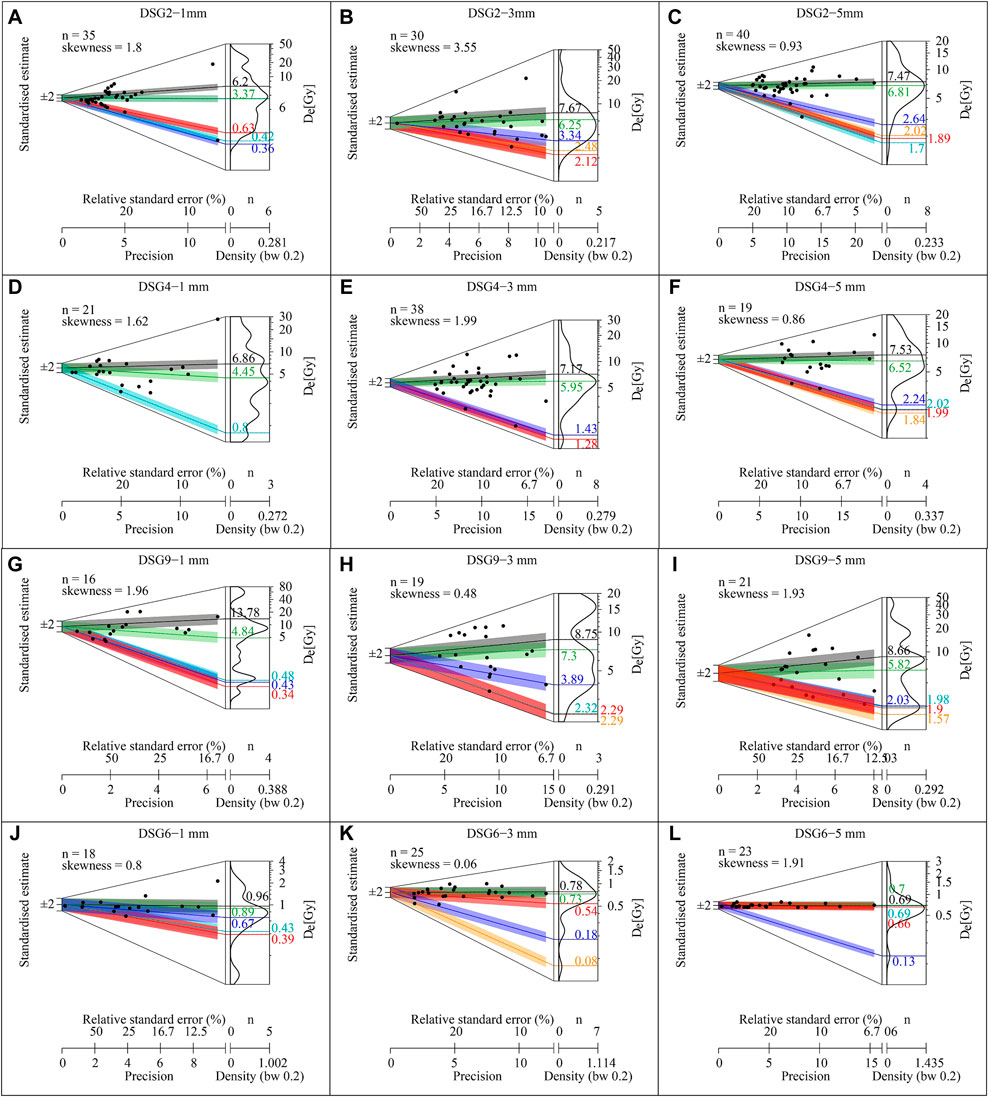
FIGURE 5. Abanico plots of natural dose distributions of DSG2 with 1-, 3-, 5-mm aliquots (A–C); DSG4 with 1-, 3-, 5-mm aliquots (D–F); DSG9 with 1-, 3-, 5-mm aliquots (G–I) and DSG6 with 1-, 3-, 5-mm aliquots (J–L).

FIGURE 6. Comparation of different models Des from the four samples with 1-, 3-, and 5-mm aliquots.
The MAM, FMM, IEU, and the lowest 5% Des of 5-mm aliquots from DSG2, DSG4, and DSG9 and 3-mm aliquots from DSG4 are consistent within one standard error. The IEU and FMM Des of 3-mm aliquots from DSG2 are overestimated compared with the MAM and the lowest 5%. The IEU De of 3-mm aliquots from DSG9 is overestimated compared to the MAM, the lowest 5%, and FMM Des. The results show that De values do not change systematically when the aliquot size is larger than 3 mm (Figure 6). This indicates that the 3-mm aliquot is too large to obtain the true dose for the young poorly bleached sediments. Some studies have shown that the De of small aliquots (∼2 mm or >100 grains) is overestimated compared with the expected De, as the number of grains on the small aliquots is too large to distinguish the well-bleached population, although they used the lowest 5% or MAM (Wu et al., 2010; Colarossi et al., 2020). For the well-bleached sample DSG6, the De distributions have no dependency on the aliquot sizes and age models except the lowest 5% De of the 1-mm aliquot is negative (Figure 6).
The De values of 1 mm from three alluvial samples were quantified by OD values between 94 and 145% (Table 1). The MAM, FMM, IEU, and the lowest 5% De values of these three samples range from −0.88 ± 0.62 Gy to 0.80 ± 0.22 Gy of 1-mm aliquots. For the 1-mm aliquots of DSG2 and DSG9, the De values calculated by MAM, FMM, and IEU are consistent within one standard error. For DSG4, the MAM, IEU, and lowest 5% De values are consistent with ∼−0.1 Gy, which is sufficiently close to 0 Gy. This indicates the potential of 1-mm aliquots to obtain the expected deposit doses of the alluvial sediments. The lowest 5% De values of DSG2, DSG9, and DSG6 are significantly negative values (−0.35 ± 0.73 Gy, −0.88 ± 0.62 Gy, and −0.93 ± 1.39 Gy). This indicates that the lowest 5% may underestimate the true burial doses. The same underestimations were observed in the young fluvial and paleoflood deposits with the lowest 5% by Bailey and Arnold (2006) and Medialdea et al. (2014). The ratios of the IEU Des with small aliquots (∼30 grains) to the expected dose are consistent with unity within two standard errors for paleoflood deposits (Medialdea et al., 2014). In addition, it is proven by modern earthquake-related deposits of 1-mm aliquots with MAM (Yang et al., 2017).
A dose overestimation of lower than 1 Gy would be allowable for older sediments. A similar suggestion has been made by Medialdea et al. (2014) for fluvial deposits. This indicates that it may be suitable to apply 1-mm (<50 grains) aliquots with MAM or IEU to old alluvial sediment OSL dating. Any heterogeneity in De that individual grain may still be masked at the 1-mm aliquot scale analyses, as individual De estimates are obtained from 1-mm aliquots containing ∼50 grains. Therefore, a single grain needs to be applied with MAM and IEU models to remove this small overestimation for very young sediments.
Conclusion
Three alluvial deposit samples and one loess-like deposit sample were dated in this study by the application of 1-, 3-, and 5-mm aliquots of quartz OSL. Even for the limited dataset from this study, useful information is provided from our results. Based on the results, the rejection criteria for STn have no impact on the absolute MAM and FMM doses determined by the range from 10 to 30%. Analyzing Des with the different statistical models reveals that the MAM and IEU models are more suitable for poorly bleached sediments than the lowest 5% and FMM, and the lowest 5% always underestimates the De. Equivalent doses estimated with 1-, 3-, and 5-mm aliquots from modern deposits on the alluvial fan prove the potential of 1-mm aliquots to accurately date incomplete bleaching sediments. OSL dating of 1-mm aliquots (∼50 grains) using the MAM and IEU can obtain accurate Des with an uncertainty of less than 1 Gy for the alluvial deposits. Our study highlights the necessity of combining aliquot sizes and age models to obtain reliable ages of poorly bleached deposits and provides the possibility of accurately dating paleoalluvial deposits.
Data availability statement
The original contributions presented in the study are included in the article/supplementary material; further inquiries can be directed to the corresponding author.
Author contributions
XuL, XaL, QZ, and BP participated in the design of this study, and they all performed the statistical analysis and drafted the manuscript. JW aided with data analysis and manuscript editing. BP and MW carried out the study, collected important background information, and performed the manuscript review. All authors have read and approved the final manuscript. All authors have made substantial contributions to all of the following: 1) the conception and design of the study, acquisition of data, and analysis and interpretation of data; 2) drafting the article or revising it critically for intellectual content; and 3) final approval of the version to be submitted.
Funding
This research was supported by the Beijing Municipal Education Commission (Grant No. KM201910028007) and the National Natural Science Foundation of China (NSFC, Grant Nos. 41471007, 41301006, 40871017, and 41602353).
Acknowledgments
We are grateful for the critical comments and insightful suggestions from the Editor HL and the reviewers JZ, YL.
Conflict of interest
The authors declare that the research was conducted in the absence of any commercial or financial relationships that could be construed as potential conflicts of interest.
Publisher’s note
All claims expressed in this article are solely those of the authors and do not necessarily represent those of their affiliated organizations or those of the publisher, the editors, and the reviewers. Any product that may be evaluated in this article, or claim that may be made by its manufacturer, is not guaranteed or endorsed by the publisher.
References
Alexanderson, H. (2007). Residual OSL signals from modern Greenlandic river sediments. Geochronometria. 26, 1–9. doi:10.2478/v10003-007-0001-6
Arnold, L. J., Roberts, R. G., Galbraith, R. F., and Delong, S. B. (2009). A revised burial dose estimation procedure for optical dating of young and modern-age sediments. Quat. Geochronol. 4, 306–325. doi:10.1016/j.quageo.2009.02.017
Bailey, R. M., and Arnold, L. J. (2006). Statistical modelling of single grain quartz De distributions and an assessment of procedures for estimating burial dose. Quat. Sci. Rev. 25, 2475–2502. doi:10.1016/j.quascirev.2005.09.012
Bøtter-Jensen, L., Thomsen, K. J., and Jain, M. (2010). Review of optically stimulated luminescence (OSL) instrumental developments for retrospective dosimetry. Radiat. Meas. 45, 253–257. doi:10.1016/j.radmeas.2009.11.030
Burow, C. (2020a). “calc_CentralDose(): apply the central age model (CAM) after galbraith et al. (1999) to a given De distribution. function version 1.4.0,” in Luminescence: Comprehensive luminescence dating data analysis. Editors S. Kreutzer, C. Burow, M. Dietze, M. C. Fuchs, C. Schmidt, M. Fischeret al. 2020R package version 0.9.10. Available at: https://CRAN.R-project.org/package=Luminescence.
Burow, C. (2020c). “calc_FiniteMixture(): apply the finite mixture model (FMM) after galbraith (2005) to a given De distribution. function version 0.4.1,” in Luminescence: Comprehensive luminescence dating data analysis. Editors S. Kreutzer, C. Burow, M. Dietze, M. C. Fuchs, and C. Schmidt. 2020R package version 0.9.10. Available at: https://CRAN.R-project.org/package=Luminescence.
Burow, C. (2020b). “calc_MinDose(): apply the (un-)logged minimum age model (MAM) after galbraith et al. (1999) to a given De distribution. function version 0.4.4,” in Luminescence: Comprehensive luminescence dating data analysis. Editors S. Kreutzer, C. Burow, M. Dietze, M. C. Fuchs, and C. Schmidt. 2020R package version 0.9.10. Available at: https://CRAN.R-project.org/package=Luminescence.
Christophe, C., Philippe, A., Guérin, G., and Kreutzer, S. (2020). “calc_AverageDose (): Calculate the Average Dose and the dose rate dispersion. Function version 0.1.4,” in Luminescence: Comprehensive luminescence dating data analysis. Editors S. Kreutzer, C. Burow, M. Dietze, M. C. Fuchs, C. Schmidt, M. Fischeret al. R package version 0.9.10. Available at: https://CRAN.R-project.org/package=Luminescence.
Colarossi, D., Duller, G. A. T., Roberts, H. M., Tooth, S., and Botha, G. A. (2020). A comparison of multiple luminescence chronometers at Voordrag, South Africa. Quat. Geochronol. 60, 101094. doi:10.1016/j.quageo.2020.101094
Cui, W. G., Mu, G. J., Wen, Q., and Yue, J. (2007). Evolution of alluvial fans and reaction to the regional tectonic activity at rage-front of manas river valley. Res. Soil Water Conservation 14 (01), 161–163. doi:10.3969/j.issn.1005-3409.2007.01.051
Cui, Z. J. (1999). Debris flow deposit and its signification on hazards prevention and reduction. Soil Water Conservation Res. 6 (4), 2–9. (in Chinese).
Cunningham, A. C., and Wallinga, J. (2012). Realizing the potential of fluvial archives using robust OSL chronologies. Quat. Geochronol. 12, 98–106. doi:10.1016/j.quageo.2012.05.007
Cunningham, A. C., and Wallinga, J. (2010). Selection of integration time intervals for quartz OSL decay curves. Quat. Geochronol. 5 (6), 657–666. doi:10.1016/j.quageo.2010.08.004
Dietze, M., and Kreutzer, S. (2020). “Plot-KDE (): Plot kernel density estimate with statistics. Function version 3.6.0,” in Luminescence: Comprehensive luminescence dating data analysis. Editors S. Kreutzer, C. Burow, M. Dietze, M. C. Fuchs, C. Schmidt, M. Fischeret al. 2020R package version 0.9.10. Available at: https://CRAN.R-project.org/package=Luminescence.
Duller, G. A. T., Bøtter-Jensen, L., and Murray, A. S. (2003). Combining infrared- and green-laser stimulation sources in single-grain luminescence measurements of feldspar and quartz. Radiat. Meas. 37 (4–5), 543–550. doi:10.1016/S1350-4487(03)00050-7
Duller, G. A. T. (1994). Luminescence dating of poorly bleached sediments from Scotland. Quat. Sci. Rev. 13 (5), 521–524. doi:10.1016/0277-3791(94)90070-1
Duller, G. A. T. (1995). Luminescence dating using single aliquots: Methods and applications. Radiat. Meas. 24 (3), 217–226. doi:10.1016/1350-4487(95)00150-D
Duller, G. A. T. (2006). Single grain optical dating of glacigenic deposits. Quat. Geochronol. 1 (4), 296–304. doi:10.1016/j.quageo.2006.05.018
Duller, G. A. T. (2008). Single-grain optical dating of quaternary sediments: Why aliquot size matters in luminescence dating. Boreas 37 (4), 589–612. doi:10.1111/j.1502-3885.2008.00051.x
Fattahi, M., Heidary, M., and Ghasemi, M. (2016). Employing minimum age model (MAM) and finite mixture modeling (FMM) for OSL age determination of two important samples from Ira trench of north tehran fault. Geochronometria 43 (1), 38–47. doi:10.1515/geochr-2015-0031
Fiebig, M., and Preusser, F. (2007). Investigating the amount of zeroing in modern sediments of River Danube, Austria. Quat. Geochronol. 2 (1), 143–149. doi:10.1016/j.quageo.2006.09.001
Fiorillo, F., and Wilson, R. C. (2004). Rainfall induced debris flows in pyroclastic deposits, campania (southern Italy). Eng. Geol. 75 (3-4), 263–289. doi:10.1016/j.enggeo.2004.06.014
Fuchs, M., Fischer, M., and Reverman, R. (2010). Colluvial and alluvial sediment archives temporally resolved by OSL dating: implications for reconstructing soil erosion. Quat. Geochronol. 5 (2), 269–273. doi:10.1016/j.quageo.2009.01.006
Fuchs, M., and Lang, A. (2001). OSL dating of coarse-grain fluvial quartz using single-aliquot protocols on sediments from NE Peloponnese, Greece. Quat. Sci. Rev. 20, 783–787. doi:10.1016/S0277-3791(00)00040-8
Galbraith, R. F., and Green, P. F. (1990). Estimating the component ages in a finite mixture. Int. J. Radiat. Appl. Instrum. Part D. Nucl. Tracks Radiat. Meas. 17 (3), 197–206. doi:10.1016/1359-0189(90)90035-v
Galbraith, R. F., Roberts, R. G., Laslett, G. M., Yoshida, H., and Olley, J. M. (1999). Optical dating of single grains of quartz from jinmium rock shelter, northern Australia. Part I: experimental design and statistical models. Archaeometry 41, 339–364. doi:10.1111/j.1475-4754.1999.tb00987.x
Galbraith, R. F., and Roberts, R. G. (2012). Statistical aspects of equivalent dose and error calculation and display in OSL dating: An overview and some recommendations. Quat. Geochronol. 11, 1–27. doi:10.1016/j.quageo.2012.04.020
Galbraith, R. F. (2005). Statistics for fission track analysis. Boca Raton: Chapman & Hall/CRC. doi:10.1201/9781420034929
Godfrey-Smith, D. I., Huntley, D. J., and Chen, W. H. (1988). Optical dating studies of quartz and feldspar sediment extracts. Quat. Sci. Rev. 7 (3), 373–380. doi:10.1016/0277-3791(88)90032-7
Guérin, G., Christophe, C., Philippe, A., Murray, A. S., Thomsen, K. J., Tribolo, C., et al. (2017). Absorbed dose, equivalent dose, measured dose rates, and implications for OSL age estimates: Introducing the Average Dose Model. Quat. Geochronol. 41, 163–173. doi:10.1016/j.quageo.2017.04.002
Hou, J. J., and Han, M. K. (1995). Geomorphic expression of the activity along north Qinling piedmont fault zone in the late quaternary period. J. Geogr. 000 (002), 138. (in Chinese).
Hu, G., Zhang, J. F., Qiu, W. L., and Zhou, L. P. (2010). Residual OSL signals in modern fluvial sediments from the Yellow River (HuangHe) and the implications for dating young sediments. Quat. Geochronol. 5 (2), 187–193. doi:10.1016/j.quageo.2009.05.003
Jain, M., Murray, A. S., and Bøtter-Jensen, L. (2004). Optically stimulated luminescence dating: how significantly is incomplete light exposure in fluvial environments? PubMed 15 (1–2), 143–157. doi:10.1258/ijsa.2008.008369
Jiang, Z. B. (2016). Analysis of regional climate change and extreme weather characteristics in helan mountain area. Lanzhou City, China: Lanzhou University. Master Thesis (in Chinese). doi:10.7666/d.D01300699
Kenworthy, M. K., Rittenour, T. M., Pierce, J. L., Sutfin, N. A., and Sharp, W. D. (2014). Luminescence dating without sand lenses: an application of OSL to coarse-grained alluvial fan deposits of the lost river range, Idaho, USA. Quat. Geochronol. 23, 9–25. doi:10.1016/j.quageo.2014.03.004
Li, G. W., and Chen, Y. C. (2006). Analysis on the 060714 rainstorm floodwater east foot of helan mountain in ningxia. Ningxia Eng. Technol. 5 (4), 332–334 (in Chinese). doi:10.3969/j.issn.1671-7244.2006.04.004
Li, X. H., Su, Z. S., Na, L., Chen, Y. Y., Chen, Y. H., and Wu, B. G. (2018). Climate characteristics of rainstorm and disaster prevention countermeasures along the eastern Helan Mountain. Arid. Land Geogr. 44 (05), 1231–1239. (in Chinese). doi:10.12118/j.issn.10006060.2021.05.04
Medialdea, A., Thomsen, K. J., Murray, A. S., and Benito, G. (2014). Reliability of equivalent-dose determination and age-models in the OSL dating of historical and modern palaeoflood sediments. Quat. Geochronol. 22, 11–24. doi:10.1016/j.quageo.2014.01.004
Murray, A. S., Arnold, L. J., Buylaert, J. P., Guérin, G., Qin, J. T., Singhvi, A. K., et al. (2021). Optically stimulated luminescence dating using quartz. Nat. Rev. Methods Prim. 1, 72. doi:10.1038/s43586-021-00068-5
Murray, A. S., and Wintle, A. G. (2000). Luminescence dating of quartz using an improved single-aliquot regenerative-dose protocol. Radiat. Meas. 32 (1), 57–73. doi:10.1016/S1350-4487(99)00253-X
Murray, A. S., and Wintle, A. G. (2003). The single aliquot regenerative dose protocol: potential for improvements in reliability. Radiat. Meas. 37 (4), 377–381. doi:10.1016/S1350-4487(03)00053-2
Olley, J. M., Caitcheon, G. G., and Murray, A. S. (1998). The distribution of apparent dose as determined by optically stimulated luminescence in small aliquots of fluvial quartz: implications for dating young sediments. Quat. Sci. Rev. 17 (11), 1033–1040. doi:10.1016/S0277-3791(97)00090-5
Olley, J. M., Caitcheon, G. G., and Roberts, R. G. (1999). The origin of dose distributions in fluvial sediments, and the prospect of dating single grains from fluvial deposits using optically stimulated luminescence. Radiat. Meas. 30 (2), 207–217. doi:10.1016/S1350-4487(99)00040-2
Palstra, S. W. L., Wallinga, J., Viveen, W., Schoorl, J. M., Berg, M., Plicht, J., et al. (2021). Cross-comparison of last glacial radiocarbon and OSL ages using periglacial fan deposits. Quat. Geochronol. 61, 101128. doi:10.1016/j.quageo.2020.101128
Peng, J., Li, B., and Jacobs, Z. (2020). Modelling heterogeneously bleached single-grain equivalent dose distributions: Implications for the reliability of burial dose determination. Quat. Geochronol. 60, 101108. doi:10.1016/j.quageo.2020.101108
Rhodes, E. J. (2000). Observations of thermal transfer OSL signals in glacigenic quartz. Radiat. Meas. 32 (5), 595–602. doi:10.1016/S1350-4487(00)00125-6
Rittenour, T. M. (2008). Luminescence dating of fluvial deposits: applications to geomorphic, palaeoseismic and archaeological research. Boreas 37 (4), 613–635. doi:10.1111/j.1502-3885.2008.00056.x
Ritter, J. B., Miller, J. R., Enzel, Y., and Wells, S. G. (1995). Reconciling the roles of tectonism and climate in quaternary alluvial fan evolution. Geol. 23 (3), 245. doi:10.1130/0091-7613(1995)023<0245:rtrota>2.3.co;2
Rodnight, H., Duller, G. A. T., Wintle, A. G., and Tooth, S. (2006). Assessing the reproducibility and accuracy of optical dating of fluvial deposits. Quat. Geochronol. 1 (2), 109–120. doi:10.1016/j.quageo.2006.05.017
Sewell, R. J., Parry, S., Millis, S. W., Wang, N., Rieser, U., DeWitt, R., et al. (2015). Dating of debris flow fan complexes from Lantau Island, Hong Kong, China: the potential relationship between landslide activity and climate change. Geomorphology 248, 205–227. doi:10.1016/j.geomorph.2015.07.041
Smedley, R. K. (2020). “calc_IEU(): apply the internal-external-uncertainty (IEU) model after Thomsen et al. (2007) to a given De distribution. Function version 0.1.1,” in Luminescence: Comprehensive luminescence dating data analysis. Editors S. Kreutzer, C. Burow, M. Dietze, M. C. Fuchs, C. Schmidt, M. Fischeret al. 2020R package version 0.9.10. Available at: https://CRAN.R-project.org/package=Luminescence.
Stokes, S., Bray, H. E., and Blum, M. D. (2001). Optical resetting in large drainage basins: tests of zeroing assumptions using single-aliquot procedures. Quat. Sci. Rev. 20 (5), 879–885. doi:10.1016/S0277-3791(00)00045-7
Tang, C., van Asch, T. W. J., Chang, M., Chen, G. Q., Zhao, X. H., and Huang, X. C. (2012). Catastrophic debris flows on 13 August 2010 in the Qingping area, southwestern China: the combined effects of a strong earthquake and subsequent rainstorms. Geomorphology 139-140, 559–576. doi:10.1016/j.geomorph.2011.12.021
Thomas, P. J., Jain, M., Juyal, N., and Singhvi, A. K. (2005). Comparison of single-grain and small-aliquot OSL dose estimates in years old river sediments from South India. Radiat. Meas. 39 (5), 457–469. doi:10.1016/j.radmeas.2004.07.005
Thomsen, K. J., Jain, M., Bøtter-Jensen, L., Murray, A. S., and Jungner, H. (2003). Variation with depth of dose distributions in single grains of quartz extracted from an irradiated concrete block. Radiat. Meas. 37 (4), 315–321. doi:10.1016/S1350-4487(03)00006-4
Thomsen, K. J., Murray, A. S., Boetter-Jensen, L., and Kinahan, J. (2007). Determination of burial dose in incompletely bleached fluvial samples using single grains of quartz. Radiat. Meas. 42, 370–379. doi:10.1016/j.radmeas.2007.01.041
Thomsen, K. J., Murray, A. S., Buylaert, J. P., Jain, M., Hansen, J. H., Aubry, T., et al. (2016). Testing single-grain quartz OSL methods using sediment samples with independent age control from the Bordes-Fitte rockshelter (Roches d’Abilly site, Central France). Quat. Geochronol. 31, 77–96. doi:10.1016/j.quageo.2015.11.002
Thomsen, K. J., Murray, A. S., and Jain, M. (2012). The dose dependency of the over-dispersion of quartz OSL single grain dose distributions. Radiat. Meas. 47 (9), 732–739. doi:10.1016/j.radmeas.2012.02.015
Tooth, S., Rodnight, H., Duller, G. A. T., McCarthy, T. S., Marren, P. M., Brandt, D., et al. (2007). Chronology and controls of avulsion along a mixed bedrock-alluvial river. Geol. Soc. Am. Bull. 119 (3–4), 452–461. doi:10.1130/B26032.1
Vandenberghe, D., Derese, C., and Houbrechts, G. (2007). Residual doses in recent alluvial sediments from the ardenne (S Belgium). Geochronometria. 28 (1), 1–8. doi:10.2478/v10003-007-0024-z
Wallinga, J., Murray, A. S., Duller, G. A. T., and Törnqvist, T. E. (2001). Testing optically stimulated luminescence dating of sand-sized quartz and feldspar from fluvial deposits. Earth Planet. Sci. Lett. 193 (3), 617–630. doi:10.1016/S0012-821X(01)00526-X
Wallinga, J. (2002). Optically stimulated luminescence dating of fluvial deposits: a review. Boreas 31 (4), 303–322. doi:10.1111/j.1502-3885.2002.tb01076.x
Wintle, A. G. (1997). Luminescence dating: Laboratory procedures and protocols. Radiat. Meas. 27 (5–6), 769–817. doi:10.1016/S1350-4487(97)00220-5
Wintle, A. G., and Murray, A. S. (1998). Towards the development of a preheat procedure for OSL dating of quartz. Radiat. Meas. 29 (1), 81–94. doi:10.1016/S1350-4487(97)00228-X
Wu, T., Jaiswal, M. K., Lin, Y. N., Chen, Y., and Chen, Y. (2010). Residual luminescence in modern debris flow deposits from Western taiwan: a single grain approach. J. Asian Earth Sci. 38 (6), 274–282. doi:10.1016/j.jseaes.2010.02.002
Yang, H. L., Chen, J., Porat, N., Li, T., Li, W. Q., Xiao, W. P., et al. (2017). Coarse versus fine-grain quartz optical dating of the sediments related to the 1985 Ms 7.1 wuqia earthquake, northeastern margin of the pamir salient, China. Geochronometria 44 (1), 299–306. doi:10.1515/geochr-2015-0075
Yang, H. L., Chen, J., Thompson, J. A., and Liu, J. F. (2012). Optical dating of the 12 May 2008, Ms 8.0 Wenchuan earthquake-related sediments: Tests of zeroing assumptions. Quat. Geochronol. 10, 273–279. doi:10.1016/j.quageo.2012.02.022
Yang, J. C., Guo, Z. T., and Cao, J. D. (1985). Investigation on the holocene activities of the Helan Mountain piedmont fault by use of geomorphological method. Seismol. Geol. 7 (4), 23–31. (in Chinese).
Zhao, Q. Y., Thomsen, K. J., Murray, A. S., Wei, M. J., Pan, B. L., Song, B., et al. (2015). Testing the use of OSL from quartz grains for dating debris flows in miyun, northeast Beijing, China. Quat. Geochronol. 30, 320–327. doi:10.1016/j.quageo.2015.03.007
Keywords: Aliquot sizes, Age Models, Modern deposits, Alluvial fan, Quartz OSL dating
Citation: Liu X, Li X, Zhao Q, Pan B, Wang J and Wei M (2022) Dose dependency of aliquot sizes and age models from modern alluvial fan deposits of Helan Mountain, China. Front. Earth Sci. 10:931075. doi: 10.3389/feart.2022.931075
Received: 28 April 2022; Accepted: 28 June 2022;
Published: 05 August 2022.
Edited by:
Hao Long, Nanjing Institute of Geography and Limnology (CAS), ChinaCopyright © 2022 Liu, Li, Zhao, Pan, Wang and Wei. This is an open-access article distributed under the terms of the Creative Commons Attribution License (CC BY). The use, distribution or reproduction in other forums is permitted, provided the original author(s) and the copyright owner(s) are credited and that the original publication in this journal is cited, in accordance with accepted academic practice. No use, distribution or reproduction is permitted which does not comply with these terms.
*Correspondence: Baolin Pan, YmxwYW5AY251LmVkdS5jbg==