- 1Key Laboratory of Unconventional Natural Gas Evaluation and Development in Complex Tectonic Areas, Ministry of Natural Resources, Guiyang, China
- 2Guizhou Engineering Research Institute of Oil & Gas Exploration and Development, Guiyang, China
- 3Chongqing Gas Field of PetroChina Southwest Oil and Gas Field Company, Chongqing, China
- 4State Key Laboratory of Petroleum Resources and Prospecting, China University of Petroleum, Beijing, China
- 5Unconventional Petroleum Research Institute, China University of Petroleum, Beijing, China
Investigation of pore structure is vital for shale reservoir evaluation and also “sweet spot” prediction. As the strong heterogeneity in pore types, morphology, and size distributions of organic matter-rich shales, it is essential to combine different approaches to comprehensively characterize them.Field emission-scanning electron microscopy (FE-SEM), low-pressure gas (CO2 and N2) adsorption, and high-pressure mercury intrusion (HPMI) were employed to systematically investigate the pore structure of the lower Longmaxi shale reservoirs in the northern Guizhou area. The results show that the shales can be divided into four lithofacies based on mineral composition, namely, siliceous shale (SS), clay shale (CS), carbonate shale (CAS), and mixed shale (MS), among which siliceous shale is the primary lithofacies of the Longmaxi shale. Numerous organic matter (OM)-hosted pores, clay interlayer pores, interparticle pores, and intraparticle pores were identified within shale reservoirs. The specific surface area ranges from 11.3 to 27.4 m2/g, with an average of 18.1 m2/g. It exhibits a strong positive correlation with TOC contents, suggesting that organic matter is the major contributor to the specific surface areas. A wide range of pore size distribution was measured by integration of gas adsorption and HPMI. It is shown that the pore size is primarily distributed within ∼100 nm, corresponding to micropores, mesopores, and part of macropores. The total pore volume, which is mostly derived from the contribution of micropores and mesopores, remains within a range of 0.11 to 0.025 ml/g, with an average of 0.018 ml/g. Furthermore, the volume of micropores and mesopores is mainly controlled by organic matter contents. The dissolution pore contributes most to the macropore space within shale reservoirs, based on the positive correlation with macropore volume and easily dissolved minerals, including carbonate and feldspar. Also, the total pores volume is mainly dominated by organic matter and carbonate contents. This is possibly attributed to the easily dissolved and rigid features of carbonate, which can protect the primary interparticle pores due to its high compression resistance and is conducive to forming abundant dissolution pores. OM-rich carbonate-bearing mixed shale may be the most favorable lithofacies for gas storage in the northern Guizhou area.
Introduction
With the maturity of exploitation techniques (such as hydraulic fracturing, and horizontal drilling) and large-scale applications, commercial production of shale gas becomes possible and plays a critical role as energy source nowadays (Curtis, 2002; Zou et al., 2015, 2018). In general, shale gas reservoirs are characterized by a lower than 10% porosity, an extremely low permeability (1-100 nD), and an ultra-slight pore structure (<100 nm in pore sizes) (Nelson, 2009; Clarkson et al., 2012; Zhang L. C. et al., 2020). Unlike conventional gas reservoirs with distinct gas-water contact, shale gas is mainly stored in the nano-scale micropores and fractures within the shale matrix, which can build an independent source-reservoirs assembled system (Curtis, 2002; Jarvie et al., 2007; Ji et al., 2017). The shale gas storage mechanism can be divided into three types (Chalmers and Bustin, 2007; Jarvie et al., 2007; Taghavinejad et al., 2020): 1) Free state is a form of gas that is stored in bulk pores with great volume and fracture, 2) adsorbed state (20%–80% in proportion) is a form of gas adsorbed on the wall of nano-pore like organic matter (OM) and clay-hosted pore, and 3) dissolved state is a form of natural gas dissolved in the organic matter (kerogen) and/or water within shale rocks. Gas storage and migration within shale are mainly controlled by pore structure, which determines the continuity and pore volume of shale reservoirs. Micropore network of shale reservoirs exhibits a strong heterogeneity and complication resulting from diverse pore morphology, type, and multiscale pore size range (Loucks et al., 2009; Ji et al., 2017). Investigating the structure and evolution of these pores is important for the assessment of gas content and production.
In previous studies, quantitative experimental approaches were used extensively for investigating pore structure characteristics of shale reservoirs, including high pressure mercury intrusion (HPMI), low pressure carbon dioxide, and nitrogen gas adsorption (CO2GA and N2GA), nuclear magnetic resonance (NMR), and so on. (Loucks et al., 2009; Clarkson et al., 2012; Zhang et al., 2017; Xu et al., 2019). These approaches can be employed to measure the pore parameters such as pore-size diameter, pore-volume, and specific surface area. Moreover, qualitative pore properties, like morphology, type, surface porosity, and width of pores in 2D or 3D images, also can be recognized by optical microscopy, field emission-scanning electron microscopy (FE-SEM), and small-angle neutron scattering (Loucks et al., 2009; Clarkson et al., 2012; Zhang L. C. et al., 2020). However, all of these approaches are limited to their own measuring range and strengths. Hence, a combination of multiple methods makes it possible to reveal the full-size pore structure of shale reservoirs.
Recently, the commercial production of the Jiaoshiba shale field in Chongqing shows abundant shale gas resources in southern China (Guo, 2013; Wang et al., 2016). However, the northern Guizhou area, located in the south of Jiaoshiba, experienced a relatively primitive stage of petroleum evaluation and exploration. In particular, high production of gas flow was obtained (Well AY 1) within the Silurian Longmaxi Formation shale, which attained a maximum of about 420,000 m3/d for the natural gas production test, indicating a great potential of shale gas resource in this area (Guo et al., 2019). It has been shown that high organic matter content, high porosity, high formation pressure, and a well-developed micro-fracture network are dominant factors for the high yield of the Jiaoshiba shale gas field (Guo, 2013; Wang et al., 2016). Compared with the Jiaoshiba block, the shale reservoirs in the northern Guizhou area exhibited relatively lower porosity, lower formation pressure, shallower buried depth, and thinner thickness (Jiu et al., 2016; Zhang F. et al., 2020; Gu et al., 2021). These discrepancies are not in accordance with the high gas-bearing content evaluated by the field production test. However, the pore structure of shale reservoirs in this area is rarely investigated because of the low degree of petroleum exploration. Previous studies have indicated that storage space within shale reservoirs is dominated by an organic matter-hosted pore (OMP) and clay minerals pore (CMP) (Jarvie et al., 2007; Ji et al., 2017; Zhang L. C. et al., 2020), although the specific contribution of pore volume remains controversial. In addition, the shale pore system is affected apparently by lithofacies, which represent a depositional feature (Zhang et al., 2018). Thus, the diameter, volume, and morphology of pores with various lithofacies must be concerned.
Moreover, most of the previous studies have studied the Longmaxi formation within the Sichuan basin range (Tang et al., 2015; Guo et al., 2016; Zhang L. C. et al., 2020). However, due to the weak exploration out of the basin, the pore size distribution, pore volumes, and morphology of this formation still lack study. The strata that are out of the basin have experienced different depositional environments and different tectonic movements than the same form within the basin. Therefore, the systematic characterization of the pore structure of this formation is vital for the evaluation and prediction of high-quality reservoir within this formation out of the Sichuan Basin.
In this study, pore structure was systematically investigated based on multiple approaches, including HPMI, CO2GA, N2GA, and SEM. Furthermore, pore characteristics and discrepancies of various shale lithofacies were discussed. The results are of great significance to improve the accuracy of evaluating a shale reservoir from a micro-pores angle and providing a theoretical basis for shale gas exploration and production in the northern Guizhou area.
Geological Setting
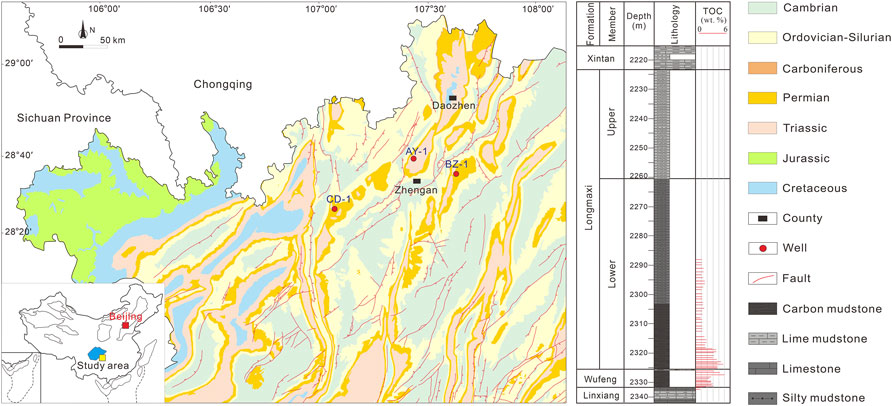
The northern Guizhou area is one of the pilot experimental areas for marine shale gas exploration in China. Regionally, it is situated in the upper Yangtze platform and belongs to the Wuling fold belt between the Western Hunan-Hubei and southeast Sichuan tectonic belt, adjacent to the North China Craton and the South China orogenic belt (Jiu et al., 2016; Gu et al., 2021). The upper Yangtze platform had experienced five main stages of tectonic events, namely the Caledonian, Hercynian, Indosinian, Yanshanian, and Himalayan movements (Chen et al., 2004). During the Late Ordovician to Early Silurian, the enhanced compression of Cathaysia led to an uplifting of the Yangtze Platform, which forms the Xuefeng, Qianzhong, and Chuanzhong paleo-uplifts (Su et al., 2007). Under the effect of global sea level rising and tectonic events, organic matter-rich black shale, called the Longmaxi Formation, was deposited in the upper Yangtze platform during the early Silurian (Guo and Zhang, 2014). The Longmaxi Formation is mainly distributed in the northern Guizhou and western Xuefeng uplifts (Figure 1), while the south and adjacent areas were denuded entirely. This shale succession represents a thickness of 30–120 m, a burial depth of 1000–2500 m, a type of Ⅰ/Ⅱ organic matter, and high thermal maturity. The Longmaxi Formation can be divided into two subsections, namely the lower member and the upper member. The lower member (production layer) is primarily composed of organic matter enrichment black shale and silty shale, while the upper member mainly consists of black silty shale and black-greyish siltstone with low organic matter contents.
Sampling and Methods
A total of 44 shale samples were collected from three wells (AY-1, CD-1, BZ-1) in the lower member of the Longmaxi Formation in the northern Guizhou area, with a burial depth between 1,100 and 2300 m. All samples were conducted for multiple experiments, including TOC, TC, XRD, SEM, HPMI, CO2GA, and N2GA. These experiments were performed at the State Key Laboratory of Petroleum Resources and Prospecting of the China University of Petroleum.
TOC, Ro, and XRD
TOC and total carbon (TC) contents were analyzed using a LECO CS230 Carbon and Sulfur Analyzer. The measurement accuracy is less than 0.1%. Before the measurement, the samples are powdered with a grain size of 200 meshes. For the measurement of total carbon, samples were burned in a flowing oxygen atmosphere at over 1,600°C, and then the formed CO2 was trapped and determined (Moore and Lewis, 1967). For the determination of total organic matter carbon, hydrochloric acid solution (>12.5% concentration) is employed to remove the inorganic carbon of samples, and then dried at a temperature of 60–80°C after dissolution. It was determined by the same method after removing the inorganic carbon, which is composed of carbonates, such as calcite, dolomite, and ankerite within the shale. The carbonate minerals, whose contents are equivalent to inorganic carbon contents, therefore can be obtained by subtracting TOC from TC.
Organic particles of the shale, such as vitrinite-like particles and solid bitumen, were prepared for reflectance measurements. The studied samples were crushed and sieved between 63 μm and 1mm, and then were embedded in epoxy, which was ground and polished to form a smooth surface. Reflectance measurements were performed using a Leica DM4000 M reflected light microscope, in which organic particles were observed with a ×25 objective and 546 nm monochromatic light. The microscope was calibrated with an optical black standard and YAG 0.903% Ro standard (Petersen et al., 2013).
Mineral composition of shale was identified by X-ray diffraction (XRD) (Whittig, 1965), which was performed under a relatively constant level of temperature (∼24°C) and humidity (∼35%). The measurement of mineral composition was calculated using the K-value method after Rietveld refinement (Rietveld, 1969).
FE-SEM
A ZWISS Crossbeam 540 Scanning Electron Microscope was employed to observe the pore morphology within shale reservoirs (Marschall et al., 2005; Chalmers et al., 2012). In order to obtain a smooth surface for intuitive observation, the shale samples were bombarded using an argon-ion polisher at an operating voltage of 8 KV for 4 h and then at 6 KV for 2 h. The samples chamber and working distance were set as a high vacuum mode and secondary electron scanning mode with a working voltage of 15 kV, which can generate the secondary images with a theoretical maximum resolution of 3.5 nm.
N2 and CO2 Adsorption
Low pressure gas adsorption (LPGA) was conducted using the ASAP 2460 Automatic Analyzer, in which CO2 and N2 gas were employed as adsorbates (Gan et al., 1972; Sing, 2001). The shale samples were crushed and sorted with a grain size of 60–80 meshes, then subjected to air-drying and degassing for 72 h before measuring. Residual trace gas and water molecules available in samples can be easy to compete with nitrogen molecules for adsorption sites, resulting in a decrease in nitrogen adsorption capacity (Bustin and Clarkson, 1998; Busch et al., 2006; Labani et al., 2013). Therefore, it is quite necessary to remove moisture content by air-drying and degas for samples prior to gas adsorption analysis.
N2 adsorption measurements of samples were performed at a temperature of liquid-nitrogen (77.35 K). The operating parameters were set to 10 s and 0.01–0.995 corresponding to equilibration interval and relative pressure (P/Po), respectively. Compared with N2 adsorption, CO2 adsorption was performed at a lower pressure (0.0001–0.032) and higher temperature (273 K). Multipoint Brunauer–Emmett–Teller (BET) and Barrent-Joyner-Halenda (BJH) methods were employed to calculate the specific surface area (SSA) and pore size distribution (PSD) for N2 adsorption isotherms (Brunauer et al., 1938; Barrett et al., 1951). Moreover, CO2 adsorption isotherms were interpreted using the density functional theory (DFT) method, which has advantages in interpreting micropores (Adesida et al., 2011).
HPMI
High pressure mercury intrusion (HPMI) (Washburn, 1921; Winslow, 1984) experiment was conducted using a Micromeritics AutoPore IV 9520 porosimeter. The cubic (∼1 cm3) samples were dried for 24 h (∼80°C in temperature) and evacuated to 0.01Pa in a vacuum oven before testing. Detailed experimental procedures could refer to the work by Huang et al. (2019) and Sun et al. (2020). Mercury can be injected into the pore of samples under increasing pressure from 0 to 400 MPa. A continuous mercury intrusion curve then was generated representing an increasing cumulative amount of pore volume. The equivalent pore size was calculated using the Washburn equation which assumed a constant interfacial tension (485 mN/m) and angle (140°) (Washburn, 1921).
Results
TOC, Ro, Mineral Compositions, and Lithofacies
TOC contents of the studied shale range between 0.3% and 6.14%, with an average of 2.9%. Equivalent vitrinite reflectance (Roq) of shale ranges from 2.6% to 3.1%, which is calculated by the vitrinite-like particles and solid bitumen reflectance (Rb) (Jacob, 1985; Petersen et al., 2013), suggesting that the Longmaxi shale was under a high maturity level for dry gas generation, with a type Ⅰ/Ⅱ of kerogen. XRD analysis shows that the mineral compositions of shale mainly consist of quartz (22.5%–81%), clay (9.2%–56.9%), feldspar (3.1%–15.5%), carbonate (0.1%–15.8%), and pyrite (0.1%–29%), with averages of 49.3%, 31.7%, 9.5%, 5.4%, and 4.6%, respectively. Clay minerals are mainly composited of illite and illite-smectite mixed layer, which occupied for more than 90%.
Previous studies have proposed distinct criteria and classification for shale lithofacies according to sedimentary structure, sequence, graptolite fauna and mineral composition (Zhang et al., 2018; Zhang and Fu, 2018; Zhang L. C. et al., 2020). In this study, shale lithofacies were classified based on mineral composition and TOC contents. A ternary plot (Figure 2) of siliceous (Quartz and feldspar), carbonate (dolomite and calcite), and clay minerals were established by mineral composition. It can be divided into four lithofacies associations: Siliceous shale (SS) association, with content of siliceous minerals exceeding 50%; Carbonate shale (CAS) association, with content of carbonate minerals exceeding 50%; Clay shale (CS) association, with content of clay minerals exceeding 50%; and mixed shale (MS) association, with contents of siliceous, carbonate and clay minerals ranging from 25% to 50%. Moreover, it can be further classified as OM-rich shale (TOC>3.0%), OM-moderate shale (TOC between 1.0% and 3.0%), and OM-lean shale (TOC<1.0%) depending on the organic matter contents of shale.
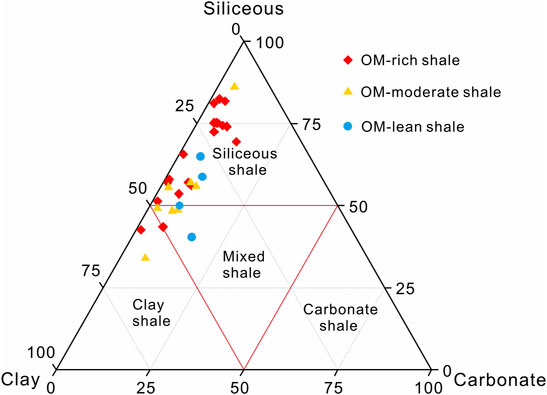
FIGURE 2. Ternary plot of mineral compositions of the Longmaxi Formation in the northern Guizhou area.
FE-SEM Observation
FE-SEM images show that the Longmaxi Formation shales contain diverse types of pores, including organic matter-hosted pores (OMP), clay interlayer pores (CIP), interparticle pores (interP), intraparticle pores (intraP), and microcracks (MC) (Figure 3), among which OMP and CIP were well-developed in the Longmaxi Formation. The OMP represents irregular shapes (such as honeycomb, pit, and oval) with heterogeneous pore width (Figure 3A). Particularly, the organic matter usually occurs accompanied by clay minerals. InterP is mainly developed between different rigid mineral particles and crystals. Their morphology mainly exhibits a slit/polygonal shape (Figures 3D,E).
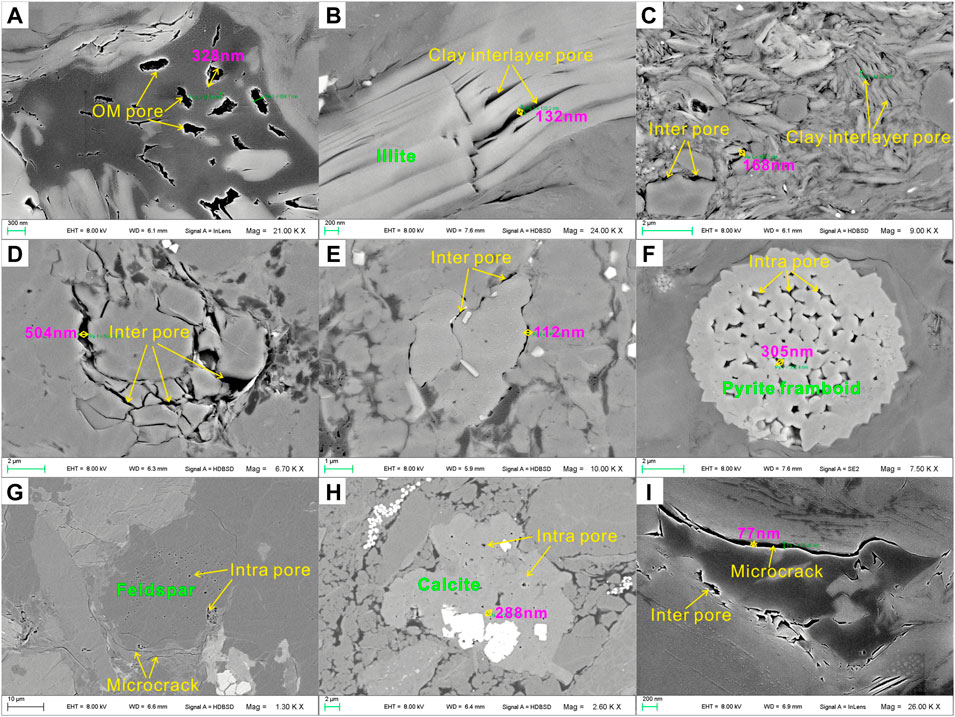
FIGURE 3. Different types of pores within the Longmaxi Formation shale. (A) Organic matter-hosted pores (OMP); (B) clay (illite) interlayer pores (CIP); (C) numerous interlayer pores within clay minerals; (D) interparticle pores around the rim of quartz grains; (E) interparticle pores with a slit shape; (F) intraparticle pores within pyrite framboids; (G) intraparticle (dissolution) pores within feldspar grains; (H) intraparticle (dissolution) pores within calcite grains; (I) microcrack at the boundary of OM.
Compared with interP, most intraP are isolated and appeared as round and oval shapes within crystals, such as dissolution pore within feldspar and calcite (Figures 3G,H). It is observed that abundant intraparticle pores appear within pyrite framboids (Figure 3F). Moreover, abundant microcracks are observed within the shale and occurred apparently at the boundary of organic matter and clay minerals (Figure 3I).
Low-Pressure Gas Adsorption
Low-pressure N2 and CO2 gas adsorptions are employed for calculating the micropore volume and specific surface area for nanometer materials (Clarkson et al., 2013; Zhang et al., 2018). The N2 adsorption and desorption isotherms of different shale lithofacies are exhibited in Figure 4. All the N2 adsorption isotherms represent an anti-S shape corresponding to type IV(a) isotherm as reported by IUPAC (Thommes et al., 2015). When relatively pressure (P/Po) exceeds 0.45, the generation of hysteresis loop between adsorption and desorption isotherms is a major form of type H2 and/or H3 loop referenced to IUPAC (Thommes et al., 2015). It is worth mentioning that the hysteresis loops of OM-rich and OM-moderate samples are inclined to type H2 type, while OM-lean samples are similar to type H3. According to the BET method, the calculated specific surface areas range from 7.1 to 25.3 m2/g, with an average of 16.2 m2/g. And the pore volumes of samples range from 0.0078 to 0.0184 ml/g, with an average of 0.014 ml/g. As shown in Figure 5, the specific surface areas and pore volumes obtained by N2GA, represent an apparent heterogeneity in distinct lithofacies. Obviously, the OM-rich samples have relatively high specific surface areas and pore volumes, followed by OM-moderate samples, whereas OM-lean samples are less than 10 and 0.011 ml/g, respectively. CO2 adsorption isotherms show that the OM-rich samples again display large amounts of adsorption with a maximum of 2.52 ml/g. While the OM-moderate and OM-lean samples exhibit relatively low adsorption capacities with a minimum of 1.05 ml/g.
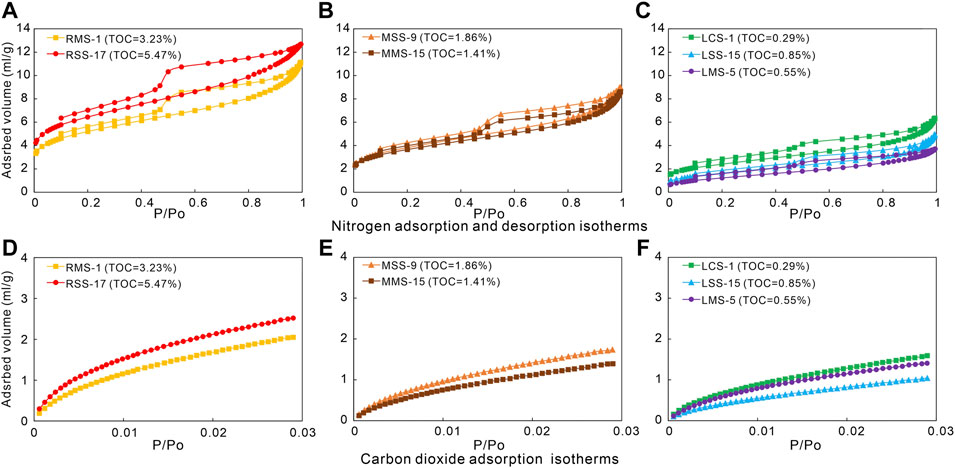
FIGURE 4. Nitrogen gas adsorption/desorption (A–C) and carbon dioxide adsorption (D–F) isotherms of the Longmaxi Formation shale. OM-rich mixed shale (RMS); OM-rich siliceous shale (RSS); OM-moderate mixed shale (MMS); OM-moderate siliceous shale (MSS); OM-lean mixed shale (LMS); OM-lean siliceous shale (LSS); OM-lean clay shale (LCS).
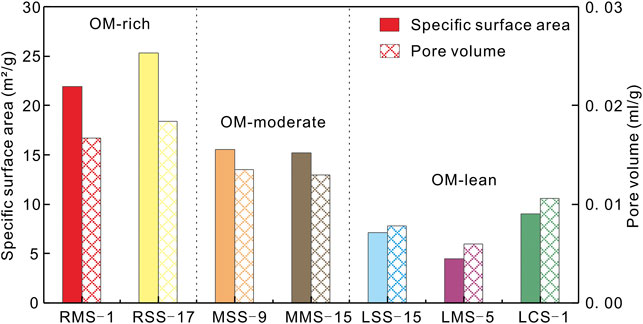
FIGURE 5. Specific surface areas and pore volumes of the Longmaxi Formation shale from N2 adsorption. OM-rich mixed shale (RMS); OM-rich siliceous shale (RSS); OM-moderate mixed shale (MMS); OM-moderate siliceous shale (MSS); OM-lean mixed shale (LMS); OM-lean siliceous shale (LSS); OM-lean clay shale (LCS).
High-Pressure Mercury Intrusion
Unlike gas adsorption, HPMI was used to characterize the relatively large size of pores (Hinai et al., 2014; Tang et al., 2015). As shown in Figure 6, it exhibits an apparent heterogeneity in different lithofacies. The mercury volumes intruded under 413 MPa range from 0.0034 to 0.012 ml/g, with an average of 0.007 ml/g. For OM-rich and OM-moderate shale samples, the intrusion curves exhibit a low slope at the low-pressure phase (<100 MPa), which corresponds to low intrusion volumes. At the high-pressure phase (>100 MPa), the intrusion curves exhibit a rapidly increasing of slope, while the organic matter-lean samples show a relatively flat slope, implying a less development of mesopores in OM-lean shale. Particularly, the mercury intrusion curves of MSS-9 and LCS-1 exhibit a rapidly increasing trend at low pressure (0.11–0.23 MPa). This may be attributed to the generation of cracks when preparing the samples (Giesche, 2006; Liu et al., 2019). The HPMI data therefore should be calibrated by subtracting injection volumes below 0.23 MPa, which can remove the filling of cracks and surface irregularities (Giesche, 2006; Liu et al., 2019).

FIGURE 6. Mercury intrusion-extrusion curves for distinct lithofacies from the Longmaxi Formation. (A) OM-rich shales; (B) OM-moderate shales; (C) OM-lean shales.
A large hysteresis is identified between the intrusion and extrusion curves, illustrating that most of injected mercury still remains in the shale pores space after the pressure recovery. This suggests that the ink-bottle pores are well-developed in the Longmaxi shale, as the ink-bottle pores will trap the intruded mercury in the pore bodies (Ravikovitch and Neimark, 2002).
Discussion
Pore Structure Characteristics
Due to significant dissimilarities and heterogeneities of pore structures within shale reservoirs, as well as the limits of different approaches with respect to their own measuring range and strengths, it is generally tough to reveal the full pore size distribution of shale reservoirs. For this reason, combining different approaches (such as gas adsorption and HPMI) is very necessary to determine a wide range of pore size distribution. Based on the IUPAC (Thommes et al., 2015), pore diameter will be classified as micropores (<2 nm), mesopores (2–50 nm), and macropores (>50 nm), respectively.
As shown in Figure 3, OM pores show irregular shapes and have a wide range of width distribution, which range from several nanometers to hundreds of nanometers. Moreover, interparticle and intraparticle pores are relatively large in width (50 nm–10 μm in range) but fewer in number through SEM observation. Dissolution pores are generally identified within feldspar and carbonate particles, with the main range of 100–5 μm in width. Clay interlayer pores are regarded as a quite important contributor to providing abundant pore space and specific surface areas for adsorbed gas (Clarkson et al., 2013). These pores, whose width mainly ranges from 30 to 500 nm, are very common to distribute within clay platelets. On the other hand, this type of pores is filled partly by numerous OM, forming interconnected OM-IC pore networks system. Microcracks mainly consist of shrinkage cracks and marginal cracks in rigid mineral particles, with a range of about 50–500 nm, 5–50 μm in width and length, respectively. These microcracks are generated by dehydration of clay minerals and thermal pressurization of organic matter, which can consist of a crack-pore network system and improve the permeability of shale reservoirs (Ge et al., 2020). Based on observation of SEM images, it can be concluded that OM-hosted pores and clay interlayer pores are the most common pores within the Longmaxi Formation shale reservoirs, while other types of pores are much less common.
As already mentioned, gas adsorption methods are effective in describing the size distribution of micropores and mesopores. Micropores size was measured by CO2 adsorption, in which the carbon dioxide can absolutely fill the pore space at atmospheric pressure and 273 K temperature (Rouquerol et al., 1994; Ross and Bustin, 2009). Mesopores and part of macropores then can be evaluated by N2 adsorption with relatively low temperatures. Previous studies show that type H2 isotherms with hysteresis loop are common for organic matter-hosted shale as is the presence of mesopores (Clarkson et al., 2013; Kuila and Prasad, 2013). As shown in Figure 4, the OM-rich samples exhibit the highest N2 adsorbed volume with the steepest slope of isotherm, whereas the OM-lean samples have relatively low adsorbed volumes with a flat slope. Similarly, an abundant amount of adsorbed volume at a relative pressure (P/P0) below 0.01 for OM-rich is indicative of the occurrence of numerous micropores. In addition, the isotherms of OM-rich samples show relatively large closed areas of hysteresis loops, illustrating that the OM-hosted pores represent an ink-bottle shape referenced to IUPAC (Thommes et al., 2015). CO2 adsorbed volumes of OM-rich samples, whose isotherms exhibit a steep slope at a relative pressure (P/P0) below 0.005, are also higher than those of OM-moderate and OM-lean samples. It can be inferred that mesopores and micropores volume mainly comes from the contribution of OM-hosted pores. Macropores' volume and size distribution were measured by the HPMI method (Clarkson et al., 2013; Xu et al., 2019). The HPMI curves of different lithofacies samples (Figure 6) exhibit diverse shapes with multiple slopes, suggesting a strong heterogeneity within shale reservoirs.
A wide range of pore size distribution was determined by combining CO2, N2 adsorption, and HPMI analysis in this study. Due to the existence of range discrepancies among different approaches, it is necessary to find connection points among them. Previous studies have proposed that the connection point can be determined when the variation of pore volume per mass of both are equal, i.e (dV/dD) N2GA = (dV/dD) HPMI (Clarkson et al., 2013; Zhang et al., 2017). It is worth noting that the values of dV/dD are apparently marked on Y-axis. Hence, dV/dlog(D) can be used for exhibiting the variation of large pore better compared with dV/dD (Ji et al., 2017). In particular, the inherent features and measuring range of different approaches should be heeded preferentially when the function dV/dlog(D) are overlapping between the two techniques, with multiple connection points. The dV/dlog(D) curves from CO2GA, CO2GA, and HPMI are shown in Figure 7. The curves of CO2GA, N2GA, and HPMI coincide at 1.5 and 130 nm of the X-axis, respectively. Thus, about 1.5 and 130 nm can be used as connection points between these three approaches for this sample.
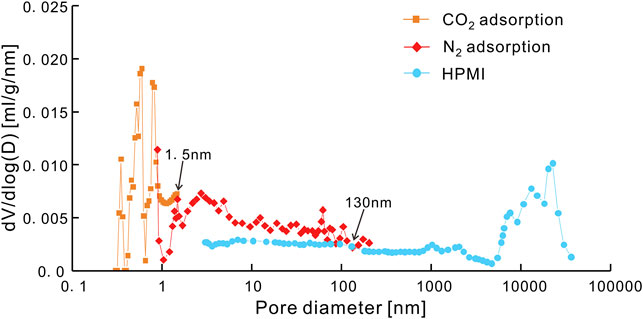
FIGURE 7. Pore size distribution derived from CO2GA, N2GA and HPMI for the Longmaxi Formation shales in the northern Guizhou area.
As shown in Figure 8, the pore diameter of the studied shale samples is mainly distributed within 100 nm corresponding to micropores, mesopores, and part of macropores. These pores play a critical role in providing the space for natural gas storage. Different lithofacies of shale represent massive heterogeneity (Figure 8). The OM-rich samples exhibit relatively high values of dV/dlog(D) within the pore diameter range of 0.3–100 nm, suggesting that organic matter can provide more micropores and mesopores space than the OM-moderate and OM-lean samples. OM-moderate and OM-lean samples are also composed of micropores and mesopores, which have fewer mesopore volumes. The OM-rich and OM-moderate samples show similar micropore size distribution, which have four main peaks at 0.31–0.38, 0.42–0.68, 0.72–0.9, and 1.21–1.68 nm, respectively. While the OM-lean samples lack the peak at 1.21–1.68 nm. The mesopore size of OM-rich mostly is distributed from 2 to 20 nm, with the main peak at 2.4–3.8 nm and a subordinate peak at 9.5–14.1 nm. For macropore, its size is mainly concentrated in the range of 50.8–86.7 nm. OM-moderate samples exhibit a similar distribution of mesopore size, which remains within a range of between 2 and 24 nm. An apparent peak with a pore size of 51.2–65.5 nm is determined for OM-moderate samples, corresponding to the main distribution range of macropore size. However, OM-lean samples contain relatively flat curves of mesopore size distribution. And their macropore size distribution mainly ranges from 51.2 to 74.7 nm.
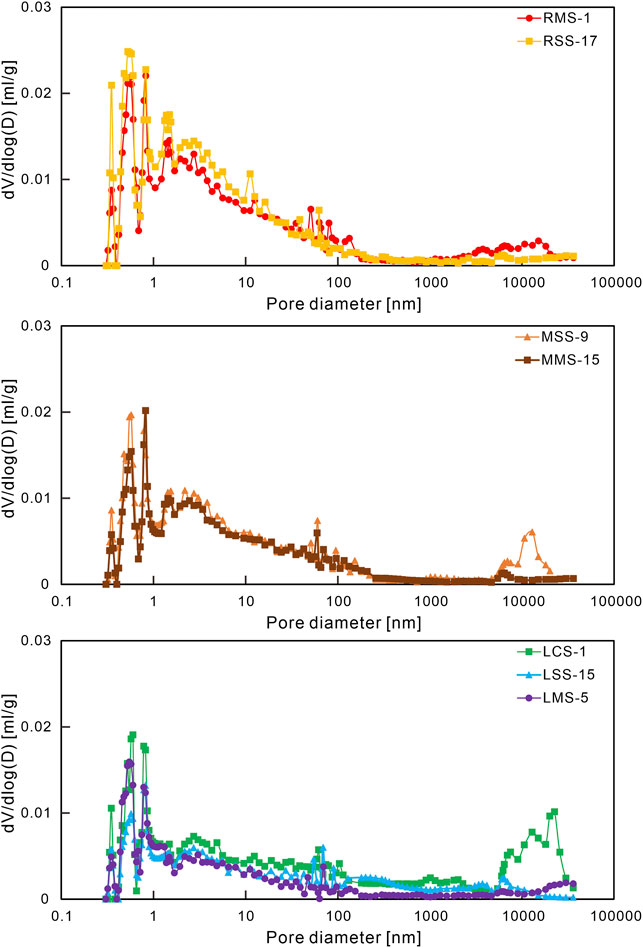
FIGURE 8. Pore size distribution of different lithofacies samples derived from the combination of CO2GA, N2GA and HPMI experiments.
Previous studies have confirmed that micropores and mesopores are the main storage for natural gas adsorption and accumulation within shale reservoirs (Ross and Bustin, 2009; Ge et al., 2020). The volume of micropores, mesopores, and macropores derived from the combination of CO2GA, N2GA, and HPMI experiments are shown in Figure 9. Micropores and mesopores volumes are mainly obtained from CO2GA and N2GA, respectively. The macropores volumes are composed of the combination of HPMI and N2GA with a diameter range of about >130 nm and 50–130 nm, respectively. Figure 9 obviously shows that the OM-rich samples exhibit the largest amount of micropores and mesopores volumes, while macropores show an apparently low value (0.0024 ml/g). They also represent high values of total pore volumes (0.025 ml/g) and specific surface areas (27.4 m2/g). OM-moderate samples have relatively low specific surface areas, micropore, and mesopore volumes, while higher macropore volumes (0.0031 ml/g). Moreover, OM-lean samples show the lowest total pore and mesopore volumes, as well as specific surface areas with an average of 14.16 m2/g. Thus, we can infer that micropores and mesopores are mainly derived from organic matter for the Longmaxi shale reservoirs, in which the OM-hosted pores mostly exhibit ink-bottle shapes based on large hysteresis loops of N2 adsorption isotherms. Whereas the OM-lean shale represents more slit-like pores with few pores space for gas storage. Interestingly, OM-lean clay shale has a higher specific surface area than those of siliceous (TOC=0.85%) and mixed shale (TOC= 0.55%), although it has the lowest value of TOC (0.29%), suggesting that clay minerals also can contribute lots of internal surface area for gas adsorption.
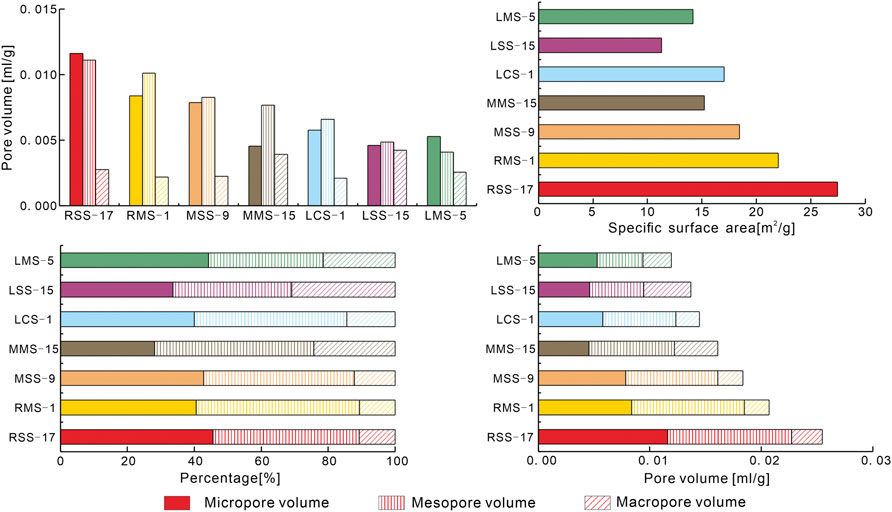
FIGURE 9. Pore volume and specific surface area distribution of derived from the combination of CO2GA, N2GA and HPMI experiments.
Controlling Factors of Pore Development
The shale lithofacies, which are determined by minerals and organic matter composition, color, bedding, and grained size, can reflect a specific sedimentary environment (Eberzin, 1940; Zhang L. C. et al., 2020). Through a detailed comparison of pore structure with different lithofacies, we can infer that the pore structure is significantly affected by shale lithofacies. In order to further investigate the controlling factors of pore development, several proxies are used for making linear fitting with pore volumes and specific surface areas.
As shown in Figure 10, it is obvious that organic matter shows a strong positive correlation (R2=0.86) with micropores volume, suggesting that organic matter plays a major contributor to micropores space. It also has an obvious correlation with mesopores volume, with a correlation coefficient (R2) of ∼0.68. As mentioned above, numerous pores were mostly distributed in the organic matter under the observation of SEM, in which the measured pores width range from several tens to hundreds of nanometers. These results derived from SEM observation are consistent with the positive correlation of mesopores volume with TOC content, despite the SEM can only measure the width of the pores in the 2D area. Thus, we can conclude that OM-host pores are the major contributors to mesopores space.
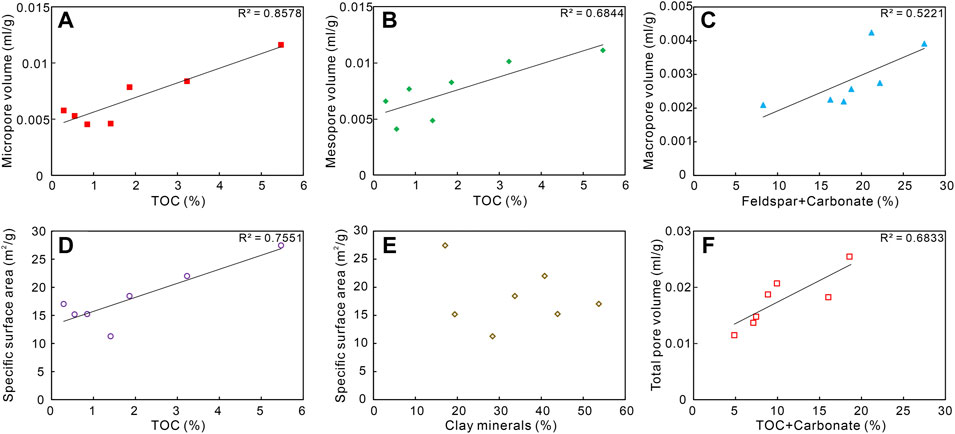
FIGURE 10. Correlation between pore volume and TOC (A,B), feldspar+carbonate (C) and TOC+carbonate (F); correlation between specific surface area and TOC (D), and clay minerals (E).
Moreover, the sum of feldspar and carbonate minerals exhibits an apparent correlation (R2=0.68) with macropores volume. It may be attributed to the well-development of abundant dissolution pores within feldspar and carbonate minerals, in which these pore widths are distributed from hundreds of nanometers to several microns under the observation of SEM. On the other hand, the sum of TOC and carbonate contents (obtained by subtracting TOC from TC) exhibit a strong positive relationship with total pores volume, with a correlation coefficient (R2) of ∼0.68, which can be interpreted by the following two reasons. The first is that the pore volumes of Longmaxi Formation shales are mainly composed of micropores and mesopores, which are mostly controlled by organic matter. For carbonates, their interparticle pore could provide effective storage space. The second is that carbonate minerals can be regarded as a supporter that restrains the compaction and protects residual interparticle pores (Loucks et al., 2012). Furthermore, carbonate minerals are dissolved easily by acidic fluid and then form abundant dissolution macropores.
The specific surface areas of the Longamxi shale exhibit a strong positive correlation with TOC contents, whereas the clay minerals have no significant correlation, suggesting that the organic matter contributes most to the internal surface areas. There is no denying that clay minerals also have strong absorbability and numerous interlayer pores, as well as large internal surface areas, which are conducive to methane adsorption (Ge et al., 2020). However, high abundances of clay minerals generally induce the decrease of most primary pore space, which is condensed by overlying beds during diagenesis (Fishman et al., 2012). Quartz, which is well known to present a good physical and chemical stability, can provide support for the protection of primary pore space during compaction. It has hardly a direct contribution to development of pores within shale reservoirs (Zhang F. et al., 2020).
In summary, we can infer that the pore development is mainly dominated by TOC and carbonate contents. Organic matter plays a critical role in providing most the micropores and mesopores space for natural gas storage. Carbonate minerals are the major contributor to dissolution and interparticle macropores space. OM-rich carbonate-bearing mixed shale may be the lithofacies with the highest pore space in the northern Guizhou area.
Conclusion
1) Four types of lithofacies were recognized for the lower Longmaxi marine shale based on its mineral compositions (carbonate, clay minerals, quartz and feldspar), among which siliceous shale is the primary lithofacies of the lower Longmaxi formation in the northern Guizhou area.
2) OM-hosted pores, clay interlayer pores, interparticle pores, and intraparticle pores (such as dissolution pores) are identified within shale reservoirs. The pore diameter is mainly distributed below 100 nm corresponding to micropores, mesopores and part of macropores. Abundant amounts of OM-hosted pores are regarded as the major contributor to pore space and specific surface areas.
3) Pore volume of the Longmaxi shale remains in a range from 0.011 to 0.025 ml/g, with an average of 0.018 ml/g. The micropores and mesopores volume is mostly controlled by TOC contents. The macropores volume is mainly dominated by carbonate and feldspar minerals. What’s more, total pore volume is mainly dominated by organic matter and carbonate contents. OM-rich carbonate-bearing mixed shale may be the most favorable lithofacies for gas storage of the Longmaxi Formation in the study area.
Data Availability Statement
The original contributions presented in the study are included in the article/Supplementary Material; further inquiries can be directed to the corresponding author.
Author Contributions
WD designed the experiments and wrote the manuscript. RL, FS, NL, YW, and JC performed the experiments. ZZ, LL, and WY analyzed the experimental data. FZ, ZS, and YC collected the data and shale samples. QF modified the manuscript. All authors contributed to the article and approved the submitted version.
Funding
This work was financially supported by the Science Foundation of China University of Petroleum, Beijing (No. 2462021BJRC010), National Natural Science Foundation of China (No. 42002050), and Geological Survey Foundation of Guizhou Province, China (No. 208-9912-JBN-L1D7).
Conflict of Interest
Author NL was employed by Chongqing Gas Field of PetroChina Southwest Oil and Gas Field Company.
The remaining authors declare that the research was conducted in the absence of any commercial or financial relationships that could be construed as a potential conflict of interest.
Publisher’s Note
All claims expressed in this article are solely those of the authors and do not necessarily represent those of their affiliated organizations, or those of the publisher, the editors, and the reviewers. Any product that may be evaluated in this article, or claim that may be made by its manufacturer, is not guaranteed or endorsed by the publisher.
References
Adesida, A. G., Akkutlu, I. Y., Resasco, D. E., and Rai, C. S. (2011). “Kerogen Pore Size Distribution of Barnett Shale Using DFT Analysis and Monte Carlo Simulations,” in SPE Annual Technical Conference and Exhibition (Denver, CO: Society of Petroleum Engineers). doi:10.2118/147397-MS
Barrett, E. P., Joyner, L. G., and Halenda, P. P. (1951). The Determination of Pore Volume and Area Distributions in Porous Substances. I. Computations from Nitrogen Isotherms. J. Am. Chem. Soc. 73, 373–380. doi:10.1021/ja01145a126
Brunauer, S., Emmett, P. H., and Teller, E. (1938). Adsorption of Gases in Multimolecular Layers. J. Am. Chem. Soc. 60, 309–319. doi:10.1021/ja01269a023
Busch, A., Gensterblum, Y., Krooss, B. M., and Siemons, N. (2006). Investigation of High-Pressure Selective Adsorption/desorption Behaviour of CO2 and CH4 on Coals: An Experimental Study. Int. J. Coal Geol. 66 (1-2), 53–68. doi:10.1016/j.coal.2005.07.003
Bustin, R. M., and Clarkson, C. R. (1998). Geological Controls on Coalbed Methane Reservoir Capacity and Gas Content. Int. J. Coal Geol. 38 (1-2), 3–26. doi:10.1016/S0166-5162(98)00030-5
Chalmers, G. R., Bustin, R. M., and Power, I. M. (2012). Characterization of Gas Shale Pore Systems by Porosimetry, Pycnometry, Surface Area, and Field Emission Scanning Electron Microscopy/transmission Electron Microscopy Image Analyses: Examples from the Barnett, Woodford, Haynesville, Marcellus, and Doig Units. Bulletin 96 (6), 1099–1119. doi:10.1306/10171111052
Chalmers, G. R. L., and Bustin, R. M. (2007). The Organic Matter Distribution and Methane Capacity of the Lower Cretaceous Strata of Northeastern British Columbia, Canada. Int. J. Coal Geol. 70, 223–239. doi:10.1016/j.coal.2006.05.001
Chen, X., Li, Y., and Boucot, A. J. (2004). Facies Patterns and Geography of the Yangtze Region, South China, through the Ordovician and Silurian Transition. Palaeogeogr. Palaeoclimatol. Palaeoecol. 204, 353–372. doi:10.1016/S0031-0182(03)00736-3
Clarkson, C. R., Freeman, M., He, L., Agamalian, M., Melnichenko, Y. B., Mastalerz, M., et al. (2012). Characterization of Tight Gas Reservoir Pore Structure Using USANS/SANS and Gas Adsorption Analysis. Fuel 95, 371–385. doi:10.1016/j.fuel.2011.12.010
Clarkson, C. R., Solano, N., Bustin, R. M., Bustin, A. M. M., Chalmers, G. R. L., He, L., et al. (2013). Pore Structure Characterization of North American Shale Gas Reservoirs Using USANS/SANS, Gas Adsorption, and Mercury Intrusion. Fuel 103, 606–616. doi:10.1016/j.fuel.2012.06.119
Eberzin, A. G. (1940). “Middle and Upper Pliocene of the Black Sea Region,” in Statigrafiya SSSR: Neogene SSSR (Stratigraphy of the USSR: Neogene of the USSR) (Moscow: Akad. Nauk SSSR), 8, 477–566.
Fishman, N. S., Hackley, P. C., Lowers, H. A., Hill, R. J., Egenhoff, S. O., Eberl, D. D., et al. (2012). The Nature of Porosity in Organic-Rich Mudstones of the Upper Jurassic Kimmeridge Clay Formation, North Sea, Offshore United Kingdom. Int. J. Coal Geol. 103, 32–50. doi:10.1016/j.coal.2012.07.012
Gan, H., Nandi, S. P., and Walker, P. L. (1972). Nature of the Porosity in American Coals. Fuel 51 (4), 272–277. doi:10.1016/0016-2361(72)90003-8
Ge, T., Pan, J., Wang, K., Liu, W., Mou, P., and Wang, X. (2020). Heterogeneity of Pore Structure of Late Paleozoic Transitional Facies Coal-Bearing Shale in the Southern North China and its Main Controlling Factors. Mar. Petroleum Geol. 122, 104710. doi:10.1016/j.marpetgeo.2020.104710
Giesche, H. (2006). Mercury Porosimetry: a General (Practical) Overview. Part. Part. Syst. Charact. 23, 9–19. doi:10.1002/ppsc.200601009
Gu, Y., Xu, S., Xu, J. J., Zhang, B. R., Yao, S. q., and Zhao, X. K. (2021). Shalereservoir Characteristics of the Lower Silurian Longmaxi Formation in Northern Guizhou. FaultBlock Oil Gas Field 28, 33–39. (in Chinese with English Abstract).
Guo, R. B., Zhang, J. C., Zhao, P. W., Tang, X., and Liu, Z. Y. (2019). Accumulation Conditions and an Analysis of the Origins of Natural Gas in the Lower Silurian Shiniulan Formation from Well Anye 1, Northern Guizhou Province. Energies 12, 4087–87. doi:10.3390/en12214087
Guo, S. (2013). Experimental Study on Isothermal Adsorption of Methane Gas on Three Shale Samples from Upper Paleozoic Strata of the Ordos Basin. J. Petroleum Sci. Eng. 110, 132–138. doi:10.1016/j.petrol.2013.08.048
Guo, T., and Zhang, H. (2014). Formation and Enrichment Mode of Jiaoshiba Shale Gas Field, Sichuan Basin. Petroleum Explor. Dev. 41, 31–40. doi:10.1016/S1876-3804(14)60003-3
Guo, X., Hu, D., Li, Y., Wei, X., Wang, Q., and Zhang, H. (2016). Technologies in Discovery and Exploration of Fuling Shale Gas Field, China. Nr 07, 271–286. doi:10.4236/nr.2016.75024
Hinai, A. A., Rezaee, R., Esteban, L., and Labani, M. (2014). Comparisons of Pore Size Distribution: a Case from the Western Australian Gas Shale Formations. J. Unconv. Oil Gas Resour. 8, 1–13. doi:10.1016/j.juogr.2014.06.002
Huang, H., Chen, L., Dang, W., Luo, T., Sun, W., Jiang, Z., et al. (2019). Discussion on the Rising Segment of the Mercury Extrusion Curve in the High Pressure Mercury Intrusion Experiment on Shales. Mar. Petroleum Geol. 102, 615–624. doi:10.1016/j.marpetgeo.2019.01.027
Jacob, H. (1985). Disperse Solid Bitumens as an Indicator for Migration and Maturity in Prospecting for Oil and Gas. Erdoel, Kohle, Erdgas, Petrochem. 38, 365. doi:10.1093/clp/38.1.211
Jarvie, D. M., Hill, R. J., Ruble, T. E., and Pollastro, R. M. (2007). Unconventional Shale-Gas Systems: The Mississippian Barnett Shale of North-Central Texas as One Model for Thermogenic Shale-Gas Assessment. Bulletin 91, 475–499. doi:10.1306/12190606068
Ji, W., Song, Y., Rui, Z., Meng, M., and Huang, H. (2017). Pore Characterization of Isolated Organic Matter from High Matured Gas Shale Reservoir. Int. J. Coal Geol. 174, 31–40. doi:10.1016/j.coal.2017.03.005
Jiu, K., Ding, W. L., Wang, Z., Huang, Y., Zhu, B. C., Zhang, Z. H., et al. (2016). Reservoir Space and Evolution Process of Longmaxi Shale in the Fenggang Area of Northern Guizhou. Earth Sci. Front. 23, 195–205. (in Chinese with English Abstract).
John B. Curtis1, J. B. (2002). Fractured Shale-Gas Systems. Bulletin 86, 1921–1938. doi:10.1306/61EEDDBE-173E-11D7-8645000102C1865D
Kuila, U., and Prasad, M. (2013). Specific Surface Area and Pore-Size Distribution in Clays and Shales. Geophys. Prospect. 61, 341–362. doi:10.1111/1365-2478.12028
Labani, M. M., Rezaee, R., Saeedi, A., and Hinai, A. A. (2013). Evaluation of Pore Size Spectrum of Gas Shale Reservoirs Using Low Pressure Nitrogen Adsorption, Gas Expansion and Mercury Porosimetry: A Case Study from the Perth and Canning Basins, Western Australia. J. Petroleum Sci. Eng. 112, 7–16. doi:10.1016/j.petrol.2013.11.022
Liu, D., Li, Z., Jiang, Z., Zhang, C., Zhang, Z., Wang, J., et al. (2019). Impact of Laminae on Pore Structures of Lacustrine Shales in the Southern Songliao Basin, NE China. J. Asian earth Sci. 182, 103935. doi:10.1016/j.jseaes.2019.103935
Loucks, R. G., Reed, R. M., Ruppel, S. C., and Hammes, U. (2012). Spectrum of Pore Types and Networks in Mudrocks and a Descriptive Classification for Matrix-Related Mudrock Pores. Bulletin 96, 1071–1098. doi:10.1306/08171111061
Loucks, R. G., Reed, R. M., Ruppel, S. C., and Jarvie, D. M. (2009). Morphology, Genesis, and Distribution of Nanometer-Scale Pores in Siliceous Mudstones of the Mississippian Barnett Shale. J. Sediment. Res. 79, 848–861. doi:10.2110/jsr.2009.092
Marschall, P., Horseman, S., and Gimmi, T. (2005). Characterisation of Gas Transport Properties of the Opalinus Clay, a Potential Host Rock Formation for Radioactive Waste Disposal. Oil Gas Sci. Technol. - Rev. IFP 60 (1), 121–139. doi:10.2516/ogst:2005008
Moore, C. B., and Lewis, C. F. (1967). Total Carbon Content of Ordinary Chondrites. J. Geophys. Res. 72 (24), 6289–6292. doi:10.1029/JZ072i024p06289
Nelson, P. H. (2009). Pore-throat Sizes in Sandstones, Tight Sandstones, and Shales. Bulletin 93, 329–340. doi:10.1306/10240808059
Petersen, H. I., Schovsbo, N. H., and Nielsen, A. T. (2013). Reflectance Measurements of Zooclasts and Solid Bitumen in Lower Paleozoic Shales, Southern Scandinavia: Correlation to Vitrinite Reflectance. Int. J. Coal Geol. 114, 1–18. doi:10.1016/j.coal.2013.03.013
Ravikovitch, P. I., and Neimark, A. V. (2002). Experimental Confirmation of Different Mechanisms of Evaporation from Ink-Bottle Type Pores: Equilibrium, Pore Blocking, and Cavitation. Langmuir 18, 9830–9837. doi:10.1021/la026140z
Rietveld, H. M. (1969). A Profile Refinement Method for Nuclear and Magnetic Structures. J. Appl. Cryst. 2, 65–71. doi:10.1107/s0021889869006558
Ross, D. J. K., and Marc Bustin, R. (2009). The Importance of Shale Composition and Pore Structure upon Gas Storage Potential of Shale Gas Reservoirs. Mar. Petroleum Geol. 26, 916–927. doi:10.1016/j.marpetgeo.2008.06.004
Rouquerol, J., Avnir, D., Fairbridge, C. W., Everett, D. H., Haynes, J. M., Pernicone, N., et al. (1994). Recommendations for the Characterization of Porous Solids (Technical Report). Pure Appllied Chem. 66, 1739–1758. doi:10.1351/pac199466081739
Sing, K. (2001). The Use of Nitrogen Adsorption for the Characterisation of Porous Materials. Colloids Surfaces A Physicochem. Eng. Aspects 187-188, 3–9. doi:10.1016/S0927-7757(01)00612-4
Su, W. B., Li, Z. M., Ettensohn, F. R., Johnson, M. E., Huff, W. D., Wang, W., et al. (2007). Distribution of Black Shale in theWufengeLongmaxi Formations (Ordovician-Silurian), South China: Major Controlling Factors and Implications. Earth Science-Journal China Univ. Geosciences 32, 819–827. (In Chinese with English abstract).
Sun, M., Zhang, L., Hu, Q., Pan, Z., Yu, B., Sun, L., et al. (2020). Multiscale Connectivity Characterization of Marine Shales in Southern China by Fluid Intrusion, Small-Angle Neutron Scattering (SANS), and FIB-SEM. Mar. Petroleum Geol. 112, 104101. doi:10.1016/j.marpetgeo.2019.104101
Tang, X., Jiang, Z., Li, Z., Gao, Z., Bai, Y., Zhao, S., et al. (2015). The Effect of the Variation in Material Composition on the Heterogeneous Pore Structure of High-Maturity Shale of the Silurian Longmaxi Formation in the Southeastern Sichuan Basin, China. J. Nat. Gas Sci. Eng. 23, 464–473. doi:10.1016/j.jngse.2015.02.031
Thommes, M., Kaneko, K., Neimark, A. V., Olivier, J. P., Rodriguez-Reinoso, F., Rouquerol, J., et al. (2015). Physisorption of Gases, with Special Reference to the Evaluation of Surface Area and Pore Size Distribution (IUPAC Technical Report). Pure Appllied Chem. 87, 1051–1069. doi:10.1515/pac-2014-1117
Wang, R., Ding, W., Zhang, Y., Wang, Z., Wang, X., He, J., et al. (2016). Analysis of Developmental Characteristics and Dominant Factors of Fractures in Lower Cambrian Marine Shale Reservoirs: A Case Study of Niutitang Formation in Cen'gong Block, Southern China. J. Petroleum Sci. Eng. 138, 31–49. doi:10.1016/j.petrol.2015.12.004
Washburn, E. W. (1921). The Dynamics of Capillary Flow. Phys. Rev. 17, 273–283. doi:10.1103/physrev.17.273
Whittig, L. D. (1965). “X-Ray Diffraction Techniques for Mineral Identification and Mineralogical Composition,” in Methods of Soil Analysis: Part 1 Physical and Mineralogica Properties Including Statistics of Measurement and Sampling 9, 671–698. doi:10.2134/agronmonogr9.1.c49
Winslow, D. N. (1984). Advances in Experimental Techniques for Mercury Intrusion Porosimetry. Surface And Colloid Science. Boston, MA: Springer, 259–282. doi:10.1007/978-1-4615-7972-4_6
Xu, H., Zhou, W., Zhang, R., Liu, S., and Zhou, Q. (2019). Characterizations of Pore, Mineral and Petrographic Properties of Marine Shale Using Multiple Techniques and Their Implications on Gas Storage Capability for Sichuan Longmaxi Gas Shale Field in China. Fuel 241, 360–371. doi:10.1016/j.fuel.2018.12.035
Zhang, F., Huang, Y., Dai, C. P., Li, G. Q., Lan, B. F., Du, Y., et al. (2020b). Characteristics on Shale Reservoirs of Wufeng-Longmaxi Formations, Northern Guizhou Province. Nat. Gas Explor. Dev. 43, 94–101. (in Chinese with English Abstract).
Zhang, L. C., Lu, S. F., Xiao, D. S., and Li, B. (2017). Pore Structure Characteristics of Tight Sandstones in the Northern Songliao Basin, China. Mar. Petroleum Geol. 88, 170–180. doi:10.1016/j.marpetgeo.2017.08.005
Zhang, L. C., Xiao, D. S., Lu, S. F., Jiang, S., Chen, L., Guo, T. L., et al. (2020a). Pore Development of the Lower Longmaxi Shale in the Southeastern Sichuan Basin and its Adjacent Areas: Insights from Lithofacies Identification and Organic Matter. Mar. Petroleum Geol. 122, 104662. doi:10.1016/j.marpetgeo.2020.104662
Zhang, L., Li, B., Jiang, S., Xiao, D., Lu, S., Zhang, Y., et al. (2018). Heterogeneity Characterization of the Lower Silurian Longmaxi Marine Shale in the Pengshui Area, South China. Int. J. Coal Geol. 195, 250–266. doi:10.1016/j.coal.2018.05.015
Zhang, M., and Fu, X. H. (2018). Study of the Characteristics of Marine–Terrigenous Facies Shale from the Permo-Carboniferous System in the Guxian Block, Southwest Qinshui Basin. Energy Fuels 32, 1096–1109. doi:10.1021/acs.energyfuels.7b02556
Zou, C. N., Dong, D. Z., Wang, Y., Li, X., Huang, J., Wang, S., et al. (2015). Shale Gas in China: Characteristics, Challenges and Prospects (I). Petroleum Explor. Dev. 42, 689–701. doi:10.1016/S1876-3804(15)30072-0
Keywords: shale reservoirs, pore size distribution, pore structure, organic matter, gas adsorption
Citation: Du W, Lin R, Shi F, Luo N, Wang Y, Fan Q, Cai J, Zhang Z, Liu L, Yin W, Zhao F, Sun Z and Chen Y (2022) Multi-Scale Pore Structure Characterization of Silurian Marine Shale and Its Coupling Relationship With Material Composition: A Case Study in the Northern Guizhou Area. Front. Earth Sci. 10:930650. doi: 10.3389/feart.2022.930650
Received: 28 April 2022; Accepted: 02 June 2022;
Published: 11 July 2022.
Edited by:
Kun Zhang, Southwest Petroleum University, ChinaReviewed by:
Wenming Ji, China University of Petroleum (East China), ChinaHexin Huang, Chang’an University, China
Copyright © 2022 Du, Lin, Shi, Luo, Wang, Fan, Cai, Zhang, Liu, Yin, Zhao, Sun and Chen. This is an open-access article distributed under the terms of the Creative Commons Attribution License (CC BY). The use, distribution or reproduction in other forums is permitted, provided the original author(s) and the copyright owner(s) are credited and that the original publication in this journal is cited, in accordance with accepted academic practice. No use, distribution or reproduction is permitted which does not comply with these terms.
*Correspondence: Qingqing Fan, UWluZ3FpbmdGYW5DVVBAMTYzLmNvbQ==
 Wei Du1,2
 Qingqing Fan