- 1School of Management Science, GuiZhou University of Finance and Economics, Guiyang, China
- 2Guizhou Province Key Laboratory of Ecological Protection and Restoration of Typical Plateau Wetlands, Guizhou University of Engineering Science, Guizhou, China
- 3Space Star Technology Co., Ltd., Chengdu, China
The upper reaches of the Minjiang River are an important ecological barrier to the upper reaches of the Yangtze River and Chengdu Plain. They are also the water resources of Chengdu Plain. To protect the headwater ecosystems, it is necessary to carry out quantitative research on soil erosion in this area. This study mainly applies the USLE model to quantitatively evaluate the spatial distribution of ecosystem services on soil erosion and soil conservation. The evaluation is based on the following data: remote sensing image, meteorological radiation data, DEM, soil types, physical and chemical properties of the soil, vegetation types, and land use status. With advanced Earth observation technology, satellite remote sensing images about terrestrial vegetation and other evaluation parameters can be obtained in real time. The seasonal changes in vegetation coverage and the physical and chemical properties of soil have been fully considered. The results show that 1) the value of rainfall erosivity factor (R) is between 85.02 and 588.69 MJ•mm/(hm2•h•a), and its spatial distribution is consistent with that of annual average precipitation. 2) Soil erodibility factor (K) is between 0.12 and 0.30 (t hm2 h) •(hm2 MJ mm), showing zonal distribution, and is related to soil types. 3) Slope length and gradient factor (LS) range from 0.03 to 46.16. It is positively correlated with topographic relief. 4) Soil conservation measure factor (P) ranges from 0 to 1 and is determined by the land use and coverage. 5) Rainfall has a dominant impact on soil erosion, and the study area with violent and intense erosion reaches 17,302.17 km2, accounting for 69.81% of the total area. The soil conservation amount (T) in the study area is 283.45 million tons, and the ecosystem services are worth 434.48 million yuan. 6) RS and GIS techniques enable quick estimation. However, this assessment contains considerable uncertainty. It is still hard to reveal the physical process of soil erosion with empirical models.
1 Introduction
Soil erosion refers to the impact of water or wind that detaches and removes soil particles. This occurs gradually and causes the soil to be deteriorated, transported, and finally settled down in other places (Greenland and Szabolcs, 1994). Soil erosion is not only the most common geographical phenomenon on the earth’s surface but also the major cause of soil fertility loss and land degradation. Soil deterioration due to erosion and surface runoffs become increasingly severe worldwide. Therefore, mitigating such problems will help restore the local ecosystem. Soil is critical to the ecosystem as it can maintain the system’s stability. In turn, the stability of the ecosystem is also vital to soil conservation. For example, vegetation’s canopy, litter, and roots can reduce the erosive effects from raindrops and surface runoffs. Thereby, the soil will have better erosion resistance, more nutrients, and lower loss (Chen et al., 2012). Universal Soil Loss Equation (USLE) is commonly used to assess soil conservation in different regions (Wei et al., 2021a; Azizian and Koohi, 2021; Fan et al., 2021; Jemai et al., 2021).
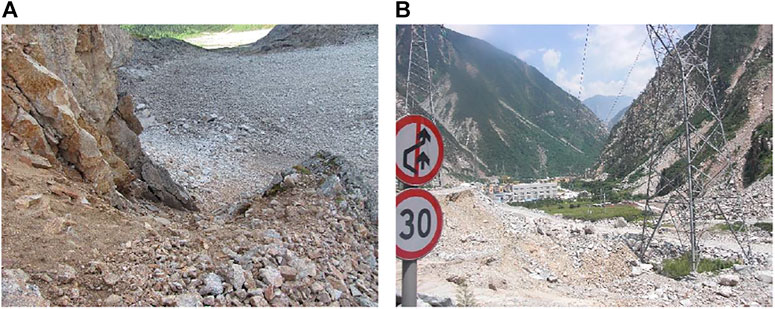
China has a vast territory and large population, but its arable land is very small, threatening food security. Soil erosion may lead to soil infertility. Such loss will affect the sustainable development of both economy and society (Qi et al., 2011). Located in the transition zone between the Qinghai–Tibet Plateau and Sichuan Basin, the upper reaches of the Minjiang River are not only a vital ecological barrier in the upper reaches of the Yangtze River and Chengdu Plain but also a critical water resource for the Plain. To protect the ecological security of the headwater systems, quantitative research on soil erosion should be carried out in this area, with economic evaluation of ecological services. Affected by the 2008 Wenchuan earthquake, soil erosion happens more frequently than before in the upper reaches of the Minjiang River (Figure 1). Soil resources are essential for human life, which makes the study of soil erosion significant in this area. One method for the study is USLE, which is a popular practical measurement of soil loss. This empirical model is developed by the U.S. Department of Agriculture in the middle of the 20th century. Its initial mission is to estimate the long-term soil erosion of farmland in the U.S. in a quantitative way. The USLE is developed based on on-site measurement of soil loss and runoffs in more than 10,000 observation sites across the U.S. This model enables a quantified estimation of soil erosion through the multiplication of six factors.
There are two methods to calculate soil erosion, and the traditional method is field measurement and analysis. However, this method requires arduous fieldwork, especially when large areas are involved. As there are many uncertainties in large-scale transformation, it has limited application. Another method is based on a variety of empirical or applied physics professional models, including USLE (Universal Soil Loss Equation), WEPP (Water Erosion Prediction Project), ANSWERS (A Real Nonpoint Source Watershed Environment Response Simulation), and LISEM (Limburg Soil Erosion Model) (Wei et al., 2021b). The WEPP model suits the quantification of sand loss in lands for agriculture and animal husbandry (Flanagan et al., 1995). ANSWERS model works well in analyzing the impact of environmental factors on soil erosion (Beasly et al., 1980). The LESEM model is based on secondary rainfall to simulate sediment yield and abortion, which is a secondary process analysis model with a relatively perfect physical mechanism (De Roo, 1996). The model variables and parameters are numerous, the mechanism is relatively complex, and the calibration is difficult. In comparison, the USLE model has a simple mechanism, easy data acquisition, and fewer limitations in the spatiotemporal scale, which is beneficial to the quantitative study of soil erosion at the regional rainfall scale (Wischmeier and Simith, 1965). The USLE model has been widely applied since the 1980s. It has attracted a great deal of attention in the academic circle (Benavidez et al., 2018; Mondal et al., 2018; Peng et al., 2018; Tung et al., 2018; Alewell et al., 2019; Lin et al., 2019; Zhang et al., 2019). The USLE model is a good choice for soil erosion studies in medium-scale watersheds. However, many studies have ignored the seasonal changes in vegetation coverage and precipitation during the calculation of the precipitation erosivity factor. In such studies, total annual rainfall and single-phase vegetation coverage factors are often adopted, but this may affect the results of the USLE model. Quick estimation shall be accomplished with the RS and GIS techniques. With advanced earth observation technology, satellite remote sensing images about terrestrial vegetation and other evaluation parameters can be obtained in real time. This study adopts the USLE model and has fully considered seasonal changes in vegetation coverage and the physical and chemical properties of the soil. With the scientific method, it begins the quantitative assessment of the soil erosion in the upper reaches of the Minjiang River. By studying soil erosion and related ecological service value in this area, this study provides a reference for soil erosion control and the ecological incentives offered to people in exchange for ecological service.
Study Area and Data
Study Area
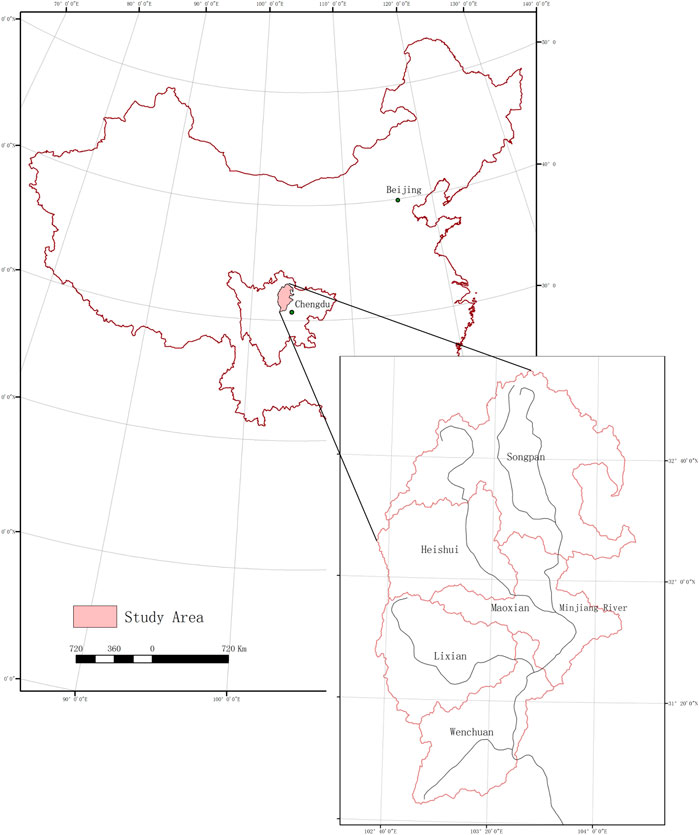
The study area (102°35′18.026″E-104°15′14.817″E, 30°45′38.072″N-33°09′12.734″N) is the upper reaches of the Minjiang River in Aba Tibetan and Qiang Autonomous Prefecture of Sichuan Province, China (Figure 2). The Minjiang River, an important source of the Yangtze River, is a tributary with a large discharge in the Yangtze drainage area. It rises from the southern foot of the Minshan Mountain, and the part above the head of the Dujiangyan River is called the upper reaches of the Minjiang River. The upper reaches of the Minjiang River are in the transition zone from the mountainous northeastern edge of the Qinghai–Tibet Plateau to the Sichuan Basin. In terms of the farming method, this area belongs to typical semi-agricultural and semi-pastoral areas (Zhang, 2007). Based on administrative divisions, the study area includes five counties: Wenchuan County, Mao County, Li County, Heishui County, and Songpan County, with an area of 24,783.08 km2. The total length of the mainstream in the upper reaches is 337 km (Wang, 1997), with a population of over 400,000.
Remote Sensing Imagery
This study obtained three phases of Landsat8 OLI images that covered the study area. The three phases had three scenes (130, 37; 130, 38; and 130, 39), with a spatial resolution of 30 m. The time phases were December 2013, June 2014, and February 2015. The cloud cover of all images was less than 3%. Remote sensing images were downloaded from the USGS website.
Meteorological Data
Eight meteorological stations inside and nearby the study area (Malkang, Xiaojin, Songpan, Dujiangyan, Hongyuan, Ya’an, Ruoergai, and Pingwu) were selected for this study. Monthly and annual average rainfall of each meteorological station was collected. The rainfall data ranged from 1980 to 2013, spanning 34 years. Meteorological data were obtained from China Meteorological Administration.
Other Data
Besides remote sensing image and meteorological radiation data, we also obtained other data, including DEM, soil types, vegetation types, land use status, and physical and chemical properties of the soil in the study area. DEM data were downloaded from the USGS website. The resolution of DEM was 30 m. Data about soil types, physical and chemical properties, vegetation types, and land use status were obtained from the Sichuan Academy of Land Science and Technology.
Methods
Soil conservation amount is an indicator of the ecosystem’s ability to conserve the soil. It can be measured by subtracting the actual amount of soil erosion from the potential amount of soil erosion in the same place. The actual amount of soil erosion refers to the amount of eroded soil. The potential amount of soil erosion refers to the amount of eroded soil when there is no vegetation coverage or land management. The actual amount of soil erosion can be directly calculated with the USLE equation. The potential amount can be calculated by canceling the vegetation coverage and management factor C and soil conservation factor P in the USLE equation (Guo et al., 2012). The calculation formula is listed as follows (Eq. 1, Eq. 2):
where As denotes the modulus of actual soil erosion, with the unit of t/(hm2·a); and Aq represents the modulus of potential soil erosion, with the unit of t/(hm2*a). When the soil erosion modulus is multiplied by the land area, the amount of soil erosion can be obtained. R indicates the rainfall erosivity factor, with the unit of MJ·mm/(hm2·h·a); K is the soil erodibility factor, with the unit of (t·hm2·h)/(hm2·MJ·mm); LS is the factor of slope length and gradient; C means the factor of vegetation coverage and management; P is the factor of soil conservation; and LS, C, and P are dimensionless factors.
Calculation of Rainfall Erosivity Factor (R)
Rainfall erosivity (R), which is the potential kinetic energy of rainfall to erode soil, reflects the influence of rainfall on soil erosion. As a dominant factor in the soil loss equation, this factor depends on different parameters, such as rainfall amount, precipitation duration, and rainfall kinetic energy (Sun et al., 2011; Liu et al., 2012; Zhang et al., 2014). Traditional methods cannot directly measure rainfall erosivity, so it is often roughly estimated based on rain intensity and rainfall amount. Among the estimation methods, Weschmeier’s empirical formula (McCool et al., 1982) (Eq. 3) is widely acknowledged. This formula derives the erosivity based on the long-term annual and monthly data on the average precipitation of the study area.
where R is the rainfall erosivity factor, with the unit of MJ·mm/(hm2·h·a). Pm represents years of annual average rainfall, with the unit of mm.
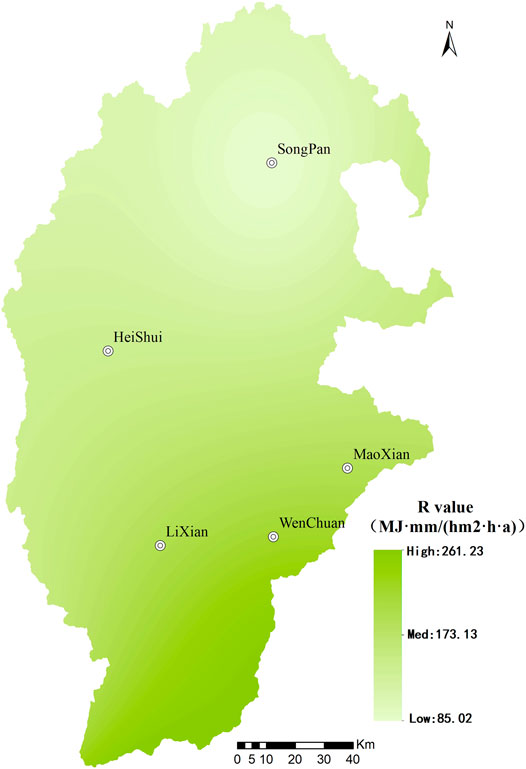
The spatial and temporal distribution of precipitation is uneven in the study area. Therefore, the precipitation data change greatly in different periods and seasons. For example, winter has little precipitation, but summer receives heavy precipitation. Rainfall in this area is high in the wet season. To improve the accuracy of rainfall erosivity, this study has adopted meteorological records from eight meteorological stations. These stations are in the study area and areas adjacent to it (Maerkang, Xiaojin, Songpan, Dujiangyan, Hongyuan, Ya’an, Ruoergai, and Pingwu). This study collects and processes the precipitation data over 34 years from all meteorological stations (1980–2013), including the monthly average rainfall and the annual average rainfall. The rainfall erosivity factor (R) of each meteorological station is calculated based on Eq. 3. According to the results, the rainfall erosivity factor (R) is positively correlated with precipitation. The rainfall erosivity factor (R) is 128.57 in Maerkang, 88.61 in Xiaojin, 85.02 in Songpan 253.23 in the Dujiangyan, 107.71 in the Hongyuan, 588.69 in Ya’an, 98.36 in Zoige, and 156.78 in Pingwu. The interpolation algorithm is applied to calculate the R value based on sample data in meteorological stations (Figure 3).
Calculation of Soil Erodibility Factor (K)
Soil erodibility factor (K), which tests soil’s sensitivity to erosion, is a basic factor in the soil loss equation and an important parameter to predict soil erosion (Zhang et al., 2007). In the past, most studies on soil erodibility focused on the relationship between soil properties and soil erosion. It was not until the 1960s, when Wischmeier proposed the soil erodibility index, (Olson and Wischmeier, 1963) that scholars began to estimate soil erodibility. However, the calculation of soil erodibility factor had to wait until the 1990s when Williams et al. proposed a formula in their EPIC (Erosion-Productivity Impact Calculator) model. Therefore, it was not until the 1990s when the calculation of factor K enters became mature. The calculation of soil erodibility factor K in the study area is shown Eq. 4 (Sharpley and Williams, 1990; Guo et al., 2012).
where K is the soil erodibility factor, with the unit of (t·hm2·h)·(hm2·MJ·mm). SAN is the sand content (%), with the particle size of 0.02–2 mm. SIL shows the silt content (%), with particle size of 0.002–0.02 mm. CLA denotes the content of clay particles (%), with a particle size of less than 0.002 mm. C represents the organic carbon content (%).
According to the Soil Type Distribution Map of Sichuan Province, the study area shows strong soil zonality. It includes 11 types of soil, distributed from the North to the South, which are as follows: 1) mountain meadow soil, 2) mountain brown soil, 3) mountain ash soil, 4) mountain red–brown soil, 5) mountain gray–brown soil, 6) mountain gray-cinnamon soil, 7) cold sand yellow mud, 8) plateau black meadow soil, 9) alpine cold desert soil, 10) swamp soil, and 11) mine yellow mud.
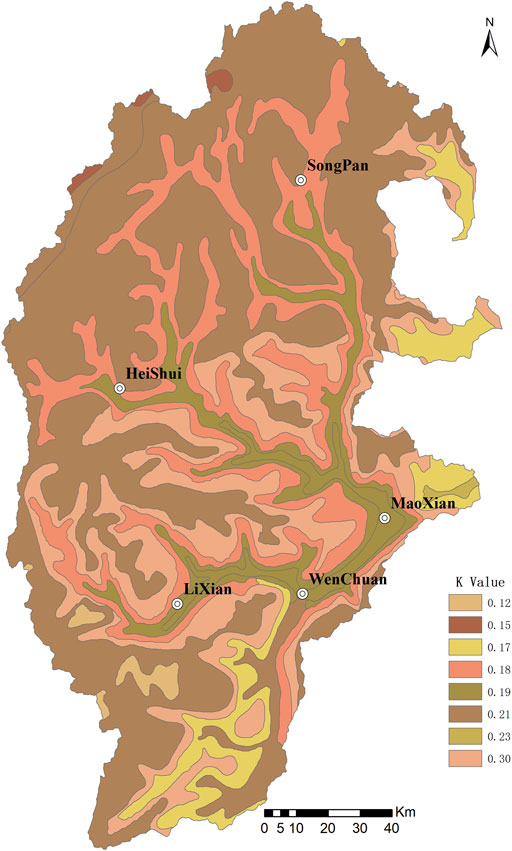
This study takes Sichuan Soil Investigation as a reference as it offers detailed documentation of soil attributes in the study area. The study finds parameters about soil types (Table 1), sand content (SAN), silt content (SIL), clay content (CLA), and organic carbon content (C) of the study area. With formula 4, it successfully generates the K value for every soil type (Table 1) and plots the K-value distribution map in the upper reaches of the Minjiang River (Figure 4).

TABLE 1. Main soil physical and chemical parameters and K value in the upper reaches of the Minjiang river.
Calculation of Slope Length and Gradient Factor (LS)
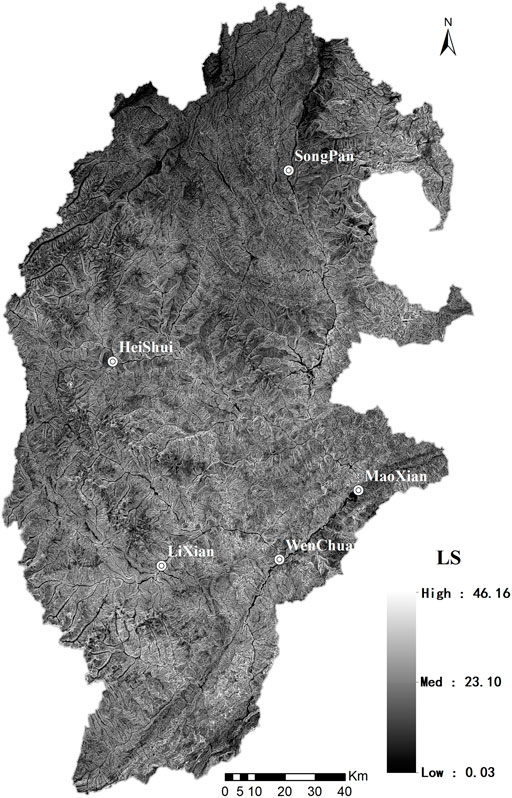
The factor of slope length and gradient (LS), which shows the slope’s influence on soil erosion, is important for calculating regional soil erosion. It is expressed as LS during the calculation. Generally, the amount of soil erosion increases with the gradient (Yang et al., 2010). Macool’s research (McCool et al., 1989) indicated that the maximum gradient for applying USLE is 15°. However, most slopes in the upper reaches of the Minjiang River are steeper than 15°, especially those in Wenchuan County and Li County. As the study area belongs to the alpine canyon landform, some slopes in this area are steeper than 75°. Therefore, when calculating the slope factor, Macool’s slope formula is used for less-than-15° slopes, and Liu’s slope formula is used for steeper-than-15°slopes (Liu et al., 1997). The formulas are as follows (Formula 5):
Using current geographic information software to extract the slope length factor is laborious. Many researchers who have contributed to this effort (Sujatha and Sridhar, 2018; Sujatha and Sridhar, 2019) mainly focus on extracting the slope length factor from the DEM. Based on physics knowledge, Moore proposed to calculate LS with the theory of unit flow power (Moore and Wilson, 1992). Wilson, Williams, and Desmet also had in-depth research on calculating slope length in the catchment (Wilson, 1986). Hickey and Van Remortel applied the digital elevation model (DEM) to calculate the slope gradient (Hickey et al., 2001; Van Remortel et al., 2004). Fu et al. applied different formulas according to the ranges of slope gradients. Moreover, they developed a program to calculate the slope length factor in Visual Studio 2010. This is an effective tool to extract the slope gradient factor (Fu et al., 2015). Tang et al. proposed a parallel grid-DEM method to calculate the slope length of the erosion. In their study, the strategy of buffer updated calculation is adopted to overcome data dependence in the parallel calculation (Liu et al., 2015). In this study, the slope length approximate method is used to calculate slope length factor (L). The slope length in the upper reaches of the Minjiang River is calculated based on a 30-m resolution DEM. Eq. 6 and Eq. 7 show the detailed calculation:
where
L indicates the slope length factor,
Based on the study area’s DEM, the slope length map and the slope map are extracted through the spatial analysis function of the ArcGIS platform. The slope length and gradient factor (LS) diagram of the study area are plotted with Eqs 5, 6, 7 (Figure 5).
Calculation of Vegetation Coverage and Management Factors (C)
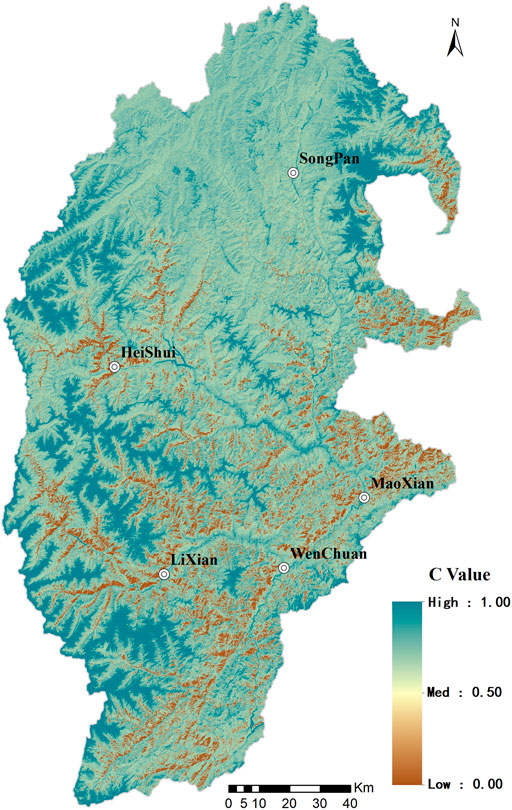
Vegetation coverage and management factors (C) are vital indicators to evaluate the ability of vegetation cover to resist soil erosion. Under the same condition of soil type, terrain gradient, and precipitation, the vegetation coverage and management factor is the ratio of the amount of soil loss between soil land with high vegetation coverage or field management and bare land where clear plowing is carried out. This value ranges from 0 to 1 and is dimensionless. This value reflects the ability of soil under specific vegetation coverage in resisting resist erosion. The larger the value, the weaker the resistance to soil erosion under the corresponding vegetation coverage will be. That is to say, the larger the value, the worse the soil erosion will be (Zhang et al., 2001). In the USLE model, the creator provides a lookup table to confirm the soil loss ratio. To obtain the C value, the user should select the corresponding vegetation cover type and land use type and then query in the lookup table to obtain the C value (Wischmeier and Smith, 1978); in the Revised Universal Soil Loss Equation (RUSLE), the soil loss ratio is determined by a series of parameters, such as land-use type structure (PLU), vegetation cover (CC), surface roughness (SR), soil moisture content (SM), and ground surface (SC). The soil loss ratio can be obtained by multiplying these five sub-factors. Based on the work schedule and insufficient evidence of the current study area, it is difficult to obtain the abovementioned parameters and related data. Therefore, it is necessary to establish a simple algorithm suitable for a larger scale range of factors. This study takes advantage of remote sensing (RS) technology to extract the C factors effectively. In recent years, many researchers have contributed to applying remote sensing technology to extract large-scale C factors efficiently, and their algorithms are constantly improving (Wu et al., 2012). In terms of applying remote sensing technology to extract C factors, the most commonly acknowledged method is to interpret and classify the types of land cover in the study area by using remote sensing images and then assign factors to different types of land cover based on empirical values or field measurements (Folly et al., 1996; Onyando et al., 2005; Pandey et al., 2009). This method is simple and easy to implement and remains a crucial method for obtaining factors in regional soil erosion assessment. Because each type of land cover corresponds to a fixed C value, it cannot reflect the characteristics of spatial changes in surface vegetation, undermining the accuracy of factor calculation and calculation accuracy of soil erosion (Wang et al., 2002; Li et al., 2008). To accurately reflect the spatial variation characteristics of vegetation coverage, researchers adopt the field measurement data and establish a regression model between the C values and remote sensing image spectral information and then calculate the value corresponding to each pixel according to the remote sensing image of the study area. The most commonly used remote sensing spectral information is the Normalized Difference Vegetation Index (NDVI). For example, De Jong (1994) evaluated the soil erosion risk in southern France by establishing a linear regression model between NDVI and C factors. Karaburun, (2010) used a linear regression model between NDVI and C factors to evaluate the risk of soil erosion in the Buyukcekmece watershed in Istanbul. Cai et al. established the mathematical relationship between vegetation coverage and C factors according to the observation of artificial rainfall and natural rainfall in runoff areas and also established the correlation between slope sediment yield and vegetation coverage (Cai et al., 2000) (Eq. 8). This method comprehensively reflects the relationship between vegetation coverage and the C factor. Based on the review of previous studies, it is evident that vegetation coverage has a significant correlation with the amount of soil erosion. The greater the vegetation coverage, the lower the risk of soil erosion will be (Cai and Tang, 1992). This study uses the vegetation coverage method to calculate the C factor for its easily exercisable mechanism.
where fc is the vegetation coverage of the study area in the growing season (%)
There are many methods for estimating vegetation coverage, and the most commonly used method is the pixel dichotomy model. It is a linear pixel decomposition model and is a simple and widely applied method. The NDVI has a strong linear correlation with the density of vegetation. When the vegetation coverage is at a medium and low level, the NDVI increases rapidly as the vegetation coverage increases. The NDVI keeps stable when the vegetation coverage reaches a certain degree. Therefore, the NDVI method is adopted to monitor the dynamic change of vegetation growth. The study uses the NDVI index to calculate the vegetation coverage (Deng et al., 2019) (Eq. 9). To take into consideration the changes in vegetation caused by seasonal changes, the calculation of the C factor is obtained based on the annual average vegetation coverage in the study area, and the annual average NDVI is obtained based on the three-phase NDVI Distribution map and the NDVI pixel binary model (Eq. 9). Therefore, the annual average vegetation coverage fc in the study area can be obtained, and then the vegetation coverage and vegetation coverage in the study area can be calculated according to Eq. 8. Management factor C (Figure 6).
where NDVIveg represents the value of pixels with full vegetation coverage. NDVIsoil denotes the value of pixels without vegetation coverage. According to previous results and principles of statistical analysis (Li, 2003), the value that corresponds to 5% of the NDVI statistical histogram is determined as NDVIsoil and the value that corresponds to 95% of the NDVI statistical histogram is determined as NDVIveg.
Calculation of Soil Conservation Factor (P)
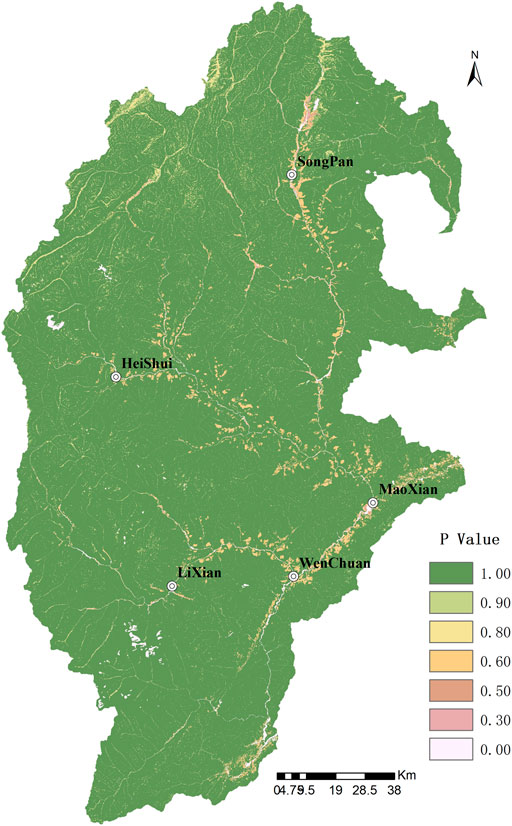
The soil conservation factor (P) refers to the ratio of soil loss after soil and water conservation measures to soil loss on the downslope. The value is 1 when there are no soil conservation measures on the soil surface. The value is 0 when there are corresponding measures and no soil loss. The soil conservation measures in this study refer to the measures to mitigate soil erosion caused by rainfall, including the changing terrain or confluence pattern to reduce the surface runoff and runoff rate (Zhang et al., 2015). Soil conservation measures for agricultural land use mainly include contour farming, strip farming, terracing, and other drainage structure construction. The soil conservation measures for grassland and pasture mainly include plowing and ridging along the contour line or its vicinity to moisture the soil surface, reduce the runoff, and resist soil erosion (Yang, 2004). The soil conservation measure factor (P) is calculated by using the comparison method, but the error in different regions is large. The soil conservation measure factor is considered to be a complicated factor in the USLE equation, and it can only be approximately estimated by indirect methods (Lu et al., 2011). Most researchers assign the p values based on in situ measurements in their research area (Yang, 2002; Yang, 2004; Xu and Shao, 2006; Yang et al., 2006). The p value in this study is based on multiple elements, including the investigation of the current situation of soil and water conservation, current research results, empirical p values under different conservation measures (Bo et al., 1997; Cai et al., 2000; Yang, 2004; Zeng and Pan, 2007) (Table 2), USLE manual, the slope percentage calculated through GIS based on DEM data, and overly analysis on the type of land use and slope (Hu et al., 2013; Yaşar Korkanç and Korkanç, 2016).
According to the current land use data upstream of the Minjiang River, there are nine Class-1 land types and 30 Class-2 land types. The Class-2 and Class-1 land types are similar in land attributes, and it can be considered that the soil conservation measures are similar. Therefore, the Class-1 land types can be used as the reference basis for the land type classification of water and soil conservation measures. In the study area, the cultivated land includes paddy fields, dry land, and irrigated land. Among them, dry land accounts for 99.89% of the total cultivated land area that adopts contour belt cultivation. The p value under contour farming can refer to Table 3. The garden land use includes orchards, tea gardens, and other land uses. The garden land use in the study area is mainly planted with fruit trees such as cherries, plum trees, and pear trees. The p value directly adopts contour farming. Forest land includes forest land, shrub forest land, and other land types. Among them, forest land and shrub forest land account for 95.86% of the total forest land, most of which are primitive natural forests. Some areas with lower slopes are planted with artificial secondary forests. For areas where there are no soil conservation measures with higher slopes, the p value is 1. For areas with lower slopes, the p value is 0.8. The grassland in the area includes natural pasture and artificial pasture. Among them, natural pasture and other grasslands account for 99.98% of the total grassland area. In mining land, the water and soil conservation measures are not carried out, and the soil erosion in mining land will be aggravated, so the p value is 1. The Class-2 land use in the study area includes bare land, swampland, and agriculture facility land. There are no soil conservation measures in these areas, and the p value is 1. The Class-2 land-use types in transportation land include railway land, highway land, rural roads, and airport land. The land types are all cement hardened with no water and soil loss, and the p value is 0. The Class-2 land-use types in water surface and water conservancy facility land include the surface of river, lake water, reservoir water, pit pond water, inland beach, hydraulic construction land, glacier, and permanent snow. This type of land has no water and soil conservation measures, and the possibility of soil loss is minor, so the p value is 0. Urban villages and industrial land include Class-2 land types such as towns, villages, scenic spots, and particular land. These land types are generally featured by hardened cement surfaces where the soil loss unlikely to happen, so the value of P is 0. Table 3 shows the division of soil conservation measure factors (P) for each land use type according to different slope gradients. Figure 7 is the distribution map of p value.
Result
Analysis of the Results of Soil Conservation
The potential and the actual amount of soil erosion in the upper reaches of the Minjiang River are quantitatively assessed with the USLE formula. The actual modulus of soil erosion is directly calculated through the USLE formula (Eq. 1), whereas the modulus of potential soil erosion is calculated by canceling the vegetation coverage factor C and the land management factor P in the USLE formula (Eq. 2).
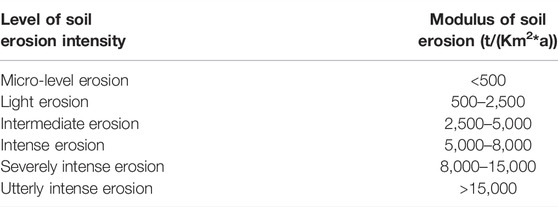
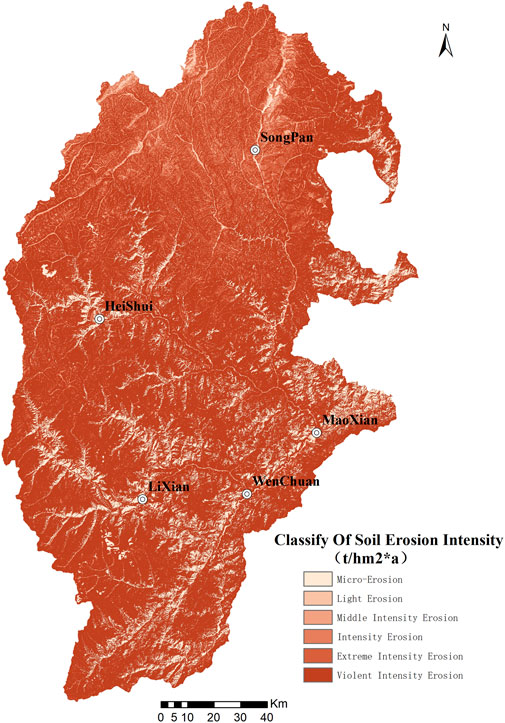
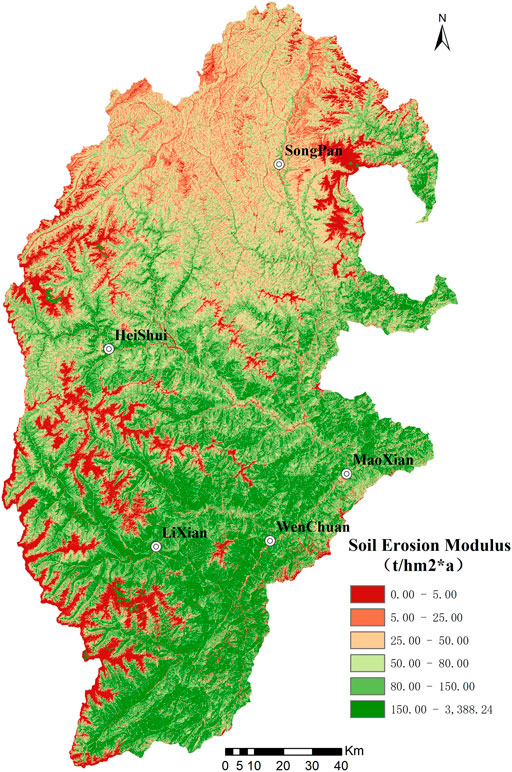
The intensity of soil erosion in the research area is graded by referring to the “Standards for Classification and Grading of Soil Erosion (SL190-2007)”. The standards have stipulated the model for grading the water erosion intensity of soil erosion and specified the grading standards for the intensity of soil erosion accordingly (Table 4). By referring to such grading standards, the actual level of soil erosion is determined based on the intensity of soil erosion, whereas the grading map for the intensity of soil erosion is obtained (Figure 8). As the modulus of potential soil erosion is subtracted from the modulus of actual soil erosion, the modulus of soil erosion is obtained accordingly (Figure 9).
Judging from the statistical results (Table 5), it shall be noted that the total area of the zone subject to micro-level erosion in the research area amounts to 2,493.07 km2, accounting for 10.06% of the total research area. The average modulus of erosion in the research area amounts to 4.57 t/(km2·a), whereas the annual quantity of soil erosion amounts to 0.0114 million tons. The total area of the zone subject to light erosion amounts to 417.31 km2, accounting for 1.68% of the research area. The average modulus of erosion in the research area amounts to 1,418.30 t/(km2·a), whereas the annual quantity of soil erosion amounts to 0.5919 million tons. The area of the zone subject to intermediate erosion amounts to 571.85 km2, accounting for 2.31% of the research area. The average modulus of erosion in the zone amounts to 3,398.89 t/(km2·a), whereas the annual quantity of soil erosion amounts to 1.9437 million tons. The area of the zone subject to intense erosion amounts to 798.38 km2, accounting for 3.22% of the research area. The average modulus of erosion in this zone amounts to 6,067.87 t/(km2·a), whereas the annual quantity of erosion amounts to 4.8445 million tons. The total area of the zone subject to severely intense erosion amounts to 3,200.30 km2, accounting for 12.91% of the research area, whereas the average modulus of erosion in this zone amounts to 10,784.13 t/(km2·a), and the annual quantity of soil erosion amounts to 34.5124 million tons. Moreover, the total area of the zone subject to utterly intense soil erosion amounts to 17,302.17 km2, accounting for 69.81% of the research area, and the average modulus of erosion in this zone amounts to 34,674.29 t/(km2·a). The annual quantity of soil erosion amounts to 599.9405 million tons.
The primary form of soil erosion in the research area is utterly intense erosion, and the area of soil erosion accounts for 69.81% of the entire research area. The annual quantity of soil erosion in this area amounts to 599.9405 million tons, accounting for 93.47% of the total area of soil erosion in the research area, which is 641.8443 million tons.
The quantity of the potential and actual soil erosion, along with the quantity of soil conservation in the research area, can be further calculated by Eqs 10, 11, 12:
where Ts refers to the quantity of actual soil erosion (unit t), Tq refers to the potential quantity of soil erosion (unit t), T refers to the quantity of soil conservation (unit t), and S refers to the area, unit (hm2).
By multiplying the modulus of soil erosion for each unit pixel in the research area by the area of a single pixel, the actual quantity of soil erosion (Ts) in the upper reaches of the Minjiang River is estimated to reach 641.8443 million tons, whereas the quantity of potential soil erosion (Tq) is estimated to reach 925.2906 million tons, and the quantity of soil conservation (T) is calculated to reach 283.4463 million tons. The rainfall in the research area has imposed a severe impact on soil erosion, and the area of the zone subject to utterly intense erosion amounts to 17,302.17 km2, accounting for 69.81% of the research area.
Due to the impact imposed by the geographical environment (i.e., alpine canyon landform), soil erosion commonly takes place in the research area. The 2008 Wenchuan earthquake had a significant impact on the geological environment in the region, and the surface soil has loosened ever since. With the arrival of the rainy season, the soil loss in the area becomes particularly severe. Especially in high altitudinal areas, ecological vegetation has yet to return to the state prior to the earthquake. On the other hand, low altitudinal areas are subject to the influence of human factors, including but not limited to building of hydropower stations, deforestation, construction of roads and railways, and mining of mineral sands.
Estimation of Economic Value of Soil Conservation
For the purpose of calculation, the economic value of soil conservation is measured from three aspects, namely, fertility preservation, soil fixation, and silt reduction. The specific value can be estimated by the shadow price method, opportunity cost method, and alternative engineering method (Zhao, 2014).
(1) Value of Fertility Conservation
The soil is capable of absorbing and preserving nutrients. Such capacity of fertility conservation is mainly achieved by adsorbing molecular nutrients on the surface of the soil cavity but without altering the material structure of the nutrients. This approach to conserving fertilizer through physical adsorption helps prevent nutrients from being leached, while enabling the nutrients to reveal a certain gradient of concentration in the soil. Besides physical adsorption, the soil is able to maintain fertility through chemical fixation, which refers to the chemical reaction of chemical ions in the soil with nutrient segregates to form compounds with utterly low solubility in the soil. Such sort of chemical reaction not only facilitates the conservation of nutrients to a certain extent but also helps reduce the poisoning level of certain harmful substances to growing plants. In the meantime, the erosion of rainfall into the soil surface will take away a large quantity of soil parent materials, in addition to a large amount of organic matter and nutrients. In general, the total nitrogen (N), total phosphorus (P), total potassium (K), and organic matter content of the soil are adopted as parameters of soil fertility when estimating the value of soil fertility preservation. According to the results of total N, total P, total K, and organic matter content of varying sorts of soils (Table 6), the soil nutrients lost in the research area can be calculated on an annual basis.

TABLE 6. Physico-chemical properties of primary types of soil in the upper reaches of Minjiang river (%).
Based on the map on the distribution of the modulus of soil erosion (Figure 9) and the map on types of soil and the physicochemical properties of each type of soil (Table 10), the total N, total P, total K, and soil conservation in the upper reaches of Minjiang River are measured accordingly. The contents of total N, total P, total K, and organic matter amount to 1.5306 million tons, 0.0021 million tons, 3.2596 million tons, and 37.9898 million tons, respectively. Moreover, using the shadow price method, the total N, total P, total K, and the content of organic matter with soil conservation are converted into chemical fertilizers and organic fertilizers of the same quality. Through the survey, the price of chemical fertilizer is estimated to be 6.6 yuan per kilogram on average, and the price of organic fertilizer is estimated to be 2 yuan per kilogram on average. On this basis, it is estimated that the economic value of nutrients retained by soil in the upper reaches of the Minjiang River amounts to 107.5934 million yuan per year.
(2) Value of Soil Fixation
To measure the value of soil fixation of the ecosystem, the total amount of soil conservation in the research area is generally converted into the land area based on bulk density and soil thickness. Such land area represents the area of land fixed by the function of soil and water conservation in the ecosystem, and the opportunity cost method is adopted (Eq. 13) to calculate the annual income to be yielded by the land area.
where Vg refers to the value of soil fixation of the ecosystem in the research area, T refers to the total amount of soil conservation,
The amount of soil conservation is estimated to reach 283.4463 million tons. Referring to the “Standards for the Classification and Grading of Soil Erosion (SL190-2007),” the soil bulk density
Based on Eq. 19, the value of soil fixation of the ecosystem in the upper reaches of the Minjiang River is estimated to reach 20.996 million yuan.
Soil erosion can impose a siltation effect on rivers, lakes, reservoirs, etc., which will weaken the capacity of water storage in reservoirs and undermine their function of flood control and drought resistance. With respect to pit-pond reservoirs, curbing the soil erosion is equivalent to increasing the storage capacity of reservoirs. Due to the special topography of alpine and gorge regions in the upper reaches of the Minjiang River, the majority of the soil and silt lost from soil erosion will ultimately enter the river system. Based on previous analytical and research findings on the orientation and movement of soil loss and sediment accumulation caused by soil erosion in major river basins in China, it is shown that 24% of the soil loss derived from soil erosion will be deposited at the bottom of reservoirs and rivers, and 33% will be stagnated in river channels, whereas 37% will end up in the sea (Bo et al., 1997). The cost of dredging silt deposited in reservoirs and rivers in the research area with engineering and technical approaches is measured to assess the value loss of desilting in the ecosystem. To calculate the dredging cost, researchers refer to the engineering cost of reservoir dredging specified in the “Specification for Assessing the Service Function of Forest Ecosystem,” which amounts to 6.11 yuan/m3. Finally, the value of sediment reduction in the upper reaches of the Minjiang River is estimated to reach 307.8857 million yuan.
In a nutshell, the amount of soil conservation in the upper reaches of the Minjiang River is estimated to reach 283.4463 million tons, and the total economic value of such soil conservation is estimated to reach 436.4751 million yuan.
(3) Recommendations
Since the ecological service value of soil conservation in the research area is huge, it is necessary to enhance the quality of the ecological environment in the region. In lower altitudinal regions of the research area, human activities such as building of hydropower stations, deforestation, construction of roads and railways, and mining of mineral sands may lead to deterioration of vegetation, thus posing threats to soil erosion. Recommendations are provided as follows: we should constantly launch a series of projects of ecological restoration and reconstruction so as to contribute to the restoration of the ecological environment. Moreover, we need to impose restrictions on human activities, such as building of hydropower stations, deforestation caused by man-made factors, construction of roads and railways, and mining of mineral sands.
Conclusion
(1) Soil conservation is deemed as one of the fundamental functions of ecosystem services and one of the critical functions of supporting services. By quantitatively measuring the amount of soil erosion and conservation in the upper reaches of the Minjiang River, it is possible to quantify the value of ecological service functions of soil conservation in the region. In this study, the remote sensing technology and USLE model are adopted to quantitatively measure the amount of soil conservation in the upper reaches of the Minjiang River so as to further assess the economic value of soil conservation in the ecosystem of the research area based on the shadow price method, opportunity cost method, and alternative engineering method. The research on soil erosion in the upper reaches of the Minjiang River aims to provide evidence for the study of ecological service value and is also expected to provide a sound reference for projects of soil conservation and early warnings against soil erosion in the region.
(2) Judging from the final calculation, the quantity of actual soil erosion in the upper reaches of Minjiang River amounts to 641.8443 million tons, whereas that of potential soil erosion amounts to 925.2906 million tons, and thus the quantity of soil conservation is measured to be 283.4463 million tons. The rainfall in the research area can impose a prevalent impact on soil erosion. The area of the zone subject to utterly intense erosion is 17,302.17 km2, accounting for 69.81% of the research area. Such land is primarily concentrated in the southern part of the research area, namely, Li County and Wenchuan County. The valleys in these regions are rough and feature huge altitudinal differences as well as steep slope, and thus it is necessary to adopt measures to enhance water and soil conservation.
(3) The value of ecological services is monetized. The quantity of soil conservation in the upper reaches of the Minjiang River amounts to 283.4463 million tons, and the total economic value of soil conservation amounts to 436.4751 million yuan. In particular, the economic value of annual soil conservation nutrients amounts to 107.5934 million yuan, and the value of soil fixation amounts to 209.996 million yuan, whereas the value of ecological silt reduction amounts to 307.8857 million yuan.
(4) Quick estimation can be accomplished through the RS and GIS techniques. However, considerable uncertainties are brought forward by such assessment techniques. For starters, the basic facts are not completely compatible with the actual land surface. In addition, it is still hard for certain empirical models to reveal the physical process of soil erosion.
Data Availability Statement
The original contributions presented in the study are included in the article/Supplementary Material; further inquiries can be directed to the corresponding author.
Author Contributions
DB and SL jointly conceived and designed the experiments, developed the processing program and wrote the study, jointly performed the experiments and analyzed data, and reviewed and edited the study as supervisors. DB and SL contribute equally to the article. All authors have read and agreed to the published version of the manuscript.
Funding
This research was funded by the Young Science and Technology Talents Development Project (Qian Jiao He KY NO. (2022)198; NO. (2020)149), and supported by the open research funded projects of Guizhou Province Key Laboratory of Ecological Protection and Restoration of Typical Plateau Wetlands (NO. (2021)06; NO. (2020)149).
Conflict of Interest
Author SL is employed by Space Star Technology Co., Ltd.
The remaining authors declare that the research was conducted in the absence of any commercial or financial relationships that could be construed as a potential conflict of interest.
Publisher’s Note
All claims expressed in this article are solely those of the authors and do not necessarily represent those of their affiliated organizations, or those of the publisher, the editors and the reviewers. Any product that may be evaluated in this article, or claim that may be made by its manufacturer, is not guaranteed or endorsed by the publisher.
References
Alewell, C., Borrelli, P., Meusburger, K., and Panagos, P. (2019). Using the USLE: Chances, Challenges and Limitations of Soil Erosion Modelling. Int. Soil Water Conser. Res. 7, 203–225. doi:10.1016/j.iswcr.2019.05.004
Azizian, A., and Koohi, S. (2021). The Effects of Applying Different DEM Resolutions, DEM Sources and Flow Tracing Algorithms on LS Factor and Sediment Yield Estimation Using USLE in Barajin River Basin (BRB). Iran: Paddy Water Environ.
Beasly, D. B., Huggins, L. F., and Monke, E. J. (1980). ANSWERS: A Model for Watershed Planning. Trans. ASAE 23 (4), 938–944. doi:10.13031/2013.34692
Benavidez, R., Jackson, B., Maxwell, D., and Norton, K. (2018). A Review of the (Revised) Universal Soil Loss Equation ((R)USLE): with a View to Increasing its Global Applicability and Improving Soil Loss Estimates. Hydrol. Earth Syst. Sci. 22, 6059–6086. doi:10.5194/hess-22-6059-2018
Bo, Z. H., Sun, J. Z., Zhou, F. J., Tang, W. L., and Xi, C. F. (1997). A Study on Quantitative Remote Sensing Method of Soli Erosion and its Application. Acta Pedol. Sin. 3, 235–245. doi:10.3321/j.issn:0564-3929.1997.03.002
Cai, C. F., Ding, S. W., Shi, Z. H., Huang, L., and Zhang, G. Y. (2000). Study of Applying USLE and Geographical Information System IDRISI to Predict Soil Erosion in Small Watershed. J. Soil Water Conser. 14, 19–24. doi:10.13870/j.cnki.stbcxb.2000.02.005
Cai, Q., and Tang, K. L. (1992). Dynamic Analysis of Vegetaion Effect on the Soil Erosion. J. Soil Water Conser. 2, 47–51+79. doi:10.13870/j.cnki.stbcxb.1992.02.009
Chen, L., Xie, G. D., Pei, S., Zhang, C. S., Fan, N., Zhang, C. X., et al. (2012). Ecosystem's Soil Conservation Function and its Spatial Distribution in Lancang River Basin, Southwest China. Ying Yong Sheng Tai Xue Bao 23, 2249–2256.
De Jong, S. M. (1994). Derivation of Vegetative Variables from a Landsat Tm Image for Modelling Soil Erosion. Earth Surf. Process. Landforms 19, 165–178. doi:10.1002/esp.3290190207
De Roo, A. P. J. (1996). The LISEM Project: An Introduction. Hydrol. Process. 10, 1021–1025. doi:10.1002/(sici)1099-1085(199608)10:8<1021::aid-hyp407>3.0.co;2-i
Deng, B., Yang, W., yang, W.-n., Huang, J., and Mu, N. (2019). Estimating the Change of Vegetation Coverage of the Upstream of Minjiang River by Using Remote-Sensing Images. Rev. Int. Contam. Ambie. 35, 11–22. doi:10.20937/rica.2019.35.esp01.02
Fan, J., Motamedi, A., and Galoie, M. (2021). Impact of C Factor of USLE Technique on the Accuracy of Soil Erosion Modeling in Elevated Mountainous Area (Case Study: the Tibetan Plateau). Environ. Dev. Sustain. 23. doi:10.1007/s10668-020-01133-x
Flanagan, D. C., Ascough, J. C., and Nicks, A. D. (1995). Overview of the WEPP Erosion Prediction Model. USA: USCD-Water Erosion Prediction Project.
Folly, A., Bronsveld, M. C., and Clavaux, M. (1996). A Knowledge-Based Approach for C-Factor Mapping in Spain Using Landsat TM and GIS. Int. J. Remote Sens. 17, 2401–2415. doi:10.1080/01431169608948780
Fu, S. H., Liu, B. Y., Zhou, G. Y., Sun, Z. X., and Zhu, X. L. (2015). Calculation Tool of Topographic Factors. Sci. Soil Water Conser. 13, 105–110. doi:10.16843/j.sswc.2015.05.018
Greenland, D. J., and Szabolcs, I. (1994). Soil Resilience and Sustainable Land Use. Oxford University Press. Incorporated.
Guo, B., Tao, H. P., Liu, B. T., and Jiang, L. (2012). Characteristics and Analysis of Soil Erosion in Li Country after Wenchuan Earthquake Based on GIS and USL. Trans. Chin. Soc. Agric. Eng. 28, 118–126. doi:10.3969/j.issn.1002-6819.2012.14.019
Hickey, R., Remortel, R., and Hamilton, M. (2001). Estimating the LS Factor for RUSLE through Iterative Slope Length Processing of Digital Elevation Data within ArcInfo Grid. Cartography 30, 27–35.
Hu, W. M., Zhou, W. J., Yu, Y. H., Bao, C. H., and Xie, H. X. (2013). Estimation of Soil Erosion in Red Earth Hilly Area Based on RS and USLE. Remote Sens. Land Resour. 25, 171–177. doi:10.6046/gtzyyg.2013.03.28
Jemai, S., Kallel, A., Agoubi, B., and Abida, H. (2021). Soil Erosion Estimation in Arid Area by USLE Model Applying GIS and RS: Case of Oued El Hamma Catchment, South-Eastern Tunisia. J. Indian Soc. Remote. doi:10.1007/s12524-021-01320-x
Karaburun, A. (2010). Estimation of C Factor for Soil Erosion Modeling Using NDVI in Buyukcekmece Watershed. Ozean J. Appl. Sci. 3 (1), 1943–2429. doi:10.1007/S1266-5-012-2086-0
Li, M. M. (2003). The Method of Vegetation Fraction Estimation by Remote Sensing. Institute of Remote Sensing Applications Chinese Academy of Sciences.
Li, Z. G., Yang, S. T., Gao, Y. F., Yan, M. S., and Zeng, H. J. (2008). Remote Sensing Monitoring for Soil Erosion and its Thinking. Sci. Soil Water Conser. 3, 7–12. doi:10.16843/j.sswc.2008.03.002
Lin, B., Chen, C., Thomas, K., Hsu, C., and Ho, H. (2019). Improvement of the K-Factor of USLE and Soil Erosion Estimation in Shihmen Reservoir Watershed. Sustainability-Basel 11. doi:10.3390/su11020355
Liu, B., Qi, S. H., Liao, F. Q., and Li, G. C. (2012). Study on Hydraulic Soil-Erosion with Remote Sensing Information for Jiangxi Province. Wuhan: Geomatics and Information Science of Wuhan University, 389–393.
Liu, B. Y., Nearing, M. A., Baffaut, C., and Ascough, J. (1997). The Wepp Watershed Model: Iii. Comparisons to Measured Data from Small Watersheds. Trans. Asabe. 40, 945–952. doi:10.13031/2013.21345
Liu, K., Tang, G. A., Jiang, L., Song, X. D., and Yang, J. Y. (2015). A Parallel Algorithm for Erosion Slop Length Calculation Based on Grid Terrain Datasets. Wuhan: Geomatics and Information Science of Wuhan University, 274–279.
Lu, J. Z., Chen, X. L., Li, H., Liu, H., and XiaoYin, J. J. J. M. (2011). Soil Erosion Changes Based on GIS/RS and USLE in Poyang Lake Basin. Trans. CSAE 27, 337–344. doi:10.3969/j.issn.1002-6819.2011.02.057
McCool, D. K., Foster, G. R., Mutchler, C. K., and Meyer, L. D. (1989). Revised Slope Length Factor for the Universal Soil Loss Equation. Trans. Asabe. 32, 1571–1576. doi:10.13031/2013.31192
McCool, D. K., Wischmeier, W. H., and Johnson, L. C. (1982). Adapting the Universal Soil Loss Equation to the Pacific Northwest. Trans. ASAE 25, 928–934. doi:10.13031/2013.33642
Mondal, A., Khare, D., and Kundu, S. (2018). A Comparative Study of Soil Erosion Modelling by MMF, USLE and RUSLE. Geocarto Int. 33, 89–103. doi:10.1080/10106049.2016.1232313
Moore, I. D., and Wilson, J. P. (1992). Length-Slope Factors for the Revised Universal Soil Loss Equation - Simplified Method of Estimation. J. Soil Water Conserv., 423–428. doi:10.1073/pnas.91.1.271
Olson, T. C., and Wischmeier, W. H. (1963). Soil-Erodibility Evaluations for Soils on the Runoff and Erosion Stations. Soil Sci. Soc. Am. J. 27, 590–592. doi:10.2136/sssaj1963.03615995002700050035x
Onyando, J. O., Kisoyan, P., and Chemelil, M. C. (2005). Estimation of Potential Soil Erosion for River Perkerra Catchment in Kenya. Water Resour. Manage 19, 133–143. doi:10.1007/s11269-005-2706-5
Pandey, A., Mathur, A., Mishra, S. K., and Mal, B. C. (2009). Soil Erosion Modeling of a Himalayan Watershed Using RS and GIS. Environ. Earth Sci. 59, 399–410. doi:10.1007/s12665-009-0038-0
Peng, S., Yang, K., Hong, L., Xu, Q., and Huang, Y. (2018). Spatio-temporal Evolution Analysis of Soil Erosion Based on USLE Model in Dianchi Basin. Trans. Chin. Soc. Agric. Eng. 34, 138–146. doi:10.11975/j.issn.1002-6819.2018.10.017
Qi, S. H., Jiang, M. X., and Yu, X. B. (2011). Evaluating Soil Erosion in Jiangxi Province with USLE Model and Remote Sensing Technology during 1995-2005. China Environ. Sci. 31, 1197–1203. doi:10.1016/S1671-2927(11)60313-1
Sharpley, A. N., and Williams, J. R. (1990). EPIC-Erosion/Productivity Impact Calculator. Tech. Bull. - U. S. Dep. Agric. 4, 206–207. https://handle.nal.usda.gov/10113/CAT10698097
Sujatha, E. R., and Sridhar, V. (2019). Mapping of Erosion Susceptibility Using a Weighted Linear Combination Model: A Case Study of a Hill Sub-watershed in Kodaikkanal, Western Ghats, South India. Remote Sens. Appl. Soc. Environ. 14, 34–45. doi:10.1016/j.rsase.2019.02.004
Sujatha, E., and Sridhar, V. (2018). Spatial Prediction of Erosion Risk of a Small Mountainous Watershed Using RUSLE: A Case-Study of the Palar Sub-watershed in Kodaikanal, South India. Water 10 (11), 1608. doi:10.3390/w10111608
Sun, Q. Z., Wang, C. J., Zhao, J., Zheng, J., and Chen, J. Y. (2011). Research Evolution of Rainfall Erosivity (R) in China. Chin. Agric. Sci. Bull. 27, 1–5. https://handle.nal.usda.gov/10113/CAT10698097
Tung, G. P., Degener, J., and Kappas, M. (2018). Integrated Universal Soil Loss Equation (USLE) and Geographical Information System (GIS) for Soil Erosion Estimation in A Sap Basin: Central Vietnam. Int. Soil Water Conser. Res. 6, 99–110. doi:10.1016/j.iswcr.2018.01.001
Van Remortel, R. D., Maichle, R. W., and Hickey, R. J. (2004). Computing the LS Factor for the Revised Universal Soil Loss Equation through Array-Based Slope Processing of Digital Elevation Data Using a C++ Executable. Comput. Geosciences 30, 1043–1053. doi:10.1016/j.cageo.2004.08.001
Wang, G., Wente, S., Gertner, G. Z., and Anderson, A. (2002). Improvement in Mapping Vegetation Cover Factor for the Universal Soil Loss Equation by Geostatistical Methods with Landsat Thematic Mapper Images. Int. J. Remote Sens. 23, 3649–3667. doi:10.1080/01431160110114538
Wei, J. M., Li, C. B., and Wu, L. (2021a). Study on Soil Erosion in Northwestern Sichuan and Southern Gansu Based on USLE. J. Soil Water Conser. 35 (02), 31–37. doi:10.13870/j.cnki.stbcxb.2021.02.005
Wei, J. M., Li, C. B., Wu, L., Xie, X. H., Lv, J. N., and Zhou, X. (2021b). Study on Soil Erosion in Northwestern Sichuan and Southern Gansu (NSSG) Based on USLE. J. Soil Water Conser. 35, 31–37. doi:10.13870/j.cnki.stbcxb.2021.02.005
Wilson, J. P. (1986). Estimating the Topographic Factor in the Universal Soil Loss Equation for Watersheds. J. Soil Water Conserv. 41, 179–184. doi:10.2307/3899070
Wischmeier, W. H., and Simith, D. D. (1965). Predicting Rainfall Erosion Losses from Cropland East of the Rocky Mountains. Washington D.C. Agricultural Hand-book, 282.
Wischmeier, W. H., and Smith, M. D. (1978). Predicting Rainfall Erosion Losses. United States Department of Agriculture.
Wu, C. G., Li, S., Ren, H. D., Yao, X. H., and Huang, Z. J. (2012). Quantitative Estimation of Vegetation Cover and Management Factor in USLE and RUSLE Models by Using Remote Sensing Data: a Review. Ying Yong Sheng Tai Xue Bao 23, 1728–1732. doi:10.13287/j.1001-9332.2012.0278
Xu, Y. Q., and Shao, X. M. (2006). Estimation of Soil Erosion Supported by GIS and RUSLE: A Case Study of Maotiaohe Watershed, Guizhou Province. J. Beijing For. Univ. 28, 67–71. doi:10.3321/j.issn:1000-1522.2006.04.013
Yang, G. B., Li, Y. Q., and An, Y. L. (2006). Pixel-Based Assessment and Spatial Distribution of Sensitivity of Soil Erosion in Guizhou. Carsologica Sin. 25, 73–78. doi:10.3969/j.issn.1001-4810.2006.01.014
Yang, G. B. (2004). Study on Soil Erosion Based on Grid Data in Karst Mountainous Region. Guizhou Normal University.
Yang, Q. K., Guo, W. L., Zhang, H. M., Wang, L., Chen, L., and Li, J. (2010). Method of Extracting LS Factor at Watershed Scale Based on DEM. Bull. Soil Water Conser. 30, 5. doi:10.13961/j.cnki.stbctb.2010.02.035
Yang, Z. S. (2002). Study on Soil Loss Equation in Jinsha River Basin of Yunnan Province. J. Mountaion Sci. 20, 9. doi:10.16089/j.cnki.1008-2786.2002.s1.001
Yaşar Korkanç, S., and Korkanç, M. (2016). Physical and Chemical Degradation of Grassland Soils in Semi-arid Regions: a Case from Central Anatolia, turkey. J. Afr. Earth Sci. 124 (dec), 1–11. doi:10.1016/j.jafrearsci.2016.08.021
Zeng, H. J., and Pan, W. B. (2007). Soil Erosion Estimation by Using RUSLE, RS and GIS Models in the Wubuxi Watershed, Fujian. J. Saf. Environ. 7, 88–92. doi:10.3969/j.issn.1009-6094.2007.05.023
Zhang, J. Q., Gong, J., and Wu, Y. J. (2014). A Preliminary Study on Rainfall Erosion Force in Hubei Based on the Data of Daily Rainfall. Resour. Environ. Yangtze Basin 23, 274–280. doi:10.11870/cjlyzyyhj201402017
Zhang, K. L., Peng, W. Y., and Yang, H. L. (2007). Soil Erodibility and its Estimation for Agricultural Soil in China. Acta Pedol. Sin. 44, 7–13. doi:10.3321/j.issn:0564-3929.2007.01.002
Zhang, K., Yu, Y., Dong, J., Yang, Q., and Xu, X. (2019). Adapting & Testing Use of USLE K Factor for Agricultural Soils in China. Agric. Ecosyst. Environ. 269, 148–155. doi:10.1016/j.agee.2018.09.033
Zhang, L. J. (2007). Vegetation GAP Analysis in the Upper Reaches of Minjiang River. Beijing Forestry University.
Zhang, X. F., Niu, J. M., Zhang, Q., Dong, J. J., and Zhang, J. (2015). Soil Conservation Function and its Spatial Distribution of Grassland Ecosystems in Xilin River Basin, Inner Mongolia. Acta Prataculturae Sin. 24, 12–20. doi:10.11686/cyxb20150103
Zhang, Y., Liu, B. Y., Shi, P. J., and Jiang, Z. S. (2001). Crop Cover Factor Estimating for Soil Loss Prediction. Acta Ecol. Sin. 21, 1050–1056. doi:10.3321/j.issn:1000-0933.2001.07.002
Keywords: soil erosion, USLE model, remote sensing, Landsat8, violent and intense erosion
Citation: Bing D and Lei S (2022) Remote Sensing Quantitative Research on Soil Erosion in the Upper Reaches of the Minjiang River. Front. Earth Sci. 10:930535. doi: 10.3389/feart.2022.930535
Received: 28 April 2022; Accepted: 07 June 2022;
Published: 15 July 2022.
Edited by:
Shuisen Chen, Guangzhou Institute of Geography, ChinaReviewed by:
Shailesh Kumar Sharma, Jawaharlal Nehru Agricultural University, IndiaSujatha Evangelin Ramani, Sastra University, India
Copyright © 2022 Bing and Lei. This is an open-access article distributed under the terms of the Creative Commons Attribution License (CC BY). The use, distribution or reproduction in other forums is permitted, provided the original author(s) and the copyright owner(s) are credited and that the original publication in this journal is cited, in accordance with accepted academic practice. No use, distribution or reproduction is permitted which does not comply with these terms.
*Correspondence: Shi Lei, cGlyYXRlNDQzM0AxNjMuY29t
 Deng Bing1,2
 Shi Lei