- 1School of Civil and Transportation Engineering, Henan University of Urban Construction, Pingdingshan, China
- 2School of Resource and Civil Engineering, Northeastern University, Shenyang, China
High rheological property and strong mining disturbance are prominent conditions in deep rock projects, and often present a coupled process to induce rockbursts, collapse and land subsidence. This paper aims to investigate the effect of surrounding rheological rockmass on the main shaft of mine with interbedding structure under coupled blasting stress wave condition. Based on elastic damage theory and the constitutive equation of rheological rockmass, considering the total strain rate in tensor form, a double-rock model was established. The model was then validated by comparing the numerical simulations with the test results. Matlab was used to develop the COMSOL software, allowing numerical simulation of the failure of shaft rock sequentially subjected to this complex loading path. The results from the rheology-impact numerical simulations show that the double-rock rheology was greatly affected by the dynamic disturbance. Under high creep stress and constant impact stress wave, the last failure of the double-rock with higher creep stress is more severe than that of double-rock with lower creep stress. The numerical simulation of the shaft in situ stress was used to predict the collapse of the rheological rockmass with interbedding structure. The preliminary results suggest that one contribution to this phenomenon is likely related to irreversible damage in the rock during the creep-disturbance process. Dynamic disturbance also promoted the failure of the rock near the interbedding structure, but also increased the strain and stress. This may reflect the initial compaction and elastic phase the rock near the interbedding structure related to the large compressive strength of the hard rock during the dynamic disturbance. The numerical results indicate that a circle-shaped spalling damage zone is prone to develop around the shaft with increased time. We discuss the reason for the decreased stress on point A2 near the interbedding structure of the shaft by visco-elastic theory. The results clearly showed insufficient stability of surrounding rockmass, thus the initial design of shaft is not reasonable. This study has important referential significance for main shaft design for similar mines.
1 Introduction
The rheological properties of interbedding rock can cause deformation and failure of shaft wall rock. However, only the effects of instantaneous deformation convergence of the shaft are typically considered in shaft construction design. The shaft may experience a series of deformation failure phenomena such as significant convergence, deviation, cracking, squeezing spalling, and sag subsidence under long-term action of crustal stress (Bell and Genske, 2001). When subject to these changes such as Figure 1, the surrounding rock of shaft can suffer a large-scale crack and undergo transverse shear dislocation under the influences of blasting operation and mining disturbance, which can compromise mine safety and severely threaten the safety of operating personnel. In fact, the instability of the interbedding rock can trigger catastrophic landslide during the strong seismic force such as the 2008 Wenchuan earthquake (Cui et al., 2021). Sometimes there are liquefaction or subsidence on the multilayer geotechnical conditions (Li et al., 2022).
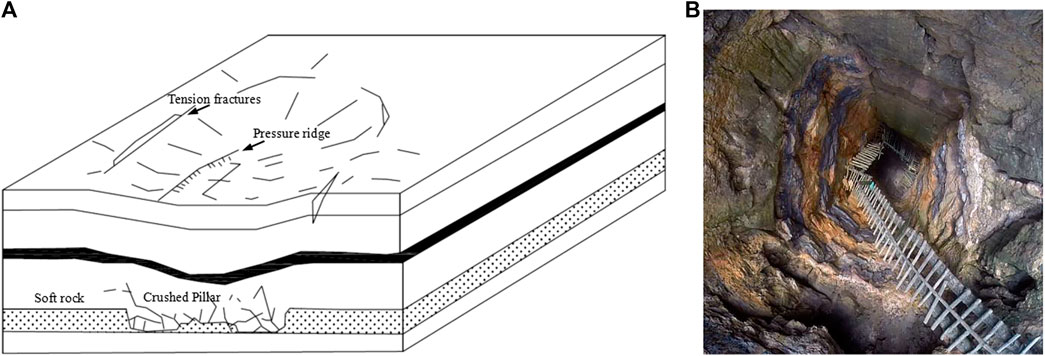
FIGURE 1. Typical sag subsidence configuration: (A) the ground surface subsidence due to themine layout and the geology conditions (Bell and de Bruyn,1999), (B) a collapse of mine with interbedding structure in Meghalaya main shaft, India (Schneider, 2014).
The current theoretical models and numerical simulation methods primarily establish a static model to analyze the long-term stability of the shaft wall rock but do not consider any long-term effects of the excavation stress wave disturbance on the rheological behavior of wall rock. In Reference (Chen et al., 2010), a three-dimensional finite element model was established to analyze the force and deformation characteristics of the wall rock of a long and large vertical shaft lined with supporting concrete based on the ideal elastoplastic material constitutive relationship and the Drucker-Prager yield principle. In Reference (Liu et al., 2020), the criteria for vertical shaft stability and the limit depth expression were derived to investigate the effects of differences in tension-compression strength of rock and intermediate principal stress on the limit depth of a vertical shaft. In Reference (Xie et al., 2019), The finite element method was used to perform numerical simulation of the effects of dynamic excavation of roadways in the middle section and large chambers in Jinchuan No. 3 mining area on the stability of the main and auxiliary shafts and analyze the effects of different excavation plans on the displacement of wall rock surrounding the main shaft. Sainoki et al. (2017) simulated the creep behavior of weak rock mass, with the validation of tertiary creep and the determination of model input parameters from field measurements. Barla et al. (Debernardi and Barla, 2009) used a viscoelastic-plastic model, an elastic-viscoplastic model, and an elastic-plastic-viscoplastic mode to analyze the squeezing problems of large size tunnels in rock masses of very poor quality. Sharifzadeh et al. (2013) simulated the time-dependent behavior of the tunnel surrounding ground deformation in weak rocks considering the Burger-creep viscoplastic model. Fahimifar et al. (2010) obtained an analytical solution to predict time-dependent deformation of the excavation of circular tunnels in a visco-elastic Burger model under hydrostatic stress field. Zhang et al. (Zhang et al., 2016) studied the time-dependent behavior and stability assessment of double tunnels based on thermodynamics with internal state variable theory. Ma et al. (Ma and Liu, 2022) successfully used 3D discontinuous deformation analysis (DDA) to build a rockfalls model to investigate the movement characteristics of the collapsing rocks before the landslide. Zhou et al. (2021) first utilized the moment tensor inversion to present the fractures network with a combination of microseismic event locations. This is a great contribution to the stability of pillar in the underground mining.
It has long been accepted that rheological behavior of rock is one of the important causes of rock mass engineering deformation and instability. However, under deep mining conditions, the soft wall rock deformation arising from blasting vibration of hard rock mine may have different effects with time (Sun, 1997). Gao et al. (Gao et al., 2007), Fu Zhiliang et al. (Fu et al., 2010), and Zhang et al. (Zhang, 2010) have addressed the disturbance effects of dynamic disturbance on the rheological process of rock. Gao et al. (Gao et al., 2007) proposed the concept of rheological disturbance effects of rock, developed a testing machine to assess rheological disturbance effects of rock, used an experimental approach to assess the effects of dynamic disturbance on rock creep, and proposed a three-dimensional creep damage model that considered disturbance effects. Zhang et al. (Zhang, 2010) theoretically analyzed the time delay of deformation stability of plate or beam structures based on viscoelasticity theory and qualitatively defined the time delay of rockburst. Xu Zenghe et al. (Lyu et al., 2020) discussed the occurrence conditions and retardation time of jamb rockburst under rheological rock stratum, provided a theoretical explanation of the rockburst hysteresis, and derived the expression for rockburst hysteresis time.
This study focused on the stability of rheological interbedding rock of the main vertical shaft in the middle section of Xincheng Gold Mine Ⅺ# ore body-380 of Shandong Gold Mining Co., Ltd. Based on rheological damage theory, MATLAB programming was utilized to characterize and quantify the nonuniform damage of rock in the environment of COMSOL Multiphysics to obtain the numerical solution for theoretical models. The numerical solution and the test solution were compared to verify the rheological model. The on-site rock parameters and disturbance conditions were employed to analyze the variation rules of stress and the strain of the rheological interbedding rock surrounding the main vertical shaft under the joint action of the crustal stress and mining stress wave.
2 Validation of the Model for Rheology Analysis
2.1 Numerical Model Setup
The rheology of rock can be characterized with a damage-based model, where the conservation equations for mass and momentum are derived on the macroscopic scale. All variables are averaged over the representative elementary volume (REV) of the rock.
2.1.1 Mechanical Equilibrium and Damage Evolution Equation
The rock is assumed to be elastic, with the constitutive relationship defined by a generalized Hooke’s law. Here, a modified Navier equation, in terms of displacement under a combination of applied loading is expressed as
where
As illustrated in Figure 2, the damage of rock under tension or shear stress is initiated when the state of stress satisfies the maximum tensile stress criterion or the Mohr-Coulomb criterion, respectively, as expressed by Zhou Jingren et al. (Zhou et al., 2018).
where
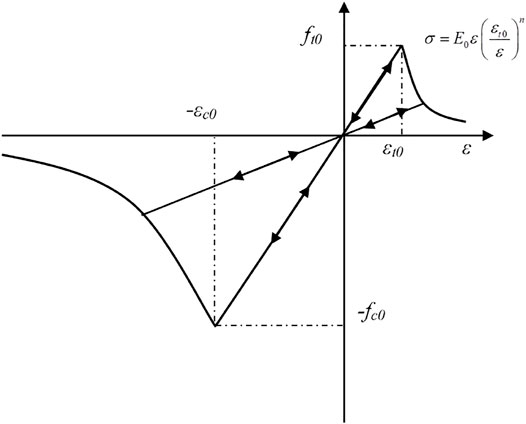
FIGURE 2. The elastic damage-based constitutive law under uniaxialstress condition (Zhou et al., 2018).
According to elastic damage theory, the elastic modulus of an element degrades monotonically with the evolution of damage, and the elastic modulus of damaged material is expressed as follows:
where
where
2.1.2 Constitutive Law of Rock During Rheological Process
The total strain includes both elastic (
Where
where
The creep strain rate is defined by (Su et al., 2013) as follows:
where A, n, m0, and n0 is experimentally determined parameters.
Differentiating Eq. 5 with regards to time and considering a constant total strain, results in a total strain rate
Combining the above equation with Eqs 6, 7 and Eq. 9, the total strain rate can be described by
where
2.1.3 Material Heterogeneity
Geo-material is assumed to be composed of many mesoscopic elements, and in this study the mechanical properties of these heterogeneous geo-materials are assumed to conform to a given Weibull distribution as defined in the following probability density function (Chen et al., 2021):
where
2.2 Numerical Model Description for the Interbedding Rock
As shown in Figure 3, granite diameter is
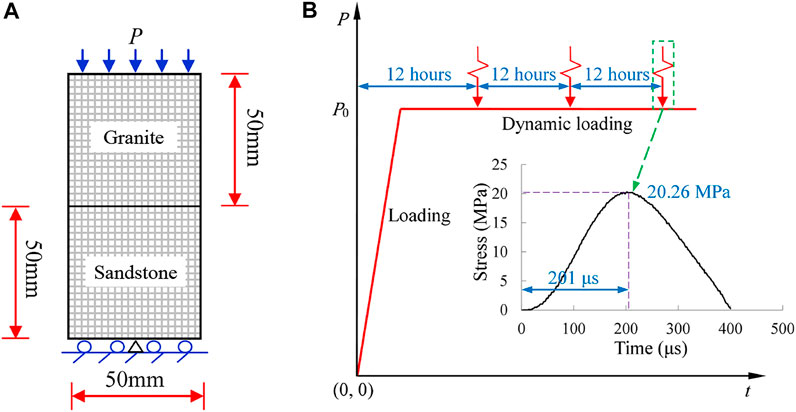
FIGURE 3. Model setup for numerical simulation on interbedding rock specimen under creep with dynamic disturbance: (A) numerical model of double-rock sample, (B) Possible loading history on numerical model.
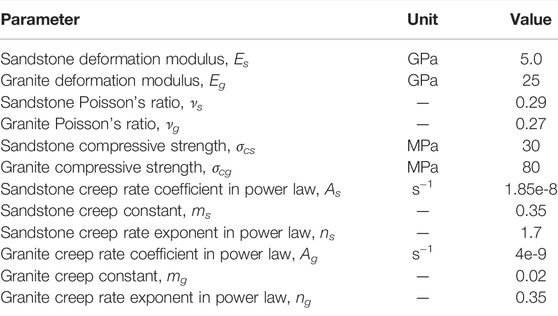
The calculation model is divided into 1,256 triangular units and 22,583 nodes. The physical and mechanical parameters used in the numerical model are shown in Table 1.
2.3 Numerical and Experimental Results
As shown in Figure 4A, the strain time curve of multi-stage creep granite and sandstone composite sample after dynamic disturbance is obtained through test and numerical simulation. When the strain of the specimen reaches 3,117 με, the stress reached 15.18 MPa, the specimen began to creep, and after 12 h, the final strain increased to 3,212 με. The change is 2.95%. After 12 h, the sandstone and granite composite specimens were dynamically disturbed by drop hammer impact, resulting in the strain from 3212 to 3576 με (increased by 355 με). Therefore, during the first creep dynamic disturbance of the sandstone part of the combined sample, as shown in Figure 5A, uniformly distributed damage appears in the sample. According to the double specimen creep impact disturbance test process, the specimen was subjected to the second impact disturbance at 24 h.
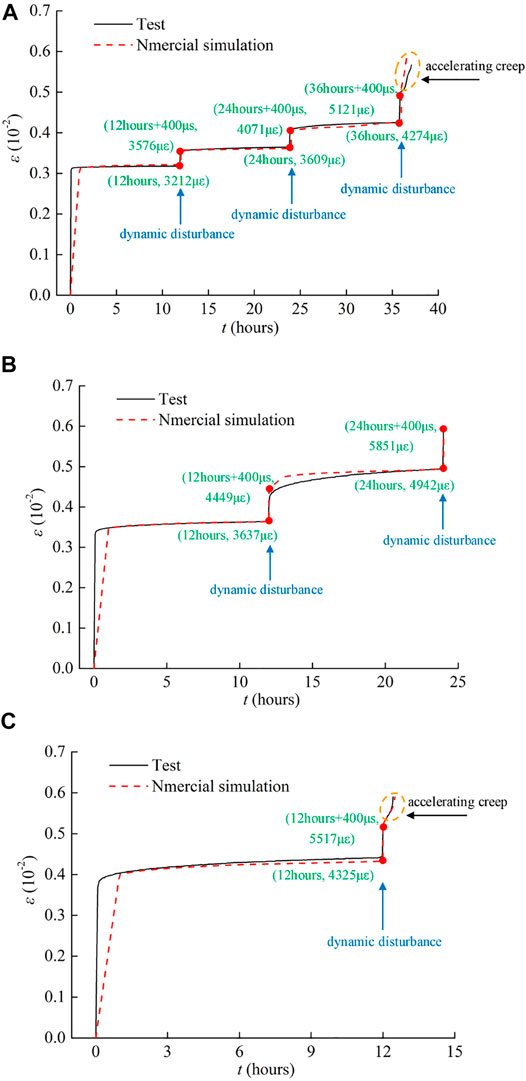
FIGURE 4. Numerical and experimental results of rock under multi-stage creep test with dynamic disturbance: (A) creep stress = 15.18 MPa and impact high = 30 cm, (B) creep stress = 17.71 MPa and impact high = 30 cm, (C) creep stress = 20.24 MPa and impact high = 30 cm.
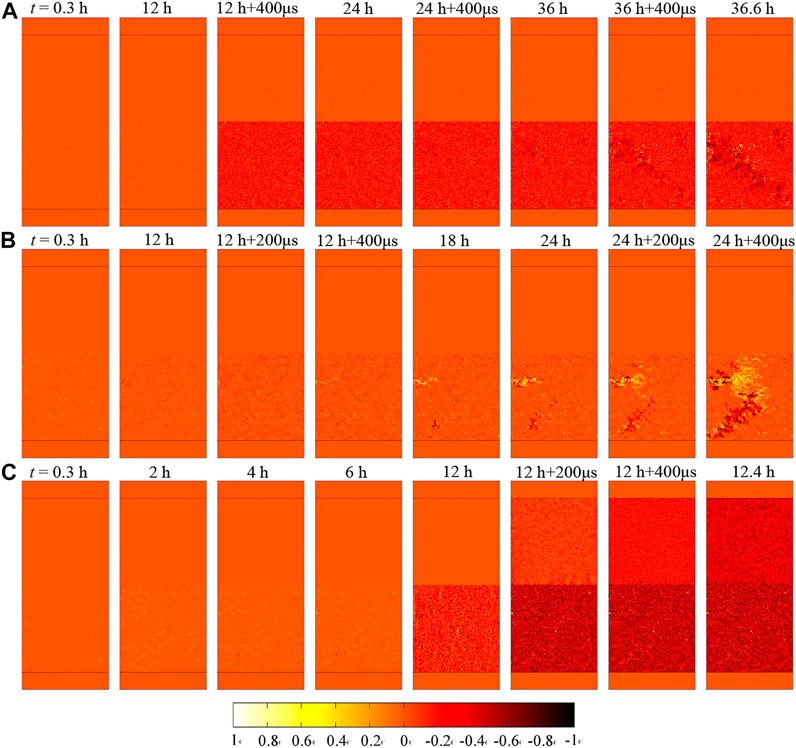
FIGURE 5. Numerical results of damage distribution under multi-stage creep test with dynamic disturbance: (A) creep stress = 15.18 MPa and impact high = 30 cm, (B) creep stress = 17.71 MPa and impact high = 30 cm, (C) creep stress = 20.24 MPa and impact high = 30 cm.
After the second impact disturbance of the sample, the double sample entered the third creep stage, and the strain of the rock sample was 4,274 με at t = 36 h. Similarly, according to the double specimen creep impact disturbance test process, the specimen was subjected to the third impact disturbance at 36 h, and the strain caused by impact increased from 4,274 με Increased to 5,121 με. Then the sample entered accelerated creep. As shown in Figure 5A, Figure 6A, the sandstone sample showed an oblique crack at 30° to the horizontal direction at t = 36.6 h.
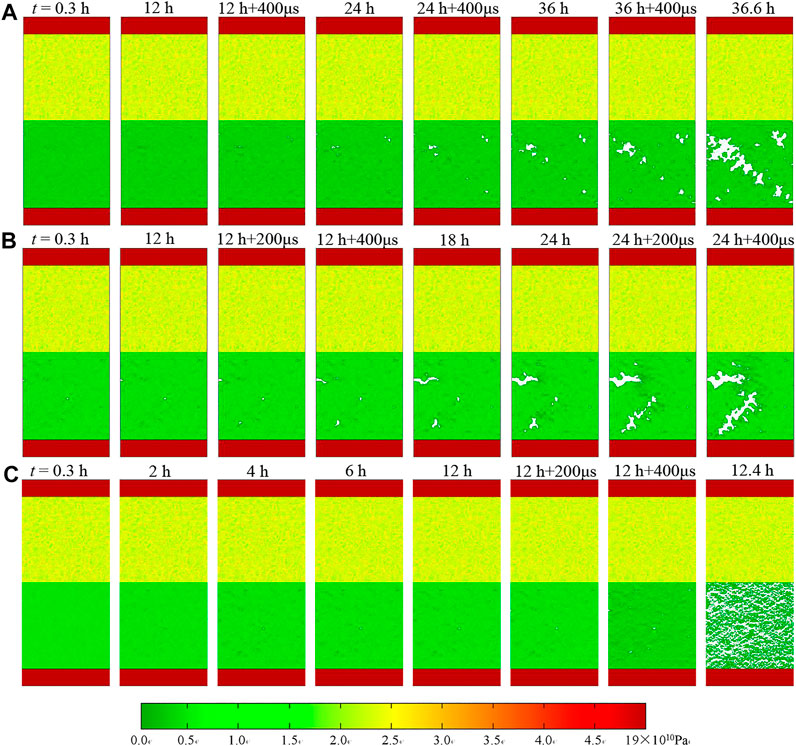
FIGURE 6. Numerical results of elastic modulus under multi-stage creep test with dynamic disturbance: (A) creep stress = 15.18 MPa and impact high = 30 cm, (B) creep stress = 17.71 MPa and impact high = 30 cm, (C) creep stress = 20.24 MPa and impact high = 30 cm.
Figure 4B showed the damage evolution process of the whole creep dynamic disturbance of the double specimen under the creep stress of 17.17 Pa. Firstly, the specimen is loaded at t = 8 min, and the specimen was less damaged. Then, in the creep stage, the damage points at t = 12 h increased. The sample was subjected to the first impact disturbance at 12 h. Under the action of dynamic load, the strain of the sample suddenly increased, resulting in the strain from 3,637 με Increased to 4,449 με (increased by 812 με). Then the sample entered the second creep stage at the creep stress of 17.17 Pa, and the sample strain increased to 4,942 με at t = 24 h. The sample was subjected to the second impact disturbance at t = 24 h, and the stress wave was repeatedly reflected inside the sample, so that the combined tensile stress after superposition was greater than the uniaxial tensile strength of the sample, at t = 24 h +400 μs caused the specimen to break in Figure 6B. The creep stress in Figure 4C was higher than that in Figures 4A,B, so one impact leaded to the failure of double specimens.
3 Subsidence Problems due to Blasting Workings in the Main Shaft of Mine
3.1 Numerical Model Setup
In the Xincheng Gold Mine, the XI# ore and the I# ore are connected. The XI# ore body reached the development stage, but was not explored. To analyze the effects of blasting disturbance on the long-term stability of the main vertical shaft during exploitation of the XI# ore body, a numerical model was established of exploitation and blasting disturbance of the XI# ore body versus the stability of rheological wall rock of the main shaft.
To establish the model, the main shaft with infinite length was simplified as a plane strain problem. The numerical model in this section has a size of 60 m × 60 m with a 6 m hole at the center, as shown in Figure 7. Considering the effects of soft ore and strong surrounding rock on the creep of rock mass, a hollow cylinder was embedded in the middle of the model. The size of the modelled specimen was maintained for all of the numerical simulations. The numerical model was discretized into 2,582 triangular elements and contains soft ore thickness of D = 0.5 m and overburden depth H = 380 m based on the site-specific geological conditions. This stress fluctuation on the boundary is considered to be the induced stress wave travels into the inhomogeneous rock. In this regard, the soft rocks are repeatedly compressed and the strong rocks are repeatedly stretched.
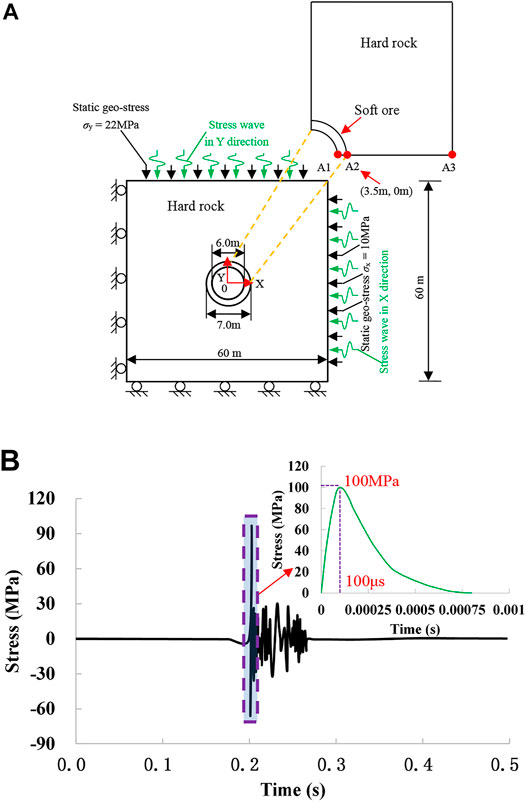
FIGURE 7. (A) Model setup for numerical simulation of rock under rheology with dynamic disturbance; (B) Waveforms used in numerical simulation of the surrounding rheological rockmass of a shaft.
The static geo-stress condition governs the stress distribution and damage zone around the under-ground excavation. The direction of the maximum horizontal stress
Where H represents the depth,
3.2 Practical Estimates of Rock Mass Parameters
The Generalised Hoek-Brown failure criterion for jointed rock masses as described by Hoek and Brown (Hoek and Brown, 1980) is
where
The constant
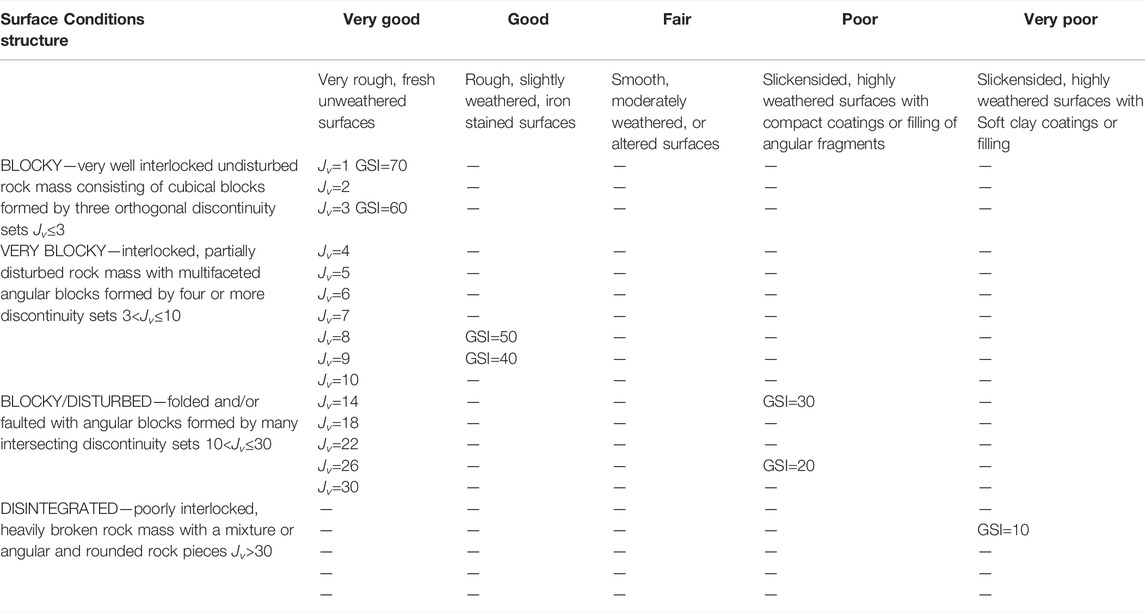
TABLE 3. Geological Strength Index (GSI) estimates based on geological descriptions (Hoek and Brown, 2019).
The strength of the rock mass
where
The deformation modulus of a rock mass (
The equivalent angles of friction and cohesive strengths are given by (Hussian et al., 2020) as follows:
where,
For a roadway project, the relationship between
where,
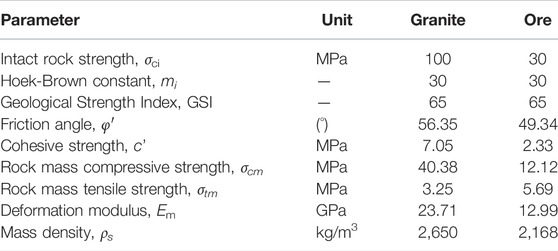
The generalized Hoek-Brown strength criteria were introduced to the geological strength indexes GSI for computing the strength parameters of rock mass, as shown in Table 4. The actual natural rock was nonuniform quasi-brittle material. Reference (Chen et al., 2021) introduced the Weibull statistical distribution function to describe a nonuniform distribution of the mesoscopic mechanical properties of rock. The values of material parameters were determined according to certain given Weibull distribution, and specific parameters are presented in Table 5. The soft ore material constants in the creep constitutive equation
3.3 Modeling Results
3.3.1 Scenario I: Damage Evolution Under Boundary Stress Conditions
Figure 8A presents the determined damage zone of the rheological interbedding structure surrounding the vertical shaft. The grey part represents tensile damage to the rock and the black part denotes intact rock. The damage values are continuously distributed from -1 (tensile damage) to 1 (shear damage). As can be seen in Figure 8A, there is nearly no damage to the sample interior for initial crustal stress
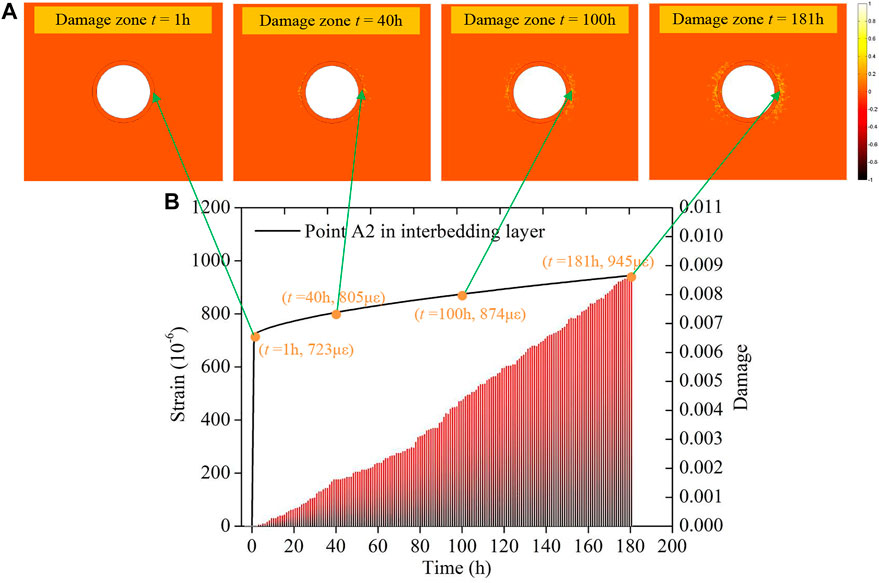
FIGURE 8. Results of the numerical simulation prediction. (A) Distribution of the damage area of the surrounding rheological rockmass of a shaft; (B) Deformation law of the surrounding rockmass points A2 of a shaft.
Figure 8B present the curves for creep strain and damage law at Point A2 of the interbedding structure rock. Point A2 of the wall rock is close to the ore area of the interior wall of the shaft, so the ore for the interior rock of the shaft restricts the deformation of the wall rock. When the strain of the test piece reaches 723 με, the test piece starts to experience creep. At 40 h, the strain of Point A2 of the wall rock reached 805 με. At 181 h, the wall rock experienced creep due to rock damage and eventually the strain increased to 945 με.
3.3.2 Scenario II:damage Evolution Under Coupled Rheology–Dynamic Disturbance Conditions
As shown in Figure 9A, at t = 181 h and 210 μs, the stress along the radial direction for the heterogeneous rock model with a homogeneity index of 3.0 fluctuates near that calculated for the homogeneous elastic model, with no tensile stress induced around the interbedding structure. However, together with the propagation of stress wave, at t = 181 h and 1,050 μs, the tensile stress and the associated tensile damage (Figure 9C) around the shaft.
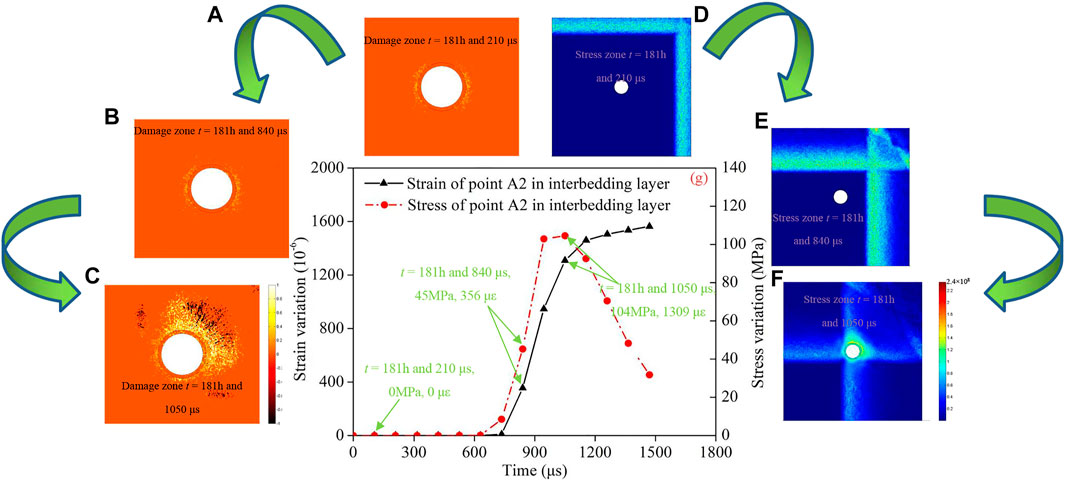
FIGURE 9. The numerical results of a rheological shaft with dynamic disturbance. (A–C) Distribution of the damage area of the surrounding rockmass of a shaft; (D–F) Distribution of the stress area of the surrounding rockmass of a shaft; (G) Deformation and stress law the surrounding rockmass points A2 of a shaft.
Figure 9G shows the strain and stress course curves of the A2 points of the interbedding structure rock under dynamic disturbance. At 181 h, a blasting operation was performed near the shaft roadway. Both the stress and strain increased and the rock was in an elastic stage, indicating that no damage increased to the rock close to the soft ore for the shaft. As shown in Figure 9D, Figure 8E, the bursting stress wave was far away from the interbedding structure rock of the vertical shaft. After 840 μs, the stress changed from 45 to 104 MPa (increase of 59 MPa) and the strain increased by from 356 με to 1,309 με at t = 181 h and 1,050 μs under the influence of the blasting stress wave. But after t = 181 h and 1,050 μs, the observed increase in strain and decrease in stress may result from two aspects. On one hand, the rock sample is damaged, resulting in a decrease in the deformation modulus of the sample. With improved deformation performance, the stress decreases. On the other hand, dynamic disturbance leads to further compression of the rock and the strain will further increase. However, once the disturbance is removed, the rock maintains partial residual deformation without full restoration of elastically, so the rock stress decreases.
4 Discussion
In the research of predicting the occurrence of temporal events, some scholars have made many outstanding contributions. Li et al. (2021a) used long-short-term-memory recurrent neural networks to predict the wind directions for a wind turbine generated largest energy. In Reference (Li et al., 2021b), the deep belief network method and the exponentially-weighted moving average (EWMA) control chart were utilized to predict the generator bearing failure on the condition of the dynamic and random stress. He and Kusiak (2018) applied the extreme learning machines to predict the performance of wind turbines at future. Numerical simulation is also a method to predict the occurrence of time events. We first compare the theoretical model with the numerical model on the rheological shaft with interbedding structure. The numerical model can predict the process of the rheological rockmass with interbedding structure for visco-elastic analysis. We assume that there is an infinite geologic body, under both in situ horizontal stress
Where
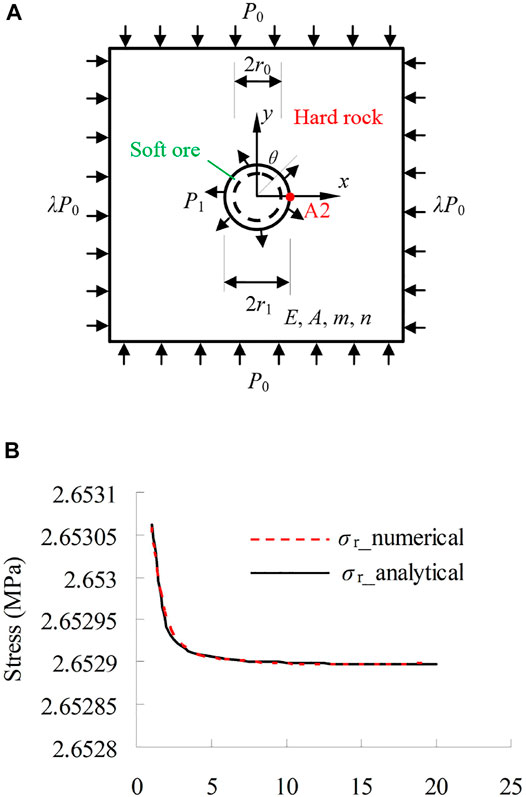
FIGURE 10. The rheological shaft with interbedding structure. (A) Mechanical model; (B) Numerical model and comparison of numerical and theoretical results A2 (x = 3.5, y = 0) for visco-elastic analysis.
In general, the rock creep process can be influenced by a series of factors including stress level and loading time. The creep strain can be described as (Kraus, 1980):
Where
The overall response of the cavern wall rock can be regarded as a two-stage response of instantaneous elastic response and creep response (Yu et al., 1983). Formulae 25 and 26 and Formulae 34 and 35 were superposed to obtain the stress distribution in the cavern wall rock:
Subject to the action of the soft ore, the radial tensile stress
5 Conclusion
Based on the numerical simulation analyses of the stability of the rheological interbedding structure surrounding the main vertical shaft of the Xincheng Gold Mine Ⅺ# ore, we draw the following conclusions.
1) Based on the tensor form of the rheological equation of the total strain rate and the theory of damage mechanics, we used the maximum tension strain and the Mohr—Coulomb criteria as the damage assessment criteria to establish a rheological numerical model of the double-rock. The numerical result suggests that the interbedding structure rock exhibits significant creep occurs under multi-stage creep test with dynamic disturbance. The damage of the double-rock creep was an oblique crack at 30° to the horizontal direction under the stress = 15.18 MPa and impact high = 30 cm.
2) The rheological numerical simulation of mining disturbance of the interbedding structure surrounding the main shaft at -380 m reveal that the strain and stress increase simultaneously and exhibit consistency after the ore rock close to the shaft is subject to stress wave disturbance. After the interbedding structure near the shaft is subjected to stress wave disturbance, the strain increases and the stress decreases, causing unloading due to the residual deformation produced by the rock before and after dynamic disturbance.
Data Availability Statement
The original contributions presented in the study are included in the article/Supplementary Material, further inquiries can be directed to the corresponding author.
Author Contributions
Conceptualization, SL; Methodology, SL and CZ; Validation, SL; Formal Analysis, SL; Investigation, SL; Writing-Original Draft Preparation, SL and CZ; Writing-Review and Editing, YZ; Supervision, CZ; Project Administration, CZ; Funding Acquisition, CZ.
Funding
This work was funded by the Key scientific and technological projects in Henan Province (No. 222102320173) and the Key Project of Universities of Henan Province (No. 17A580002).
Conflict of Interest
The authors declare that the research was conducted in the absence of any commercial or financial relationships that could be construed as a potential conflict of interest.
Publisher’s Note
All claims expressed in this article are solely those of the authors and do not necessarily represent those of their affiliated organizations, or those of the publisher, the editors and the reviewers. Any product that may be evaluated in this article, or claim that may be made by its manufacturer, is not guaranteed or endorsed by the publisher.
References
Bell, F. G., and Genske, D. D. (2001). The Influence of Subsidence Attributable to Coal Mining on the Environment, Development and Restoration: Some Examples from Western Europe and South Africa. Environ. Eng. Geosci. 7 (1), 81–99. doi:10.2113/gseegeosci.7.1.81
Cai, M., Qiao, L., Li, C., Yu, B., and Wang, S. (2000). Results of In Situ Stress Measurements and Their Application to Mining Design at Five Chinese Metal Mines. Int. J. Rock Mech. Min. Sci. 37 (3), 509–515. doi:10.1016/S1365-1609(99)00077-5
Cai, M., Kaiser, P. K., Uno, H., Tasaka, Y., and Minami, M. (2004). Estimation of rock mass deformation modulus and strength of jointed hard rock masses using the GSI system. Int. J. Rock Mech.Min 41 (1), 3–19. doi:10.1016/S1365-1609(03)00025-X
Chen, X., He, P., Yan, D. M., and Nie, A. X. (2020). Face Stability and Reinforcement of the Tunnel in Weak Surrounding Rock. Geotech. Geol. Eng 38 (5), 5511–5521.
Chen, Y., Xiao, P., Du, X., Wang, S., Wang, Z., and Azzam, R. (2021). Study on Damage Statistical Constitutive Model of Triaxial Compression of Acid-Etched Rock under Coupling Effect of Temperature and Confining Pressure. Materials 14 (23), 7414. doi:10.3390/ma14237414
Cui, S., Pei, X., Jiang, Y., Wang, G., Fan, X., Yang, Q., et al. (2021). Liquefaction within a Bedding Fault: Understanding the Initiation and Movement of the Daguangbao Landslide Triggered by the 2008 Wenchuan Earthquake (Ms = 8.0). Eng. Geol. 295, 106455. doi:10.1016/j.enggeo.2021.106455
Debernardi, D., and Barla, G. (2009). New Viscoplastic Model for Design Analysis of Tunnels in Squeezing Conditions. Rock Mech. Rock Eng. 42 (2), 259–288. doi:10.1007/s00603-009-0174-6
Fahimifar, A., Tehrani, F. M., Hedayat, A., and Vakilzadeh, A. (2010). Analytical Solution for the Excavation of Circular Tunnels in a Visco-Elastic Burger's Material under Hydrostatic Stress Field. Tunn. Undergr. Space Technol. 25 (4), 297–304. doi:10.1016/j.tust.2010.01.002
Feng, X. J., Ding, Z., Ju, Y. Q., Zhang, Q. M., and Ali, M. (2022). "Double peak" of dynamic strengths and acoustic emission responses of coal masses under dynamic loading. Nat. Resour. Res. 31 (3), 1705–1720. doi:10.1007/s11053-022-10066-3
Fu, Z. L., Fan, Q. Z., and Wang, S. H. (2010). Theoretical and Experimental Study on Disturbance Effects on Rock Creep, Volume Ⅰ. Hangzhou, China: Zhejiang University Press.)
Gao, Y. F., Fan, Q. Z., Chui, X. H., and Fu, Z. L. (2007). Experimental Study on the Perturbation Effect of Rock Rheology. Beijing, China: Science Press.
He, Y., and Kusiak, A. (2018). Performance Assessment of Wind Turbines: Data-Derived Quantitative Metrics. IEEE Trans. Sustain. Energy 9 (1), 65–73. doi:10.1109/TSTE.2017.2715061
Hoek, E., and Brown, E. T. (1997). Practical Estimates of Rock Mass Strength. Int. J. Rock Mech. Min. Sci. 34 (8), 1165–1186. doi:10.1016/S0148-9062(97)00305-710.1016/s1365-1609(97)80069-x
Hoek, E., and Brown, E. T. (2019). The Hoek-Brown Failure Criterion and GSI - 2018 Edition. J. Rock Mech. Geotechnical Eng. 11 (3), 445–463. doi:10.1016/j.jrmge.2018.08.001
Hoek, E., and Brown, E. T. (1980). Underground Excavations in Rock. London: Institution of Mining and Metallurgy.
Huang, J. Z., Feng, X. T., Zhou, Y. Y., and Yang, C. X. (2019). Stability analysis of deep-buried hard rock underground laboratories based on stereophotogrammetry and discontinuity identification. B. Eng. Geol. Environ 78 (7), 5195–5217. doi:10.1007/s10064-019-01461-x
Li, H., Deng, J., Feng, P., Pu, C., Arachchige, D. D. K., and Cheng, Q. (2021). Short-term Nacelle Orientation Forecasting Using Bilinear Transformation and ICEEMDAN Framework. Front. Energy Res. 9, 780928. doi:10.3389/fenrg.2021.780928
Li, H., Deng, J., Yuan, S., Feng, P., and Arachchige, D. D. K. (2021). Monitoring and Identifying Wind Turbine Generator Bearing Faults Using Deep Belief Network and EWMA Control Charts. Front. Energy Res. 9, 799039. doi:10.3389/fenrg.2021.799039
Li, H., He, Y., Xu, Q., Deng, J., Li, W., and Wei, Y. (2022). Detection and Segmentation of Loess Landslides via Satellite Images: a Two-phase Framework. Landslides 19 (3), 673–686. doi:10.1007/s10346-021-01789-0
Liu, J. M., Cheng, H., Rong, C. X., and Wang, C. B. (2020). Analysis of Cusp Catastrophic Model for Vertical Stability of Drilling Shaft Lining. Adv. Civ. Eng 2020, 8891751. doi:10.1155/2020/8891751
Lu, H. J., Cai, G. H., He, L., Hu, Z. Y., and Li, J. S. (2011). The Effect of Heterogeneity and Element Sizes on Rock Mechanics Properties. Amr 243-249, 2643–2646. doi:10.4028/www.scientific.net/AMR.243-249.2643
Lyu, P. F., Bao, X. Y., Lyu, G., and Chen, X. H. (2020). Research on Fault Activation Law in Deep Mining Face and Mechanism of Rockburst Induced by Fault Activation. Adv. Civ. Eng 2020, 8854467. doi:10.1155/2020/8854467
Ma, K., and Liu, G. (2022). Three-dimensional Discontinuous Deformation Analysis of Failure Mechanisms and Movement Characteristics of Slope Rockfalls. Rock Mech. Rock Eng. 55 (1), 275–296. doi:10.1007/s00603-021-02656-z
Hussian, S., Mohammad, N., Rehman, Z. U., Khan, N. M., Shahzada, K., and Ali, S. (2020). Review of the geological strength Index (GSI) as an empirical classification and rock mass property estimation tool: origination, modifications, applications, and limitations. Adv. Civ. Eng 2020, 6471837 doi:10.1155/2020/6471837
Sainoki, A., Tabata, S., Mitri, H. S., Fukuda, D., and Kodama, J.-i. (2017). Time-dependent Tunnel Deformations in Homogeneous and Heterogeneous Weak Rock Formations. Comput. Geotechnics 92, 186–200. doi:10.1016/j.compgeo.2017.08.008
Sharifzadeh, M., Tarifard, A., and Moridi, M. A. (2013). Time-dependent Behavior of Tunnel Lining in Weak Rock Mass Based on Displacement Back Analysis Method. Tunn. Undergr. Space Technol. 38, 348–356. doi:10.1016/j.tust.2013.07.014
Shen, J., Karakus, M., and Xu, C. (2012). A Comparative Study for Empirical Equations in Estimating Deformation Modulus of Rock Masses. Tunn. Undergr. Space Technol. 32, 245–250. doi:10.1016/j.tust.2012.07.004
Su, C., Herbert, E. G., Sohn, S., LaManna, J. A., Oliver, W. C., and Pharr, G. M. (2013). Measurement of Power-Law Creep Parameters by Instrumented Indentation Methods. J. Mech. Phys. Solids 61 (2), 517–536. doi:10.1016/j.jmps.2012.09.009
Sun, J. (1997). Rheological Behavior of Geomaterials and its Engineering Applications. Beijing, China: China Architecture and Building Press.
Xie, L. D., Dong, Z. X., Qi, Y. J., Qiu, R. H., and He, Q. (2019). Vibration failure of young low-temperature concrete shaft linings caused by blasting excavation. Adv. Civ. Eng 2019, 5343618. doi:10.1155/2019/5343618
Yang, F. (2018). Study On Stress And Deformation Characteristics Of Expansive Soft Rock Tunnel Of Surrounding Rock And Support Structure, A Dissertation Submitted for the Degree of Doctor. China: Changan University.
Yu, X. F., Zheng, Y. R., Liu, H. H., and Fang, Z. C. (1983). Stability Analysis of Rock Mass for Underground Engineering. Beijing, China: Coal Industry Press.
Zhang, L., Liu, Y., and Yang, Q. (2016). Study on Time-dependent Behavior and Stability Assessment of Deep-Buried Tunnels Based on Internal State Variable Theory. Tunn. Undergr. Space Technol. 51, 164–174. doi:10.1016/j.tust.2015.10.042
Zhang, X. C. (2010). Mine Rockburst Mechanism and Prevention Practice. Nanjing, China: Southeast University Press.
Zhou, J., Wei, J., Yang, T., Zhang, P., Liu, F., and Chen, J. (2021). Seepage Channel Development in the Crown Pillar: Insights from Induced Microseismicity. Int. J. Rock Mech. Min. Sci. 145, 104851. doi:10.1016/j.ijrmms.2021.104851
Keywords: shaft, rheology, damage, dynamic disturbance, numerical simulation
Citation: Li S, Zheng C and Zhao Y (2022) Numerical Modeling on Blasting Stress Wave in Interbedding Rheological Rockmass for the Stability of the Main Shaft of Mine. Front. Earth Sci. 10:930013. doi: 10.3389/feart.2022.930013
Received: 27 April 2022; Accepted: 30 May 2022;
Published: 27 June 2022.
Edited by:
Huajin Li, Chengdu University, ChinaReviewed by:
Fuzhou Qi, Zhongyuan University of Technology, ChinaQingrui Lu, East China University of Technology, China
Copyright © 2022 Li, Zheng and Zhao. This is an open-access article distributed under the terms of the Creative Commons Attribution License (CC BY). The use, distribution or reproduction in other forums is permitted, provided the original author(s) and the copyright owner(s) are credited and that the original publication in this journal is cited, in accordance with accepted academic practice. No use, distribution or reproduction is permitted which does not comply with these terms.
*Correspondence: Chao Zheng, MjM1Mzk3MDA2NUBxcS5jb20=
 Shuai Li
 Chao Zheng
 Yong Zhao2