 Shuo Lu
 Wenzhong Zhang1,2
 Jiaming Li
 Shaohua Wang
95% of researchers rate our articles as excellent or good
Learn more about the work of our research integrity team to safeguard the quality of each article we publish.
Find out more
ORIGINAL RESEARCH article
Front. Earth Sci. , 06 September 2022
Sec. Environmental Informatics and Remote Sensing
Volume 10 - 2022 | https://doi.org/10.3389/feart.2022.929927
This article is part of the Research Topic Meta-Scenario Computation for Social-Geographical Sustainability View all 60 articles
Dividing the development stage and grasping the best time to transition are significant for resource-based cities (RBCs). However, there is still a lack of research on how to judge the developmental stage of RBCs through objective indicators of urban development. Identifying the developmental stage of RBCs relies heavily on the researcher’s subjective judgment. Based on nighttime light data, this study utilizes the urban center primacy ratio as a unique indication of the growth stage of RBCs. This method is more detailed and objective than studies that define stages of development based on socio-economic indicators. It provides a fresh viewpoint on the stages of urban life cycle development. Based on the mining economy’s development cycle, the proportion of mining employees at 3.9% and 44.9% can be used to divide RBCs into growth, maturity, recession, and regeneration periods, with 3.9% serving as the dividing line between RBCs and non-RBCs. In addition, when an RBC reaches maturity, a particular range of the urban center primacy ratio has a positive correlation with the GDP growth rate and is negatively correlated outside of that range. This indicates that this period is crucial for the shift from agglomeration diseconomy to agglomeration economy. The government and social institutions can use this period to drive the economic transformation of RBCs through various policies and actions.
Resource-based cities (RBCs) are those cities where the mining and primary processing of mineral resources dominate economic activities. The main economic activity of these cities is resource extraction, which is concentrated in the suburbs (Deacon et al., 2018; Udelsmann Rodrigues et al., 2021). This paper focuses on objectively and precisely detecting the spatial structural evolution trend of RBCs. The urban spatial structure expresses the interaction between the physical environment, functional activities, and other city components (Anas et al., 1998). Unlike urban planning, which focuses on the spatial pattern of cities, this study highlights the spatial representation of human behavior and economic and social activities from a geographical perspective. Currently, the identification of the urban spatial structure focuses mostly on three facets: first, a model analysis and statistical testing approach are used to incorporate location information and spatial distance into the research framework of spatial structure identification based on statistical indicators such as population size and employment-population density (Li, 2020; Veneri, 2018; Garcia–Lopez et al., 2020; Luo et al., 2021). Second, identifying urban spatial information based on the multisource remote sensing data, including Landsat, MODIS, SPOT, DMSP-OLS, and other remote sensing data (Yang et al., 2022), is performed to help researchers identify urban boundaries and structures more objectively and accurately (Yang et al., 2021a; Dembski et al., 2021; He et al., 2021; Hajrasouliha and Hamidi, 2017). Third, real-time monitoring of urban spatial dynamics is performed through spatio-temporal big data. This includes mobile location data, Twitter or Weibo data, public transportation card data, and so on. (Kim, 2019; Chen et al., 2019; Chaix et al., 2012; Hu et al., 2018). This research paper uses remote sensing data to examine the spatial structural evolution of RBCs over a lengthy period because of the presence of statistical flaws in statistical data and the difficulty of accessing spatio-temporal big data.
The evolution of the spatial structure of RBCs has its specificities. One of the main reasons is that RBCs significantly differ from the general urban development model. Generally, spatial agglomeration is helpful to the growth of cities (Williamson, 1965; Morrison Paul and Siegel, 1999; Matlaba et al., 2012; Du and Vanino, 2021). However, there is a different story in RBCs: the extractive industry, the economic backbone of RBCs, relies heavily on mineral resources, and mineral resources are randomly and scattered distributed in geographic space. Therefore, the extractive industry also presents the characteristic of decentralization in space. The decentralized extractive industry supports forming several isolated mining areas and mining towns in RBCs. The rise of mining towns reduces the concentration of economic activities in the urban center of RBCs and begins a looser urban spatial structure (Waddington et al., 2001;Dale, 2002; Graulau, 2008). Marais et al. studied the evolution trend of residential density in five mining towns in South Africa. The results showed that mining towns had sustained low-density development due to path dependence (Marais et al., 2020). Sołtysik conducted a comprehensive review of European resource cities, and the results displayed that the distribution of resources strongly influences the spatial structure of RBCs, showing a distinctly loose character (Sołtysik and Mazur-Belzyt, 2020). Since, in developing countries, some RBCs are established only to obtain mineral resources, the service industry in urban centers is generally underdeveloped, further weakening the agglomeration capacity of urban centers (Yakovleva and Alabaster, 2003; Kotsadam and Tolonen, 2015; Farahani and Shadi, 2017). This shows that the pattern of spatial structure evolution of RBCs is decentralized. However, few studies have explored the specificities of the evolution of the spatial structure in RBCs, which limits scholars’ exploration of the life cycle theory of RBCs.
The evolution of the spatial structure of RBCs is mainly influenced by the rise and fall of resource-based industries. For example, when the resources of RBCs are depleted, the evolution of the urban spatial structure will change fundamentally. Therefore, RBCs’ spatial structure change trend is closely related to the development stage. Because of the apparent differences in the spatial agglomeration and dispersion characteristics between non-RBCs and RBCs, the spatial structure is a suitable indicator light to objectively evaluate the development stage of RBCs (Yang et al., 2021b; Guo et al., 2020). There is a long history of research on the classification of RBC development stages (Batty, 2006; Czamanski and Broitman, 2018). The model first appeared when reflecting Canada’s mature mining economic system in 1971 (Lucas, 2019). Based on this, the life cycle theory and stage division of RBCs have been continuously improved (Bradbury and St- Martin, 1983; Yu et al., 2018). In general, scholars believe that the development of RBCs can be divided into five stages (Figure 1): Rise, growth, maturity, recession, and regeneration (Bruce et al., 2004; Prideaux and Timothy, 2011). However, the main problem is that there is no consensus on the signs of the division of stages. For example, Wilson took 20% as the criterion of resource-dependent communities (Wilson, 2004), while Bruce and Clemenson thought that the criterion should be 25% and 30%, respectively (Bruce et al., 2004; Clemenson, 1992). It can be found that the current classification of RBCs’ development stages is mainly based on subjective judgments made by socio-economic data (Halseth and Sullivan, 2002; Jia et al., 2004). One of the most straightforward approaches, comparing the population or economic size of the central and peripheral areas, reflects the degree of urban agglomeration or dispersion (He et al., 2019). However, intracity statistics is not easily accessible, even for common indicators like population or economic size (Dong et al., 2021). In particular, for the long-timescale data needed to study the evolution of RBCs, these data are time-consuming and not very accurate to obtain. In summary, through the analysis of the current studies related to the division of urban development stages, few studies have classified the development stages of RBCs from the perspective of the urban spatial structure, and it is innovative to explore the evolution of the spatial structure of RBCs by using nighttime light data. This research differs from previous analyses of urban spatial evolution based on light data in two ways. First, unlike studies based on DMSP-OLS nighttime light image data only, this study constructs long time-series image data from 2000 to 2017 by integrating two nighttime light image data sets derived from DMSP-OLS and NPP-VIIRS, respectively. Second, the research of urban space based on the light image is mainly the identification of space form. This study combines image and statistical data to identify the key parameters that cause spatial structural transformation and thus objectively identify the development stages of RBCs.
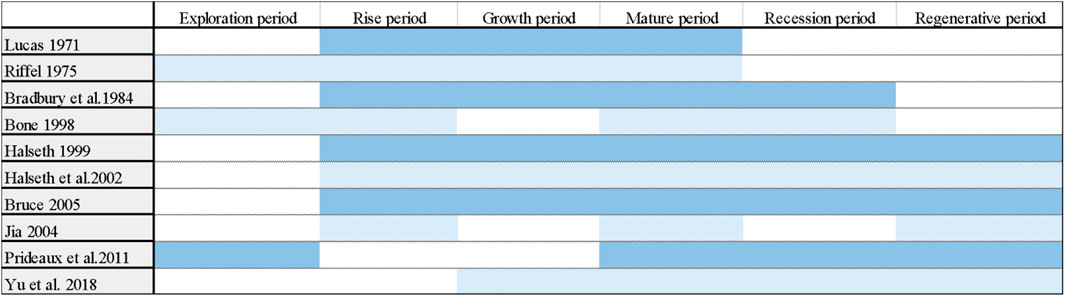
FIGURE 1. RBC development stage division.
This study aims to divide the development stages of RBCs from the perspective of the spatial structure, and the results support exploring the optimal time window for the implementation of transformation policies in RBCs. First, the degree of aggregation of RBCs in central cities was measured by using nighttime light data. The threshold model was used to analyze the non-linear relationship between the industry and spatial structure in the complete life cycle of RBCs and classify the development stages from the perspective of the urban spatial structure; finally, the relationship between spatial agglomeration and economic growth at different development periods is explored to point out the optimal period for the implementation of transformation policies in RBCs.
This study is organized into five sections. The second section briefly describes the study area, data sets, and methodologies. The third section integrates the two data sets of DMSP-OLS and NPP-VIIRS and identifies the key parameters that trigger the spatial structure and developmental stage transition. The fourth section investigates the correlation between agglomeration and growth in different stages of development and determines the optimal stage of policy intervention. Finally, the fifth section concludes the study with some remarks.
As mentioned earlier, there is still no widely recognized standard definition for RBCs. The National Sustainable Development Plan for RBCs (2013–2020) classifies 126 RBCs based on three key indicators: Intensity of extractive functions, output scale factor, and degree of resource contribution. Based on the accessibility of data, 110 RBCs were identified as the research subjects, and these 110 RBCs are scattered in 23 provinces in mainland China (Figure 2). Regarding resource types, coal-based cities have the most significant number of 43, accounting for 40%, followed by comprehensive-based cities with 23. The number of ferrous metal and oil and gas cities is relatively similar, 8 and 10, respectively. The number of non-metal and non-ferrous cities is 12 and 14, respectively.
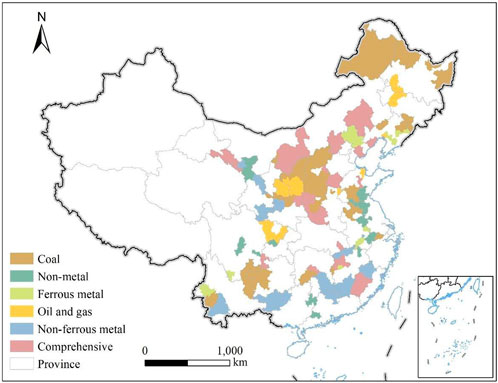
FIGURE 2. Resource-based cities in China.
Notably, although the government regards these cities as RBCs, resource-based industries or communities are not the only factors considered in identifying them. As preferential policies and transfer payments are involved, factors such as regional balance also have a particular impact. Therefore, from an objective point of view, some cities may only be in the early stage of RBCs or may no longer be RBCs. However, because these cities are at different stages, our research has a comprehensive examination of the various stages of the life cycle of RBCs.
The measurement of the urban spatial structure is mainly based on remote sensing data (Zhao et al., 2021). Light image data are a good proxy for urban spatial structure and expansion studies. Croft has been using light data to identify built-up areas of cities since the 1970s (Croft, 1978). Since then, many scholars have applied light data to studying urban spatial expansion and different types of urban spatial structures at long time scales (Milesi et al., 2003; Henderson et al., 2003; Yang et al., 2020). Especially in developing countries where statistical data are not perfect, light data are undoubtedly a reliable means to analyze the spatial structure of mining towns and their evolutionary processes.
Light image data are used to measure RBCs’ spatial structure and evolution. The study of the urban spatial structure usually uses demographic or economic data from different areas within the city (Champion, 2001; Kim, 2007; Wu et al., 2022). However, it is difficult to obtain statistical data in different areas within the city, especially continuous socio-economic statistics over a more extended period. Therefore, the study uses continuous nighttime stable light image data as the primary data for measuring the urban spatial structure. Plenty of studies have shown a significant positive correlation between light and the intensity of economic activity (Mellander et al., 2015; Henderson et al., 2012). Nighttime light data serve as objective data to capture the faint light on the earth’s surface in real time, and it can obtain information that is unavailable from remote sensing during the daytime. Because the vast majority of stable nighttime lighting comes from artificial light sources in cities, it is widely used in areas such as economic vitality estimation, urban built-up area identification, urbanization monitoring, and carbon emissions (Zhao et al., 2014; Zhang et al., 2017; Bagan et al., 2019). To further verify the relationship between DN (DN stands for brightness level) and human activity intensity, several scholars have carried out calibration work and found that the DN values fit linearly well with other data sources characterizing the intensity of economic activity, such as urban GDP and total electricity consumption works well (Cui et al., 2020; Zhao et al., 2019). This shows that the nighttime light data can meet the requirements of my research and can reflect the spatial structural differences in the intensity of economic activities between the central city and the suburban areas.
The light image data used in this study are DMSP-OLS and NPP-VIIRS. DMSP-OLS nighttime light image data are nighttime remote sensing data captured by the National Oceanic and Atmospheric Administration’s Operational Linescan System (OLS) sensor carried by the Defense Meteorological Satellite Program (DMSP), a dedicated weather satellite. In 2013, with the decay and expiration of DMSP/OLS, the Visible Infrared Imaging Radiometer Suite (VIIRS) nighttime light band on board the Suomi National Polar-Orbiting Partnership (Suomi-NPP) became the successor to DMSP/OLS. Compared to DMSP/OLS, NPP/VIIRS has higher subsatellite spatial resolution and better detection capability for nighttime lights. Therefore, the nighttime lighting used in this study is the 2000–2013 DMSP/OLS (Version 4) and NPP/VIIRS DNB for the 2012–2017 monthly synthetic product data sets (Levin and Zhang, 2017). The study differs from the existing analysis of urban spatial evolution based on light data in two aspects: 1) unlike studies based on DMSP-OLS nighttime light image data only, this study constructs long time-series image data from 2000 to 2017 by integrating two nighttime light image data sets derived from DMSP-OLS and NPP-VIIRS, respectively; 2) the research of urban space based on the light image is mainly the identification of space form. This study combines image and statistical data to identify the key parameters that cause spatial structural transformation and thus objectively identify the development stages of RBCs. Indeed, statistics is also essential. Hence, socio-economic data such as the proportion of employees in extractive industries and GDP growth rate are derived from the China Urban Statistical Yearbook 2001–2018 and the Statistical Yearbook of provinces and cities.
The urban spatial structure focuses on the degree of agglomeration of economic activities in the urban center, draws on measurement methods such as industry concentration, and constructs an RBC center urban spatial concentration based on light data to characterize the spatial structure of the resource-based city. To avoid the deviation of the measurement results due to the incomparable light image data of consecutive years, it is first necessary to use the constant target area method to perform regression correction and saturation correction on the image data (Huang et al., 2014). Elvidge et al. (2009) inter-corrected the DMSP/OLS nighttime light image data set for a long time series by extracting the presence of relatively stable image elements in the remote sensing image as an invariant target region. Therefore, He-gang City in the Heilongjiang province study selected the same image as the target region for the quadratic regression calibration model:
where
Saturation correction for the whole country is carried out by using the parameters of each expected correction image and the reference image correction model regression:
where DN’ is the DN value of the image pixel after correction in the national area, and DN is the DN value of the original image pixel in the national area.
Since the available years of DMSP-OLS nighttime light image data are 2000–2013, this study uses the 2013–2017 NPP-VIIRS nighttime light data to make up for the lack of DMSP-OLS nighttime light image data. The integration of the two data types is based on the data cross-correction method proposed by Li in his study of nighttime light dynamics in Syria. There are four main steps: 1) the spatial resolution resampling of all image data of NPP-VIIRS synthesis data and DMSP-OLS was reduced to 1 KM in December 2013, achieving the spatial resolution of the two kinds of data; 2) using the DMSP-OLS data DN value in the range of 0–50 as a mask, the average of the pre-processed NPP-VIIRS data is counted, and the data simulation is achieved by fitting; 3) the NPP-VIIRS data for 2013 and December 2017 were fitted with fitted parameters, and then the fitted image was smoothed with a Gaussian low-pass filter by Matlab; and 4) using the continuity correction method, conditions are set by comparing the DN values of the data with the DN value of the previous period and thus correct the DN values of the later period.
The specific method for measuring the spatial concentration of the urban center area is as follows:
where PR is the urban center primacy ratio,
Compared with the linear model, the threshold effect model, developed by Hansen (1999), can more accurately explore the relationship between the dependent variable and the independent variable. The threshold effect model is designed to capture the inflection point formed by a significant change in the marginal effect of the independent variable y with a change in the dependent variable x. The regression equation does not need to be set as nonlinear in advance but only needs to be set in the linear form for regression, which is a process that effectively circumvents a priori errors. The accurate identification of nonlinear relationships and inflection points among variables makes this model widely used in policy analysis and research (AbdulahiShu and Khan, 2019; Vinayagathasan, 2013). Our research hopes to identify the different development stages of RBCs by confirming the nonlinear impact of resource-based economic development on the urban spatial structure and determining turning points. Therefore, the threshold panel model is the right method to test the impact of a resource-based economy on the urban spatial structure. The former is represented by the proportion of employees in the extractive industry, and the urban center primacy represents the latter.
Existing studies have shown that the urban spatial structure is also affected by economic development and city-scale factors (Meijers and Burger, 2010; Paulsen, 2012). Therefore, such factors should be added to the regression model as control variables. This study refers to the research of Clarke et al. (2006) to construct a threshold regression model.
Here, PR is the urban center primacy; PRBI is the proportion of employees in resource-based industries, reflecting the proportion of resource-based industries in the economic structure. Other control variables that affect the spatial concentration of urban center areas include the level of economic development expressed in terms of per capita GDP (RGDP), and the city size is expressed in terms of the total number of employees (TNE). The meanings of
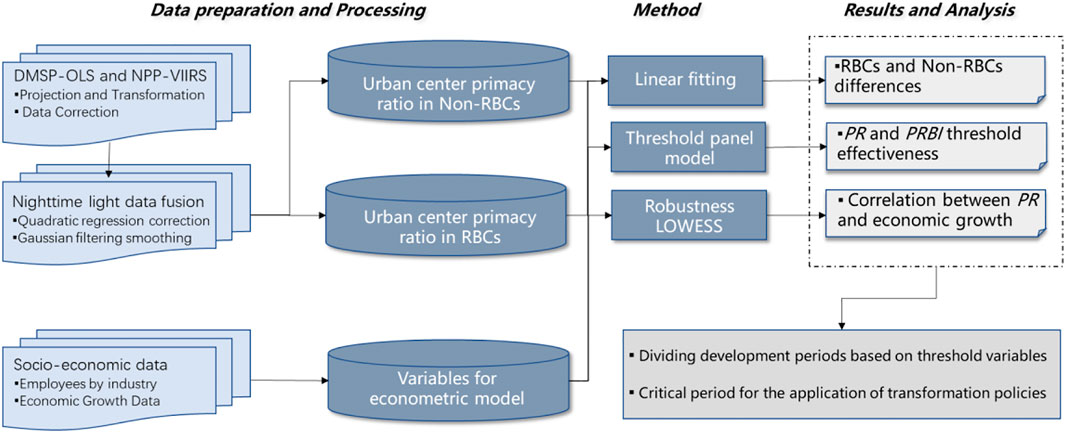
FIGURE 3. Research framework for this study.
The nighttime light data are used to measure the urban spatial structure from 2000 to 2017, but there is a lack of continuous comparable light data, and the information needs to be integrated and processed. The nighttime light image data have the characteristics of timeliness, wide coverage, and practicality, so they can better meet the demand for the study of the urban spatial structure. Since the available years of DMSP-OLS image data are 2000–2013 and the data after 2013 are not available, this study uses the NPP-VIIRS nighttime light data from 2013 to 2017 to make up for the shortage of DMSP-OLS nighttime light image data. However, there are apparent differences between the two satellite image data: different sensor parameters, spatial resolutions, and spectral response modes. In this study, the two nighttime light data are processed concerning the data correction method proposed by Li in the study of nighttime light dynamics in the Syrian region (Li et al., 2017).
To verify the rationality of the processing method, the differences between the raw and processed data are compared based on the overlay of DMSP/OLS and NPP/VIIRS data in 2012 and 2013 (Figure 4). The overall integration effect of the nighttime light image data was evaluated by comparing the differences between the raw DMSP/OLS and NPP/VIIRS data and the processed NPP/VIIRS and DMSP/OLS data. The results showed that compared with the raw data, the correlation between the NPP/VIIRS and the DMSP/OLS of the processed data obtained by this research method was significantly enhanced, and the standard error was reduced considerably. R2 reached 0.85 and 0.85, respectively, and RSS was only 23.46 and 23.36 after excluding outliers (Figure 5). The simulation parameters obtained from the 2013 data are still stable when applied to the 2012 data, so the overall integration of the data is considered well and this processing method is feasible.
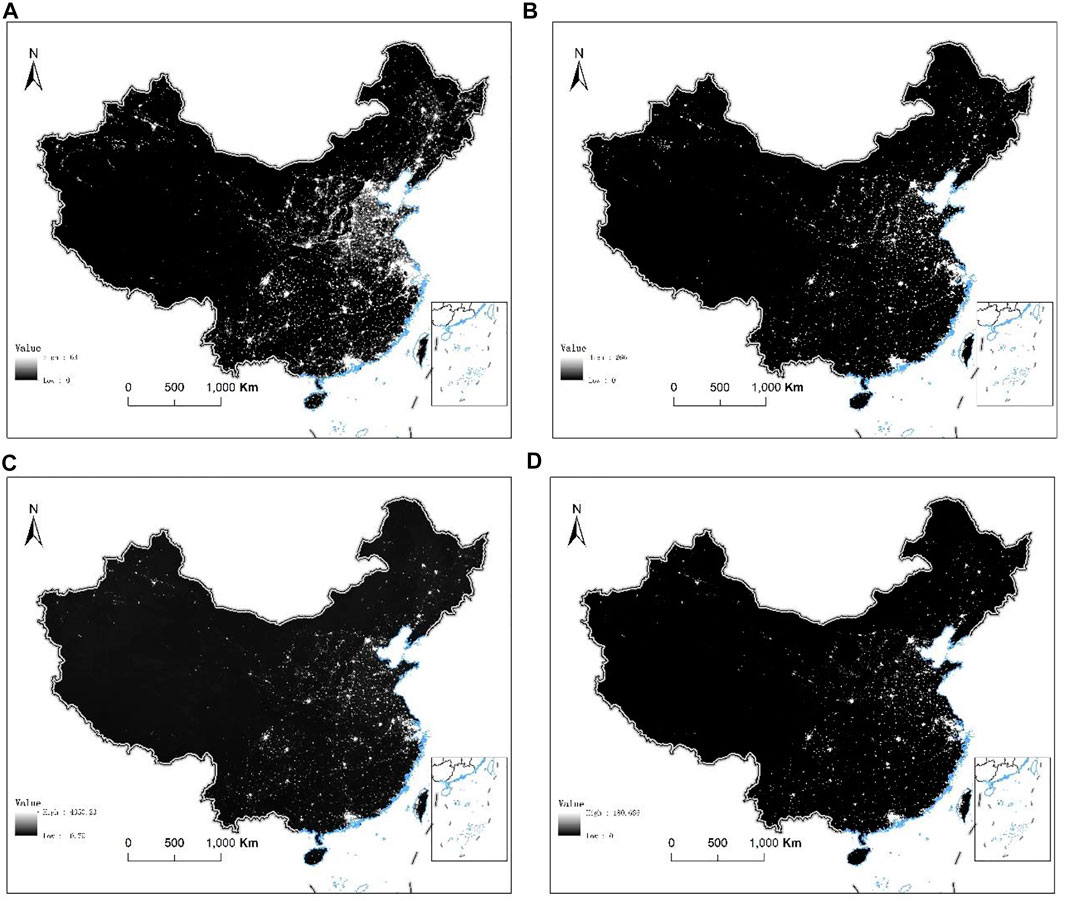
FIGURE 4. DMSP-OLS and NPP-VIIRS nighttime light data before and after processing in 2013. (A) and (B) are raw and processed DMSP/OLS in 2013; (C) and (D) are raw and processed NPP/VIIRS in 2013.
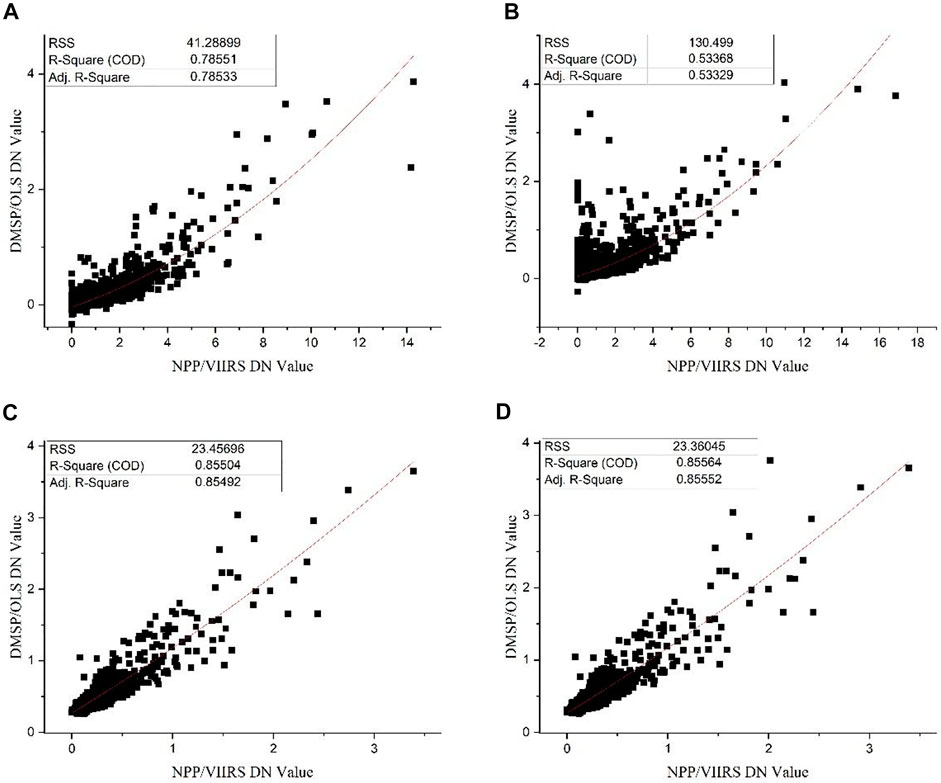
FIGURE 5. Comparison of data integration effects in 2012 and 2013. (A) and (B) are the raw DMSP and NPP lighting data fits in 2012 and 2013; (C) and (D) are the processed DMSP and NPP lighting data fits in 2012 and 2013.
Compared with non-RBCs, RBCs have a significantly lower urban center primacy (PR) and a continuous widening gap. Figure 6 shows that RBCs are mostly light blue in color, and the PR of RBCs in other regions is below the 0.25 horizontal line, except for those in the central region. In 2017, the average PR of RBCs was 0.328, while the average of non-RBCs was 0.421, significantly higher than that of RBCs. From the perspective of changing trends, the PR of Chinese cities from 2000 to 2017 rose first and then declined, and compared to 2000, the overall decrease was 0.0021. The orange area in the figure is significantly less in 2017 compared to 2000. This may be due to the multi-center development trend of some large cities in China. For example, the overall planning of Hangzhou proposes a multi-center urban spatial structure of “one master, three assistants, and six groups.” During this period, the PR of RBCs decreased by 0.0008, reflecting the trend of narrowing the gap between RBCs and non-RBCs. However, the degree of spatial agglomeration of RBCs is still significantly low, indicating that the relatively scattered spatial structure remains.
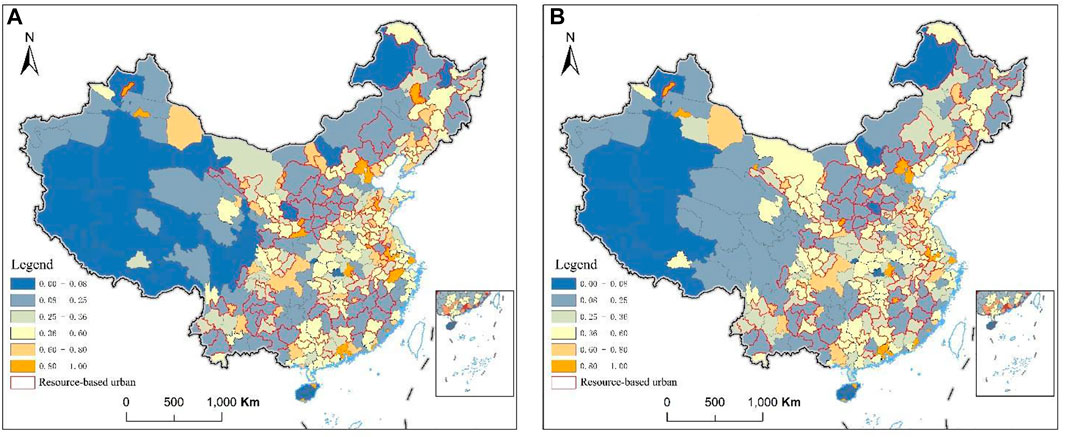
FIGURE 6. Spatial concentration of central urban areas in China. (A) 2000; (B) 2017.
Furthermore, we have also analyzed the spatial structure of cities with different resource types, and the results showed that there are also differences among these cities. The PR of ferrous metal RBCs is higher than the average level in Chinese cities. The urban center area of ferrous metal cities has the highest PR, with an average of 0.392. The figure even exceeds the average level of Chinese cities. However, the levels of coal, oil and gas, non-metallic and non-ferrous metals, and PR are significantly lower. The average PR is 0.346, 0.345, 0.337, and 0.289, respectively. Generally, the PR of RBCs is lower than the city’s overall level.
In addition, there is a significant difference between RBCs and non-RBCs in the correlation between the spatial structure and the scale of employees. In non-RBCs, with the expansion of urban employment, urban center PR generally shows an increasing trend, while the two variables of RBCs show a decreasing trend (Figure 7). Comparing with non-RBCs proves that RBCs are primarily concentrated in mining areas on the periphery of the central city. The differentiated results further confirmed that the spatial structure is a good indicator for identifying RBCs and non-RBCs.
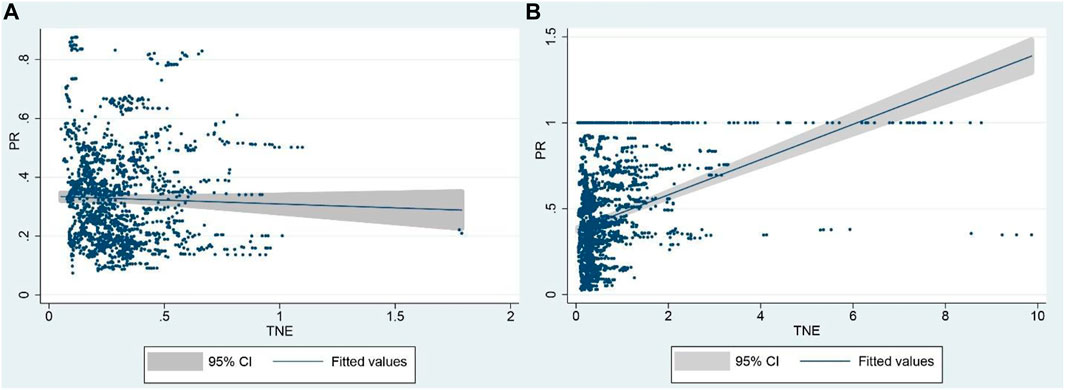
FIGURE 7. The difference in the correlation between the spatial structure and the scale of employees in RBCs and non-RBCs. (A) RBCs; (B) non-RBCs.
There is a strong correlation between the spatial concentration of resource-based urban centers and the proportion of resource-based industries such as extractive industries (Li and Zhang, 2001; Li et al., 2013). The higher the ratio of the extractive industry in the urban economy, the more developed mining towns that rely on extractive industry activities. Mining towns’ rapid economic growth and population growth have reduced the degree of agglomeration in the urban center. Therefore, the high proportion of the extractive industry in the urban economy leads to a low level of spatial concentration in urban center areas.
Empirical analysis has been done using the proportion of employees in the extractive industry as the threshold variable. The results showed that the dual-threshold test of the balance of employees in the extractive industry had the highest significance at the 1% level (Table 1), and the p-value was less than 0.01, so there were two thresholds of 0.039 and 0.449 (Table 2). The test result and p-value are obtained through repeated sampling 300 times by the self-sampling method.
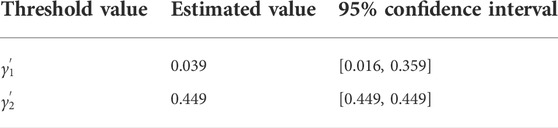
TABLE 1. Double threshold estimate and confidence interval.
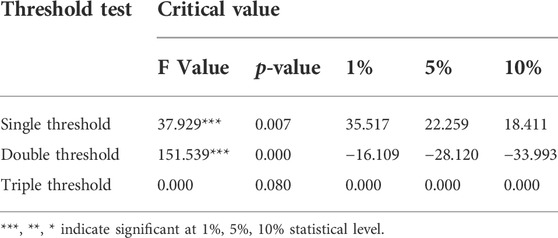
TABLE 2. Threshold effect test results.
The results demonstrated that the increase in the share of resource-based industries has a significant impact on the urban spatial structure, and the threshold test result reached a significance level of 1%. Importantly, the impact of the proportion of resource-based industries (PRBI) on the urban spatial structure is not linear. Two obvious mutation thresholds have been found (Table 3). The first threshold is that the PRBI reaches 3.9%. When the PRBI is less than 3.9%, there is a positive correlation between urban spatial concentration and the PRBI, and the correlation coefficient is 1.870. This means that the urban spatial concentration increases as the PRBI increases. When the PRBI is higher than 3.9%, the two variables are still positively correlated. The difference is that the correlation coefficient is significantly reduced to 0.435 from 1.870. The findings show that when the share of resource-based industries is more than 3.9%, its role in promoting the agglomeration capacity of urban center begins to decrease.
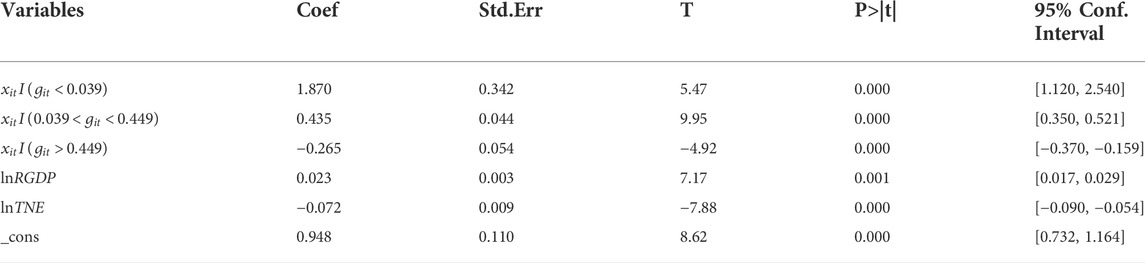
TABLE 3. Double threshold estimate and confidence interval.
The most significant turning point comes from the second threshold when resource-based industries account for 44.9%. After this value is exceeded, the concentration of urban center areas decreases as the proportion of resource-based industries increases. In other words, the development of resource-based industries has weakened the agglomeration capacity of urban centers. This differs from the spatial agglomeration of economic activities usually caused by industrial externalities.
According to the two thresholds, the interaction between PRBI and PR is further sorted out. PRBI accounts for only 3.9%, indicating a relatively low proportion of the mining economy and relatively few industrial workers. It is difficult for these workers to support a mining town, so they prefer to live in the urban center. Finally, mining and economic development strengthen the agglomeration capacity of the urban center. This is the reason why when the mining economy was at a relatively low level, the degree of agglomeration in the urban center continuously increased as the mining economy grew. This also shows that when the PRBI is less than 3.9%, there is no diffusion effect on the urban spatial structure, and the characteristics of RBCs are not obvious. In adddition, the proportion of 3.9% of resource-based industry employees is also significantly higher than the national urban average of 1.07%. Therefore, this value can be used as an important node for the transformation of ordinary cities to RBCs or RBCs to regenerative cities. Meanwhile, the results of the control variables are consistent with theoretical expectations, and the coefficient of the RGDP variable is significantly positive, indicating that the increase in the level of economic development has promoted the increasing degree of agglomeration in the urban center. There is a significant negative correlation between TNE and PR, demonstrating that the larger the scale of employees, the more dispersed the urban spatial structure.
The proportion of employees in the resource-based industry reached 44.9%; nearly one-half of the labor force is employed in the mining sector. The mining economy has dominated the urban economy (Figure 8). After exceeding this level, the further growth of the mining economy has led to the decentralized development of urban space. This indicates that mining towns surrounding RBCs are built under the support of the mining economy, and their dependence on urban centers is also significantly reduced. The effect of decentralization in peripheral mining towns is the same or surpasses the impact of economic agglomeration in the urban centers. Therefore, 44.9% of PRBI can be used as an essential indicator that RBC is entering the decentralized development stage. At this stage, the urban spatial structure of these RBCs showed prominent decentralization characteristics. However, not all RBCs will stage spatial dispersion. In other words, although each mining town’s development will weaken the urban center’s agglomeration power, not all RBCs have sufficiently developed mining towns that can completely offset or even exceed the agglomeration power of urban centers. In the case of China, from 2000 to 2017, there were only four cities with more than 44% of employees in the extractive industry.
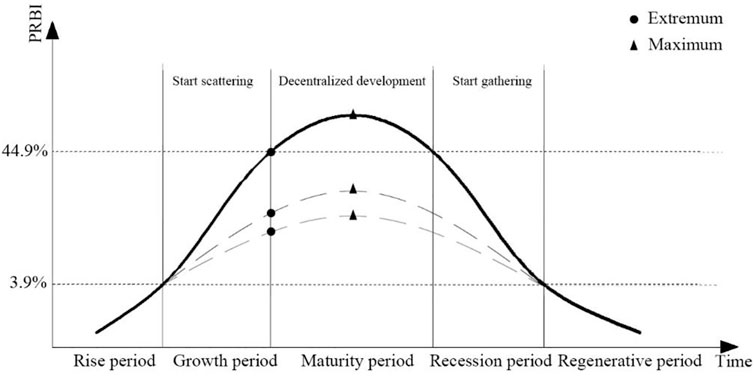
FIGURE 8. The identification of the resource-based urban development stage. Each line in the figure represents the life cycle trajectory of different RBCs, and the dotted line indicates that some cities cannot exceed a PRBI of 44.9% during their life cycle.
The abovementioned is the first half of the life cycle of RBCs. The first threshold value of 3.9% can be taken as a turning point for RBCs from the resource-based stage to the non-resource-based stage, and the second threshold is a sign that RBCs shift from agglomeration development to decentralized development. Correspondingly in the latter half of the life cycle of a resource-based city, the values of the first and second thresholds become the demarcation point between recession and regeneration as well as decentralization and agglomeration.
The first threshold is a sign of a rise or regenerative period, while whether the spatial structure is scattered or not is not suitable as a marker for a maturity or recession period. The changing trend of the proportion of employees in resource-based industries is still an important indicator of the development stage of RBCs. According to the change in the percentage of employees in extractive industries from 2000 to 2017, RBCs can be further divided into three types: cities in a period of growth, recession, and maturity. It is clear that those cities where the proportion of employees in the extractive industry continues to increase are in the growth period; those where the proportion of extractive industry employees continues to decrease are recession cities. Defining maturity cities is a tricky issue. RBCs have two important characteristics: one is that the proportion of employees in resource-based industries has experienced a process of growth first and then decline, and the other is that the development is relatively stable. Therefore, the maturity period of RBCs is defined as the range between Time1 and Time2 (Figure 8), where Time1 and Time2 are the first years to the left and right of the year in which the global maximum is located, respectively, satisfying y=f(x)=90% of global maximum y'. If there is no extreme point or the gap between the extreme point and the maximum point is greater than 1%, the year in which the maximum point is located is identified as the maturity period.
According to the criteria of resource-based urban development, 110 RBCs in China were divided into four stages, growth, maturity, recession, and regeneration periods, between 2000 and 2017. The median of the PRBI of the four types of cities from 2000 to 2017 was calculated to characterize the changing trend of the spatial structure of RBCs at different stages. The results are basically in line with our expectations. RBCs in the development stage have continued to decline in spatial agglomeration, while those cities in the recession stage have a significant increase in the agglomeration of economic activities in the urban center. The degree of agglomeration of cities in the maturity stage and regeneration stage tends to decrease and increase, respectively, in the process of fluctuating development (Figure 9).
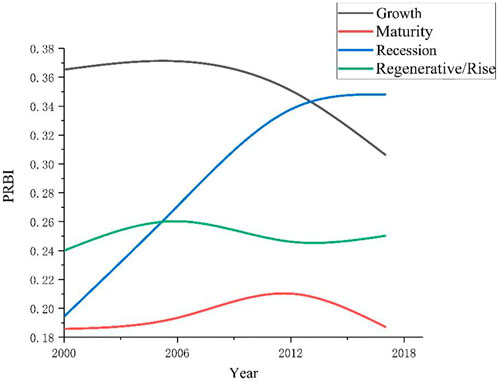
FIGURE 9. Trends in the spatial concentration of the urban central area of RBCs at different periods of development.
Differences in the PRBI trends reflect the significant impact of resource-based industries on the urban spatial structure during the evolution of RBCs’ life cycle. In the emerging stage of RBCs, resource extraction is an important pillar of urban economic development, and socio-economic activities are basically organized and arranged around the resource extraction industry. Ultimately, the scattered distribution of mineral resources leads to the decentralization of the urban spatial structure. When an RBC is in a recession stage, the situation is completely different. Due to the exhaustion of resources, the mining economy cannot support the development of the entire economy alone. The gradual development of non-resource-based industries has prompted cities to present the characteristics of non-RBCs, that is, the rapid concentration of economic activities in the urban center.
The abovementioned analysis has suggested that there are obvious differences in the spatial structure of RBCs at different stages, and we also want to know whether such a spatial structure is conducive to the economic growth of cities or not. For non-RBCs, spatial agglomeration tends to be beneficial to the economic efficiency and growth of the city (Fujita et al., 1999; Krugman, 1991). However, some important questions need to be answered for RBCs, such as whether agglomeration is also beneficial to urban development in the transformation process of RBC development or not and whether policy measures should be adopted to limit urban decentralization at the beginning of RBCs or not. These answers are an essential basis for the focus and timing of sustainable development intervention policies for RBCs.
There is no doubt that before resources are exhausted, the government should intervene in RBCs to promote their transformation, but when is it appropriate? As early as 1983, Bradbury used the coal resource town of Quebec-Labrador to propose a work strategy for establishing early warning, financial assistance, transfer training, and relocation, taking into account the pattern of the development cycle of the extractive industry and changes in jobs (Bradbury and St- Martin, 1983). Lu et al. (2007) also compared the differences in the transformation of RBCs in China and Western countries and argued that the main reason for the decline of RBCs in Western countries was a change in comparative advantage, while in China, it is mainly resource depletion and the lack of compensation mechanisms. There is no shortage of resource-based towns that have paid a significant cost or even disappeared due to missing the best time for transformation (Cao et al., 2015; Chen et al., 2018; Martinez-Fernandez et al., 2012). Therefore, it is essential to determine the direction of the transformation policy and the timing of intervention.
To accurately understand the development pattern of RBCs, it is necessary to distinguish RBCs in different stages of development. After classifying RBCs according to the classification criteria proposed above, the results of Robustness LOWESS confirmed the above theoretical expectations (Figure 10). The concentration of economic activity in the urban center area is not significantly correlated with urban economic growth when the mining economy in RBCs proliferates and dominates the urban economy. However, there is a significant negative correlation when the concentration in the urban center area is too high. When the mining economy is in maturity stage, there is an inverted “U” relationship between the concentration of economic activities in the urban center area and the city’s economic growth. With the decline of the mining economy, the concentration of economic activities and economic growth shows a more apparent positive correlation.
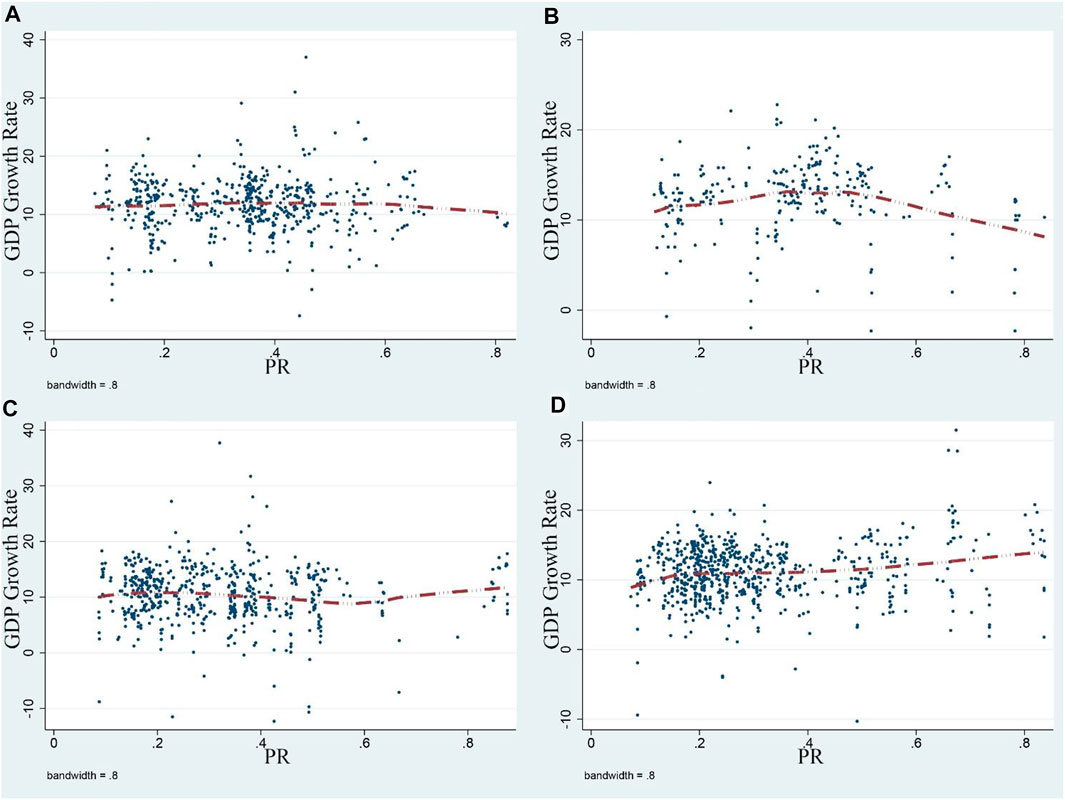
FIGURE 10. Correlation analysis between the spatial concentration and economic growth of regional central cities at (A) growth period, (B) maturity period, (C) recession period, (D) regenerative period.
In general, during the period of the rapid growth of the mining economy, the high concentration of socio-economic factors in the urban center area was not conducive to the economic development of RBCs and showed the characteristic of agglomeration diseconomy. In the maturity period, the agglomeration diseconomy began to shift to the agglomeration economy gradually, and the positive externality of the agglomeration economy began to emerge. When the mining economy entered a period of recession and regeneration, the rapid concentration of economic factors in the urban center area significantly boosted the economic growth of RBCs, showing apparent characteristics of an agglomeration economy.
Moreover, the characteristics of agglomeration economies and agglomeration diseconomy exhibited by RBCs are also present in non-RBCs. Still, the processes and reasons for transforming the two types of cities are significantly different. RBCs are transforming from agglomeration economy to agglomeration diseconomy, while non-RBCs are the opposite. Moreover, cost-saving and efficiency improvement are the common reasons for the agglomeration economy in RBCs and non-RBCs. Still, the reasons for the agglomeration diseconomy of the two types of cities are entirely different. The agglomeration diseconomy in the early stage of RBCs is determined by the industrial characteristics of the basic material-oriented layout of the mining economy, while the agglomeration diseconomy in the later stage of non-RBCs is due to the excessive concentration of factors in the space that makes the city appear with traffic congestion and labor cost increase.
Finally, the mature RBCs have a distinct agglomeration economy characteristic that indicates the important timing and overall policy direction for policy interventions related to urban transformation. The diseconomy of agglomeration makes it inappropriate for the government to adopt policies that promote the spatial concentration of economic factors during the growth period of rapid development of RBCs. Still, it is necessary to clarify this period’s short-term and transitional features, and the construction of large-scale, permanent urban facilities is inappropriate. When the city enters a maturity stage, especially when it is in recession, the government should promote the gathering of population, industry, and other socio-economic factors to the urban center area through comprehensive measures such as land supply, industrial guidance, and allocation of public services and facilities and constantly strengthen the urban center agglomeration capacity. It should be emphasized that industrial guidance is not to concentrate heavy industries such as electricity and raw material industry to the metropolitan center area but to attract high-tech and manufacturing industries that can promote industrial transformation and upgrade the city and at the same time focus on the development of manufacturing and service industries that have a solid ability to absorb employment to attract the population to the urban center area through a large number of jobs and promote the smooth transformation of RBCs into generic cities.
As shown by the estimated results, the degree of agglomeration in the central city of RBCs is much lower than that of non-RBCs, and the performance of spatial agglomeration development in RBCs is closely related to the development stage. PRBI acts as a signal indicator in response to the RBC stage and determines the current stage of RBC development.
On the one hand, when RBCs are in the growth period, decentralized development patterns dominate urban spatial development. This is when the mining economy is booming and the suburbs and mining towns around the central city are developing better. Land and infrastructure policies should focus on infrastructure development and public services for residents in areas outside the central city, including the economic and transport links between the central city and the surrounding towns. On the other hand, as RBCs enter a maturity stage, city government managers need to realize that this stage is a critical period in the transformation of agglomeration diseconomy to agglomeration economy and therefore need to make advance deployment and planning for urban change and start to focus on building the economy of the central city. The central city is the core area of the city’s economy and a significant growth pole of the city economy. The central town strengthens the city’s industrial agglomeration function by attracting the agglomeration of production factors such as talents, information, and capital. For RBCs whose urban spatial structure is still at the stage of scattered development, the government should not only further improve the urban infrastructure to enhance the regional radiation capacity of the central city but also expand the industrial space to the transportation system and broaden the scale of investment attraction. At the same time, efforts should be made to attract or cultivate several key enterprises with advanced technology, apparent advantages, and sustainable profitability to create conditions for a smooth transition from the maturity period to the recession period.
There are limitations in the current study: 1) the formulation of the spatial structure of RBCs is relatively broad, and there is a lack of specific description and analysis of the urban spatial structure of typical RBCs at long time scales; 2) the research object of this paper is 110 resource-based prefecture-level cities, and there is a lack of attention to the development of the urban spatial structure at more minor scales, such as county-level cities or districts, leading to the lack of comprehensive results of the relevant research.
RBCs transform from a particular type of city that relies on the decentralized development of mineral resources to a general city driven by an agglomeration economy to realize the city’s sustainable development. Therefore, reunderstanding the development stage of RBCs from the perspective of spatial structure transformation is meaningful for promoting the sustainable development of RBCs and determining the timing of intervention in transitional policies. The results show that when the proportion of employees in the mining industry reaches 3.9% and 44.9%, it will significantly impact the urban spatial structure. The former indicates that the decentralized resource-based economy began to have a significant impact, and the role of agglomeration on economic development has weakened; the latter suggests that the surrounding mining towns are more attractive than the central city, and the city has begun to decentralize development. Combining with the changing trend of the proportion of employees in the mining industry, the four development stages of growth, maturity, recession, and regeneration are quantitatively identified.
Generally, the spatial concentration of RBCs in the growth and maturity periods tends to decrease. In contrast, the overall PR in the recession period shows an increasing trend, and the PR in the regeneration period is relatively stable. Significant differences exist in the correlation between the economic growth of RBCs and the degree of urban spatial agglomeration in the four development stages of RBCs. In a set of rapid development of resource-based industries, spatial aggregation and economic growth are negatively related; in the maturity stage of stable development, there is an inverted “U"-shaped relationship, and a high degree of agglomeration in urban centers is not conducive to economic growth; when resource-based industries enter a period of recession, spatial aggregation and economic growth show a positive correlation as a whole; for regenerative cities, where the extractive industry accounts for less than 3.9%, agglomeration and growth also show a positive correlation.
To a large extent, the transformation of RBCs from agglomeration diseconomy in the rapid growth stage to agglomeration economy in the background of maturity and recession is also the process of transforming RBCs to non-RBCs. The maturity stage is when the correlation between RBCs’ GDP growth rate and spatial structure has changed significantly. Therefore, the maturity stage has become a critical period for the economic transformation of RBCs. When RBCs develop to a maturity stage, land, industry, and infrastructure policies should gradually change from decentralized development to cluster development oriented toward the central city. Measures to promote the concentration of social and economic factors in the urban center will benefit RBCs’ economic sustainability in the later period.
Publicly available data sets were analyzed in this study. This data can be found here: https://eogdata.mines.edu/products/dmsp/#v4_dmsp_download.
Conceptualization, SL and JL; methodology, SL; validation, SL, JL, and WZ; formal analysis, JL; investigation, SL; resources, JL; data curation, SL and SH; writing—original draft preparation, SL; writing—review and editing, JL and WZ; visualization, SL and SH; supervision, JL and WZ. All authors have read and agreed to the published version of the manuscript.
This research was funded by the Second Tibetan Plateau Scientific Expedition and Research, Grant No. 2019QZKK0406.
The authors declare that the research was conducted without any commercial or financial relationships construed as a potential conflict of interest.
All claims expressed in this article are solely those of the authors and do not necessarily represent those of their affiliated organizations or those of the publisher, the editors, and the reviewers. Any product that may be evaluated in this article or claim that may be made by its manufacturer is not guaranteed or endorsed by the publisher.
Abdulahi, M. E., Shu, Y., and Khan, M. A. (2019). Resource rents, economic growth, and the role of institutional quality: A panel threshold analysis. Resour. Policy, 61, 293–303, doi:10.1016/j.resourpol.2019.02.011
Anas, A., Arnott, R., and Small, K. A. (1998). Urban spatial structure. J. Econ. literature 36 (3), 1426–1464.
Bagan, H., Borjigin, H., and Yamagata, Y. (2019). Assessing nighttime lights for mapping the urban areas of 50 cities across the globe. Environ. Plan. B Urban Anal. City Sci. 46 (6), 1097–1114. doi:10.1177/2399808317752926
Bradbury, J. H., and St- Martin, I. (1983). Winding down in a Quebec mining town: A case study of schefferville. Can. Geogr. 27 (2), 128–144. doi:10.1111/j.1541-0064.1983.tb01468.x
Bruce, D., Ryser, L., Halseth, G., and Giesbrecht, K. (2004). Economic development framework of small communities in Canada: Phase two: Economic clustering approaches for small communities. Ottawa, Canada: Canada Mortgage and Housing Corporation.
Cao, Z., Wu, Z., Kuang, Y., and Huang, N. (2015). Correction and application of DMSP/OLS night light image in China. J. Geo-Information Sci. 17 (9), 1092–1102. doi:10.3724/SP.J.1047.2015.01092
Champion, A. G. (2001). A changing demographic regime and evolving poly centric urban regions: Consequences for the size, Composition and Distribution of City Populations. Urban Stud. 38 (4), 657–677. doi:10.1080/00420980120035277
Chaix, B., Kestens, Y., Perchoux, C., Karusisi, N., Merlo, J., and Labadi, K. (2012). An interactive mapping tool to assess individual mobility patterns in neighborhood studies. Am. J. Prev. Med. 43 (4), 440–450.
Chen, T., Hui, E. C., Wu, J., Lang, W., and Li, X. (2019). Identifying urban spatial structure and urban vibrancy in highly dense cities using georeferenced social media data. Habitat Int. 89, 102005. doi:10.1016/j.habitatint.2019.102005
Chen, W., Shen, Y., and Wang, Y. (2018). Evaluation of economic transformation and upgrading of resource-based cities in Shaanxi province based on an improved TOPSIS method. Sustain. Cities Soc. 37, 232–240. doi:10.1016/j.scs.2017.11.019
Clarke, G. R., Xu, L. C., and Zou, H. F. (2006). Finance and income inequality: What do the data tell us? South. Econ. J. 72 (3), 578–596. doi:10.2307/20111834
Clemenson, H. (1992). “Are single industry towns diversifying? An examination of fishing, forestry and mining towns,” in Rural and small town Canada. Editor R. Bollman (Toronto, Canada: Thompson Educational Publishing Inc.), 151–166.
Croft, T. A. (1978). Night time images of the earth from space. Sci. Am. 239, 86–98. doi:10.1038/scientificamerican0778-86
Cui, Y., Shi, K., Jiang, L., Qiu, L., and Wu, S. (2020). Identifying and evaluating the nighttime economy in China using multisource data. IEEE Geosci. Remote Sens. Lett. 18 (11), 1906–1910. doi:10.1109/lgrs.2020.3010936
Czamanski, D., and Broitman, D. (2018). The life cycle of cities. Habitat Int. 72, 100–108. doi:10.1016/j.habitatint.2016.09.002
Dale, B. (2002). An institutionalist approach to local restructuring: The case of four Norwegian mining towns. Eur. Urban Regional Stud. 9 (1), 5–20. doi:10.1177/096977640200900101
Deacon, L., Van Assche, K., Papineau, J., and Gruezmacher, M. (2018). Speculation, planning, and resilience: Case studies from resource-based communities in Western Canada. Futures 104, 37–46.
Dembski, S., Sykes, O., Couch, C., Desjardins, X., Evers, D., Osterhage, F., et al. (2021). Reurbanisation and suburbia in northwest europe: A comparative perspective on spatial trends and policy approaches. Prog. Plan. 150, 100462. doi:10.1016/j.progress.2019.100462
Dong, L., Longwu, L., Zhenbo, W., Liangkan, C., and Faming, Z. (2021). Exploration of coupling effects in the economy–society–environment system in urban areas: Case study of the yangtze river delta urban agglomeration. Ecol. Indic. 128, 107858. doi:10.1016/j.ecolind.2021.107858
Du, J., and Vanino, E. (2021). Agglomeration externalities of fast-growth firms. Reg. Stud. 55 (2), 167–181. doi:10.1080/00343404.2020.1760234
Elvidge, C. D., Daniel, Z., Baugh, K. E., Tuttle, B. T., Mikhail, Z., Pack, D., et al. (2009). A fifteen year record of global natural gas flaring derived from satellite data. Energies 2 (3), 595–622. doi:10.3390/en20300595
Farahani, H., and Shadi, B. (2017). Modeling the assessment of socio-economical and environmental impacts of sand mining on local communities: A case study of villages tatao river bank in north-western part of Iran. Resour. Policy 55, 87–95. doi:10.1016/j.resourpol.2017.11.001
Fujita, M., Krugman, P. R., and Venables, A. (1999). The spatial economy: Cities, regions, and international trade. Cambridge: MIT Press.
Garcia–Lopez, M. À., Nicolini, R., and Roig, J. L. (2020). Segregation and urban spatial structure in Barcelona. Pap. Reg. Sci. 99 (3), 749–772. doi:10.1111/pirs.12484
Graulau, J. (2008). ‘Is mining good for development?’ the intellectual history of an unsettled question. Prog. Dev. Stud. 8 (2), 129–162. doi:10.1177/146499340700800201
Guo, A., Yang, J., Sun, W., Xiao, X., Cecilia, J. X., Jin, C., et al. (2020). Impact of urban morphology and landscape characteristics on spatiotemporal heterogeneity of land surface temperature. Sustain. Cities Soc. 63, 102443. doi:10.1016/j.scs.2020.102443
Hajrasouliha, A. H., and Hamidi, S. (2017). The typology of the American metropolis: Monocentricity, polycentricity, or generalized dispersion? Urban Geogr. 38 (3), 420–444. doi:10.1080/02723638.2016.1165386
Halseth, G., and Sullivan, L. (2002). Building community in an instant town: A social geography of mackenzie and tumbler ridge, B.C. Prince George, BC: University of Northern British Columbia Press.
Hansen, B. E. (1999). Threshold effects in non-dynamic panels: Estimation, testing and inference. J. Econ. 93 (2), 345–368. doi:10.1016/s0304-4076(99)00025-1
He, B. J., Ding, L., and Prasad, D. (2019). Enhancing urban ventilation performance through the development of precinct ventilation zones: A case study based on the greater sydney, Australia. Sustain. Cities Soc. 47, 101472. doi:10.1016/j.scs.2019.101472
He, X., Cao, Y., and Zhou, C. (2021). Evaluation of polycentric spatial structure in the urban agglomeration of the pearl river delta (PRD) based on multi-source big data fusion. Remote Sens. 13 (18), 3639. doi:10.3390/rs13183639
Henderson, J. V., Storeygard, A., and Weil, D. N. (2012). Measuring economic growth from outer space. Am. Econ. Rev. 102 (2), 994–1028. doi:10.1257/aer.102.2.994
Henderson, M., Yeh, E. T., Gong, P., Elvidge, C., and Baugh, K. (2003). Validation of urban boundaries derived from global night-time satellite imagery. Int. J. Remote Sens. 24 (3), 595–609. doi:10.1080/01431160304982
Hu, L., Sun, T., and Wang, L. (2018). Evolving urban spatial structure and commuting patterns: A case study of Beijing, China. Transp. Res. Part D Transp. Environ. 59, 11–22.
Huang, Q., Yang, X., Gao, B., Yang, Y., and Zhao, Y. (2014). Application of DMSP/OLS nighttime light images: A meta-analysis and a systematic literature review. Remote Sens. 6 (8), 6844–6866.
Jia, J., Huang, Q., and Xu, M. (2004). Research on China’s resource (Mining) exhausted city economic transformation technology strategy. Beijing, China: China Agricultural Science and Technology Press.
Kim, K. (2019). Identifying the structure of cities by clustering using a new similarity measure based on smart card data. IEEE Trans. Intell. Transp. Syst. 21 (5), 2002–2011. doi:10.1109/tits.2019.2910548
Kim, S. (2007). Changes in the nature of urban spatial structure in the United States, 1890–2000. J. Regional Sci. 47 (2), 273–287. doi:10.1111/j.1467-9787.2007.00509.x
Kotsadam, A., and Tolonen, A. (2015). African mining, gender, and local employment. World Dev. 83 (83), 325–339. doi:10.1016/j.worlddev.2016.01.007
Krugman, P. (1991). Increasing returns and economic geography. J. Political Econ. 99 (3), 483–499. doi:10.1086/261763
Levin, N., and Zhang, Q. (2017). A global analysis of factors controlling VIIRS nighttime light levels from densely populated areas. Remote Sens. Environ. 190, 366–382. doi:10.1016/j.rse.2017.01.006
Li, G., and Zhang, Y. (2001). Industrialization and urban morphology and structural evolution of Fushun coalfield area. Sci. Geogr. Sin. 6 (6), 511–518.
Li, H., Long, R., and Chen, H. (2013). Economic transition policies in Chinese resource-based cities: An overview of government efforts. Energy Policy 55, 251–260. doi:10.1016/j.enpol.2012.12.007
Li, X., Li, D., Xu, H., and Wu, C. (2017). Intercalibration between DMSP/OLS and VIIRS nighttime light images to evaluate city light dynamics of Syria’s major human settlement during Syrian Civil War. Int. J. Remote Sens. 38 (21), 5934–5951. doi:10.1080/01431161.2017.1331476
Li, Y. (2020). Towards concentration and decentralization: The evolution of urban spatial structure of Chinese cities, 2001–2016. Comput. Environ. Urban Syst. 80, 101425. doi:10.1016/j.compenvurbsys.2019.101425
Lu, Z., Hu, G., and Luo, H. (2007). Comparison of resource-based urban recession and economic transformation in China and foreign countries. Macroeconomics 11, 32–37. doi:10.16304/j.cnki.11-3952/f.2007.11.010
Luo, X., Yang, J., Sun, W., and He, B. (2021). Suitability of human settlements in mountainous areas from the perspective of ventilation: A case study of the main urban area of chongqing. J. Clean. Prod. 310, 127467. doi:10.1016/j.jclepro.2021.127467
Marais, L., Denoon-Stevens, S., and Cloete, J. (2020). Mining towns and urban sprawl in South Africa. Land Use Policy 93, 103953. doi:10.1016/j.landusepol.2019.04.014
Martinez-Fernandez, C., Wu, C. T., Schatz, L. K., Taira, N., and Vargas-Hernández, J. G. (2012). The shrinking mining city: Urban dynamics and contested territory. Int. J. Urban Regional Res. 36 (2), 245–260. doi:10.1111/j.1468-2427.2011.01094.x
Matlaba, V. J., Holmes, M., McCann, P., and Poot, J. (2012). Agglomeration externalities and 1981-2006 regional growth in Brazil. Chiikigaku. Kenkyu. 42 (1), 145–161. doi:10.2457/srs.42.145
Meijers, E. J., and Burger, M. J. (2010). Spatial structure and productivity in US metropolitan areas. Environ. Plan. A 42 (6), 1383–1402. doi:10.1068/a42151
Mellander, C., Lobo, J., Stolarick, K., and Matheson, Z. (2015). Night-time light data: A good proxy measure for economic activity? Plos One 10 (10), e0139779–18. doi:10.1371/journal.pone.0139779
Milesi, C., Elvidge, C. D., Nemani, R. R., and Running, S. W. (2003). Assessing the impact of urban land development on net primary productivity in the southeastern United States. Remote Sens. Environ. 86 (3), 401–410. doi:10.1016/S0034-4257(03)00081-6
Morrison Paul, C. J., and Siegel, D. S. (1999). Scale economies and industry agglomeration externalities: A dynamic cost function approach. Am. Econ. Rev. 89 (1), 272–290. doi:10.1257/aer.89.1.272
Paulsen, K. (2012). Yet even more evidence on the spatial size of cities: Urban spatial expansion in the US, 1980-2000. Regional Sci. Urban Econ. 42 (4), 561–568. doi:10.1016/j.regsciurbeco.2012.02.002
Prideaux, B., and Timothy, D. J. (2011). “From mining boom towns to tourist haunts: The ghost town life cycle,” in Mining heritage tourism. Editors M. V. Conlin, and L. Jolliffe (London, UK: Routledge), 327–338.
Sołtysik, M., and Mazur-Belzyt, K. (2020)., 960. Bristol, United Kingdom: IOP Publishing, 042016.City space recycling: The example of Brownfield redevelopment. in IOP Conference Series: Materials Science and Engineering.
Udelsmann Rodrigues, C., Mususa, P., Büscher, K., and Cuvelier, J. (2021). Boomtown urbanization and rural-urban transformation in mining and conflict regions in Angola, the DRC and Zambia. Sustainability 13 (4), 2285. doi:10.3390/su13042285
Veneri, P. (2018). Urban spatial structure in OECD cities: Is urban population decentralising or clustering? Pap. Regional Sci. 97 (4), 1355–1374. doi:10.1111/pirs.12300
Vinayagathasan, T. (2013). Inflation and economic growth: A dynamic panel threshold analysis for asian economies. J. Asian Econ. 26, 31–41. doi:10.1016/j.asieco.2013.04.001
Waddington, D., Critcher, C., and Dicks, B. (2001). Out of the ashes? The social impact of industrial contraction and regeneration on britain's mining communities. London: The Stationery Office.
Williamson, J. G. (1965). Regional inequality and the process of national development: A description of the patterns. Econ. Dev. Cult. Change 13 (4), 1–84. doi:10.1086/450136
Wilson, L. (2004). Riding the resource roller coaster: Understanding socioeconomic differences between mining communities. Rural. Sociol. 69 (2), 261–281. doi:10.1526/003601104323087606
Wu, C., Zhao, M., and Ye, Y. (2022). Measuring urban nighttime vitality and its relationship with urban spatial structure: A data-driven approach. Environ. Plan. B Urban Anal. City Sci. 23998083221108191, 239980832211081. doi:10.1177/23998083221108191
Yakovleva, N., and Alabaster, T. (2003). Tri-sector partnership for community development in mining: A case study of the SAPI foundation and target fund in the republic of sakha (yakutia). Resour. Policy 29 (3-4), 83–98. doi:10.1016/j.resourpol.2004.06.003
Yang, J., Wang, Y., Xiu, C., Xiao, X., Xia, J., and Jin, C. (2020). Optimizing local climate zones to mitigate urban heat island effect in human settlements. J. Clean. Prod. 275, 123767. doi:10.1016/j.jclepro.2020.123767
Yang, J., Wang, Y., Xue, B., Li, Y., Xiao, X., Xia, J. C., et al. (2021a). Contribution of urban ventilation to the thermal environment and urban energy demand: Different climate background perspectives. Sci. Total Environ. 795, 148791. doi:10.1016/j.scitotenv.2021.148791
Yang, J., Xin, J., Zhang, Y., Xiao, X., and Xia, J. C. (2022). Contributions of sea–land breeze and local climate zones to daytime and nighttime heat island intensity. npj Urban Sustain. 2 (1), 12–11. doi:10.1038/s42949-022-00055-z
Yang, J., Yang, Y., Sun, D., Jin, C., and Xiao, X. (2021b). Influence of urban morphological characteristics on thermal environment. Sustain. Cities Soc. 72, 103045. doi:10.1016/j.scs.2021.103045
Yu, J., Li, J., and Zhang, W. (2018). Identification and comprehensive type classification of resource-based cities in China. Acta Geogr. Sin., 73(4), 677–687, (in Chinese). doi:10.11821/dlxb201804007
Zhang, X., Wu, J., Peng, J., and Cao, Q. (2017). The uncertainty of nighttime light data in estimating carbon dioxide emissions in China: A comparison between DMSP-OLS and NPP-VIIRS. Remote Sens. 9 (8), 797. doi:10.3390/rs9080797
Zhao, M., Zhou, Y., Li, X., Cao, W., He, C., Yu, B., et al. (2019). Applications of satellite remote sensing of nighttime light observations: Advances, challenges, and perspectives. Remote Sens. 11 (17), 1971. doi:10.3390/rs11171971
Zhao, N., Zhou, Y., and Samson, E. L. (2014). Correcting incompatible DN values and geometric errors in nighttime lights time-series images. IEEE Trans. Geosci. Remote Sens. 53 (4), 2039–2049. doi:10.1109/tgrs.2014.2352598
Keywords: light image data, spatial structure, urban transformation, resource-based cities, China
Citation: Lu S, Zhang W, Li J and Wang S (2022) Resource-based cities: Spatial structure and evolutionary identification based on nighttime light images. Front. Earth Sci. 10:929927. doi: 10.3389/feart.2022.929927
Received: 27 April 2022; Accepted: 08 August 2022;
Published: 06 September 2022.
Edited by:
Bing Xue, Institute of Applied Ecology (CAS), ChinaReviewed by:
Chengpeng Lu, Lanzhou University, ChinaCopyright © 2022 Lu, Zhang, Li and Wang. This is an open-access article distributed under the terms of the Creative Commons Attribution License (CC BY). The use, distribution or reproduction in other forums is permitted, provided the original author(s) and the copyright owner(s) are credited and that the original publication in this journal is cited, in accordance with accepted academic practice. No use, distribution or reproduction is permitted which does not comply with these terms.
*Correspondence: Jiaming Li, bGlqbUBpZ3NucnIuYWMuY24=
Disclaimer: All claims expressed in this article are solely those of the authors and do not necessarily represent those of their affiliated organizations, or those of the publisher, the editors and the reviewers. Any product that may be evaluated in this article or claim that may be made by its manufacturer is not guaranteed or endorsed by the publisher.
Research integrity at Frontiers
Learn more about the work of our research integrity team to safeguard the quality of each article we publish.