 Milica Stojanovic
 Getachew Mehabie Mulualem
 Rogert Sorí
 Marta Vázquez1
 Raquel Nieto
 Luis Gimeno
- 1Centro de Investigación Mariña, Environmental Physics Laboratory (EPhysLab), Universidade de Vigo, Ourense, Spain
- 2Department Meteorology and Geophysics, Faculty of Physics, Sofia University “St. Kliment Ohridski”, Sofia, Bulgaria
- 3College of Science, Bahir Dar University, Bahir Dar, Ethiopia
In this study, we identified and investigated the annual climatological moisture sources for the Ethiopian river basins during 1980–2018. First, according to cluster analysis, the 12 river basins of this country were grouped into four regions: northeast (NE), southeast (SE), southwest (SW), and west (W), which were characterised by similar annual precipitation features. Global outputs from the Lagrangian FLEXPART model were used to investigate the air mass humidity gain before reaching each region. This revealed five main oceanic moisture sources located in the Mediterranean Sea, Red Sea, Indian Ocean, Persian Gulf, and the Arabian Sea, in addition to three main terrestrial moisture sources located in the African continent, Arabian Peninsula, and the regions themselves. Once the main climatological sources of moisture for each region were identified, a forward-in-time analysis of air masses over each source was performed to calculate the moisture contribution to precipitation (E – P) < 0 over the defined regions. The most important source at the annual scale for the NE, SW, and W regions is the African continent, while for the SE, it is the Indian Ocean. Indeed, terrestrial moisture sources are the major contributors (>50%) to the precipitation over the NE, SW, and W, whereas oceanic sources are the major contributors to the SE. Another analysis identified the years affected by drought conditions in the regions. The role of the sources was evaluated for those years affected by severe and extreme drought, revealing the heterogeneous and also direct influences on the regions. Finally, according to the normalised difference vegetation index, the impacts of annual severe and extreme droughts were more prominent in areas of the NE and SE, but also in the SW during 1984.
1 Introduction
Drought is one of the most devastating natural phenomena related to a significant decrease in water availability owing to precipitation reduction over an extended period (Bayissa et al., 2015; Van Loon, et al., 2016; Stojanovic et al., 2020; Yirga, 2021). It is a relatively complex event, mainly because of the difficulty in defining its beginning, severity, and end (Wilhite, 1993; Belayneh et al., 2014). In addition, its effects can slowly accumulate over a substantial period, affecting a wide range of geographic areas and different sectors, such as agriculture, water management, and the environment (WMO, 2012; Trenberth et al., 2014; Ebi and Bowen, 2016; Van Loon, et al., 2016; Ionita et al., 2017). Therefore, droughts can generally be classified as meteorological, agricultural, hydrological, and socioeconomic, according to their associated impacts (Wilhite and Glantz, 1985; Keyantash and Dracup, 2002; Dai, 2010). Meteorological drought implies below-average amounts of precipitation and represents the initial stage of all drought types. A lack of soil moisture is referred to as agricultural drought, as it reduces the quantity of water available for crops and affects the agricultural demands of a region. Hydrological drought occurs when sustained dry conditions cause a deficit in soil moisture content, low-level river flows, and a reduction in surface water and groundwater reserves. Finally, socioeconomic drought occurs when a deficit in water supply exceeds the demand for economic goods and social activities.
In Africa, drought is one of the most dangerous natural risks, which, in combination with high water consumption and low water quality, worsens existing water scarcity concerns (Mishra and Singh, 2010; El Kenawy et al., 2016). Among African countries, Ethiopia is frequently portrayed as a drought-stricken region because of anthropogenic activities and climate change (e.g., increased temperature, decreased precipitation, and reduced crop yield) (Belayneh et al., 2014; Bayissa et al., 2015; El Kenawy et al., 2016; Gezie, 2019; Temam et al., 2019; Alemu et al., 2021; Yirga, 2021). A trend analysis performed by Cheung et al. (2008) for annual and seasonal precipitation between 1960 and 2002 showed a remarkable decline in precipitation from June to September for most river basins situated in the southwest and central parts of Ethiopia (Baro-Akobo, Omo-Ghibe, Rift Valley, and Upper Blue Nile). Negash et al. (2013) also reported a significant decreasing trend in the northern, northwestern, and western parts of Ethiopia for the period 1951–2000. Mekonen and Berlie (2020) reported a decreasing trend in precipitation at a level of 6.5 mm/decade in the northeastern areas of Ethiopia from 1900 to 2016. In contrast, Gebrechorkos et al. (2019) recently showed that the climate of Ethiopia has changed over the last 4 decades, with temperatures increasing trends. In line with these findings, some researchers have illustrated that the frequency of drought in Ethiopia has increased over the past few decades (Edossa et al., 2010; Gebrehiwot et al., 2011; Asfaw et al., 2018).
Ethiopia is a highly populated country with 85% of the economy primarily depending on agriculture. Drought represents a major threat that mostly affects the agricultural and water sectors, particularly in regions where access to water supplies is limited (Funk et al., 2005; Mersha and van Laerhoven, 2018; Matewos, 2019; Hirko et al., 2021). The 1984/1985 drought that affected Ethiopia, caused crop failure and, consequently, the displacement of millions of people. Also, the drought that occurred in 2002/2003 led to the biggest food crisis that affected more than 13 million people and caused severe impacts on the economy (Gebrehiwot et al., 2011; Bayissa et al., 2015). According to Funk et al. (2005), the 1984 events stand as the worst years on the record, while 2002 received very low precipitation for the longest period of the year. The year 2009 has also been documented as a severely dry year, with more than six million people being affected (Sheffield et al., 2012; Viste et al., 2013; Mekonen and Berlie 2020). More recently, a severe drought in 2015 affected the northeast of Ethiopia, resulting in more than 10 million people being affected and seeking humanitarian aid (Mekonen and Berlie 2020). These dry years have been the worst in the history of Ethiopia, with millions of people becoming displaced, and many being forced into further destitution (Bayissa et al., 2015).
The large spatial variability of precipitation over Ethiopia can cause spatial variations in drought severity (World Bank, 2006; Viste et al., 2013). Jjemba et al. (2017) and Philip et al. (2017) showed that a severely dry year in 2015 in the northern part of Ethiopia occurred due to the failure of the March–May (Belg) precipitation season, and the June–September (Kiremt) precipitation season was considerably delayed and below the long-term average. Rainfall in Ethiopia is the result of multi-weather systems that include the Subtropical Jet, Intertropical Convergence Zone (ITCZ), Red Sea Convergence Zone, Tropical Easterly Jet, Southwest Indian and South Atlantic Ocean anticyclones, and Somali Jet (NMA, 1996; Riddle and Cook, 2008; Aerts et al., 2016; Philip et al., 2017; Dubache et al., 2019; Alhamshry et al., 2020; Munday et al., 2021). The intensity, position, and direction of these weather systems lead to variability in the amount and distribution of rainfall in Ethiopia (Berhanu et al., 2014). Precipitation shortfall and its spatial variations are associated with changes in atmospheric moisture transport (Bisselink and Dolman, 2008; Gimeno et al., 2010; Viste and Sorteberg, 2011; Stojanovic et al., 2018; Drumond et al., 2019). Hence, the identification of moisture sources for precipitation is crucial for understanding rainfall variability, timing, and development of dry conditions in Ethiopia Indeed, it is nowadays considered a challenge for the atmospheric sciences (Gimeno et al., 2020). The moisture sources for precipitation over a certain region can be identified through different methods, such as analytical and box models, physical water vapour tracers (isotopes), and numerical water vapour tracers. A complete explanation and comparison of the methodologies used to study moisture transport have been reported by Gimeno et al. (2020).
The main objectives of this study were: 1) to identify the main climatological moisture sources for the four regions of grouped river basins of Ethiopia during the period 1980–2018 through a Lagrangian methodology; 2) to identify the occurrence of drought conditions in the target regions; and 3) to analyse the relationship between severely and/or extremely dry years and the anomalies of the moisture contribution to precipitation computed from their climatological oceanic and terrestrial sources of moisture.
1.1 Study Area
Ethiopia is a landlocked country located within the tropics (33°–48°E longitude and 3°–15°N latitude) of northeast Africa (Figure 1). It is bordered by Eritrea and Djibouti to the north and northeast, Somalia to the east, South Sudan and Sudan to the west and northwest, and Kenya to the south (Viste et al., 2013). With an area of approximately 1.11 million km2, it is the second most populous country in Africa (Awulachew et al., 2005; Worqlul et al., 2017; Liou and Mulualem, 2019). Ethiopia is a country of geographical diversity with topography varying from approximately 4,500 m above sea level in the north and central parts to approximately 100 m below sea level over the lowlands in the northeastern parts of the country (Figure 1) (Zeleke et al., 2013; Worqlul et al., 2017; Liou and Mulualem, 2019; Asefa et al., 2020). Approximately 35% of the central and northern parts of the country constitute the highlands, with elevations of 1,500 m or above (Seleshi and Zanke, 2004; Worqlul et al., 2017; Liou and Mulualem, 2019).
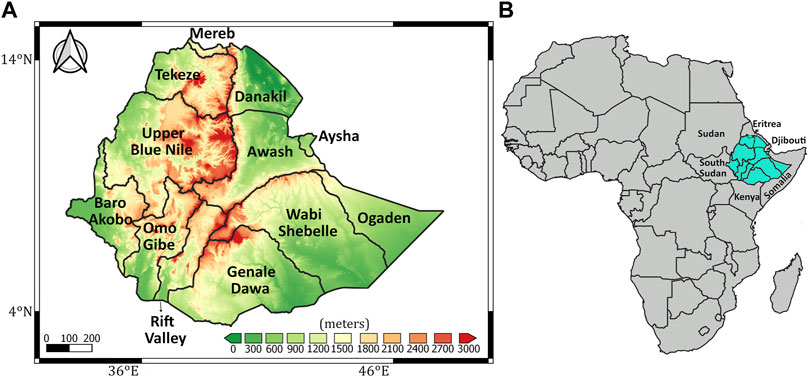
FIGURE 1. Geographical location of the 12 river basins of Ethiopia (A,B), and their elevation (in metres) (A). Elevation data were downloaded from hydrological data and maps based on the SHuttle Elevation Derivatives at multiple Scales (HydroSHEDS) project (available online at https://hydrosheds.org/).
Ethiopia’s proximity to the equator and the complexity of its topography play an essential role in regulating the annual cycle of precipitation and temperature (Asefa et al., 2020). Precipitation normally increases from north to south and from east to west, with a mean annual precipitation of 600 mm per year in the northeastern parts and 2,000 mm per year in the southwest parts of the country (Aerts et al., 2016; Asefa et al., 2020). The amount of precipitation over the mountainous regions is higher than that in the lowlands. The highland regions receive more than 1,200 mm per year, with a small temperature variation, while the lowland regions gain less than 500 mm per year with greater temperature variations (Aerts et al., 2016; Worqlul et al., 2017; Liou and Mulualem, 2019). Because of these complex topographical and geographical features, the climate of Ethiopia reveals strong spatial variations, and different parts of the country do not receive equal amounts of precipitation (Seleshi and Camberlin, 2005; Zeleke et al., 2013). The northeastern, eastern, and southeastern parts of Ethiopia receive less precipitation than the west of the country, and because of this, the three river basins located in these parts (Ogaden, Aysha, and Dinakle) are mostly dry. Likewise, most of the high-flow river basins, which occupy 80%–90% flow, are found in the west and southwestern parts of Ethiopia (Ayalew, 2018). Generally, Ethiopia has three climatic seasons: the main rainy season from June to September (Kiremt), a short rainy season from March to May (Belg), and a dry season from October to January (Bega) (Seleshi and Zanke, 2004; Diro et al., 2011; Fekadu, 2015; Dika, 2018; Alemayehu et al., 2020; Bayable et al., 2021). Kiremt is the major rainy season for most parts of the country (southwestern, northern, eastern, western, northwestern, and central parts), which represents up to 90% of the total precipitation in a year. By contrast, in the south and southeastern parts of Ethiopia, the Belg season is the main rainy season (Seleshi and Zanke, 2004; Misganaw, 2014; Fekadu, 2015).
Considering population density, there are two region types where water availability is limited: semi-arid regions in the east and north, and wet, densely populated regions in the southern highlands and the Rift Valley (Funk et al., 2012; Berhanu et al., 2014). Ethiopia is considered the water tower of the Horn of Africa owing to its substantial number of water resources (Awulachew et al., 2007; Berhanu et al., 2014). The country has 12 major river catchments, eight of which are river basins (Upper Blue Nile [Abbay], Tekeze, Awash, Danakil, Genale Dawa, Wabi Shebelle, Omo-Gibe, and Baro-Akobo), one is a lake basin (Rift Valley), and the remaining three are considered dry river basins (Merebe, Aysha, and Ogaden) owing to insignificant flow from the drainage system (Berhanu et al., 2014). These river basins provide an estimated annual runoff of approximately 125 billion m3, with the Upper Blue Nile (Abbay) accounting for approximately 45% of that volume (Asmamaw, 2015).
2 Datasets and Methods
2.1 Datasets
Global outputs of atmospheric moisture changes for nearly 2 million parcels from the Lagrangian FLEXible PARTicle (FLEXPART) dispersion model (Stohl and James, 2004, 2005), with a resolution of 0.25° × 0.25° in latitude and longitude for a period of 39 years (1980–2018), were used in this study. Since the available model output data is for this period, analyses throughout the study were limited to this period. FLEXPART was forced using the ERA-Interim global reanalysis dataset from the European Centre for Medium-Range Weather Forecasts (Dee et al., 2011) with a spatial resolution of 1° × 1° on 61 vertical levels from the surface to 0.1 hPa.
The monthly integrated water vapour transport (IVT) is calculated as the composite of northward and eastward water vapour horizontal fluxes, both obtained from ERA-Interim reanalysis (Dee et al., 2011) at a horizontal resolution of 0.25°. From this source was also downloaded the vertically integrated moisture flux divergence (VIMF). These datasets are available at no cost from https://apps.ecmwf.int. The IVT represents the horizontal moisture transport in the atmosphere, while the VIMF is the horizontal divergence of moisture spreading outward from a point, per square metre, indicating whether atmospheric motions act to decrease due to divergence or increase because of the convergence of the vertical integral of moisture.
Monthly precipitation (PRE) and atmospheric evaporative demand (AED) values with a spatial resolution of 0.5° were obtained from the Climatic Research Unit (CRU) Time-Series version 4.05 (Harris et al., 2020). This dataset was used for this study since it was built from observational data, which ensures a reliable representation of climatic conditions in the study regions. In addition, this dataset has been previously assessed and used for hydrometeorological studies for Ethiopia, showing a good performance (e.g., Mulugeta et al., 2019; Reda et al., 2021; Degefu et al., 2022). Also, the modified version of the Penman-Monteith reference evapotranspiration equation was used in this dataset as a metric for AED, which has been recommended by the Food and Agriculture Organization (FAO), and is the most physical and reliable method among several methods that can be used to model AED (Allen et al., 1998).
The normalised difference vegetation index (NDVI) at a resolution of 0.05° derived from the NOAA Climate Data Record of the Advanced Very High-Resolution Radiometer was used for this study. This long-term record of remotely sensed vegetation observations permits a description of the health of vegetation in diverse regions around the world. Among various vegetation indices, NDVI is more sensitive to various vegetation covers (Leprieur et al., 2000; Roberts et al., 2011), especially in arid regions such as Ethiopia. Therefore, it is commonly used to identify and investigate the effects of drought on vegetation cover (Hassan et al., 2018).
2.2 Ward’s Method
For hydroclimatological studies, categorising different river basins into homogeneous precipitation aggregates warrants further analysis because it can deliver very similar results. Therefore, we used Ward’s hierarchical clustering method (Wilks, 2011; Bednorz et al., 2019) to determine the similarity in precipitation regimes between Ethiopia’s 12 major drainage systems. Ward’s method has been commonly used among several hierarchical clustering methods, and it has been widely applied by different researchers to define consistent precipitation zones (Munoz-Díaz and Rodrigo 2004; Ferreira and Hitchcock 2009; Murtagh and Legendre, 2014; Zhang et al., 2016; Sharghi et al., 2018; Stojanovic et al., 2021a; Beyene et al., 2021). Ward’s method was employed with Euclidean distance used as similarity measurement. The hierarchical clustering technique classifies data into a hierarchical structure based on the Euclidean distance between two groups (Murtagh and Legendre 2014; Tian et al., 2014). The Euclidean distance (D) is the length of the line segment between i number of two points (x, y) in the euclidean space, as indicated in Eq. 1.
It differs from other methods because it is designed to generate which pairs of groups (e.g., A and B) will merge at each step by minimising the sum of squared distances between the points and the centroids of their groups (Unal et al., 2003; Zhang et al., 2016; Beyene et al., 2021), according to Eq. 2.
where Δ represents the merging cost of combining the clusters A and B;
An advantage of using cluster analysis is that can be generally easily implemented and further interpret the results. In the process, it is also not necessary to specify the number of clusters for the algorithm and a final dendrogram allows to select the optimum number of clusters for analysis. One advantage of Ward’s method compared with other hierarchical clustering methods is that it usually does not leave single-member clusters after a reasonable number of stages, and it tends to produce clusters with approximately the same number of entities (Dezfuli, 2011; Bu et al., 2020). However, one limitation of Ward’s method is that is computationally intensive and struggles to handle large datasets with more than a thousand observations because of that it is not recommended to be used with large datasets since it will take a lot of time to calculate (Tsiptsis and Chorianopoulos, 2009). In addition, the analysis and decisions on dendrograms may result difficult, leading to possible bad decisions, for which is necessary to analyse if the result makes sense or not.
2.3 Standardised Precipitation Evapotranspiration Index
Many drought indices have been developed and used by researchers worldwide to detect, analyse, and understand the characteristics of droughts on global, regional, and local scales (Saravi et al., 2009; Dai 2010; Hadish, 2010; Gebrehiwot et al., 2011; Herring et al., 2014; El Kenawy et al., 2016; Mohammed et al., 2018; Drumond et al., 2019). In general, precipitation is used to compute the indices. The standardised precipitation index (SPI) (McKee et al., 1993), for instance, is one of the most frequently used drought indices worldwide, as recommended by the World Meteorological Organization (Svoboda et al., 2012; WMO, 2012). However, several studies (Labedzki, 2007; Livada and Assimakopoulos, 2007; Naresh Kumar et al., 2009; Vicente-Serrano et al., 2010; Zarch et al., 2015) have indicated that SPI relying only on precipitation as input data for assessing drought is a major loophole. Although precipitation is the primary cause in controlling the occurrences of drought, the impact of other variables such as temperature in the context of global warming cannot be overlooked (Vicente-Serrano et al., 2012). For this reason, the SPEI (Vicente-Serrano et al., 2010) was utilised, which includes the role of temperature through AED in the assessment of drought. Besides, the SPEI has been widely used, demonstrating its usefulness for the most realistic representation of dry conditions that affect a given region (Hernandez and Uddameri, 2014; Wang et al., 2015; Ghebrezgabher et al., 2016; Delbiso et al., 2017; Stojanovic et al., 2018; Drumond et al., 2019; Tefera et al., 2019; Sorí et al., 2020; Stojanovic et al., 2021b).
The calculation of the SPEI is based on the original procedure used to calculate the SPI but includes the influence of the AED to estimate the severity of drought while maintaining the multiscale characteristics of the SPI (Beguería et al., 2014). The SPEI is computed using the monthly climatic water balance (precipitation minus AED) calculated at various timescales (i.e., accumulation periods) (Vicente-Serrano et al., 2010; Lweendo et al., 2017; Abara et al., 2020). These accumulation periods can be related to different drought types, such as 1-month SPEI for meteorological drought, 1–6 months SPEI for agricultural drought, and 6–24 months SPEI for hydrological drought (WMO, 2012). Detailed information for calculating SPEIs can be found in Beguería et al. (2014). In this study we calculated the 12-month SPEI (SPEI12) and was particularly used the SPEI12 of December, which provides the diagnoses of wet or dry conditions for December and the previous 11 months, permitting us to identify those years affected by severely and/or extremely dry conditions in the four aggrupations of major river basins of Ethiopia. The 1-month SPEI (SPEI1) SPEI1 was also used to understand the behaviour of dry conditions during years affected by severe and extreme drought conditions. Finally, the identification of the severely and/or extremely dry conditions during 1980–2018 follows the criteria of McKee et al. (1993) (Table 1).
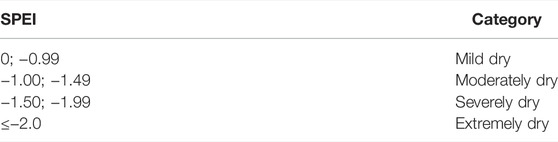
TABLE 1. Drought classification based on standardised precipitation evapotranspiration index (SPEI) values according to the classification proposed by McKee et al. (1993).
2.4 Lagrangian Methodology
The Lagrangian dispersion model, FLEXPART, allows the investigation of atmospheric moisture changes combined with the motion of air masses. Therefore, global outputs from this model were used to initially identify the annual climatological moisture sources of the four river basin groups that cover Ethiopia (Figure 2). This model considers an atmosphere divided into nearly two million particles or parcels of equal mass (m) that can be tracked backward or forward using three-dimensional wind field. For each tracked parcel, the changes of specific humidity (q) every 6 h (dt) are calculated along the trajectory, which can be adopted as the budget of evaporation (e) minus the precipitation (p) in the parcel, according to Eq. 3:
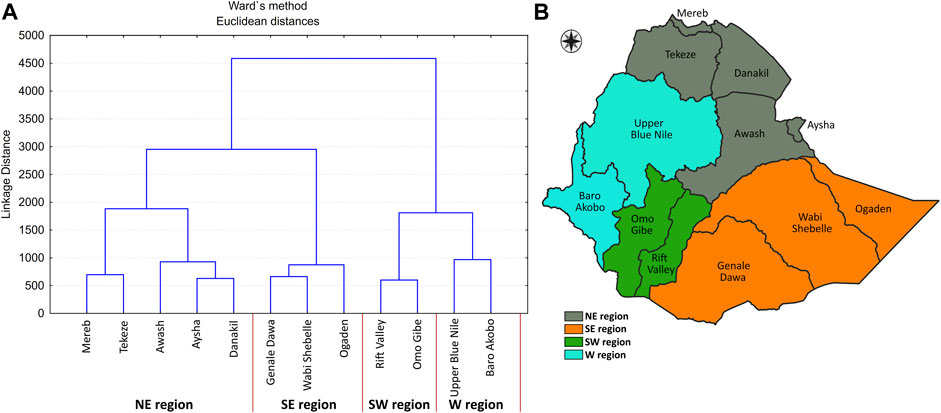
FIGURE 2. (A) Graphical illustration of Ward’s method: tree diagram showing the assigned clusters, and (B) schematic representation of the clusters, named as: northeast (NE), southeast (SE), southwest (SW), and west (W).
By integrating the (e − p) values for all parcels (K) residing in the atmospheric column over the unit area (A), it is possible to estimate the total budget of atmospheric humidity (E − P), where E represents evaporation and P represents precipitation, as indicated in Eq. 4:
The computation of (E − P) in a backward experiment from the target regions allows us to identify regions where air masses gained ((E − P) > 0)) rather than lost atmospheric moisture before arriving at the target region. Areas with positive values were then considered as sources of moisture, whereas those where air masses lost moisture ((E − P) < 0)) are considered moisture sinks. If parcels are tracked forward in time for a delimited region, it is possible to estimate areas where air masses will lose moisture, which can be assumed to contribute to precipitation. For both the backward and forward experiments, the optimum integration times (in days) proposed by Nieto and Gimeno (2019) provide the optimal days, in which the Lagrangian precipitation is a better fit for precipitation in grids with a resolution of 0.25° latitude and longitude. The average integration times for the grouped river basins resulted from the cluster analysis were calculated.
Finally, to determine the most important sources of moisture for each region, the 95th percentile (p95) for (E − P) > 0 was obtained in the backward climatological experiment performed from the final study regions. This approach has been widely used to achieve similar objectives previously. The use of FLEXPART for the identification of sources of moisture has been widespread. This is because, compared to other methods such as Eulerian models and using isotopes, the Lagrangian approach provides a more robust assessment (Gimeno et al., 2020).
3 Results
3.1 Spatial Regionalisation of Precipitation
Due to its geographic position near the equator and topography, the distribution of the mean annual precipitation in Ethiopia is subject to large spatial variations (Seleshi and Camberlin, 2005; Zeleke et al., 2013; Fazzini et al., 2015; Suryabhagavan, 2017). The regionalisation of precipitation by Ward’s method provided four major drainage systems groups (Figure 2A); the graphical representation of the 12 river basins that constitute each region is shown in Figure 2B. We based our decision on the analysis of the cluster analysis through the output of the tree diagram (dendrogram), which makes possible to hierarchically depict the groups of clusters and their combinations, indicating the level of similarity/dissimilarity in the vertical scale and the sample elements in clustering order on the horizontal axis. In the Dendrogram appears at first two well defined groups (dissimilar) that later are divided into other pairs of groups that indeed are also quite far. Thus, we decided to select these main four aggrupations from the Dendrogram obtained through Ward’s algorithm. For this, a subjective criterion based on the interest of our research was also taken into account. The selection of two groups seemed small to us, considering that the association distances between the four groups are appreciable, which allows us to focus the study on more study regions without compromising the distance of dissimilarity. According to Wilks (2011), the best number of clusters could be sometimes not obvious, and establishing the number of groups necessitates a subjective choice that depends on the objectives of the analysis. The results show that Mereb, Tekeze, Danakil Awash, and Aysha represent river basins with similar precipitation regimes and are classified here as the northeast (NE) region. Genale Dawa, Wabi Shebelle, and Ogaden belong to the southeast (SE) region. The southwest (SW) region includes the Omo-Gibe and Rift Valley catchments, and the Upper Blue Nile and Baro Akobo River basins belong to the western (W) region. These results differ from previous classifications: the National Meteorology Agency of Ethiopia categorised homogeneous rainfall regions into three clusters, Diro et al. (2011) into six clusters, and Gissila et al. (2004) into four clusters. Our selection of four regions is in agreement with the geographical characteristics of the country. The configuration of the SE region appears to be determined by river basins delimited by a rift valley that extends from the southwest of the country until the northeast coast, occupying the Hararge and Arsi Bale highlands and the southeastern lowlands. Similarly, the SW occupies the southwest highlands; the W is formed by river basins that occupy the Gojjam and Wollo highlands and the Western lowlands; and finally, the NE covers the northeast rift valley and the northern Simen mountains region.
3.1.2 Precipitation Regimes
The annual climatological cycle of precipitation for 1980–2018 for each of the four regions under study is shown in Figure 3. Visual analysis revealed great differences among the annual cycles, confirming the great spatial variability of the precipitation documented for Ethiopia. However, the annual precipitation cycle over the NE and W regions seemed very similar, with a predominantly unimodal behaviour, with the maximum precipitation occurring in August (145 and 251 mm/month, respectively) and July (133 and 247 mm/month, respectively). Precipitation decreased over the NE and W regions in the rest of the months until reaching minimum values in December (5 and 25 mm/month, respectively) and January (8 and 12 mm/month, respectively). The SE and SW regions were characterised by a bimodal precipitation pattern that was more pronounced over the SE region, while the maximum precipitation in every region occurred in different months. The rainiest months over the SE were April (115 mm/month) and May (102 mm/month), while those over the SW were May (149 mm/month) and August (142 mm/month). Similar to the NE and W regions, the lowest mean monthly precipitation values occurred in the Northern Hemisphere winter months, which is in agreement with previous studies (Seleshi and Zanke, 2004; Abebe, 2010).
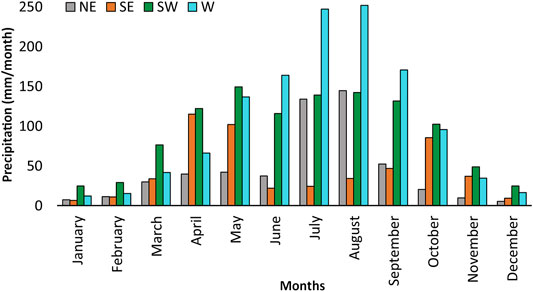
FIGURE 3. Climatological annual cycles of precipitation (mm/month) from the Climatic Research Unit (CRU) (TS4.05) datasets, over the NE (grey), SE (orange), SW (green), and W (cyan) river basin groups. Period of study: 1980–2018.
3.2 Identification of Moisture Sources for Each Region
The annual climatological pattern of (E – P) > 0 obtained in a backward experiment for each of the four regions identified through the cluster analysis of each catchment’s precipitation during 1980–2018 is shown in Figure 4. For this analysis was considered the mean water vapour optimal annual integration times (in days) listed in Table 2.
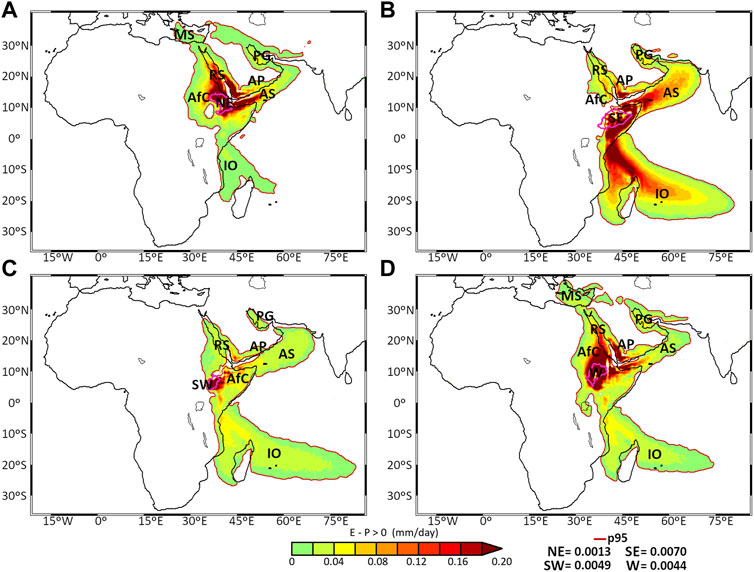
FIGURE 4. Annual patterns of (E – P) > 0 obtained in a backward experiment for the (A) NE, (B) SE, (C) SW, and (D) W river basin groups. The extensions of the sources were delimited using percentile 95 (represented by a pink line). Period: 1980–2018.

TABLE 2. Mean water vapour optimal annual integration time for each of the four river basin groups of Ethiopia; the northeast (NE), southeast (SE), southwest (SW), and west (W). Period 1980–2018.
The areas shaded by reddish colours represent regions where air masses gained humidity rather than losing humidity before reaching each region. The p95 used as a threshold for delimiting the most important moisture sources reveals a very similar pattern of (E − P) > 0 for the four regions, which extend over northeast Africa and west of the Indian Ocean (IO). However, some differences among the (E − P) > 0 patterns can be explained by the geographical location of the regions. For example, the moisture sources for the NE and W regions were more extended and intense over continental areas than over oceanic areas, covering a large part of northeast Africa (AfC), including the whole NE group, and part of the Arabian Peninsula (AP). With respect to oceanic sources, the NE receives moisture from the Mediterranean Sea (MS), Red Sea (RS), western IO, Persian Gulf (PG) and Arabian Sea (AS). For the SE and SW catchment regions, the spatial extension of the (E − P) > 0 patterns covered less extension of northeast Africa but were more extended over the IO. In addition, for both SE and SW, the p95 line does not include the MS source. Finally, the most intense values of moisture uptake were usually observed in and around the study regions, although for the SE region, the intensity of the pattern was also high over the western IO and AS regions. The mechanisms associated with moisture transport from the sources to the precipitation over Ethiopia are crucial to the contribution of each source. During the boreal spring, the Somali Jet begins to form as a low-level cross-equatorial one, bringing moist air from the southern IO to the southern escarpment of the Ethiopian highlands (Riddle and Cook, 2008; Riddle and Wilks, 2013). During the boreal summer, low-level flows from the Congo Basin to the southwest and the RS to the northeast converge over Ethiopian highlands, fuelling the Ethiopian summer rainy season (Jury, 2011; Viste and Sorteberg, 2011; Jury and Chiao, 2014). An analysis of the annual mean value of the IVT and its direction for the study period (Figure 5) reveals the predominant IVT entering Ethiopia predominantly by the southeast, arriving from the IO, where the magnitude of the IVT is very high (>200 kg m−1 s−1). The IVT also enters Ethiopia from the northeast, but to a lesser extent. These results based on an eulerian approach confirm the importance of the IO and the AR as sources of moisture for precipitation over Ethiopia, as revealed by the location and extension of sources in Figure 4.
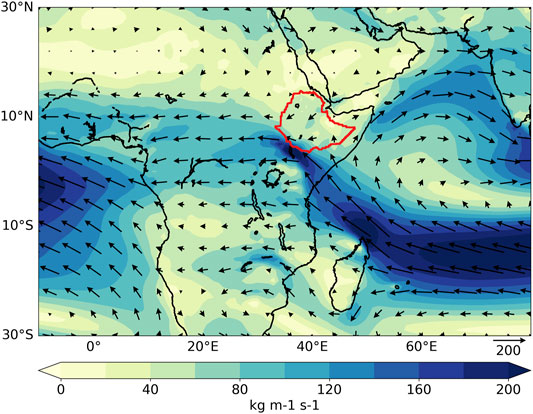
FIGURE 5. Average pattern and direction of the IVT (kg m−1 s−1). Period: 1980–2018. The borders of Ethiopia are delimited in red.
3.2.1 Moisture Contribution for Precipitation From the Sources for Each River Basin Group
Once the sources of moisture were identified for each group of river basins, a forward analysis was performed from each of the sources to calculate the moisture contribution to precipitation ((E − P) < 0)) over each of the respective regions. The results are expressed as percentages and shown in Figure 6. For the basins grouped in the NE and W regions, the sources of moisture that most contribute to precipitation are the AfC (46%, 48%), while the second most important sources are the regions themselves (16% and 19%, respectively) (Figures 6A,D). As Ethiopia is located in the north of Africa and close to the equator, the annual rainfall is dominated by the migration of the ITCZ (Segele et al., 2009; Fazzini et al., 2015; Seregina et al., 2019), which supports the results explained earlier. Figure 4 shows that the NE also receives air masses that gain humidity from oceanic sources, such as the IO, PG, and RS, and their contributions to the total moisture loss are 4%, 1%, and 10%, respectively (Figure 6). Nevertheless, according to Viste and Sorteberg, 2011, the Ethiopian highlands receive a small contribution of moisture transported from the Gulf of Guinea. In addition, Mohamed et al. (2005) described the predominant influence of moisture flux of Atlantic origin over the northern Ethiopian Plateau. However, we did not identify any moisture sources from the Atlantic Ocean causing precipitation over the NE and W basins of Ethiopia. For the SW region, the AfC remains the most important moisture source, supplying 39% of the total moisture contribution to precipitation, followed by the IO (28%). However, because the SE region is closer to the IO, it receives a major contribution from this oceanic source, followed by the AfC (18%), AS (14%), SE itself (12%), and AP (8%). Thus, SE region is the only region that receives more than 50% of the moisture supply, which contributes to rainfall from oceanic sources. This is in agreement with the findings of Viste and Sorteberg, 2011, who reported that most of the moisture entering Ethiopia is via the African continent.
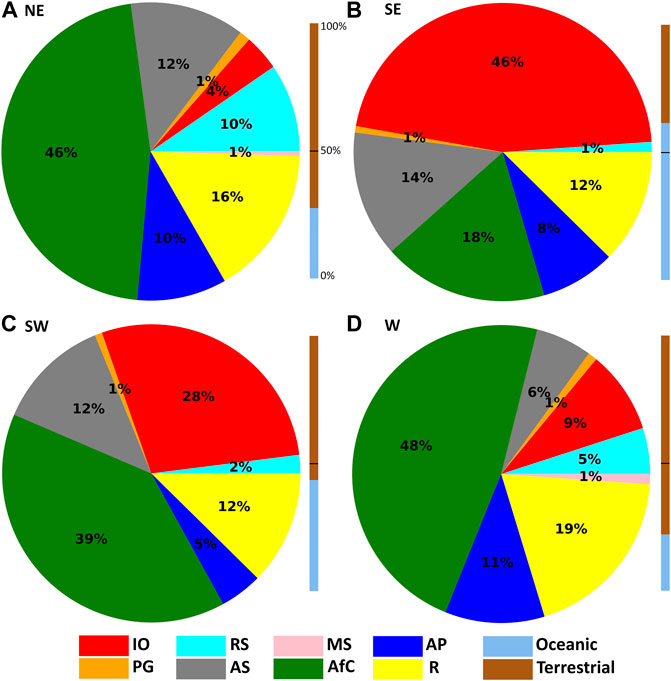
FIGURE 6. Percentages of moisture contribution (E − P < 0) from different sources to the four Ethiopian river basin regions: (A) northeast (NE), (B) southeast (SE), (C) southwest (SW), and (D) western (W), obtained via the forward analysis for the period 1980–2018. Blue and brown bars represent the total moisture contribution from oceanic and terrestrial sources, respectively. Key for the sources: IO, Indian Ocean (red), RS, Red Sea (cyan), MS, Mediterranean Sea (pink), PG, Persian Gulf (orange), AS, Arabian Sea (grey), AfC, African continent (green), AP, Arabian Peninsula (dark blue), and R, within the region’s river basins (yellow).
Figure 7 presents the correlation analysis between the series of precipitation over each region of study, and the corresponding series of |(E − P) < 0| computed through the forward experiment from the respective moisture sources. For NE, the correlations were positive, except for that obtained with the moisture contribution from AS, which was negative. Similarly, the moisture contribution to precipitation from AS and precipitation over the other regions had an inverse relationship, which may depend on the influence of the position and intensity of the Somali low-level jet during the boreal summer months. In the remaining regions, the correlations were predominantly positive, particularly for the W region, which confirms a direct relationship.
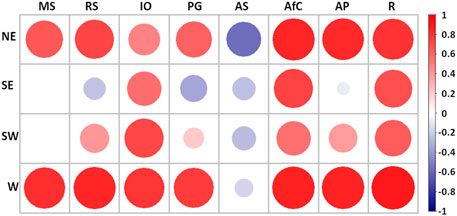
FIGURE 7. Pearson correlation values obtained between the series of precipitation over the NE, SE, SW, and W regions from the Climatic Research Unit and the |(E − P) < 0| computed over these regions on air masses tracked forward in time from all the sources (MS, RS; IO; PG; AS; AfC, AP, and R).
3.3 Assessment of Drought Conditions
3.3.1 Anomaly of Vertically Integrated Moisture Flux
The SPEI12 values for December were used to investigate the annual evolution of dry and wet conditions in each region during the study period (Figure 8). At this time scale, the SPEI permits the assessment of the occurrence of long-term drought, which can be associated with a combination of accumulated impacts on agriculture, streamflows, and reservoir levels. The negative (positive) SPEI12 values for December revealed a predominance of annual dry (wet) conditions for each year from 1980 to 2018, respectively. The dashed green line marks the threshold (−1.5), below which the SPEI indicates the occurrence of severe and extremely dry conditions. In 1984, the NE region was affected by extreme drought conditions, while in 2009 and 2015, it was affected by severe conditions. Philip et al. (2018) also described 2015 as a very dry year in northern and central Ethiopia. Extreme drought conditions affected the SE and SW regions in 1984, when in the W region, the SPEI12 almost reached the threshold of −1.5. This indicated that it was a dry year in all river basins throughout the country. This drought was associated with devasting famine and mortality that affected the entire Ethiopian economy and population in 1984, requiring support from global institutions and developed countries (Vestal, 1985; Dercon and Porter, 2014). The SE region was also affected by severe drought conditions in 1980 and 1999, the SW region in 1999 and 2002, and the W region in 1995 and 2009. Finally, the worst year in the W region was 2009, with severe drought conditions; this was also the most affected region that year. A report from the United Union in 2009 (UN, 2009) associated the successive failure of precipitation in this year and a substantial food shortfall and high prices globally with over six million drought victims. The temporal evolution of annual dry/wet conditions in the four study regions reveals that in some years (e.g., 1984, 2009), there was a simultaneous occurrence of drought that affected the four regions, although with different severity in each of them. However, this does not ensure that the phenomenon of drought occurs simultaneously in all the study regions that make up the country. In some years such as 1987, three regions were affected by dry conditions while the SE experimented wet conditions; in 1985 the W and SE regions were affected by wet conditions but negative SPEI12 indicate dry conditions in the NE and SW, or the year 2000, when the W region experienced extremely wet conditions but the other regions dry conditions.
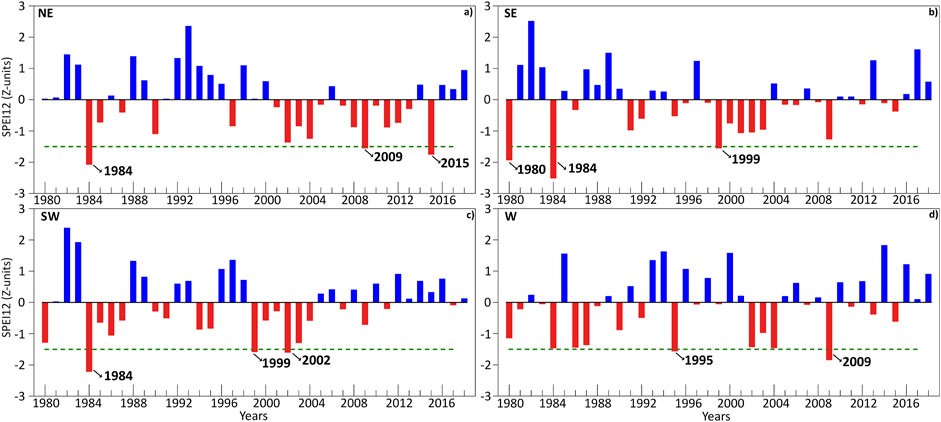
FIGURE 8. Annual standardised precipitation evapotranspiration index (December-SPEI12) for the NE (A), SE (B), SW (C), and W (D) groups. Period: 1980–2018. The green dashed line indicates years where SPEI12 values were lower than −1.50 (severely dry conditions).
Annual (in percentages) and monthly (in mm/day) anomalies of the moisture contribution for those years in which severe and extreme drought affected the study regions were calculated, as shown in Figures 9A,B respectively. The number of months with negative anomalies of |(E – P) < 0| are summarised on the bars representing the annual anomalies from the sources (Figure 9A). In addition, the SPEI1 is also over plotted to the monthly anomalies of |(E – P) < 0| (Figure 9B); the visual analysis of both series allows characterising the behaviour of the SPEI1 and the contribution of the sources for each month of the years affected by severe and/or extreme drought conditions. Besides, it allows inferring the possible influence of peaks of the moisture contribution during a particular month on the value of the annual anomaly also plotted in the panel a of this figure. For the NE region, we analysed the anomalies over 3 years: 1984, 2009, and 2015. The annual anomaly values show that only the contribution from the PG experiences a decrease (30%); however, the climatological contribution from this source represents only 1% of the total contribution from the main moisture sources in the NE region. An analysis of the monthly anomalies in the contribution of each source showed that in most months, the negative anomalies coincided with negative values of SPEI1; however, in July 1984 there were high positive values in the contributions but negative values in SPEI1 (Figure 9B). Although most sources contributed more than the annual average in this year, the effect of the contribution in specific months masked what happened during the rest of the year. For example, for 8–9 months of 1984, the anomalies in the contribution from the MS and RS were negative, although, these are not the most important sources. In 2015, there was a reduction in the moisture contribution to precipitation from all sources in the NE region, except for a negligible percentage from the PG. In 1984, there was also a decrease in the moisture contribution from most of the sources to the precipitation over the NE region, including two of the most important sources, the AfC and AP, which prevailed in almost all months of the year. To support the understanding of the role of moisture contribution anomalies in the occurrence of severe and extreme drought conditions, VIMF anomalies were calculated (Figure 10). In 1984, 2015, and 2009, positive anomalies (red shades) of the VIMF prevailed over the NE region, which favoured the inhibition of convective movements and therefore precipitation. However, this analysis on an annual scale can frame the behaviour of a particular month in 1984, when the sources increased their contributions.
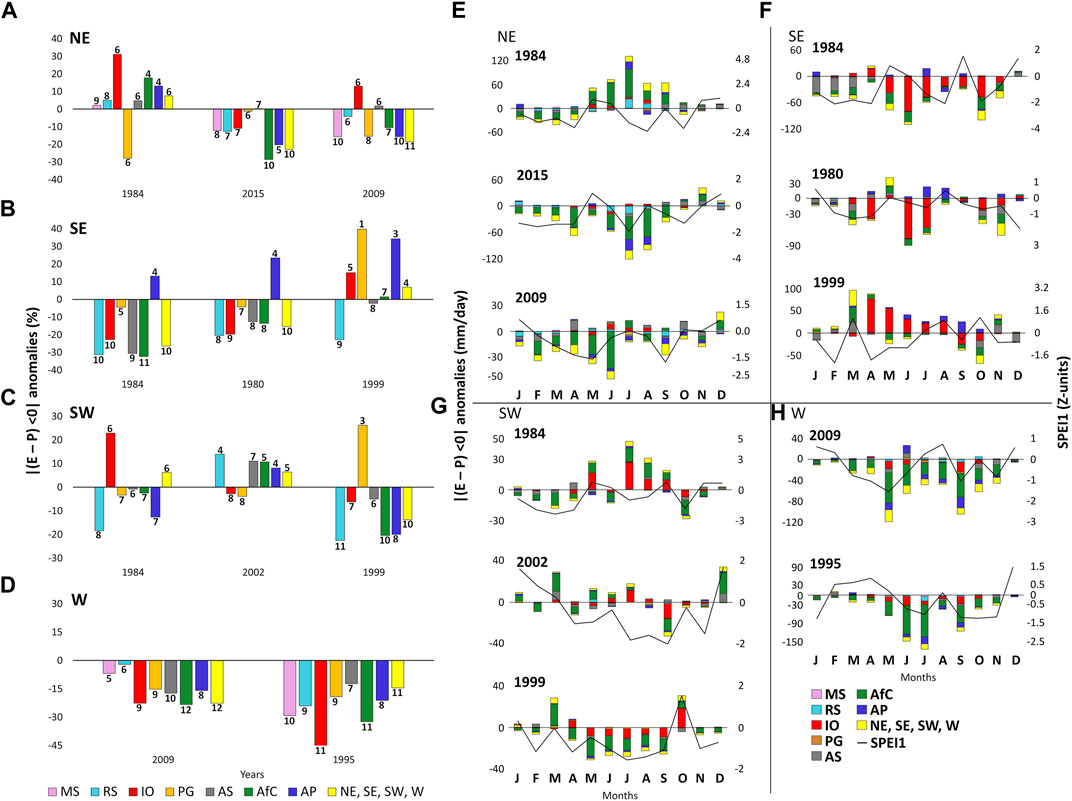
FIGURE 9. Left panel: Anomalies on the moisture contribution to precipitation |(E − P) < 0| (expressed in percentage) from every source during years affected by severe or extreme drought conditions in the study regions; NE (A), SE (B), SW (C), and W (D); and the number of months with a negative anomaly on the moisture contribution from each source (expressed in numbers). Right panels: SPEI1 and monthly anomalies of |(E − P) < 0| during each year in the study regions; NE (E), SE (F), SW (G), and W (H).
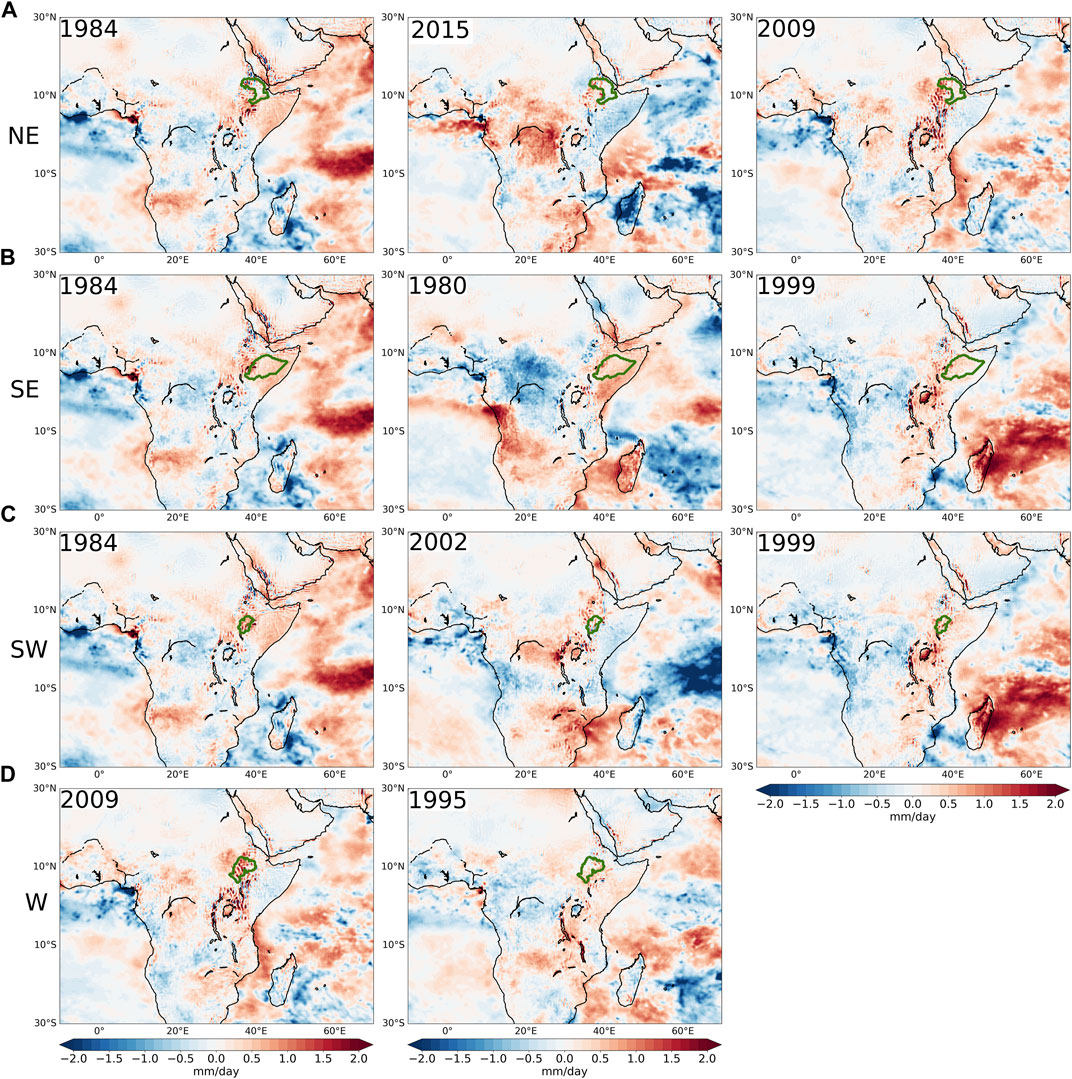
FIGURE 10. Anomalies of vertically integrated moisture flux (VIMF, unit: mm/day) for severe annual drought in each of the four [NE (A), SE (B), SW (C), and W (D)] regions of study (shown in Figure 2).
The years of extreme (1984) and severe (1980) droughts in the SE region witnessed a decrease in the moisture contribution from the sources to precipitation, except for the AP source. The monthly analysis of SPEI (SPEI1) for 1984 showed a possible temporal lag. Likewise, in both years, the number of months affected by negative anomalies of contributions was predominant. In another year affected by severe drought conditions (1999), the behaviour of the sources in terms of decreasing contribution was not as homogeneous. However, the deficit of moisture supplies from the RS and AS during 9 and 8 months of 1999, respectively. Here stand out that from the AS, taking into account that the average annual supply from this source represents a 14% of the total moisture lose over the SE region. The visual analysis results in Figure 10 reveal the predominance of positive VIMF anomalies over the SE region, particularly in 1984, thereby confirming the importance of dynamic conditions in the final hydroclimatic conditions of the region. Although the number of years with severe and extreme drought conditions in this region is low, the results confirm a more direct relationship between the accumulated moisture contribution deficit and the impact of droughts in the W region. In summary, although the analysis done in Figure 9 reveals the role of sources in the annual occurrence of droughts, the monthly anomalies of the contribution from the sources reveal that a more detailed analysis at the seasonal scale is necessary to better characterize their role in the occurrence of droughts.
For the SW region, the anomaly analysis indicated that in the driest year (1984), there were 8 months with reduced moisture contribution to precipitation from the RS source, while there were 7 months with the same conditions from the AP, PG, and AfC sources. The annual reductions from the RS and AP represented almost 20% and 14% of the historical average, respectively. However, these sources are not the largest contributors. However The AfC source only experienced an annual reduction of 3% but is the most important from a climatological point of view for this region. The temporal evolution of SPEI1 during this year shows an inconsistency in July and August when the anomalies of |(E − P) < 0| values were positive, but the SPEI1 was negative. In 2002, only two sources, the IO and PG, experienced a decrease in their contribution to the annual average, with negative SPEI1 values in 8 months of the year. It is worth highlighting the importance of the IO source, which is the second most important source for this region. The SW region was also affected by severe drought conditions in 1999, when the contribution from all sources, except the PG, decreased substantially. The temporal evolution of SPEI1 during this year reveals a good correlation between the evolution of the index and anomalies of moisture contributions from the different sources. The VIMF anomalies over the SW region during these years were mostly positive, mainly in 1984, which was the driest year. Finally, in the 2 years (2009 and 1995) affected by severe drought conditions in the W region, there was a negative anomaly in the contribution of moisture to precipitation from all moisture sources of this region, as well as unfavourable conditions for precipitation according to positive anomalies of the VIMF. The evolution of SPEI1 during these years was consistent with the monthly |(E – P) < 0| anomalies.
3.3.2 Drought Impacts on Vegetation
The vegetation dynamics in each region were investigated during severe and extreme annual droughts. To this end, the NDVI anomalies were calculated (Figure 11). For the NE region under the extreme drought of 1984, the NDVI anomalies were predominantly negative. This confirms the marked reduction in vegetation cover in a region characterised by the prevalence of dry evergreen Afromontane forest and Combretum-Terminalia woodland and wooded grassland (Friis et al., 2010). In 2015 and 2009, lower vegetation activity was observed in a large part of the NE region, particularly in the north, and south, respectively. Vegetation stress was also observed in a major part of the SE region due to extreme drought conditions in 1984, particularly in the southwest of this region. The results are also consistent for 1999, when severe drought affected the SE region and negative anomalies of the NDVI prevailed, although they were less intense than those found for 1984. NDVI anomalies were not calculated for 1980 because the relevant data were unavailable.
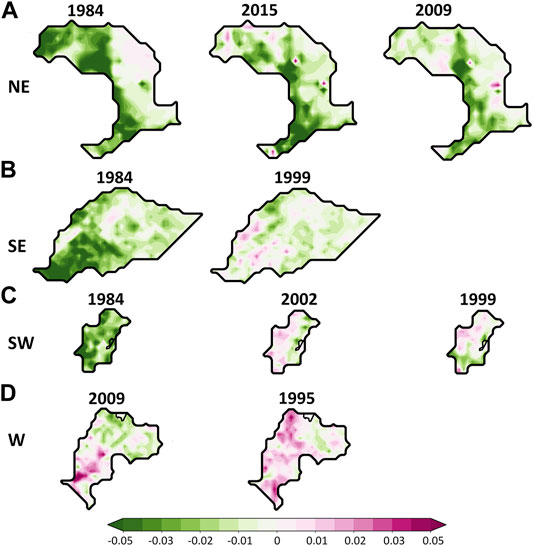
FIGURE 11. Anomalies in the normalised difference vegetation index (NDVI) for the NE (A), SE (B), SW (C), and W (D) regions under study during severe and extreme drought years.
For the SW region, negative NDVI anomalies were obtained for 1984, a year of extreme drought, which extended over the entire region. This is supported by the study conducted by Dagnachew et al. (2020) for the Omo-Gibe basin (located in the SW region), which described vegetation degradation in 1984. The years 2002 and 1999, which were the second and third most severe dry years for the SW region, respectively, showed less pronounced negative NDVI anomalies that are mostly located to the east in 2002 and south in 1999. Finally, in the W region, a common contrast was observed in vegetation growing conditions between the northeast and southwest in 2009 and 1995, both years affected by severe drought. However, it was contradictory to find a prevalence of positive NDVI anomalies in the year 1995. A possible explanation for this could be the occurrence of two previous years (1993 and 1994) characterised by severe wet conditions (Figure 8). To confirm this, future studies should identify the optimal temporal lag in which dry and humid conditions affect the vegetation conditions in these regions.
4 Conclusion
This study revealed the most important sources of moisture for precipitation in Ethiopian river catchments. For this purpose, a cluster analysis was implemented to reduce the 12 river basins that make up the country into a smaller group of major drainage systems with similar pluviometry characteristics. This resulted in four study regions named N, SE, SW, and W, according to their geographical position in the country. The analysis was based on a Lagrangian approach using global outputs from the FLEXPART model for 39 years (1980–2018) for ensuring accrued climatological results. This model permitted to track backward in time air masses and computed the moisture gain over time, which allows the identification of the most important oceanic and terrestrial moisture sources. These were the western IO, AS, PG, MS, and RS as well as terrestrial sources from the adjacent AfC, AP, and R. However, the MS was not selected as one of the most important sources for the SE and SW regions. The size of the sources differs, even when they originated from the same geographical region. The moisture contribution from these sources to precipitation (E − P) < 0 over the target regions was calculated by forecasting air masses occurring over the sources and considering the optimum integration times of the Lagrangian precipitation proposed in previous studies. This analysis revealed the crucial role of moisture recycling and moisture export within the African continent according to the major moisture contribution supply from the AfC, R, and AP sources to the precipitation over the NW, W, and SW regions. In contrast, the IO and AS are responsible for supplying 46% and 14% of the moisture loss over the SE region, respectively; thus, the oceanic origin of precipitation is significant in this region. Correlation analysis confirmed the direct relationship between the |(E − P) < 0| series and precipitation over each region.
Drought assessment using the SPEI on a 12-month scale identified the years affected by severe and extreme drought conditions in each of the study regions. The years in order of severity for the NE regions were 1984, 2015, and 2009; for the SE, 1984, 1980, and 1989; for the SW, 1984, 2002, 1999; and for the W, 2009, and 1995. During these years, a significant reduction in the moisture contributions from the sources occurred in combination with positive anomalies of the VMIF, which confirmed the inhibition of convection and precipitation processes. In 1984 for the NE region, analysis at the annual scale did not provide wholly consistent results; however, a monthly analysis partially supported an explanation. Finally, annual severe and extreme drought conditions reduced the vegetation activity, particularly in the NE, SE, and SW regions. Our ongoing research is focused on a more detailed seasonal analysis, which will provide more comprehensive information regarding the variability of precipitation sources. Further, its impact on Ethiopian seasonal rainfall and the associated influence of drought on hydrological cycles and vegetation.
Data Availability Statement
Publicly available datasets were analyzed in this study. This data can be found here: https://apps.ecmwf.int; https://crudata.uea.ac.uk/cru/data/hrg/cru_ts_4.05/; https://www.ncei.noaa.gov/access/metadata/landing-page/bin/iso?id=gov.noaa.ncdc:C01558.
Author Contributions
MS and GM provided research ideas. MS, RS, and MV calculated, analysed and wrote the manuscript. RN, LG, and GM wrote and revisited the final version of the manuscript.
Funding
This work is part of the LAGRIMA project (grant no. RTI2018-095772-B-I00) funded by the Ministerio de Ciencia, Innovación y Universidades, Spain. Partial support was also obtained from the Autonomous Government Xunta de Galicia-FEDER under projects ED431C 2021/44 (Grupos de Referencia Competitiva): “ERDF A way of making Europe.” MS, RS, and MV were supported by the Xunta of Galicia under grants ED481B-2021/134, ED481B 2019/070, and ED481D 2022/020, respectively.
Conflict of Interest
The authors declare that the research was conducted in the absence of any commercial or financial relationships that could be construed as a potential conflict of interest.
Publisher’s Note
All claims expressed in this article are solely those of the authors and do not necessarily represent those of their affiliated organizations, or those of the publisher, the editors and the reviewers. Any product that may be evaluated in this article, or claim that may be made by its manufacturer, is not guaranteed or endorsed by the publisher.
References
Abara, M., Komariah, K., and Budiastuti, S. (2020). Drought Frequency, Severity, and Duration Monitoring Based on Climate Change in Southern and Southeastern Ethiopia. IOP Conf. Ser. Earth Environ. Sci. 477, 012011. doi:10.1088/1755-1315/477/1/012011
Abebe, D. (2010). Future Climate of Ethiopia from PRECIS Regional Climate Model Experimental Design. Ethiopia Available at: https://www.metoffice.gov.uk/binaries/content/assets/metofficegovuk/pdf/research/applied-science/precis/precis_experimental_design_dawit.pdf (accessed 04 18, 2022).
Aerts, R., Van Overtveld, K., November, E., Wassie, A., Abiyu, A., Demissew, S., et al. (2016). Conservation of the Ethiopian Church Forests: Threats, Opportunities and Implications for Their Management. Sci. Total Environ. 551-552 (552), 404–414. doi:10.1016/j.scitotenv.2016.02.034
Alemayehu, A., Maru, M., Bewket, W., and Assen, M. (2020). Spatiotemporal Variability and Trends in Rainfall and Temperature in Alwero Watershed, Western Ethiopia. Environ. Syst. Res. 9, 22. doi:10.1186/s40068-020-00184-3
Alemu, Z. A., Dioha, E. C., Dioha, E. C., and Dioha, M. O. (2021). Hydro-meteorological Drought in Addis Ababa: A Characterization Study. AIMS Environ. Sci. 8 (2), 148–168. doi:10.3934/environsci.2021011
Alhamshry, A., Fenta, A. A., Yasuda, H., Kimura, R., and Shimizu, K. (2020). Seasonal Rainfall Variability in Ethiopia and its Long-Term Link to Global Sea Surface Temperatures. Water 12, 1–19. doi:10.3390/w12010055
Allen, R. G., Pereira, L. S., Raes, D., and Smith, M. (1998). FAO Irrigation and Drainage Paper No. 56. Rome, Italy: Food and AgricultureOrganization of the United Nations.
Asadi Zarch, M. A., Sivakumar, B., and Sharma, A. (2015). Droughts in a Warming Climate: a Global Assessment of Standardized Precipitation Index (SPI) and Reconnaissance Drought Index (RDI). J. Hydrology 526, 183–195. doi:10.1016/j.jhydrol.2014.09.071
Asefa, M., Cao, M., He, Y., Mekonnen, E., Song, X., and Yang, J. (2020). Ethiopian Vegetation Types, Climate and Topography. Plant Divers. 42, 302–311. doi:10.1016/j.pld.2020.04.004
Asfaw, A., Simane, B., Hassen, A., and Bantider, A. (2018). Variability and Time Series Trend Analysis of Rainfall and Temperature in Northcentral Ethiopia: A Case Study in Woleka Sub-basin. Weather Clim. Extrem. 19, 29–41. doi:10.1016/j.wace.2017.12.002
Asmamaw, D. K. (2015). A Critical Review of Integrated River Basin Management in the Upper Blue Nile River Basin: the Case of Ethiopia. Int. J. River Basin Manag. 13, 429–442. doi:10.1080/15715124.2015.1013037
Awulachew, S. B., Merrey, D. J., Kamara, A. B., Van Koppen, B., Penning de Vries, F., Boelee, E., et al. (2005). Experiences and Opportunities for Promoting Small–Scale/micro Irrigation and Rainwater Harvesting for Food Security in Ethiopia. Colombo, Sri Lanka: IWMI. v. 86p. (Working paper 98). Available at: https://www.iwmi.cgiar.org/Publications/Working_Papers/working/WOR98.pdf.
Awulachew, S. B., Yilma, A. D., Loulseged, M., Loiskandl, W., Ayana, M., and Alamirew, T. (2007). Water Resources and Irrigation Development in Ethiopia. Colombo, Sri Lanka: International Water Management Institute. (IWMI). 66p. (IWMI Working Paper 123). doi:10.3910/2009.305
Ayalew, D. W. (2018). Theoretical and Empirical Review of Ethiopian Water Resource Potentials, Challenges and Future Development Opportunities. Int. J. Waste Resour. 08, 353. doi:10.4172/2252-5211.1000353
Bayable, G., Amare, G., Alemu, G., and Gashaw, T. (2021). Spatiotemporal Variability and Trends of Rainfall and its Association with Pacific Ocean Sea Surface Temperature in West Harerge Zone, Eastern Ethiopia. Environ. Syst. Res. 10, 7. doi:10.1186/s40068-020-00216-y
Bayissa, Y., Semu, A., Yunqing, X., Schalk, A., Shreedhar, M., Dimitri, S., et al. (2015). Spatio-temporal Assessment of Meteorological Drought under the Influence of Varying Record Length: The Case of Upper Blue Nile Basin, Ethiopia. Hydrol. Sci. J. 60, 1927–1942. doi:10.1080/02626667.2015.1032291
Bednorz, E., Wrzesiński, D., Tomczyk, A. M., and Jasik, D. (2019). Classification of Synoptic Conditions of Summer Floods in Polish Sudeten Mountains. Water 11 (7), 1450. doi:10.3390/w11071450
Beguería, S., Vicente-Serrano, S. M., Reig, F., and Latorre, B. (2014). Standardized Precipitation Evapotranspiration Index (SPEI) Revisited: Parameter Fitting, Evapotranspiration Models, Tools, Datasets and Drought Monitoring. Int. J. Climatol. 34, 3001–3023. doi:10.1002/joc.3887
Belayneh, A., Adamowski, J., Khalil, B., and Ozga-Zielinski, B. (2014). Long-term SPI Drought Forecasting in the Awash River Basin in Ethiopia Using Wavelet Neural Network and Wavelet Support Vector Regression Models. J. Hydrology 508, 418–429. doi:10.1016/j.jhydrol.2013.10.052
Berhanu, B., Seleshi, Y., and Melesse, A. (2014). “Surface Water and Groundwater Resources of Ethiopia: Potentials and Challenges of Water Resources Development,” in Nile River Basin. Editors A. Melesse, W. Abtew, and S. Setegn (Cham: Springer). doi:10.1007/978-3-319-02720-3_6
Beyene, T. K., Jain, M. K., Yadav, B. K., and Agarwal, A. (2021). Multiscale Investigation of Precipitation Extremes over Ethiopia and Teleconnections to Large-Scale Climate Anomalies. Stoch. Environ. Res. Risk Assess. 36, 1503–1519. doi:10.1007/s00477-021-02120-y
Bisselink, B., and Dolman, A. J. (2008). Precipitation Recycling: Moisture Sources over Europe Using ERA-40 Data. J. Hydrometeorol. 9, 1073–1083. doi:10.1175/2008jhm962.1
Bu, J., Liu, W., Pan, Z., and Ling, K. (2020). Comparative Study of Hydrochemical Classification Based on Different Hierarchical Cluster Analysis Methods. Ijerph 17, 9515. doi:10.3390/ijerph17249515
Cheung, W. H., Senay, G. B., and Singh, A. (2008). Trends and Spatial Distribution of Annual and Seasonal Rainfall in Ethiopia. Int. J. Climatol. 28, 1723–1734. doi:10.1002/joc.1623
Dagnachew, M., Kebede, A., Moges, A., and Abebe, A. (2020). Effects of Climate Variability on Normalized Difference Vegetation Index (NDVI) in the Gojeb River Catchment, Omo-Gibe Basin, Ethiopia. Adv. Meteorol. 2020, 8263246. doi:10.1155/2020/8263246
Dai, A. (2010). Drought under Global Warming: a Review. WIREs Clim. Change 2 (1), 45–65. doi:10.1002/wcc.81
Dee, D. P., Uppala, S. M., Simmons, A. J., Berrisford, P., Poli, P., Kobayashi, S., et al. (2011). The ERA-Interim Reanalysis: Configuration and Performance of the Data Assimilation System. Q.J.R. Meteorol. Soc. 137, 553–597. doi:10.1002/qj.828
Degefu, M. A., Bewket, W., and Amha, Y. (2022). Evaluating Performance of 20 Global and Quasi-Global Precipitation Products in Representing Drought Events in Ethiopia I: Visual and Correlation Analysis. Weather Clim. Extrem. 35, 100416. doi:10.1016/j.wace.2022.100416
Delbiso, T. D., Rodriguez-Llanes, J. M., Donneau, A.-F., Speybroeck, N., and Guha-Sapir, D. (2017). Drought, Conflict and Children's Undernutrition in Ethiopia 2000-2013: a Meta-Analysis. Bull. World Health Organ. 95 (2), 94–102. doi:10.2471/BLT.16.172700
Dercon, S., and Porter, C. (2014). Live Aid Revisited: Long-Term Impacts of the 1984 Ethiopian Famine on Children. J. Eur. Econ. Assoc. 12 (4), 927–948. doi:10.1111/jeea.12088
Dezfuli, A. K. (2011). Spatio-temporal Variability of Seasonal Rainfall in Western Equatorial Africa. Theor. Appl. Climatol. 104, 57–69. doi:10.1007/s00704-010-0321-8
Dika, G. (2018). Impacts of Climate Variability and Households Adaptation Strategies in Lare District of Gambella Region, South Western Ethiopia. J. Earth Sci. Clim. Chang. 9, 1–12. doi:10.4172/2157-7617.1000480
Diro, G. T., Grimes, D. I. F., and Black, E. (2011). “Large Scale Features Affecting Ethiopian Rainfall,” in African Climate and Climate Change. Editors C. J. R. Williams, and D. R. Kniveton (Netherlands, Vol. 43, 13–50. Advances in global change researchSpringer. doi:10.1007/978-90-481-3842-5_2
Distances between Clustering (2009). Distances between Clustering, Hierarchical Clustering 36-350, Data Mining (2009) by Unknown Authors. Available at: http://citeseerx.ist.psu.edu/viewdoc/download?doi=10.1.1.190.9886&rep=rep1&type=pdf
Drumond, A., Stojanovic, M., Nieto, R., Vicente-Serrano, S. M., and Gimeno, L. (2019). Linking Anomalous Moisture Transport and Drought Episodes in the IPCC Reference Regions. BAMS 100, 1481–1498. doi:10.1175/bams-d-18-0111.1
Dubache, G., Ogwang, B. A., Ongoma, V., and Towfiqul Islam, A. R. M. (2019). The Effect of Indian Ocean on Ethiopian Seasonal Rainfall. Meteorol. Atmos. Phys. 131, 1753–1761. doi:10.1007/s00703-019-00667-8
Ebi, K. L., and Bowen, K. (2016). Extreme Events as Sources of Health Vulnerability: Drought as an Example. Weather Clim. Extrem. 11, 95–102. doi:10.1016/j.wace.2015.10.001
Edossa, D. C., Babel, M. S., and Das Gupta, A. (2010). Drought Analysis in the Awash River Basin, Ethiopia. Water Resour. manage. 24, 1441–1460. doi:10.1007/s11269-009-9508-0
El Kenawy, A. M., McCabe, M. F., Vicente-Serrano, S. M., López-Moreno, J. I., and Robaa, S. M. (2016). Changes in the Frequency and Severity of Hydrological Droughts over Ethiopia from 1960 to 2013. Cig 42, 145–166. doi:10.18172/cig.2931
Fazzini, M., Bisci, C., and Billi, P. (2015). “The Climate of Ethiopia,” in Landscapes and Landforms of Ethiopia. World Geomorphological Landscapes. Editor P. Billi (Dordrecht: Springer), 65–87. doi:10.1007/978-94-017-8026-1_3
Fekadu, K. (2015). Ethiopian Seasonal Rainfall Variability and Prediction Using Canonical Correlation Analysis (CCA). Earth 4, 112–119. doi:10.11648/j.earth.20150403.14
Ferreira, L., and Hitchcock, D. B. (2009). A Comparison of Hierarchical Methods for Clustering Functional Data. Commun. Statistics - Simul. Comput. 38, 1925–1949. doi:10.1080/03610910903168603
Friis, I., Sebsebe, D., and Breugel, P. (2010). “Atlas of the Potential Vegetation of Ethiopia,” in The Royal Danish Academy of Science and Letters. Available at: https://www.royalacademy.dk/Publications/Low/3607_Friis,%20Ib,%20Demissew,%20Sebsebe%20and%20van%20Breugel,%20Paulo.pdf.
Funk, C. C., Rowland, J., Eilerts, G., Kebebe, E., Biru, N., Libby, W., et al. (2012). A Climate Trend Analysis of Ethiopia. Reston, VA: USGS Publications Warehouse, 1–6. Available at: http://pubs.er.usgs.gov/publication/fs20123053.
Funk, C. C., Senay, G., Asfaw, A., Verdin, J., Rowland, J., Michaelson, J., et al. (2005). Recent Drought Tendencies in Ethiopia and Equatorial-Subtropical Eastern Africa. Washington DC: FEWS-NET. Available at: https://pdf.usaid.gov/pdf_docs/PNADH997.pdf.
Gebrechorkos, S. H., Hülsmann, S., and Bernhofer, C. (2019). Changes in Temperature and Precipitation Extremes in Ethiopia, Kenya, and Tanzania. Int. J. Climatol. 39, 18–30. doi:10.1002/joc.5777
Gebrehiwot, T., Van Der Veen, A., and Maathuis, B. (2011). Spatial and Temporal Assessment of Drought in the Northern Highlands of Ethiopia. Int. J. Appl. Earth Observation Geoinformation 13, 309–321. doi:10.1016/j.jag.2010.12.002
Gezie, M. (2019). Farmer’s Response to Climate Change and Variability in Ethiopia: A Review. Cogent Food Agric. 5 (1), 1–13. doi:10.1080/23311932.2019.1613770
Ghebrezgabher, M. G., Yang, T., and Yang, X. (2016). Long-term Trend of Climate Change and Drought Assessment in the Horn of Africa. Adv. Meteorology 2016, 1–12. doi:10.1155/2016/8057641
Gimeno, L., Drumond, A., Nieto, R., Trigo, R. M., and Stohl, A. (2010). On the Origin of Continental Precipitation. Geophys. Res. Lett. 37, L13804. doi:10.1029/2010gl043712
Gimeno, L., Vázquez, M., Eiras-Barca, J., Sorí, R., Stojanovic, M., Algarra, I., et al. (2020). Recent Progress on the Sources of Continental Precipitation as Revealed by Moisture Transport Analysis. Earth-Sci. Rev. 201, 1–25. doi:10.1016/j.earscirev.2019.103070
Gissila, T., Black, E., GrimesSlingo, D. I. F. J. M., and Slingo, J. M. (2004). Seasonal Forecasting of the Ethiopian Summer Rains. Int. J. Climatol. 24, 1345–1358. doi:10.1002/joc.1078
Hadish, L. (2010). Drought Risk Assessment using Remote Sensing and GIS: The Case of Southern Zone, Tigray Region, Ethiopia. J. Nat. Sci. Res. 4 (23), 87–95.
Harris, I., Osborn, T. J., Jones, P., and Lister, D. (2020). Version 4 of the CRU TS Monthly High-Resolution Gridded Multivariate Climate Dataset. Sci. Data 7, 109. doi:10.1038/s41597-020-0453-3
Hassan, M. A., Yang, M., Rasheed, A., Yang, G., Reynolds, M., Xia, X., et al. (2019). A Rapid Monitoring of NDVI across the Wheat Growth Cycle for Grain Yield Prediction Using a Multi-Spectral UAV Platform. Plant Sci. 282, 95–103. doi:10.1016/j.plantsci.2018.10.022
Hernandez, E. A., and Uddameri, V. (2014). Standardized Precipitation Evaporation Index (SPEI)-based Drought Assessment in Semi-arid South Texas. Environ. Earth Sci. 71 (6), 2491–2501. doi:10.1007/s12665-013-2897-7
Herring, S. C., Hoerling, M. P., Peterson, T. C., and Stott, P. A. (2014). Explaining Extreme Events of 2013 from a Climate Perspective. Bull. Am. Meteorol. Soc. 95 (9), S1–S104. doi:10.1175/1520-0477-95.9.S1.1
Hirko, A., Mergia, G., Nigussie, A., and Dandesa, T. (2021). Seasonal and Annual Meteorological Drought Frequency: Case Study West Hararge Province (Zone). Int. J. Res. Environ. Sci. 7, 1–10. doi:10.20431/2454-9444.0701001
Ionita, M., Tallaksen, L. M., Kingston, D. G., Stagge, J. H., Laaha, G., Van Lanen, H. A. J., et al. (2017). The European 2015 Drought from a Climatological Perspective. Hydrol. Earth Syst. Sci. 21, 1397–1419. doi:10.5194/hess-21-1397-2017
Jjemba, E., Singh, R., and Arrighi, J. (2017). Extreme Drought in Ethiopia Stretches Drought Management Systems. The Hague: Red Cross Red Crescent Climate Centre. Available at: https://cdkn.org/sites/default/files/files/Extreme-drought-in-Ethiopia-stretches-drought-management-systems.pdf.
Jury, M. R., and Chiao, S. (2014). Representation of Ethiopian Wet Spells in Global and Nested Models. Adv. Meteorology 2014 (4), 1–12. doi:10.1155/2014/237374
Jury, M. R. (2011). Meteorological Scenario of Ethiopian Floods in 2006-2007. Theor. Appl. Climatol. 104, 209–219. doi:10.1007/s00704-010-0337-0
Keyantash, J., and Dracup, J. A. (2002). The Quantification of Drought: An Evaluation of Drought Indices. Bull. Amer. Meteor. Soc. 83, 1167–1180. doi:10.1175/1520-0477-83.8.1167
Łabędzki, L. (2007). Estimation of Local Drought Frequency in Central Poland Using the Standardized Precipitation Index SPI. Irrig. Drain. 56 (1), 67–77. doi:10.1002/ird.285
Leprieur, C., Kerr, Y. H., Mastorchio, S., and Meunier, J. C. (2000). Monitoring Vegetation Cover across Semi-arid Regions: Comparison of Remote Observations from Various Scales. Int. J. Remote Sens. 21 (2), 281–300. doi:10.1080/014311600210830
Liou, Y.-A., and Mulualem, G. M. (2019). Spatio–temporal Assessment of Drought in Ethiopia and the Impact of Recent Intense Droughts. Remote Sens. 11, 1–19. doi:10.3390/rs11151828
Livada, I., and Assimakopoulos, V. D. (2007). Spatial and Temporal Analysis of Drought in Greece Using the Standardized Precipitation Index (SPI). Theor. Appl. Climatol. 89 (3–4), 143–153. doi:10.1007/s00704-005-0227-z
Lweendo, M., Lu, B., Wang, M., Zhang, H., and Xu, W. (2017). Characterization of Droughts in Humid Subtropical Region, Upper Kafue River Basin (Southern Africa). Water 9 (4), 242. doi:10.3390/w9040242
Matewos, T. (2019). Climate Change-Induced Impacts on Smallholder Farmers in Selected Districts of Sidama, Southern Ethiopia. Climate 7, 70. doi:10.3390/cli7050070
McKee, T. B., Doesken, N. J., and Kleist, J. (1993). “The Relationship of Drought Frequency and Duration to Time Scales,” in Proceedings of the Eighth Conference on Applied Climatology, Anaheim, CA, USA, 17–22 January, 179–184.
Mekonen, A. A., and Berlie, A. B. (2020). Spatiotemporal Variability and Trends of Rainfall and Temperature in the Northeastern Highlands of Ethiopia. Model. Earth Syst. Environ. 6, 285–300. doi:10.1007/s40808-019-00678-9
Mersha, A. A., and van Laerhoven, F. (2018). The Interplay between Planned and Autonomous Adaptation in Response to Climate Change: Insights from Rural Ethiopia. World Dev. 107, 87–97. doi:10.1016/j.worlddev.2018.03.001
Mishra, A. K., and Singh, V. P. (2010). A Review of Drought Concepts. J. Hydrology 391, 202–216. doi:10.1016/j.jhydrol.2010.07.012
Mohamed, Y. A., van den Hurk, B. J. J. M., Savenije, H. H. G., and Bastiaanssen, W. G. M. (2005). Hydroclimatology of the Nile: Results from a Regional Climate Model. Hydrol. Earth Syst. Sci. 9, 263–278. doi:10.5194/hess-9-263-2005
Mohammed, Y., Yimer, F., Tadesse, M., and Tesfaye, K. (2018). Meteorological Drought Assessment in North East Highlands of Ethiopia. Ijccsm 10 (1), 142–160. doi:10.1108/ijccsm-12-2016-0179
Mulugeta, S., Fedler, C., and Ayana, M. (2019). Analysis of Long-Term Trends of Annual and Seasonal Rainfall in the Awash River Basin, Ethiopia. Water 11, 1498. doi:10.3390/w11071498
Munday, C., Washington, R., and Hart, N. (2021). African Low-Level Jets and Their Importance for Water Vapor Transport and Rainfall. Geophys. Res. Lett. 48, e2020GL090999. doi:10.1029/2020gl090999
Muñoz-Díaz, D., and Rodrigo, F. S. (2004). Spatio-temporal Patterns of Seasonal Rainfall in Spain (1912-2000) Using Cluster and Principal Component Analysis: Comparison. Ann. Geophys. 22, 1435–1448. doi:10.5194/angeo-22-1435-2004
Murtagh, F., and Legendre, P. (2014). Ward's Hierarchical Agglomerative Clustering Method: Which Algorithms Implement Ward's Criterion? J. Classif. 31, 274–295. doi:10.1007/s00357-014-9161-z
Naresh Kumar, M., Murthy, C. S., Sesha Sai, M. V. R., and Roy, P. S. (2009). On the Use of Standardized Precipitation Index (SPI) for Drought Intensity Assessment. Met. Apps 16 (3), 381–389. doi:10.1002/met.136
Nieto, R., and Gimeno, L. (2019). A Database of Optimal Integration Times for Lagrangian Studies of Atmospheric Moisture Sources and Sinks. Sci. Data 6, 59. doi:10.1038/s41597-019-0068-8
NMA (1996). Climatic and Agroclimatic Resources of Ethiopia. National Meteorological Services Agency of Ethiopia. Meteorol. Res. Re.p Ser. 1 (1), 137.
Philip, S., Kew, S. F., Jan van Oldenborgh, G., Otto, F., O’Keefe, S., Haustein, K., et al. (2017). The Drought in Ethiopia. Available at: https://cdkn.org/sites/default/files/files/Ethiopia-drought-science-summary.pdf (accessed on April 1, 2022).Climate and Development Knowledge Network and World Weather Attribution Initiative Raising Risk Awareness
Philip, S., Kew, S. F., Jan van Oldenborgh, G., Otto, F., O’Keefe, S., Haustein, K., et al. (2018). Attribution Analysis of the Ethiopian Drought of 2015. J. Clim. 31 (6), 2465–2486. doi:10.1175/JCLI-D-17-0274.1
Reda, K. W., Liu, X., Tang, Q., and Gebremicael, T. G. (2021). Evaluation of Global Gridded Precipitation and Temperature Datasets against Gauged Observations over the Upper Tekeze River Basin, Ethiopia. J. Meteorol. Res. 35, 673–689. doi:10.1007/s13351-021-0199-7
Riddle, E. E., and Cook, K. H. (2008). Abrupt Rainfall Transitions over the Greater Horn of Africa: Observations and Regional Model Simulations. J. Geophys. Res. 113, D15109. doi:10.1029/2007JD009202
Riddle, E. E., and Wilks, D. S. (2013). Statistical Indices of the Northward Rainfall Progression over Eastern Africa. Int. J. Climatol. 33, 356–375. doi:10.1002/joc.3429
Roberts, D., Roth, K., and Perroy, R. (2011). “Hyperspectral Vegetation Indices,” in Hyperspectral Remote Sensing of Vegetation. Editors P. S. Thenkabail, and J. G. Lyon (Boca Raton: CRC Press), 309–327. doi:10.1201/b11222-20
Saravi, M. M., Safdari, A. A., and Malekian, A. (2009). Intensity-Duration-Frequency and Spatial Analysis of Droughts Using the Standardized Precipitation Index. Hydrol. Earth Syst. Sci. Discuss. 6, 1347–1383. doi:10.5194/hessd-6-1347-2009
Segele, Z. T., Lamb, P. J., and Leslie, L. M. (2009). Large-scale Atmospheric Circulation and Global Sea Surface Temperature Associations with Horn of Africa June-September Rainfall. Int. J. Climatol. 29, 1075–1100. doi:10.1002/joc.1751
Seleshi, Y., and Camberlin, P. (2005). Recent Changes in Dry Spell and Extreme Rainfall Events in Ethiopia. Theor. Appl. Climatol. 83, 181–191. doi:10.1007/s00704-005-0134-3
Seleshi, Y., and Zanke, U. (2004). Recent Changes in Rainfall and Rainy Days in Ethiopia. Int. J. Climatol. 24, 973–983. doi:10.1002/joc.1052
Seregina, L. S., Fink, A. H., van der Linden, R., Elagib, N. A., and Pinto, J. G. (2019). A New and Flexible Rainy Season Definition: Validation for the Greater Horn of Africa and Application to Rainfall Trends. Int. J. Climatol. 39, 989–1012. doi:10.1002/joc.5856
Sharghi, E., Nourani, V., Soleimani, S., and Sadikoglu, F. (2018). Application of Different Clustering Approaches to Hydroclimatological Catchment Regionalization in Mountainous Regions, a Case Study in Utah State. J. Mt. Sci. 15, 461–484. doi:10.1007/s11629-017-4454-4
Sheffield, J., Wood, E. F., and Roderick, M. L. (2012). Little Change in Global Drought over the Past 60 Years. Nature 491 (7424), 435–438. doi:10.1038/nature11575
Sorí, R., Vázquez, M., Stojanovic, M., Nieto, R., Liberato, M. L. R., and Gimeno, L. (2020). Hydrometeorological Droughts in the Miño–Limia–Sil Hydrographic Demarcation (Northwestern Iberian Peninsula): the Role of Atmospheric Drivers. Nat. Hazards Earth Syst. Sci. 20, 1805–1832. doi:10.5194/nhess20-1805-2020
Stohl, A., and James, P. (2004). A Lagrangian Analysis of the Atmospheric Branch of the Global Water Cycle. Part I: Method Description, Validation, and Demonstration for the August 2002 Flooding in Central Europe. J. Hydrometeor 5, 656–678. doi:10.1175/1525-7541(2004)005<0656:alaota>2.0.co;2
Stohl, A., and James, P. (2005). A Lagrangian Analysis of the Atmospheric Branch of the Global Water Cycle. Part II: Moisture Transports between Earth's Ocean Basins and River Catchments. J. Hydrometeorol. 6, 961–984. doi:10.1175/jhm470.1
Stojanovic, M., Drumond, A., Nieto, R., and Gimeno, L. (2018). Anomalies in Moisture Supply during the 2003 Drought Event in Europe: A Lagrangian Analysis. Water 10 (4), 1–19. doi:10.3390/w10040467
Stojanovic, M., Gonçalves, A., Sorí, R., Vázquez, M., Ramos, A. M., Nieto, R., et al. (2021a). Consecutive Extratropical Cyclones Daniel, Elsa and Fabien, and Their Impact on the Hydrological Cycle of Mainland Portugal. Water 13, 1476. doi:10.3390/w13111476
Stojanovic, M., Liberato, M. L. R., Sorí, R., Vázquez, M., Phan-Van, T., Duongvan, H., et al. (2020). Trends and Extremes of Drought Episodes in Vietnam Sub-regions during 1980-2017 at Different Timescales. Water 12 (3), 813. doi:10.3390/w12030813
Stojanovic, M., Nieto, R., Liberato, M. L. R., Sorí, R., Vázquez, M., and Gimeno, L. (2021b). Tracking the Origins of Moisture over Vietnam: The Role of Moisture Sources and Atmospheric Drivers on Seasonal Hydroclimatic Conditions. Int. J. Climatol. 41 (13), 5843–5861. doi:10.1002/joc.7156
Suryabhagavan, K. V. (2017). GIS-based Climate Variability and Drought Characterization in Ethiopia over Three Decades. Weather Clim. Extrem. 15, 11–23. doi:10.1016/j.wace.2016.11.005
Svoboda, M., Hayes, M., and Wood, D. (2012). Standardized Precipitation Index User Guide. Geneva: World Meteorological Organization. Available at: https://library.wmo.int/doc_num.php?explnum_id=7768.
Tefera, A. S., Ayoade, J. O., and Bello, N. J. (2019). Comparative Analyses of SPI and SPEI as Drought Assessment Tools in Tigray Region, Northern Ethiopia. SN Appl. Sci. 1, 1265. doi:10.1007/s42452-019-1326-2
Temam, D., Uddameri, V., Mohammadi, G., Hernandez, E. A., and Ekwaro-Osire, S. (2019). Long-Term Drought Trends in Ethiopia with Implications for Dryland Agriculture. Water 11, 2571. doi:10.3390/w11122571
Tian, W., Zheng, Y., Yang, R., Ji, S., and Wang, J. (2014). A Survey on Clustering Based Meteorological Data Mining. Ijgdc 7 (6), 229–240. doi:10.14257/ijgdc.2014.7.6.19
Trenberth, K. E., Dai, A., Van Der Schrier, G., Jones, P. D., Barichivich, J., Briffa, K. R., et al. (2014). Global Warming and Changes in Drought. Nat. Clim. Change 4 (1), 17–22. doi:10.1038/nclimate2067
Tsiptsis, K., and Chorianopoulos, A. (2009). Data Mining Techniques in CRM: Inside Customer Segmentation. Chichester: John Wiley & Sons. Available at: https://www.academia.edu/9824899/Data_Mining_Techniques_in_CRM_Inside_Customer_Segmentation.
UN (2009). United Nations. Available at: https://news.un.org/en/story/2009/10/318562-ethiopia-faces-large-food-shortfall-over-6-million-drought-victims-un (accessed on 04 20, 2022).
Unal, Y., Kindap, T., and Karaca, M. (2003). Redefining the Climate Zones of Turkey Using Cluster Analysis. Int. J. Climatol. 23, 1045–1055. doi:10.1002/joc.910
Van Loon, A. F., Gleeson, T., Clark, J., Van Dijk, A. I. J. M., Stahl, K., Hannaford, J., et al. (2016). Drought in the Anthropocene. Nat. Geosci. 9, 89–91. doi:10.1038/ngeo2646
Vestal, T. M. (1985). Famine in Ethiopia: Crisis of Many Dimensions. Afr. Today 32, 7–28. Available at: https://www.jstor.org/stable/4186321.
Vicente-Serrano, S. M., Beguería, S., and López-Moreno, J. I. (2010). A Multiscalar Drought Index Sensitive to Global Warming: The Standardized Precipitation Evapotranspiration Index. J. Clim. 23, 1696–1718. doi:10.1175/2009jcli2909.1
Vicente-Serrano, S. M., Beguería, S., Lorenzo-Lacruz, J., Camarero, J. J., López-Moreno, J. I., Azorin-Molina, C., et al. (2012). Performance of Drought Indices for Ecological, Agricultural, and Hydrological Applications. Earth Interact. 16, 1–27. doi:10.1175/2012EI000434.1
Viste, E., Korecha, D., and Sorteberg, A. (2013). Recent Drought and Precipitation Tendencies in Ethiopia. Theor. Appl. Climatol. 112, 535–551. doi:10.1007/s00704-012-0746-3
Viste, E., and Sorteberg, A. (2011). Moisture Transport into the Ethiopian Highlands. Int. J. Climatol. 33, 249–263. doi:10.1002/joc.3409
Wagesho, N., Goel, N. K., and Jain, M. K. (2013). Temporal and Spatial Variability of Annual and Seasonal Rainfall over Ethiopia. Hydrological Sci. J. 58 (2), 354–373. doi:10.1080/02626667.2012.754543
Wang, Q., Shi, P., Lei, T., Geng, G., Liu, J., Mo, X., et al. (2015). The Alleviating Trend of Drought in the Huang-Huai-Hai Plain of China Based on the Daily SPEI. Int. J. Climatol. 35 (13), 3760–3769. doi:10.1002/joc.4244
Wilhite, D. A., and Glantz, M. H. (1985). Understanding: the Drought Phenomenon: The Role of Definitions. Water Int. 10, 111–120. doi:10.1080/02508068508686328
Wilks, D. S. (2011). Statistical Methods in the Atmospheric Sciences. Amsterdam, The Netherlands: Elsevier.
World Bank (2006). Ethiopia: Managing Water Resources to Maximize Sustainable Growth. Washington, D.C: World Bank. Available at: https://openknowledge.worldbank.org/handle/10986/8170.
World Meteorological Organization (2012). Standardized Precipitation Index User Guide. Available at: http://www.wamis.org/agm/pubs/SPI/WMO_1090_EN.pdf (accessed on March 31, 2022).
Worqlul, A. W., Jeong, J., Dile, Y. T., Osorio, J., Schmitter, P., Gerik, T., et al. (2017). Assessing Potential Land Suitable for Surface Irrigation Using Groundwater in Ethiopia. Appl. Geogr. 85, 1–13. doi:10.1016/j.apgeog.2017.05.010
Yirga, S. A. (2021). Spatio-temporal Analysis of Drought Variability in Central Ethiopia. J. Water Clim. Chang. 12 (5), 1778–1787. doi:10.2166/wcc.2020.226
Zeleke, T., Giorgi, F., Mengistu Tsidu, G., and Diro, G. T. (2013). Spatial and Temporal Variability of Summer Rainfall over Ethiopia from Observations and a Regional Climate Model Experiment. Theor. Appl. Climatol. 111, 665–681. doi:10.1007/s00704-012-0700-4
Keywords: drought, SPEI, moisture sources, Ethiopia, Lagrangian approach
Citation: Stojanovic M, Mulualem GM, Sorí R, Vázquez M, Nieto R and Gimeno L (2022) Precipitation Moisture Sources of Ethiopian River Basins and Their Role During Drought Conditions. Front. Earth Sci. 10:929497. doi: 10.3389/feart.2022.929497
Received: 26 April 2022; Accepted: 07 June 2022;
Published: 30 June 2022.
Edited by:
Kevin Cheung, E3-Complexity Consultant, AustraliaReviewed by:
Md Wahiduzzaman, Commonwealth Scientific and Industrial Research Organisation (CSIRO), AustraliaLang Wang, The Chinese University of Hong Kong, China
Copyright © 2022 Stojanovic, Mulualem, Sorí, Vázquez, Nieto and Gimeno. This is an open-access article distributed under the terms of the Creative Commons Attribution License (CC BY). The use, distribution or reproduction in other forums is permitted, provided the original author(s) and the copyright owner(s) are credited and that the original publication in this journal is cited, in accordance with accepted academic practice. No use, distribution or reproduction is permitted which does not comply with these terms.
*Correspondence: Milica Stojanovic, bXN0b2phbm92aWNAdXZpZ28uZXM=