
94% of researchers rate our articles as excellent or good
Learn more about the work of our research integrity team to safeguard the quality of each article we publish.
Find out more
ORIGINAL RESEARCH article
Front. Earth Sci., 11 July 2022
Sec. Atmospheric Science
Volume 10 - 2022 | https://doi.org/10.3389/feart.2022.929115
This article is part of the Research TopicTropical Cyclone Intensity and Structure Changes: Theories, Observations, Numerical Modeling and ForecastingView all 19 articles
As an artificial intelligence method, machine learning (ML) has been widely used in prediction models of high-dimensional datasets. This study proposes an ML method, the Gradient Boosted Regression Tree (GBRT), to predict the intensity changes of tropical cyclones (TCs) in the Western North Pacific at 12-, 24-, 36-, 48-, 60-, and 72-h (hr) forecasting lead time and the model is optimized by the Bayesian Optimization algorithm. The model predictands are the TCs intensity changes at different forecasting lead times, obtained from the best track data of the Shanghai Typhoon Institute (STI) and the Joint Typhoon Warning Center (JTWC) from 2000 to 2019. The model predictors are the synoptic variables, climatological and persistent variables derived from the reanalysis data obtained from the National Centers for Environmental Prediction (NCEP), and the sea surface temperature (SST) data obtained from the National Oceanic and Atmospheric Administration (NOAA). The results show that the GBRT model can capture the TCs intensity changes well for the succeeding 12-h, 24-h, 36-h, and 72-h. Compared with the traditional multiple linear regression (MLR) model, the GBRT model has better performance in predicting TCs intensity changes. Compared with the MLR model, R2 of the GBRT model for TCs intensity forecast increases by an average of 8.47% and 4.45% for STI data and JTWC data. MAE (RMSE) drops by 26.24% (25.14%) and 10.51% (4.68%) for the two datasets, respectively. The potential future intensity change (POT), the intensity changes during the previous 12 h (Dvmax), Initial storm maximum wind speed (Vmax), SST, and the Sea-Land ratio are the most significant predictors for the GBRT model in predicting TCs intensity change over the Western North Pacific.
Tropical cyclones (TCs) usually bring substantial economic losses and casualties through strong winds, heavy rainfall, and storm surge during and after TCs landfall, especially in the coastal area which is vulnerable to TCs (Zhang et al., 2009). Therefore, an accurate and timely forecast of TCs track and intensity is crucial for local disaster mitigation. During the past century, scientists and meteorological administrations tried to improve their ability in TCs observation technology, forecasting techniques, and understanding TCs intensification mechanism (Emanuel, 2018). In the past 30 years, with the application of meteorological satellites and the popularity of ensemble forecasts for TCs track, the track prediction has been greatly improved (Zhang and Krishnamurti, 1997; Fraedrich et al., 2003; Langmack et al., 2012; Jun et al., 2017). However, the intensity forecast is still poor compared with the track forecast and is a huge challenge around the world (DeMaria et al., 2014).
TCs intensity is influenced by two main physical processes (Wang and Wu, 2004; Elsberry et al., 2013), which are synoptic variables such as vertical wind shear, humidity, sea surface temperature, water vapor, divergency (DeMaria, 1996; Ge et al., 2013; Gao et al., 2016; Mercer and Grimes, 2017), and climatological and persistent variables such as latitude, longitude, Julian day, and sea-land ratio (SL ratio) (DeMaria and Kaplan, 1994a; Gao et al., 2016; Li et al., 2018). Statistical-dynamical models were used to predict TCs intensity and rapid intensification probability and outperformed the forecasts of individual physics-based dynamical models (Knaff et al., 2005; Kaplan et al., 2010; Gao and Chiu, 2012). For decades, scientists have dedicated themselves to improving the skill of TCs intensity forecast. Jarvinen and Neumann (1979) proposed a statistical regression equation (Statistical Hurricane Intensity FORecast, SHIFOR) using predictors derived from climatic and persistent variables to predict TCs intensity changes over the North Atlantic Basin for the future 72 h. DeMaria and Kaplan (1994a) proposed a Statistical Hurricane Intensity Prediction Scheme (SHIPS), which considered more synoptic predictors to predict the changes in TCs intensity over the Atlantic Ocean Basin. The results showed that the average errors by SHIPS were 10%–15% smaller than the errors by the SHIFOR model that used only climatic and persistent variables. The storm decay over land was further considered by SHIPS (DeMaria et al., 2005). Besides the conventional synoptic and climatological variables, Li et al. (2018) paid close attention to the land effect on TCs intensity change by proposing a new factor involving the ratio of seawater area to land area (SL ratio) in the statistical regression model. TCs intensity changes over the entire TCs life span, including over the ocean basin, near the coast, and after landfall, were considered in the model (Li et al., 2018). Intensity forecasting accuracy for TCs near the coast and over land was improved with the addition of the SL ratio, compared with that of the models that did not consider the index of SL ratio (Li et al., 2018).
Based on previous observations and studies, in most cases, intensity changes are usually slow and steady over a certain period. However, in some situations, the TCs intensity may vary rapidly. Predicting these rapid intensifications is very challenging (Emanuel and Zhang, 2016). Many factors, such as the complex and chaotic energy exchange process between the sea and the atmosphere, and the imperfection of real-time data collection, may influence the prediction of TCs intensity change. These rapid intensification processes are challenging to explain, and therefore, neither numerical nor statistical-dynamic models can predict TCs intensity changes accurately (Chen et al., 2020). A vital weakness for numerical methods is insufficient representation of the complicated dynamical process; however, increasing the number of variables or equations would exponentially demand the computation (Gao et al., 2016). On the other hand, statistical methods, usually based on regression and lower computational costs, may not be effective in capturing nonlinear relationships. Therefore, their forecast results need to be further improved (Lin et al., 2009; Sandery et al., 2010).
To solve these problems, scientists began to use machine learning (ML) to predict the TCs intensity in recent years (Gao et al., 2016; Cloud et al., 2019; Chen et al., 2020; Xu et al., 2021). Some ML algorithms, such as support vector machine, artificial neural network, decision tree, and random forest, have been gradually introduced into meteorology (Breiman, 1996; Mas and Flores, 2008; Behrangi et al., 2009; Mountrakis et al., 2011; Pan et al., 2019). ML is applicable to high-dimensional datasets and can deal with nonlinear relationships between predictors and predictand. It is used to explore satellite, radar, and in-situ data to improve the TCs intensity forecast skills (Gao et al., 2016; Zhang et al., 2016; Griffin et al., 2017; Jin et al., 2020). Generally, ML models combine historical storm characteristics, physically motivated information, and storm-specific features to make predictions (Xu et al., 2021).
The gradient boosted regression tree (GBRT) is an ensemble ML algorithm consisting of multiple decision trees, which is robust in model training (Zhang et al., 2020). First, the decision tree algorithm is a classical ML method, and it can deal with inherent nonlinear relationships in variables and missing values (Quinlan, 1987; Fayyad and Stolorz, 1997). In addition, the algorithm can quantify the relative importance of variables and establish decision rules for prediction (Quinlan, 1987). It has been successfully applied in the analyses of the re-curvature, landfall, and intensity change of TCs in the Western North Pacific Ocean (Zhang et al., 2013; Gao et al., 2016). Second, like most ensemble methods, a combination of decision trees can provide more robust and accurate regressions than a single one. The greater-than and less-than structures of the tree module make the GBRT less affected by outliers (Bishop and Nasrabadi, 2006; Ma et al., 2018). Furthermore, GBRT is able to capture the complicated and nonlinear relationships between TCs intensity change and other related features. Compared with a single decision tree, GBRT pays more attention to the regression errors with less calculation time for high-dimension data (Xie and Coggeshall, 2010; Ding et al., 2016; Yang et al., 2016; Ma et al., 2017; Ma et al., 2018). Therefore, GBRT is used in this study to predict the future change of TCs intensity in the Western North Pacific Ocean.
Most of the studies mainly focused on TCs intensity change over the open ocean. However, TCs that make landfall or approach the coast usually cause most of the loss of life and damage. Forecasting the intensity of TCs near the coast and over land should be, therefore, more critical than forecasting TCs intensity over the open ocean (Li et al., 2018). Li et al. (2018) explored the TCs intensity change over the entire TCs life span by considering a new factor, the “ratio of seawater area to the land area,” in the multiple linear regression model (MLR). However, MLR usually performs poorly in handling the nonlinear relationship between predictors and predictand. In this study, the GBRT is proposed to forecast future TCs intensity at 12-, 24-, 36-, 48-, 60-, and 72-h forecasting lead time in the Western North Pacific region for different TCs life spans. GBRT’s performance in predicting TCs intensity change over the Western North Pacific is compared with the performance of the MLR model used by Li et al. (2018). The remaining of the paper is as follows. The data and methodology are described in Section 2. Section 3 contains the results and discussion. In the final section, summaries are presented.
At present, there is no standardized TCs intensity estimation method, and the most widely used methods are artificial algorithms based on satellite cloud images; therefore, there is uncertainty about TCs intensity values (Jiang et al., 2019; Lee et al., 2019). To account for the uncertainty, this study used two different TCs datasets: the best track data from the Shanghai Typhoon Institute (STI, 2020) and the best track data from the Joint Typhoon Warning Center (JTWC, 2020) for the period of 2000–2019 in the Western North Pacific region, covering the area with latitude north of 0°N and longitude west of 180°. It is worth noting that for TCs that affect China, STI data might have more advantages than JTWC, as there are more direct observations for those TCs in China (Ren et al., 2011).
The best track datasets include the TCs time (year, month, day, hour), location (latitude and longitude of the TCs center), TCs central pressure, and the maximum sustained wind speed near the TCs center. Figure 1 shows the tracks of the TCs in the Western North Pacific from 2000 to 2019 based on the data from STI. In addition to the TCs data, synoptic variables, climatological and persistent variables are derived from the reanalysis data obtained from the National Centers for Environmental Prediction (NCEP, 2020) at 6-h temporal and 1° × 1° spatial resolution. The NCEP FNL (Final) Operational Global analysis data has incorporated the most complete set of observational data and is possibly the best choice for a long-term operational model archive from NCEP (NCEP, 2020). The analyses are available at the surface and 26 mandatory levels from 1,000 to 10 hpa. Furthermore, this study applies global daily means of SST provided by the National Oceanic and Atmospheric Administration (NOAA, 2020), as warm seawater is the energy source for TCs. The data from 2000 to 2019 are divided into four groups according to five consecutive years (i.e., 2000–2004 is a group; 2005–2009 is another group). We use one group as the test set and the other three groups as the training set to build the prediction model and perform cross-validation.
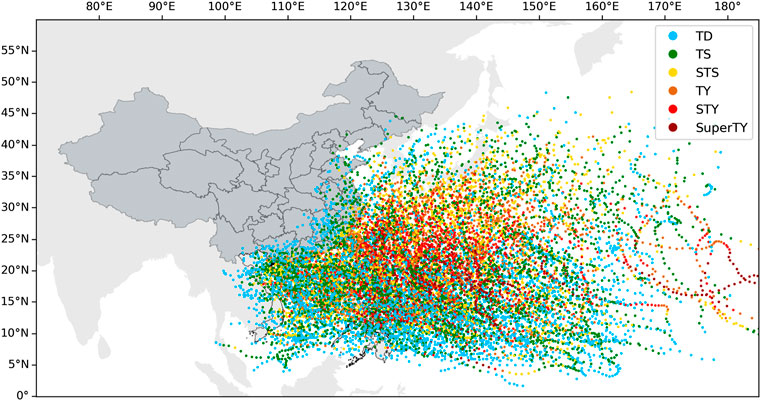
FIGURE 1. Tracks of the TCs in the Western North Pacific from 2000 to 2019 based on the best track data from STI at 6-h interval.
In this study, the Gradient Boosted Regression Tree (GBRT) model is applied to predict the TCs intensity change over the entire TCs life span. The GBRT model is popular for its ability to describe the complicated relationships between input and output data and the explanation of input features (Yang et al., 2020). It enhances the traditional decision tree approach by boosting technology (Friedman, 2001; Friedman, 2002). In boosting, base learners are built sequentially, and each base learner tries to reduce the bias of the previous combined learner (Yang et al., 2020). This approach can combine multiple weak models to make the ensemble model more powerful (Zhou et al., 2021). One of the core ideas of GBRT is to use the value of the negative gradient of the loss function in the current model as an approximation of the residual, which is essentially a first-order Taylor expansion of the loss function to fit a regression tree. Besides, the samples in the training set with the largest residuals are weighted the most heavily in GBRT (Schapire, 2003), encouraging the model to improve its worst predictions (McGovern et al., 2019). In addition, the importance of each input variable can be ranked in GBRT model.
The GBRT is additive models, which can be expressed as the following form:
where the
Then the GBRT learners are updated continuously, similar to other boosting algorithms.
where the newly added tree
Bayesian optimization is a very effective global optimization algorithm whose goal is to find the global optimal solution, which is a kind of black-box function without assuming any function form (Brochu et al., 2010; Snoek et al., 2012). As ML models are widely used to process large amounts of data, the space and process required for hyperparametric tuning become more and more complex. Nowadays, people prefer Bayesian optimization parameter tuning which has been shown to lead to high model performance after the convenient and efficient tuning (Swersky et al., 2013). The corresponding algorithm for the Bayesian optimization is as follow:
Suppose we have a function
where X is a set of hyperparameters, and
The 26 potential predictors used in the MLR model by Li et al. (2018) are also applied for the GBRT model in this study, which are listed in Table 1. All synoptic variables are generally averaged from the corresponding data within a specific radius of the TCs center, usually within a ring with an outer diameter of 800 km and an inner diameter of 200 km. Note that SST is calculated as the average value of the data with a radius of 800 km. The maximum potential intensity (MPI) and TCs potential future intensity change (POT) are calculated by SST. Following Li et al. (2018), the life spans of TCs are divided into the samples over the open ocean, near the coast, and over land according to the values of SL ratio with the range of SL ratio > 0.99, 0.5 < SL ratio < 0.99, SL ratio < 0.5, respectively, which are computed within the radius of 500 km around the TCs center. The numbers of TC samples over the open ocean, near the coast, and over land, as well as the total TC samples (all TC samples without categorization), for the TCs intensity change prediction models with 12-, 24-, 36-, 48-, 60-, and 72-h forecasting lead time are shown in Table 2.
The performance of the forecasting models for the testing periods are evaluated in terms of the statistical properties of coefficient of determination (commonly known as R2), mean absolute error (MAE) and root mean square error (RMSE).
For the TCs intensity prediction models, the dependent variables are the TCs intensity changes for the future 12-h, 24-h, to 60-h, and 72-h, and the potential predictors are listed in Table 1. Because TCs usually decay quickly after their landfall, this study only considers TCs intensity changes within 24 h (including 12-h and 24-h) after landfall. Figures 2, 3 show the importance of the variables in the prediction models with different lead times over the open ocean, near the coast, over land, as well as the all TC samples, based on the STI and the JTWC datasets, respectively. As can be seen from Figures 2, 3, the feature importance of variables varies for the STI and JTWC datasets with different prediction periods, and the six most important variables for each prediction period have accounted for more than 80% of the total feature importance for the prediction models.
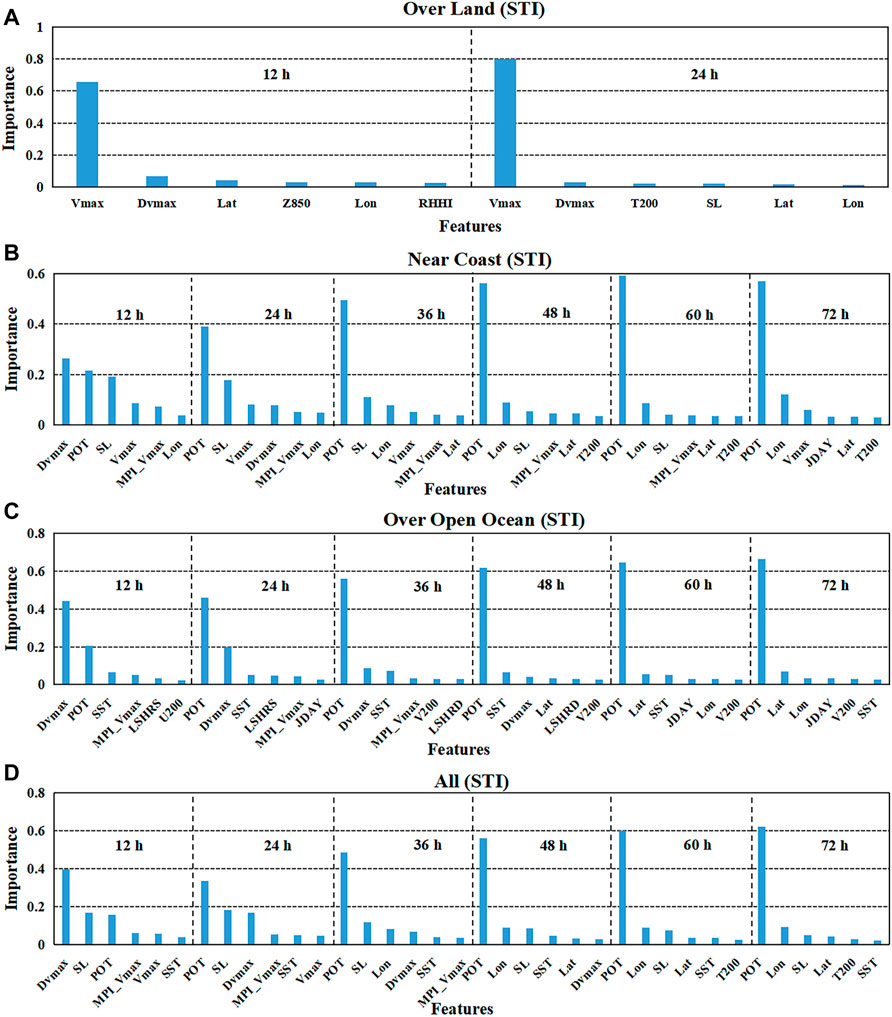
FIGURE 2. Selection results of the significant variables for TCs intensity prediction models for the STI datasets by the GBRT method. The vertical axis represents the percentage of the feature importance of the variable in the corresponding prediction model, and the horizontal axis refers to the predictor variable. Only the six most important variables are displayed for each lead time forecasting model. (A) for TC samples over land; (B) for TC samples near the coast; (C) for TC samples over the open ocean; (D) for all TC samples.
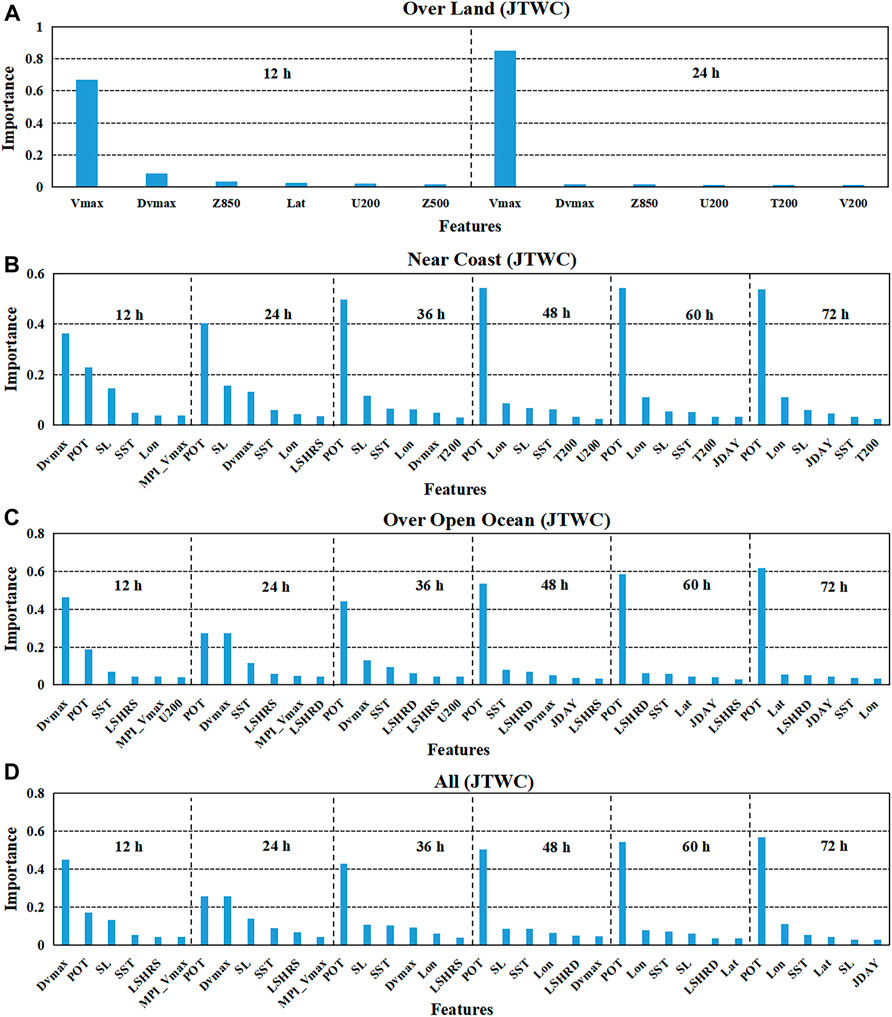
FIGURE 3. Selection results of the significant variables for TCs intensity prediction models for the JTWC datasets by the GBRT method. The vertical axis represents the percentage of the feature importance of the variable in the corresponding prediction model, and the horizontal axis refers to the predictor variable. Only the six most important variables are displayed for each lead time forecasting model. (A) for TC samples over land; (B) for TC samples near the coast; (C) for TC samples over the open ocean; (D) for all TC samples.
Figures 2, 3 show that POT plays the most crucial role in TCs intensity change for TCs over the open ocean (Figures 2C, 3C) and near the coast (Figures 2B, 3B), as well as all TC samples (Figures 2D, 3D). The importance of POT is generally increasing with the forecasting lead time. Besides POT, SST is also essential for TCs intensity change for TCs over the open ocean and near the coast, especially based on the JTWC datasets. Dvmax is an important factor affecting TCs intensity change for TCs over the open ocean and near the coast, as well as all TC samples, for short forecasting lead time, i.e., 12 h and 24 h. Dvmax is no longer an important factor for TCs intensity changes when the forecasting lead time is longer than 24 h for TCs near the coast and the forecasting lead time is longer than 48 h for TCs over the ocean. It is reported that vertical wind shear is one of the most critical dynamic parameters influencing TCs intensity change (DeMaria and Kaplan, 1999; DeMaria et al., 2005; Zeng et al., 2010; Wang et al., 2015). In the GBRT model, vertical wind shear variables of LSHRS and LSHRD play important roles in affecting the TCs intensity when TCs are over the open ocean; however, vertical wind shear is not important for TCs intensity change when TCs are near the coast.
It can be seen from Figures 2B, 3B, SL ratio is a crucial variable affecting TCs intensity change when TCs are near the coast. Different from the MLR model used by Li et al. (2018), SL ratio is not an important predictor for the future 12-h TCs’ intensity change after TCs landfall. For TCs after landfall, the significant predictors are Vmax and Dvmax, and the importance of Vmax reaches 0.65–0.85 (Figures 2A, 3A).
As described in Section 2, we divide the 2000–2019 data into four groups, i.e., 2000–2004, 2005–2009, 2010–2014, 2015–2019. We use any three groups as the training datasets, and the remaining one as the test datasets to build the prediction model and perform cross validation. We evaluate the GBRT model’s performance in predicting the TCs future intensity changes for TCs over land, near the coast, and over the open ocean, as well as all TC samples in terms of R2, MAE, and RMSE. Figures 4, 5 show the evaluation results of the prediction models’ performance with the four cross validations by boxplots based on STI data and JTWC data, respectively.
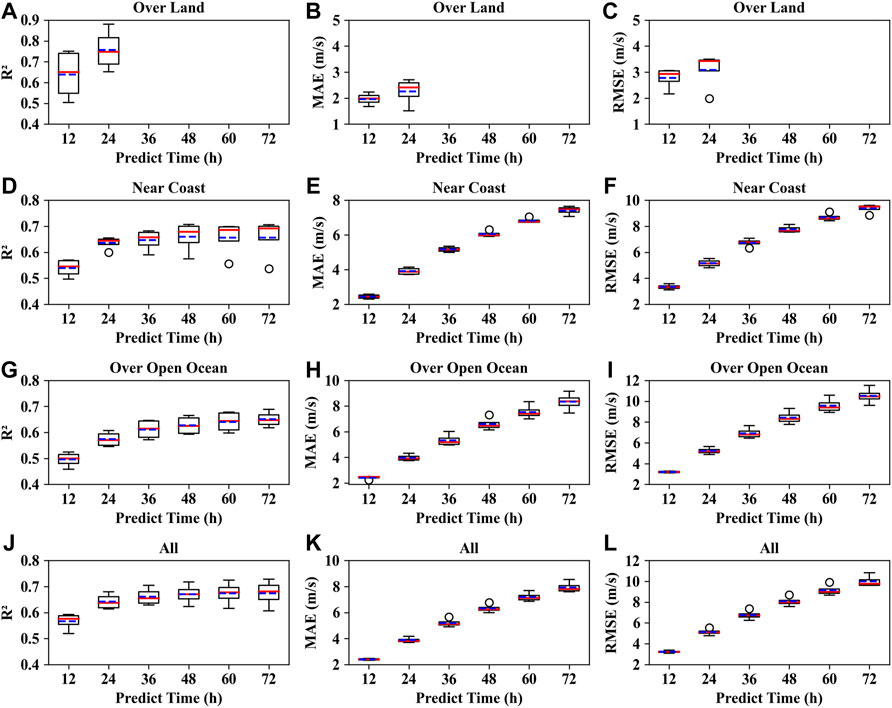
FIGURE 4. Evaluation of the performance of the GBRT model in predicting the TCs future 12-h, 24-h, 36-h, 48-h, 60-h, and 72-h intensity changes with four cross validations in terms of R2 (the first column), MAE (the second column), and RMSE (the third column) based on the STI TCs best track data. (A–C) for TC samples over land; (D–F) for TC samples near the coast; (G–I) for TC samples over the open ocean; (J–L) for all TC samples.
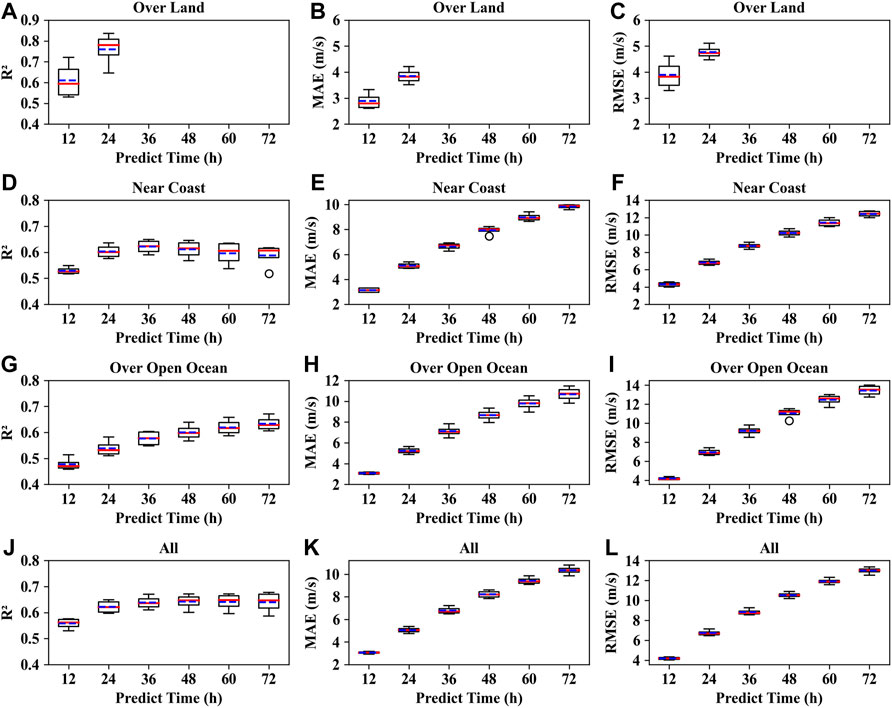
FIGURE 5. Evaluation of the performance of the GBRT model in predicting the TCs future 12, 24, 36, 48, 60, and 72-h intensity changes with four cross validations in terms of R2 (the first column), MAE (the second column), and RMSE (the third column) based on the JTWC TCs best track data. (A–C) for TC samples over land; (D–F) for TC samples near the coast; (G–I) for TC samples over the open ocean; (J–L) for all TC samples.
It can be seen from Figures 4, 5 that the R2 value will generally increase with the forecasting lead time. For the GBRT model based on all TC samples, the median and mean of R2 values are 0.58 (0.56) and 0.57 (0.56) by the 12-h lead time forecast and are 0.68 (0.65) and 0.67 (0.64) by the 72-h lead time forecast based on STI (JTWC) datasets. MAE and RMSE also increase with the forecasting lead time. For all sample models of STI (JTWC) data, the MAE median and mean values are approximately 2.39 (3.08) and 2.40 (3.06) ms−1 by the 12-h lead time forecast and are 7.79 (10.35) and 7.93 (10.29) ms−1 by the 72-h lead time forecast. The RMSE median and mean values are 3.23 (4.19) and 3.24 (4.20) ms−1 by the 12-h lead time forecast and are approximately 9.75 (12.99) and 9.98 (12.94) ms−1 by the 72-h lead time forecast. From the comparison of the statistical properties, the quality of the best track data from STI might be slightly better than the one from JTWC.
Specifically, for the GBRT model for TCs over land, the median and mean of R2 are 0.65 (0.61) and 0.64 (0.62) by the 12-h lead time forecast, and are 0.75 (0.74) and 0.76 (0.76) by the 24-h lead time forecast based on STI (JTWC) datasets. The median and mean of MAE are 1.98 (2.81) and 1.96 (2.88) ms−1 by the 12-h lead time forecast, and are 2.4 (3.82) and 2.26 (3.84) ms−1 by the 24-h lead time forecast based on STI (JTWC) datasets. The median and mean of RMSE are 2.93 (3.83) and 2.77 (3.89) ms−1 by the 12-h lead time forecast, and are 3.42 (4.74) and 3.08 (4.76) ms−1 by the 24-h lead time forecast based on STI (JTWC) datasets. Again, from the comparison of the statistical properties, the quality of the STI best track data is slightly better than the JTWC best track data. The MAE and RMSE for TC samples over land are less than those values for TCs near the coast and TCs over the open ocean. The reason may be that TCs intensity will usually decay quickly after landfall, and the number of essential variables that affect the TCs intensity change after landfall is less than the number of essential variables when TCs are near the coast and over the open ocean. Therefore, the TCs intensity changing process after landfall is not as complicated as the processes for TCs near the coast and over the open ocean. And consequently, the performance of TCs intensity forecast after landfall is generally better.
As described in Section 2, We use the Bayesian optimization algorithm to tune the hyperparameters of the GBRT model to improve the accuracy of the prediction model. The prediction results of the GBRT model with default hyperparameters are compared with the performance of the GBRT model with Bayesian optimization. The historical data from 2000 to 2014 are used for model training, and the data from 2015 to 2019 are used for model testing. The performance of the two prediction models is evaluated by the statistical properties of R2, MAE, and RMSE. Figures 6, 7 show the performance comparison based on STI and JTWC datase-ts, respectively.
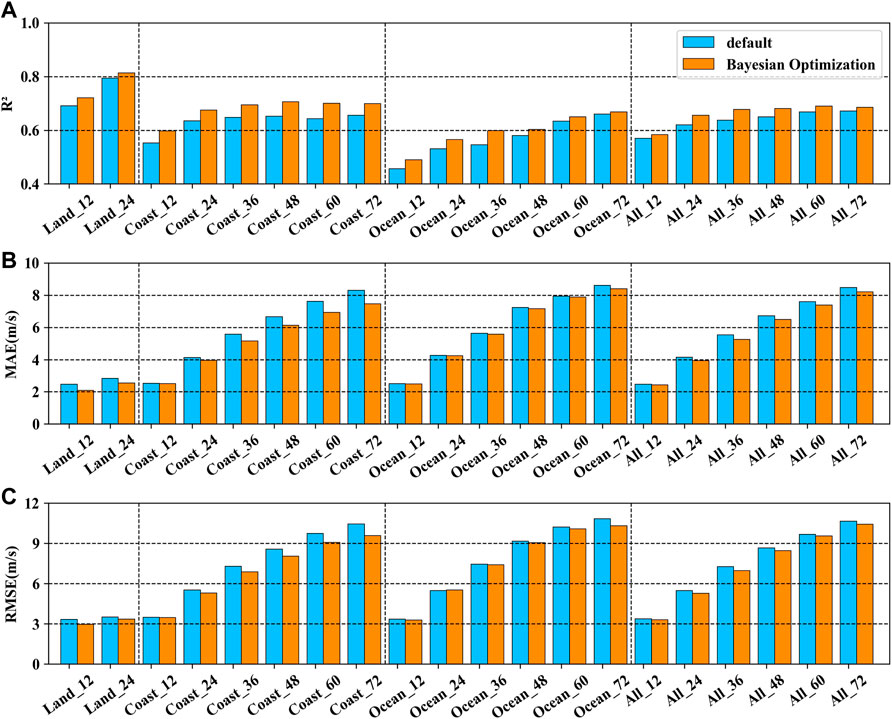
FIGURE 6. Performance comparison between the GBRT model with the default hyperparameters and Bayesian optimized GBRT model in terms of (A) R2, (B) MAE, and (C) RMSE for TCs intensity change prediction based on the STI data. The labels of Land, Coast, Ocean, and All in the figures refer to TC samples over land, near the coast, over the open ocean, and all TC samples, respectively.
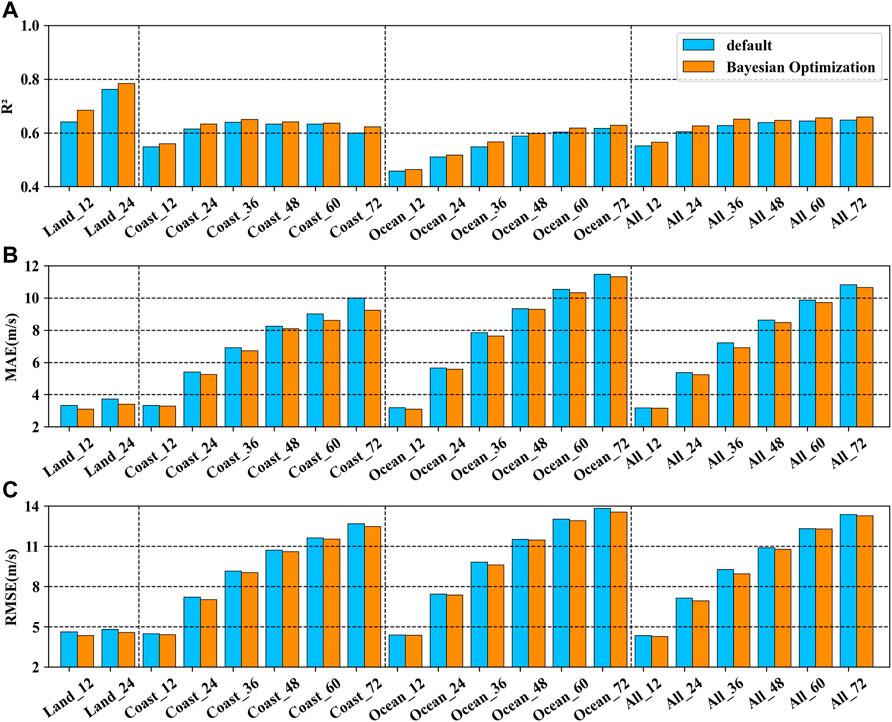
FIGURE 7. Performance comparison between the GBRT model with the default hyperparameters and Bayesian optimized GBRT model in terms of (A) R2, (B) MAE, and (C) RMSE for TCs intensity change prediction based on the JTWC data. The labels of Land, Coast, Ocean, and All in the figures refer to TC samples over land, near the coast, over the open ocean, and all TC samples, respectively.
In the figures, it can be seen that the performance of the Bayesian optimized GBRT model for the TCs over land, near the coast, over the open ocean, and for all TC samples is generally better than the performance of the model with default hyperparameters. For STI data and JTWC data, after Bayesian optimization for the prediction model, R2 will increase by an average of 3.37% and 3.26%. MAE (RMSE) will decrease by an average of 3.22% (2.62%) and 3.82% (3.71%).
The performance of the GBRT model is compared with that of the MLR model (Li et al., 2018) during the testing period to forecast TCs intensity over the entire TCs life span in the Western North Pacific. Li et al. (2018) used historical data from 2000 to 2011 for model calibration and data from 2012 to 2015 for model validation. To ensure a fair comparison, the same training datasets and testing datasets are selected in the GBRT model. Similarly, the performance of the different prediction models is evaluated in terms of R2, MAE, and RMSE.
Figures 8, 9 show the performance comparison results based on STI and JTWC datasets, respectively. It can be seen from the two figures that the GBRT model outperforms the MLR model in TCs intensity forecast for both datasets. Compared with the performance of the MLR model, R2 of the GBRT model increases by an average of 8.47% and 4.45% for STI data and JTWC data, respectively. MAE (RMSE) drops by an average of 26.24% (25.14%) and 10.51% (4.68%) for the two datasets, respectively.
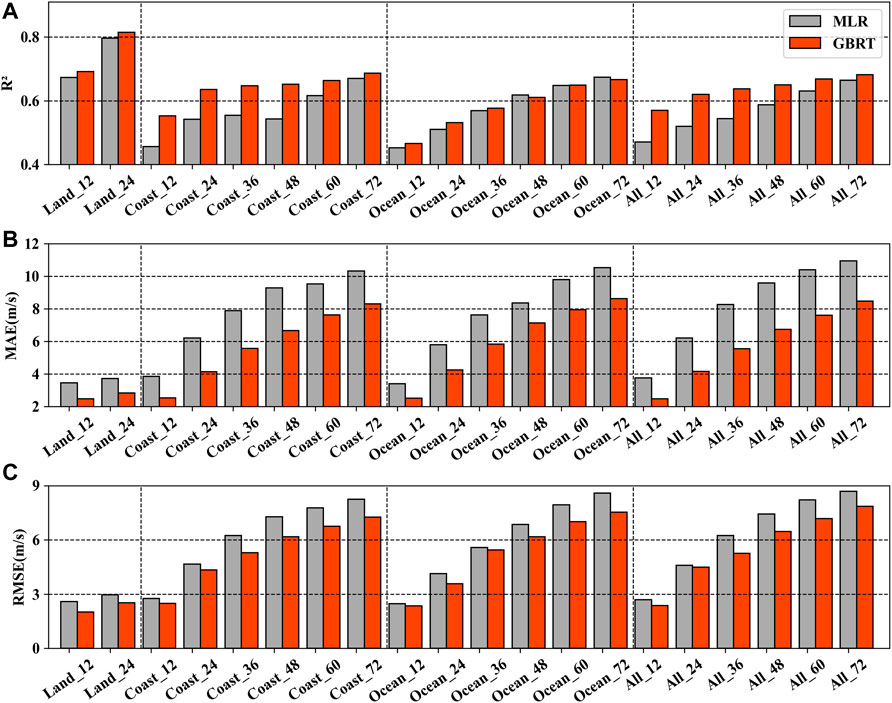
FIGURE 8. Performance comparisons between the MLR model and GBRT model in terms of (A) R2, (B) MAE, and (C) RMSE for the TCs intensity change prediction based on the STI data from 2000 to 2015. The Land, Coast, Ocean, and All from the x-axis labels refer to TCs over land, near the coast, over the open ocean, and all TC samples, respectively.
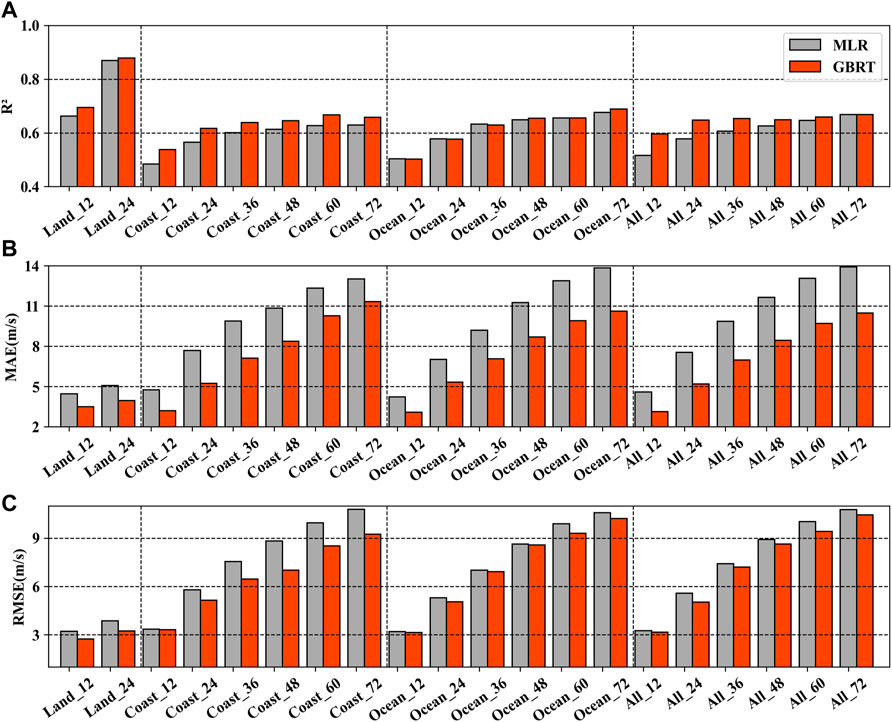
FIGURE 9. Performance comparisons between the MLR model and GBRT model in terms of (A) R2, (B) MAE, and (C) RMSE for the TCs intensity change prediction based on the JTWC data from 2000 to 2015. The Land, Coast, Ocean, and All from the x-axis labels refer to TCs over land, near the coast, over the open ocean, and all TC samples, respectively.
In order to further evaluate the performance of the GBRT prediction model, we apply the model to predict the intensity variation for two TC cases in the Western North Pacific, Soudelor (201513) and Mangkhut (201822), which have long life spans and have impacted China significantly. We use historical data from 2000 to 2014 to train the GBRT model. The trained GBRT model is then used to predict the intensity changes for Soudelor and Mangkhut, respectively. The TCs intensity prediction results are compared with the corresponding values from the best track data. The time series of the TCs intensity of Soudelor and Mangkhut from the two best tack data and the GBRT prediction by the 12-h and 24-h lead time forecast are compared in Figure 10. Figure 10A shows the tracks of these two TCs, which have experienced all three processes: over the open ocean, near the coast, and over land. The different colors in Figure 10A represent the different TCs intensity levels.
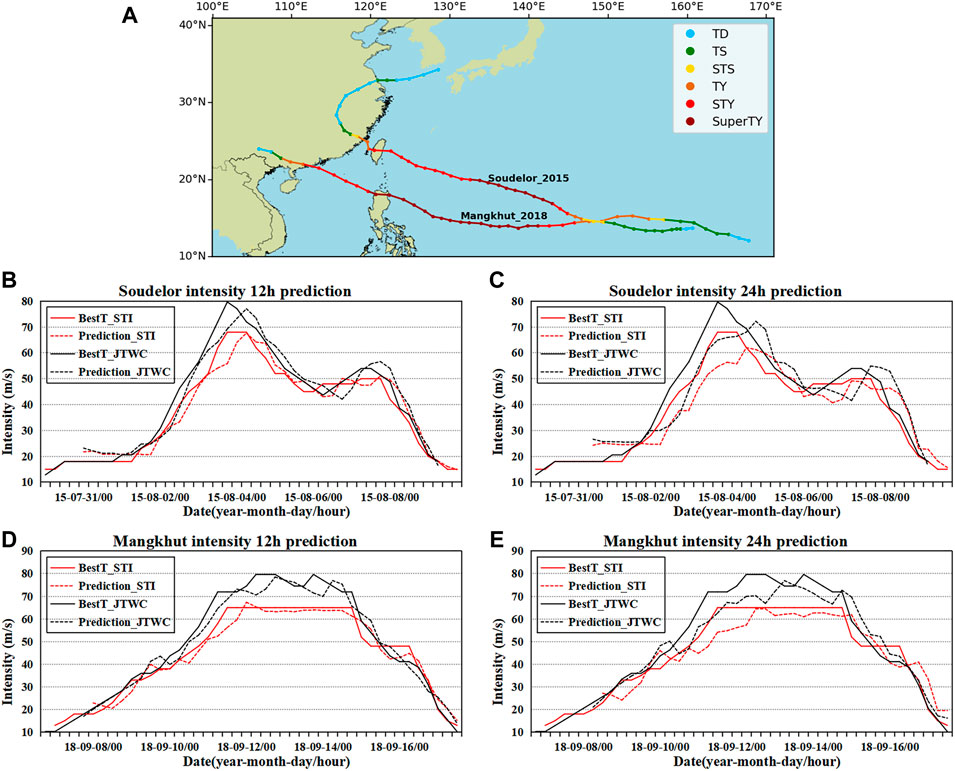
FIGURE 10. (A) The tracks of Soudelor (201513) and Mangkhut (201822) based on the STI best track data; the comparison of the time series of Soudelor’s intensity values from the STI and JTWC best track data and the intensity prediction by the GBRT model by (B) 12-h and (C) 24-h lead time forecasts, respectively; the comparison of the time series of Mangkhut’s intensity values from the STI and JTWC best track data and the intensity prediction by the GBRT model by (D) 12-h and (E) 24-h lead time forecasts, respectively.
Figures 10B,C show the comparison between the time series of Soudelor’s intensity prediction by the GBRT model with 12-h and 24-h forecasting lead time, and the corresponding TCs intensity values from the STI and JTWC best track data. The solid lines refer to the TCs intensity values from the best track data, and the dashed lines refer to the intensity forecast by the GBRT model. The red color indicates the comparison based on the STI data, and the black color indicates the comparison based on the JTWC data. Figures 10D,E show similar comparisons as Figures 10B,C, but for TCs Mangkhut. From the figures, it can be seen that the prediction model can generally capture the TCs intensity variation by 12-h and 24-h lead time forecast. However, when the TCs experience rapid intensification, the models’ performance is not satisfactory.
Based on the TCs best track datasets from STI and JTWC from 2000 to 2019, this study proposes TCs intensity prediction models by the GBRT method. Using the index of SL ratio, TCs data are grouped into four parts: TC samples over the open ocean, near the coast, over land, and all TC samples. The future TCs intensity changes of 12 h, 24 h, 36 h, 48 h, 60 h, and 72 h are the model predictands, which are obtained from the best track datasets. Synoptic variables, climatological and persistent variables, which are derived from the NCEP reanalysis data and the SST data from NOAA, are used for the model predictors. Unlike the MLR model, the GBRT model can describe well the nonlinear relationship between predictors and predictands. Compared with the MLR model, R2 of the GBRT model for TCs intensity forecast increases by an average of 8.47% and 4.45% for STI data and JTWC data, respectively. MAE (RMSE) drops by an average of 26.24% (25.14%) and 10.51% (4.68%) for the two datasets. By comparing the statistical properties for the prediction models based on different datasets, the quality of the TCs best track data over the Western North Pacific from STI might be slightly better than that from JTWC.
According to the feature importance of the GBRT model, for TCs after landfall, the significant predictors are Vmax and Dvmax. Dvmax plays the most crucial role in TCs intensity change for TCs over the open ocean and near the coast, as well as for all TC samples when the forecasting lead time is 12 h. And POT is essential for TCs intensity change when the forecasting lead time is more than 24 h. Besides, SL ratio is an important variable affecting TCs intensity change when TCs are near the coast and for all TC samples when the forecasting lead time is 24–36 h.
In addition, we use the Bayesian optimization algorithm to tune the hyperparameters of the GBRT model to improve the accuracy of the prediction model. For the prediction performance based on the STI data and JTWC data, the R2 value increases by approximately 3.37% and 3.26% on average. The MAE (RMSE) decreases by an average of 3.22% (2.62%) and 3.82% (3.71%).
Overall, the GBRT model can describe well the complex nonlinear relationship between predictors and TCs intensity change and improves the performance of the intensity prediction of the TCs throughout their life span, compared with the MLR model. Therefore, the GBRT prediction model is practically valuable, and can be referred to for operational TCs intensity forecast.
The original contributions presented in the study are included in the article/supplementary material, further inquiries can be directed to the corresponding author.
Conceptualization: QL and GZ; Data collection and analysis: GZ and QL; Methodology: QL, GZ, and WZ; Writing original draft: GZ and QL. All the co-authors participated the manuscript review and editing.
This research is funded by the Science and Technology Department of Guangdong Province (grant 2019B111101002) and the Innovation of Science and Technology Commission of Shenzhen Municipality Ministry with Grant JCYJ20210324101006016.
The authors declare that the research was conducted in the absence of any commercial or financial relationships that could be construed as a potential conflict of interest.
All claims expressed in this article are solely those of the authors and do not necessarily represent those of their affiliated organizations, or those of the publisher, the editors and the reviewers. Any product that may be evaluated in this article, or claim that may be made by its manufacturer, is not guaranteed or endorsed by the publisher.
Behrangi, A., Hsu, K.-l., Imam, B., Sorooshian, S., Huffman, G. J., and Kuligowski, R. J. (2009). PERSIANN-MSA: A Precipitation Estimation Method from Satellite-Based Multispectral Analysis. J. Hydrometeorol. 10 (6), 1414–1429. doi:10.1175/2009JHM1139.1
Bishop, C. M., and Nasrabadi, N. M. (2006). Pattern Recognition and Machine Learning. New York: Springer, 695.
Brochu, E., Brochu, T., and De Freitas, N. (2010). “A Bayesian Interactive Optimization Approach to Procedural Animation Design,” in Proceedings of the 2010 ACM SIGGRAPH/Eurographics Symposium on Computer Animation, Madrid, Spain, July 2–4, 2010, 103–112. doi:10.2312/SCA/SCA10/103-112
Chen, R., Zhang, W., and Wang, X. (2020). Machine Learning in Tropical Cyclone Forecast Modeling: A Review. Atmosphere 11 (7), 676. doi:10.3390/atmos11070676
Cloud, K. A., Reich, B. J., Rozoff, C. M., Alessandrini, S., Lewis, W. E., and Delle Monache, L. (2019). A Feed Forward Neural Network Based on Model Output Statistics for Short-Term Hurricane Intensity Prediction. Wea. Forecast. 34 (4), 985–997. doi:10.1175/WAF-D-18-0173.1
DeMaria, M., and Kaplan, J. (1994a). A Statistical Hurricane Intensity Prediction Scheme (SHIPS) for the Atlantic Basin. Wea. Forecast. 9 (2), 209–220. doi:10.1175/1520-0434(1994)009<0209:aships>2.0.co;2
DeMaria, M., and Kaplan, J. (1999). An Updated Statistical Hurricane Intensity Prediction Scheme (SHIPS) for the Atlantic and Eastern North Pacific Basins. Wea. Forecast. 14 (3), 326–337. doi:10.1175/1520-0434(1999)014<0326:auship>2.0.co;2
DeMaria, M., and Kaplan, J. (1994b). Sea Surface Temperature and the Maximum Intensity of Atlantic Tropical Cyclones. J. Clim. 7 (9), 1324–1334. doi:10.1175/1520-0442(1994)007<1324:sstatm>2.0.co;2
DeMaria, M., Mainelli, M., Shay, L. K., Knaff, J. A., and Kaplan, J. (2005). Further Improvements to the Statistical Hurricane Intensity Prediction Scheme (SHIPS). Wea. Forecast. 20 (4), 531–543. doi:10.1175/WAF862.1
DeMaria, M., Sampson, C. R., Knaff, J. A., and Musgrave, K. D. (2014). Is Tropical Cyclone Intensity Guidance Improving? Bull. Am. Meteorol. Soc. 95 (3), 387–398. doi:10.1175/BAMS-D-12-00240.1
DeMaria, M. (1996). The Effect of Vertical Shear on Tropical Cyclone Intensity Change. J. Atmos. Sci. 53 (14), 2076–2088. doi:10.1175/1520-0469(1996)053<2076:teovso>2.0.co;2
Ding, C., Wang, D., Ma, X., and Li, H. (2016). Predicting Short-Term Subway Ridership and Prioritizing its Influential Factors Using Gradient Boosting Decision Trees. Sustainability 8 (11), 1100. doi:10.3390/su8111100
Elsberry, R. L., Chen, L., Davidson, J., Rogers, R., Wang, Y., and Wu, L. (2013). Advances in Understanding and Forecasting Rapidly Changing Phenomena in Tropical Cyclones. Trop. Cyclone Res. Rev. 2 (1), 13–24. doi:10.6057/2013TCRR01.02
Emanuel, K. (2018). 100 Years of Progress in Tropical Cyclone Research. Meteorol. Monogr. 59, 1–15. doi:10.1175/AMSMONOGRAPHS-D-18-0016.1
Emanuel, K., and Zhang, F. (2016). On the Predictability and Error Sources of Tropical Cyclone Intensity Forecasts. J. Atmos. Sci. 73 (9), 3739–3747. doi:10.1175/JAS-D-16-0100.1
Fayyad, U., and Stolorz, P. (1997). Data Mining and KDD: Promise and Challenges. Future Gener. Comput. Syst. 13 (2-3), 99–115. doi:10.1016/S0167-739X(97)00015-0
Fraedrich, K., Raible, C. C., and Sielmann, F. (2003). Analog Ensemble Forecasts of Tropical Cyclone Tracks in the Australian Region. Wea. Forecast. 18 (1), 3–11. doi:10.1175/1520-0434(2003)018<0003:aefotc>2.0.co;2
Friedman, J. H. (2001). Greedy Function Approximation: A Gradient Boosting Machine. Ann. Statistics 29 (5), 1189–1232. Available at: https://www.jstor.org/stable/2699986. doi:10.1214/aos/1013203451
Friedman, J. H. (2002). Stochastic Gradient Boosting. Comput. Stat. Data Anal. 38 (4), 367–378. doi:10.1016/s0167-9473(01)00065-2
Gao, S., and Chiu, L. S. (2012). Development of Statistical Typhoon Intensity Prediction: Application to Satellite-Observed Surface Evaporation and Rain Rate (STIPER). Wea. Forecast. 27 (1), 240–250. doi:10.1175/WAF-D-11-00034.1
Gao, S., Zhang, W., Liu, J., Lin, I.-I., Chiu, L. S., and Cao, K. (2016). Improvements in Typhoon Intensity Change Classification by Incorporating an Ocean Coupling Potential Intensity Index into Decision Trees. Wea. Forecast. 31 (1), 95–106. doi:10.1175/WAF-D-15-0062.1
Ge, X., Li, T., and Peng, M. (2013). Effects of Vertical Shears and Midlevel Dry Air on Tropical Cyclone Developments. J. Atmos. Sci. 70 (12), 3859–3875. doi:10.1175/JAS-D-13-066.1
Griffin, S. M., Otkin, J. A., Rozoff, C. M., Sieglaff, J. M., Cronce, L. M., and Alexander, C. R. (2017). Methods for Comparing Simulated and Observed Satellite Infrared Brightness Temperatures and What Do They Tell Us? Wea. Forecast. 32 (1), 5–25. doi:10.1175/WAF-D-16-0098.1
Jarvinen, B. R., and Neumann, C. J. (1979). Statistical Forecasts of Tropical Cyclone Intensity for the North Atlantic Basin. NOAA Tech. Memo. NWS NHC-10, 22.
Jiang, H., Tao, C., and Pei, Y. (2019). Estimation of Tropical Cyclone Intensity in the North Atlantic and Northeastern Pacific Basins Using TRMM Satellite Passive Microwave Observations. J. Appl. Meteorol. Climatol. 58 (2), 185–197. doi:10.1175/JAMC-D-18-0094.1
Jin, Q., Fan, X., Liu, J., Xue, Z., and Jian, H. (2020). Estimating Tropical Cyclone Intensity in the South China Sea Using the XGBoost Model and FengYun Satellite Images. Atmosphere 11 (4), 423. doi:10.3390/atmos11040423
JTWC (2020). Western North Pacific Ocean Best Track Data. Available at: http://www.metoc.navy.mil/jtwc/jtwc.html?western-pacifific (Accessed August 20, 2020).
Jun, S., Kang, N.-Y., Lee, W., and Chun, Y. (2017). An Alternative Multi-Model Ensemble Forecast for Tropical Cyclone Tracks in the Western North Pacific. Atmosphere 8 (9), 174. doi:10.3390/atmos8090174
Kaplan, J., DeMaria, M., and Knaff, J. A. (2010). A Revised Tropical Cyclone Rapid Intensification Index for the Atlantic and Eastern North Pacific Basins. Wea. Forecast. 25 (1), 220–241. doi:10.1175/2009WAF2222280.1
Knaff, J. A., Sampson, C. R., and DeMaria, M. (2005). An Operational Statistical Typhoon Intensity Prediction Scheme for the Western North Pacific. Wea. Forecast. 20 (4), 688–699. doi:10.1175/WAF863.1
Langmack, H., Fraedrich, K., and Sielmann, F. (2012). Tropical Cyclone Track Analog Ensemble Forecasting in the Extended Australian Basin: NWP Combinations. Q. J. R. Meteorol. Soc. 138 (668), 1828–1838. doi:10.1002/qj.1915
Lee, J., Im, J., Cha, D.-H., Park, H., and Sim, S. (2019). Tropical Cyclone Intensity Estimation Using Multi-Dimensional Convolutional Neural Networks from Geostationary Satellite Data. Remote Sens. 12 (1), 108. doi:10.3390/rs12010108
Li, Q., Li, Z., Peng, Y., Wang, X., Li, L., Lan, H., et al. (2018). Statistical Regression Scheme for Intensity Prediction of Tropical Cyclones in the Northwestern Pacific. Wea. Forecast. 33 (5), 1299–1315. doi:10.1175/WAF-D-18-0001.1
Lin, I.-I., Chen, C.-H., Pun, I.-F., Liu, W. T., and Wu, C.-C. (2009). Warm Ocean Anomaly, Air Sea Fluxes, and the Rapid Intensification of Tropical Cyclone Nargis (2008). Geophys. Res. Lett. 36 (L03817), 1–5. doi:10.1029/2008GL035815
Ma, L., Zhang, G., and Lu, E. (2018). Using the Gradient Boosting Decision Tree to Improve the Delineation of Hourly Rain Areas during the Summer from Advanced Himawari Imager Data. J. Hydrometeorol. 19 (5), 761–776. doi:10.1175/JHM-D-17-0109.1
Ma, X., Ding, C., Luan, S., Wang, Y., and Wang, Y. (2017). Prioritizing Influential Factors for Freeway Incident Clearance Time Prediction Using the Gradient Boosting Decision Trees Method. IEEE Trans. Intell. Transp. Syst. 18 (9), 2303–2310. doi:10.1109/TITS.2016.2635719
Mas, J. F., and Flores, J. J. (2008). The Application of Artificial Neural Networks to the Analysis of Remotely Sensed Data. Int. J. Remote Sens. 29 (3), 617–663. doi:10.1080/01431160701352154
McGovern, A., Karstens, C. D., Smith, T., and Lagerquist, R. (2019). Quasi-Operational Testing of Real-Time Storm-Longevity Prediction via Machine Learning. Wea. Forecast. 34 (5), 1437–1451. doi:10.1175/WAF-D-18-0141.1
Mercer, A., and Grimes, A. (2017). Atlantic Tropical Cyclone Rapid Intensification Probabilistic Forecasts from an Ensemble of Machine Learning Methods. Procedia Comput. Sci. 114, 333–340. doi:10.1016/j.procs.2017.09.036
Mountrakis, G., Im, J., and Ogole, C. (2011). Support Vector Machines in Remote Sensing: A Review. ISPRS J. Photogramm. Remote Sens. 66 (3), 247–259. doi:10.1016/j.isprsjprs.2010.11.001
NCEP (2020). National Center for Atmospheric Research, Computational and Information Systems Laboratory. Available at: https://rda.ucar.edu/datasets/ds083.2/#! (Accessed August 21, 2020).
NOAA (2020). NOAA Optimum Interpolation (OI) Sea Surface Temperature (SST) V2. Available at: https://psl.noaa.gov/data/gridded/data.noaa.oisst.v2.highres.html (Accessed August 25, 2020).
Pan, B., Xu, X., and Shi, Z. (2019). Tropical Cyclone Intensity Prediction Based on Recurrent Neural Networks. Electron. Lett. 55 (7), 413–415. doi:10.1049/el.2018.8178
Quinlan, J. R. (1987). “Decision Trees as Probabilistic Classifiers,” in Proceedings of the Fourth International Workshop on Machine Learning, Irvine, CA, June 22–25, 1987, 31–37. doi:10.1016/B978-0-934613-41-5.50007-6
Ren, F., Liang, J., Wu, G., Dong, W., and Yang, X. (2011). Reliability Analysis of Climate Change of Tropical Cyclone Activity over the Western North Pacific. J. Clim. 24 (22), 5887–5898. doi:10.1175/2011JCLI3996.1
Sandery, P. A., Brassington, G. B., Craig, A., and Pugh, T. (2010). Impacts of Ocean-Atmosphere Coupling on Tropical Cyclone Intensity Change and Ocean Prediction in the Australian Region. Mon. Wea. Rev. 138 (6), 2074–2091. doi:10.1175/2010MWR3101.1
Schapire, R. E. (2003). “The Boosting Approach to Machine Learning: An Overview,” in Nonlinear Estimation and Classification. Editors D. D. Denison, M. H. Hansen, C. C. Holmes, B. Mallick, and B. Yu (New York, NY: Springer), 149–171. doi:10.1007/978-0-387-21579-2_9
SIGOPT (2020). Bayesian Optimization Primer. Available at: https://sigopt.com/static/pdf/SigOpt_Bayesian_Optimization_Primer.pdf (Accessed Sept 6, 2020).
Snoek, J., Larochelle, H., and Adams, R. P. (2012). “Practical Bayesian Optimization of Machine Learning Algorithms,” in Advances in Neural Information Processing Systems (Nevada, U.S.A, Curran Associates, Inc.), 25, 2960–2968.
STI (2020). Shanghai Typhoon Institute. TC Best Track Data. Available at: http://tcdata.typhoon.org.cn/zjljsjj_zlhq.html (Accessed August 28, 2020).
Swersky, K., Snoek, J., and Adams, R. P. (2013). “Multi-task Bayesian Optimization,” in Advances in Neural Information Processing Systems. Editors C. J. C. Burges, L. Bottou, M. Welling, Z. Ghahramani, and K. Q. Weinberger (Red Hook, NY: Curran Associates, Inc.), 26. Available at: http://nrs.harvard.edu/urn-3:HUL.InstRepos:12561002.
Wang, Y., Rao, Y., Tan, Z.-M., and Schönemann, D. (2015). A Statistical Analysis of the Effects of Vertical Wind Shear on Tropical Cyclone Intensity Change over the Western North Pacific. Mon. Wea. Rev. 143 (9), 3434–3453. doi:10.1175/MWR-D-15-0049.1
Wang, Y., and Wu, C.-C. (2004). Current Understanding of Tropical Cyclone Structure and Intensity Changes–A Review. Meteorol. Atmos. Phys. 87 (4), 257–278. doi:10.1007/s00703-003-0055-6
Xie, J., and Coggeshall, S. (2010). Prediction of Transfers to Tertiary Care and Hospital Mortality: A Gradient Boosting Decision Tree Approach. Stat. Analy. Data Min. 3 (4), 253–258. doi:10.1002/sam.10079
Xu, W., Balaguru, K., August, A., Lalo, N., Hodas, N., DeMaria, M., et al. (2021). Deep Learning Experiments for Tropical Cyclone Intensity Forecasts. Wea. Forecast. 36 (4), 1453–1470. doi:10.1175/WAF-D-20-0104.1
Yang, F., Wang, D., Xu, F., Huang, Z., and Tsui, K.-L. (2020). Lifespan Prediction of Lithium-Ion Batteries Based on Various Extracted Features and Gradient Boosting Regression Tree Model. J. Power Sources 476, 228654. doi:10.1016/j.jpowsour.2020.228654
Yang, T., Chen, W., and Cao, G. (2016). Automated Classification of Neonatal Amplitude-Integrated EEG Based on Gradient Boosting Method. Biomed. Signal Process. Control 28, 50–57. doi:10.1016/j.bspc.2016.04.004
Zeng, Z., Wang, Y., and Chen, L. (2010). A Statistical Analysis of Vertical Shear Effect on Tropical Cyclone Intensity Change in the North Atlantic. Geophys. Res. Lett. 37 (L02802), 1–6. doi:10.1029/2009GL041788
Zhang, C.-J., Qian, J.-F., Ma, L.-M., and Lu, X.-Q. (2016). Tropical Cyclone Intensity Estimation Using RVM and DADI Based on Infrared Brightness Temperature. Wea. Forecast. 31 (5), 1643–1654. doi:10.1175/WAF-D-15-0100.1
Zhang, Q., Wu, L., and Liu, Q. (2009). Tropical Cyclone Damages in China 1983-2006. Bull. Amer. Meteor. Soc. 90 (4), 489–496. doi:10.1175/2008BAMS2631.1
Zhang, W., Gao, S., Chen, B., and Cao, K. (2013). The Application of Decision Tree to Intensity Change Classification of Tropical Cyclones in Western North Pacific. Geophys. Res. Lett. 40 (9), 1883–1887. doi:10.1002/grl.50280
Zhang, Z., and Krishnamurti, T. N. (1997). Ensemble Forecasting of Hurricane Tracks. Bull. Amer. Meteor. Soc. 78 (12), 2785–2795. doi:10.1175/1520-0477(1997)078<2785:efoht>2.0.co;2
Zhang, Z., Yang, W., and Wushour, S. (2020). Traffic Accident Prediction Based on LSTM-GBRT Model. J. Control Sci. Eng. 2020, 1–10. doi:10.1155/2020/4206919
Keywords: tropical cyclones, intensity change, prediction, Western North Pacific, gradient boosted regression tree, Bayesian optimization
Citation: Zhu G, Li Q, Zhao W, Lv X, Qian C and Qian Q (2022) Tropical Cyclones Intensity Prediction in the Western North Pacific Using Gradient Boosted Regression Tree Model. Front. Earth Sci. 10:929115. doi: 10.3389/feart.2022.929115
Received: 27 April 2022; Accepted: 20 June 2022;
Published: 11 July 2022.
Edited by:
Liguang Wu, Fudan University, ChinaReviewed by:
Chao Wang, Nanjing University of Information Science and Technology, ChinaCopyright © 2022 Zhu, Li, Zhao, Lv, Qian and Qian. This is an open-access article distributed under the terms of the Creative Commons Attribution License (CC BY). The use, distribution or reproduction in other forums is permitted, provided the original author(s) and the copyright owner(s) are credited and that the original publication in this journal is cited, in accordance with accepted academic practice. No use, distribution or reproduction is permitted which does not comply with these terms.
*Correspondence: Qinglan Li, cWwubGlAc2lhdC5hYy5jbg==
Disclaimer: All claims expressed in this article are solely those of the authors and do not necessarily represent those of their affiliated organizations, or those of the publisher, the editors and the reviewers. Any product that may be evaluated in this article or claim that may be made by its manufacturer is not guaranteed or endorsed by the publisher.
Research integrity at Frontiers

Learn more about the work of our research integrity team to safeguard the quality of each article we publish.