- 1Key Laboratory of Mesoscale Severe Weather, Ministry of Education, and School of Atmosphere Sciences, Nanjing University, Nanjing, China
- 2Key Laboratory of Transportation Meteorology of China Meteorological Administration, Nanjing Joint Institute for Atmospheric Sciences, Nanjing, China
- 3College of Meteorology and Oceanography, National University of Defense Technology, Changsha, China
- 4College of Geography and Remote Sensing Sciences, Xinjiang University, Urumqi, China
This work studies the characteristics of high winds in the Tianshan Grand Canyon (TGC), Northwest China by using surface wind observations at six automatic weather stations during 2017–2018. Three high wind indices are examined, namely, high wind hour (HWH), station high wind event (SHWE) and regional high wind event (RHWE). SHWE denotes persistent high winds of more than 3 h at an individual station while RHWE is defined for the southern TGC as a whole. High winds are mainly northwesterly/westerly, occurring predominantly in southern TGC. HWHs most often occur in spring and summer, while winter and spring HWHs possess the strongest intensity. The occurrence of HWHs exhibits an apparent diurnal variation, most frequent in the afternoon and evening while least from mid-night to early morning. SHWEs and RHWEs are prone to take place in spring, possessing relatively long lifetime and strong intensity. According to composite analysis of the 0.25° FNL reanalysis, favorable synoptic conditions are obtained for the persistent high winds in spring. Of great importance is the mid-tropospheric trough in the mid-high latitudes located to the north (i.e., upstream) of the TGC. The cold advection behind the trough cools and stabilizes the mid-lower troposphere, while the post-trough sinking motion causes a surface high that accelerates the low-level northwesterly wind. The synoptic thermal and dynamical forcing help set an upstream flow of moderate Froude number such that the mesoscale orographic flow traversing the TGC is in the nonlinear high-drag regime. Large-amplitude gravity waves are excited, with the isentropes descending abruptly over the lee slope which resembles internal hydraulic jump. Downslope windstorms are produced at the expense of flow potential energy as the subcritical upstream flow is transitioned to supercritical at the TGC peak. These findings have important implications on the formation and prediction of high winds in the TGC.
1 Introduction
In Xinjiang, Northwest China, high winds of horizontal wind speed over 10 m s−1 are often observed on the downslope of high mountains, i.e., downslope windstorms (e.g., Zhang et al., 2018; Ding et al., 2019; Fu et al., 2020). The Tianshan Grand Canyon (TGC) is located in central Tianshan Mountains which is a pass connecting the two basins of Junggar and Turpan to the north and south, respectively (Figure 1). Given its complex terrain, the TGC has the most frequent occurrence of downslope windstorms in China. While high winds can bring abundant wind energy resources, they can also cause severe dust storms and air pollution and thus are detrimental to power facilities (e.g., knocking down electrical transmission lines) and public transportation, leading to huge fatalities and economic losses. Understanding and prediction of downslope windstorms are thus of both scientific and socioeconomic importance.
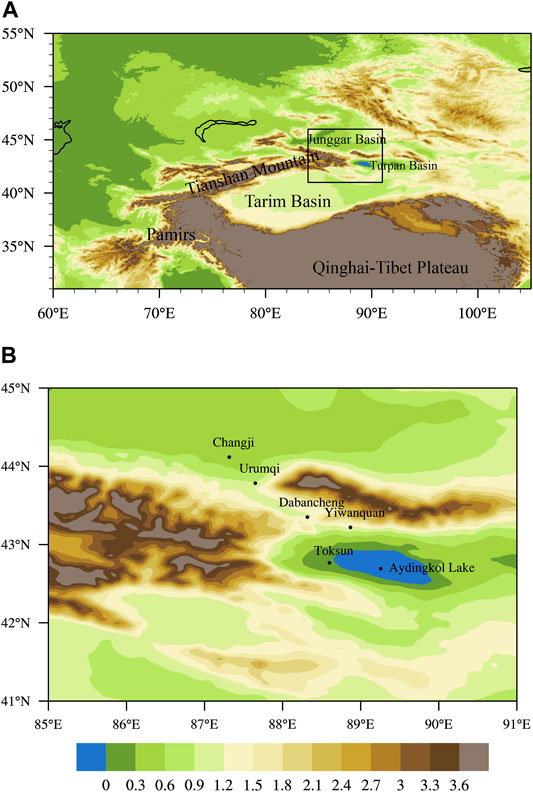
FIGURE 1. Topography in (A) Northwest China and surrounding area and in the region of (B) Tianshan Grand Canyon (TGC). The locations of the six automatic weather stations are indicated by dots in (B).
In the past few decades, several mechanisms were proposed for the formation of downslope windstorms. Based on linear multi-layer models, Klemp and Lilly (1975) showed that downslope windstorms can be caused by partial reflection of vertically propagating orographic gravity waves (OGWs) at tropopause where the wave phase is reversed with respect to that at the surface. Using idealized numerical simulations, Clark and Peltier (1977), Clark and Peltier (1984) attributed the generation of downslope windstorms to resonant amplification of OGWs reflected at critical level (i.e., wind reversal level), which is either pre-existing or induced by wave breaking. In accordance with Long’s nonlinear equation (Long, 1955), Smith (1985) theoretically derived a mathematical model for downslope windstorms, which are caused by the interaction between strong smooth stratified airflow and a deep turbulent mixed region owing to wave breaking. Durran (1986) further explained the formation of downslope windstorms from the viewpoint of hydraulic jump as in shallow water: In the case of subcritical incoming flow, which does not have enough kinematic energy to overcome the potential barrier of the mountain, the airflow has to descend on approaching the mountain such that the flow potential energy can be converted to kinematic energy. Once the incoming flow experiences a transition from subcritical to supercritical at the mountain top, it will continue to descend on the lee slope and thus convert more flow potential energy to kinematic energy. Downslope windstorms are readily induced since the fluid parcel is accelerated during the entire period of flow passing the mountain.
Besides theoretical studies, there are also a lot of observational and numerical studies for realistic downslope windstorms in different locations of the world, e.g., the Alpine foehn, the Rocky Mountain chinook, the Croatian bora, the California Santa Ana, and the Argentine zonda (Doyle et al., 2000; Seluchi et al., 2003; Gohm and Mayr, 2004; Jiang and Doyle, 2005; Drobinski et al., 2007; Norte et al., 2008; Jones et al., 2010; Stiperski and Grubišić, 2011; Steinhoff et al., 2013; Cao and Fovell, 2016; Elvidge et al., 2016; Otero and Diego, 2021). A severe windstorm in central Norway was investigated in Doyle and Shapiro (2000) using multi-scale simulations of the Coupled Ocean/Atmosphere Mesoscale Prediction System (COAMPS). It occurred as a result of mountain wave resonance and amplification from the interaction of a surface-based warm front and attendant lower-level jet with complex orography. However, the wave response was trapped within the large frontal stratification layer in the lower troposphere rather than lower stratosphere as in idealized studies (e.g., Klemp and Lilly 1978). This suggests that linear and even nonlinear theories of downslope windstorms are not necessarily suitable for realistic cases in the atmosphere. Using both automatic weather station observations and high-resolution numerical simulations, Ágústsson and Ólafsson (2007) examined a violent downslope windstorm case in Freysnes, southeast Iceland. A low-level stable layer and a wind reversal level were found in the lower-to-middle troposphere which provided favorable conditions for wave breaking and thus downward reflection and trapping of wave energy. The climatology of Freysnes downslope windstorms was also explored by Ágústsson and Ólafsson (2007), and reverse vertical windshear was shown to be a general characteristic of easterly windstorms in Iceland. Based on 33-year daily synoptic weather maps, Raphael (2003) studied the climatology of Santa Ana winds in southern California. Annually, there are 20 Santa Ana events which most often occur between October and February with December being the peak month. The mean duration of a Santa Ana event is 1.5 days. Using the North American Regional Reanalysis and a 12-year, 6-km resolution regional climate simulation, Hughes and Hall (2010) revealed two mechanisms for Santa Ana winds, i.e., synoptic control and local thermodynamic forcing. In the former case, there is a high-pressure anomaly at 700 hPa centered over the west coast of the US, which causes offshore geostrophic winds roughly normal to the mountain ranges. Downslope windstorms are produced via the downward momentum transfer of OGWs. In the latter case, although the synoptic forcing is weak, there is a strong temperature gradient between the cold desert surface and the warm ocean air at the same altitude. An offshore pressure gradient is created which induces katabatic-like offshore flow within a thin layer near the surface. As for the Zonda winds (i.e., Andean Foehn) in Argentina, their climatology, dynamics, and forecasts studies have been thoroughly reviewed in Norte (2015).
Although there are comparatively fewer studies about downslope windstorms in Northwest China than in other regions, efforts have still been made to understand their generation. For instance, Lu et al. (2014) and Zhang et al. (2018) investigated two downslope windstorm cases in northwestern Xinjiang Province, respectively, using 3-km resolution Weather Research and Forecasting (WRF) simulations. Besides, Ding et al. (2019) conducted a WRF simulation with a higher resolution of 1 km to explore the mechanism of a southeasterly downslope windstorm in the TGC region of central Xinjiang. All these numerical studies suggested the importance of pre-existing critical level on the formation of downslope windstorms, which acted to reflect the wave energy downward and cause resonant amplification. Nonetheless, the previous studies mainly focused on limited cases of downslope windstorms in Northwest China. Little is known about their climatological characteristics, such as spatiotemporal distribution, intensity and duration. There is also a lack of knowledge about their environmental conditions. Downslope windstorms are in general mesoscale processes occurred over complex topography which cannot be well resolved in operational numerical models. Understanding the favorable synoptic conditions that lead to downslope windstorms can help improve their objective identification, forecast and thus disaster management (e.g., Jones et al., 2010; Abatzoglou et al., 2013).
In this work, the characteristics of high winds are studied in the TGC area which is of the most frequent occurrence of downslope windstorms in Northwest China, using both observational and reanalysis datasets. The rest of this paper is organized as follows. Section 2 briefly depicts the data sets and introduces the high wind indices defined in this work. Then the main results are presented in Section 3, including the features of high winds and their composite synoptic conditions and mesoscale flow structures. Finally, Section 4 summarizes the paper with discussions.
2 Data and Methods
2.1 Dataset
Given the complex terrain, there is only a sparse network of automatic weather stations in the TGC and surrounding areas. Therefore, surface wind observations at six automatic weather stations are adopted in this work (Figure 1). The two stations of Changji and Urumqi are located in northern TGC, whereas the other four stations (Dabancheng, Toksun, Aydingkol Lake and Yiwanquan) are in southern TGC (Supplementary Table S1). This dataset is provided by the National Meteorological Information Centre of China Meteorological Administration (CMA) under quality control. This data has been used in the study of downslope windstorms in the same area (Ding et al., 2019). With a high temporal resolution of 1 h, there are more than 4,000 high-wind hours in the 2-year period of 2017–2018 under examination, which thus provides enough samples for statistical analysis.
In addition, the Global Data Assimilation System (GDAS) Final (FNL) analysis derived from the National Centers for Environmental Prediction (NCEP) is adopted, which has a horizontal resolution of 0.25° and a temporal resolution of 6 h. This gridded dataset is used to investigate the synoptic conditions and mesoscale features of downslope windstorms.
2.2 High Wind Indices
Three high wind indices are used to study the characteristics of high winds in the TGC area, i.e., high wind hour (HWH), station high wind event (SHWE) and regional high wind event (RHWE). Both HWH and SHWE are defined for high winds at an individual station. HWH denotes the hour in which the mean wind speed is greater than 10 ms−1, whereas SHWE is for persistent high wind processes that last for more than 3 h. The intensity of SHWE is thus measured by the mean wind speed during its lifetime.
Different from HWH and SHWE, the RHWE index takes into account the winds at the four stations of Dabancheng, Toksun, Aydingkol Lake and Yiwanquan, which are located in the famous “thirty-mile wind zone” in southern TGC (e.g., Li et al., 2014). This local region is featured by very high occurrence frequency of high winds, given its very steep slope: The altitude decreases rapidly from about 1,100 m at Dabancheng to −152 m at Aydingkol Lake within a short distance of a few tens of kilometers (Supplementary Table S1). Indeed, the occurrence frequency of HWH in Yiwanquan is two order greater than that in Urumqi (Section 3.1). Therefore, the RHWE index is defined here and adopted to better examine the characteristics of high winds for the “thirty-mile wind zone” as a whole. In this regard, a RHWE requires that SHWE takes place at least in one of the four stations in southern TGC. The beginning time of a RHWE is taken as the earliest onset time of SHWE in the four stations, while it ceases when the SHWE stops at all the four stations. The intensity of a RHWE is then defined as the mean wind speed at the four stations during its lifetime.
3 Results
3.1 Characteristics of High Wind Hours
Figure 2 presents the 2-year accumulated HWHs at Changji, Urumqi, Dabancheng, Yiwanquan, Toksun, and Aydingkol Lake, which are 38, 21, 138, 2031, 599, and 1,455 h, respectively. It is clear that the occurrence frequency of HWH in the northern TGC region (Changji and Urumqi) is much lower than in southern TGC. Moreover, the mean wind speed of HWH is also lower in northern TGC than in southern TGC, with the strongest at Yiwanquan (13.7 m s−1). The weakest one occurs at Dabancheng (10.8 m s−1) which is close to that at Urumqi (11.0 m s−1).
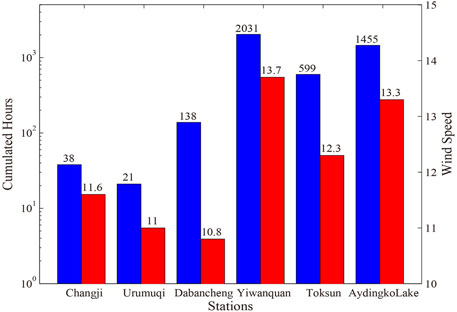
FIGURE 2. Occurrence frequency of HWHs and their mean intensity (in terms of horizontal wind speed) at the six automatic weather stations during 2017–2018.
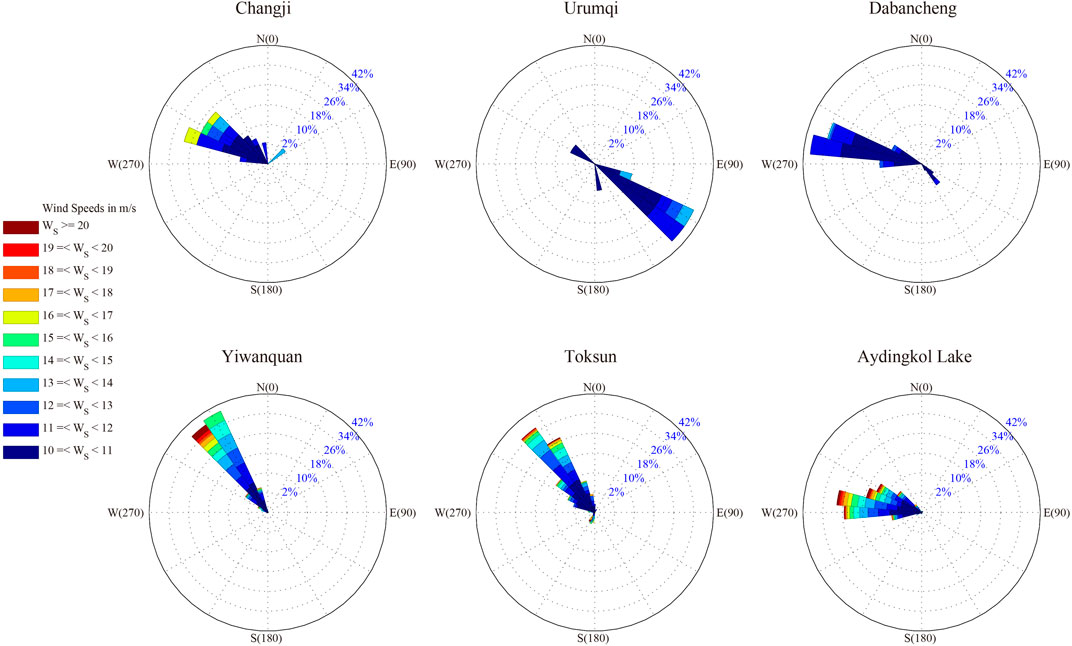
Figure 3 shows the wind rose diagrams at the six stations. Unlike other stations, southeasterly winds (wind direction from 105° to 135°) prevail in Urumqi, accounting for about 86% of the total HWHs. Changji, Yiwanquan and Toksun are dominated by northwesterly winds (wind direction from 285° to 345°), which account for 76%, 88% and 89% of their total HWHs, respectively. At Dabancheng and Aydingkol Lake, the observed high winds are mainly westerly (wind direction from 255° to 315°), with the proportion reaching more than 95% at Aydingkol Lake. The city Urumqi is right on the northern slope of the TGC where the low-level northwesterly flow is blocked (Section 3.4), hence not conductive to high northwesterly winds. Southeasterly high winds can be produced at Urumqi by reflection of orographic gravity waves at a critical level when the low-level flow is southeasterly across the TGC (i.e., Ding et al., 2019). The wind speed during HWHs at Changji, Urumqi and Dabancheng is mostly less than 12 m s−1, weaker than that of Yiwanquan, Toksun and Aydingkol Lake where the highest wind speed is more than 20 m s−1. Taking Aydingkol Lake as an example, the wind speed during more than 35% of the HWHs exceeds 15 m s−1, 16% of which exceeds 18 m s−1.
Since there are much fewer HWHs at Changji and Urumqi, we focus on the high winds at the four stations in southern TGC (i.e., Dabancheng, Toksun, Aydingkol Lake and Yiwanquan) hereafter. Figure 4A depicts the seasonal variation of HWHs at these four stations. The HWH is mainly concentrated in spring and winter at Dabancheng (more than 90%), with the least in summer (Figure 4A). At the other three stations, however, HWHs primarily occur in spring, summer and autumn, with the highest frequency in spring and the lowest in winter. For the mean wind speed of HWH (Figure 4B), it displays a consistent seasonal variation among the four stations, which is the strongest in winter and the weakest in summer. It is interesting to note that the seasonal variation of HWH occurrence differs from that of HWH intensity. This is likely due to that the occurrence of high winds generally depends on the large-scale environment. Thus, its seasonal variation is closely related to that of the large-scale circulation. For the intensity of high winds, however, it depends not only on the large-scale environment but also mesoscale and even small processes, e.g., gravity wave breaking and reflection, boundary layer turbulent mixing.
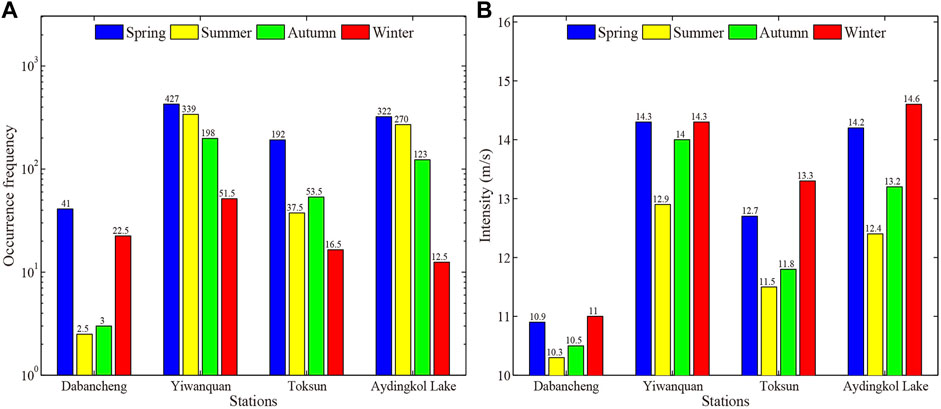
FIGURE 4. Seasonal variations of HWHs (A) occurrence frequency and (B) intensity at the four stations in southern TGC.
Moreover, the occurrence of HWH is also of notable diurnal variation, all of the four stations exhibiting a unimodal pattern (Figure 5). The HWHs at Dabancheng station (Figure 5A) possess the most significant diurnal variation, which mainly occur between 1,300 and 1800 LST (local standard time, which is +6 UTC). On the contrary, the occurrence frequency of HWHs is the lowest from midnight to early morning. This is consistent with the well-known diurnal variation of boundary layer wind. The nighttime boundary layer is stable, featured by calm wind near the surface. In contrast, the boundary layer becomes unstable in the daytime owing to solar radiation. Turbulent mixing can efficiently transport high momentum in the free atmosphere downward, leading to an increase of near-surface wind speed. The HWHs at Yiwanquan and Toksun most frequently occur between 1800 and 2100 LST, which is about 5 h later than that at Dabancheng (Figures 5B,C). The low-HWH time period is delayed accordingly. For the occurrence frequency peak of HWHs at Aydingkol Lake, it is the latest between 2,100 and 0001 LST, i.e., another 3 h later (Figure 5D). According to the geographical locations of the four stations (Figure 1B), and the prevailing wind directions (i.e., northwesterly winds, Figure 3) and diurnal variations of their HWHs, it is speculated that the high winds mainly start from the canyon, then descend along the southern slope of the TCG, and move further downstream toward the Turpan Basin. Note that the high winds at Dabancheng are weaker than at the other three stations, thus leading to much fewer HWHs at Dabancheng (Figure 2). The too small sample at Dabancheng may cause the different seasonal variations of HWH occurrence from at the other three stations.
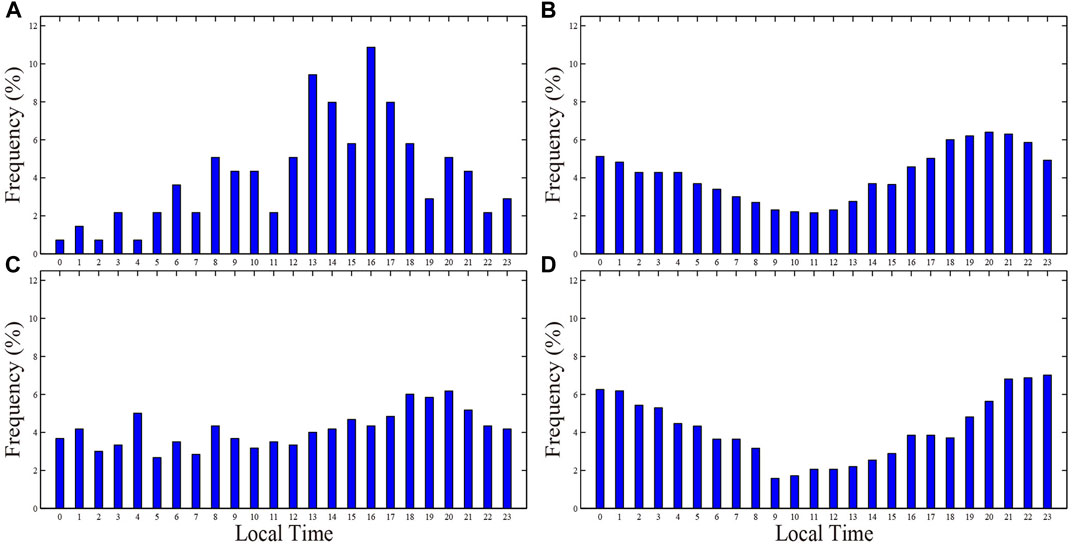
FIGURE 5. Diurnal variations of HWH frequency at the four stations of (A) Dabancheng, (B) Yiwanquan, (C) Toksun and (D) Aydingkol Lake in southern TGC.
3.2 Characteristics of Station High Wind Events and Regional High Wind Events
Based upon the definition of SHWE in Section 2, there occurred 10, 61, 152, and 234 SHWEs at Dabancheng, Toksun, Aydingkol Lake and Yiwanquan, respectively, during 2017–2018. Figure 6A shows the seasonal variations of the SHWE occurrence frequency at the four stations. At Dabancheng, there are six and four SHWEs in winter and spring, respectively. The winter SHWEs possess a duration time of 6 h on average, greater than the mean duration of 5.3 h in spring (Figure 6B). No SHWEs are found in summer and autumn, apparently due to the much fewer HWHs in these two seasons (Figure 4A). At Yiwanquan and Aydingkol Lake, the SHWEs are of similar occurrence frequency in spring and summer, adding up to more than 75% of the annual. However, the mean duration of spring SHWE is longer than its summer counterpart by about 40%–50% (Figure 6B). There are least SHWEs in winter, which are also featured by the shortest duration. At Toksun, about 65% of the SHWEs occur in spring, followed by about 19% in autumn, with the least in winter (only twice). The duration of SHWEs is also the longest (shortest) in spring (winter). Overall, the mean duration of SHWEs is longer at Aydingkol Lake (7.8 h) and Yiwanquan (7.5 h) than at Toksun (6.5 h) and Dabancheng (5.7 h) stations.
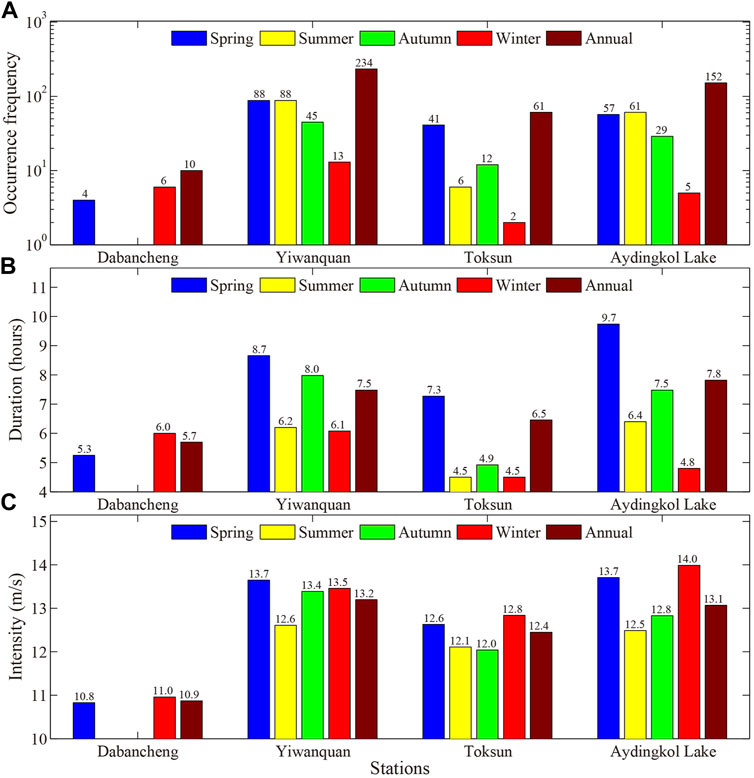
FIGURE 6. Seasonal and annual (A) occurrence frequency, (B) duration, and (C) intensity of SHWEs at the four stations in southern TGC.
Figure 6C gives the seasonal variations of the SHWE intensity at the four stations. On average, the SHWEs at Dabancheng are the weakest (10.9 m s−1), showing little seasonal variation. The mean intensities of SHWEs at Yiwanquan (13.2 m s−1) and Aydingkol Lake (13.1 m s−1) are comparable, which are slightly greater than that at Toksun (12.4 m s−1). However, the SHWE intensity at these three stations does possess significant seasonal variations. Generally, the SHWEs are stronger in winter and spring while weaker in summer.
The seasonal variations of the occurrence frequency, duration and intensity (in terms of mean wind speed) of RHWEs occurred in the TGC area between 2017 and 2018 are given in Figure 7. There are 209 RHWEs in total, with a mean duration of 10.0 h and intensity of 12.7 m s−1. The RHWEs most often occur in spring and summer (73 and 85 times, respectively), accounting for about 75% of the total. Nevertheless, the RHWEs in spring last for 12.4 h on average, notably longer than in summer (8.1 h; Figure 7B). The mean wind speed of spring RHWEs (13.0 m s−1) is slightly greater than its summer analogue (12.2 m s−1) as well (Figure 7C). Winter RHWEs possess the strongest mean wind speed of 13.6 m s−1, yet their mean duration (6.5 h) is only about half of that in spring. Moreover, the occurrence frequency of RHWEs in winter only accounts for about 6% of the total, far less than that in spring. The RHWEs also show a low occurrence frequency in autumn (38 times), despite their comparable duration (10.7 h) and intensity (13.0 m s−1) with that in spring.
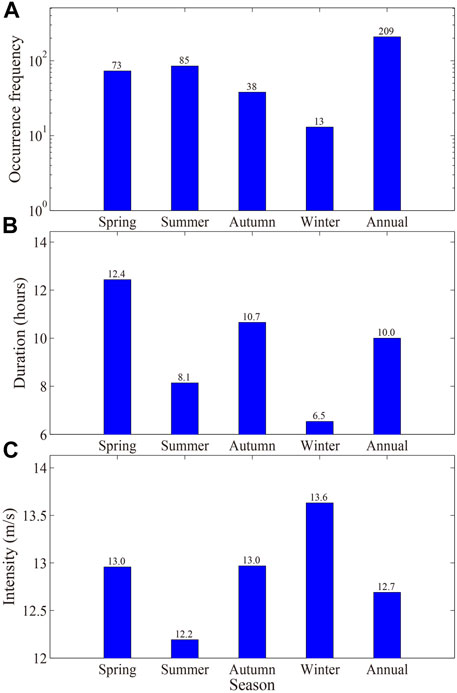
FIGURE 7. Seasonal and annual (A) occurrence frequency, (B) duration, and (C) intensity of RHWEs in southern TGC.
From the above analyses, in the southern TGC area under consideration, HWHs, SHWEs, and RHWEs are more prone to occur in spring, accompanied with longer duration and stronger intensity. Therefore, the synoptic conditions of spring RHWEs will be studied to help understand their formation mechanisms.
3.3 Composite Synoptic Conditions
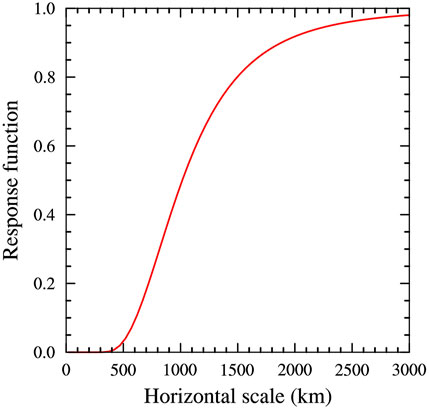
In accordance with the occurrence of RHWE in the southern TGC area, the FNL reanalyses in spring of 2017 and 2018 are divided into two sets, i.e., High_Wind and Low_Wind. Then the FNL reanalyses within these two sets are composed, respectively, and compared to reveal the favorable synoptic conditions for the occurrence of spring RHWE. Note that the FNL reanalysis data has a fairly fine resolution of 0.25°. To better depict the synoptic-scale conditions, it is firstly smoothed by virtue of the Barnes-type low-pass filter (Barnes 1973), the response function of which is presented in Figure 8. Readers are referred to the appendix of Xu et al. (2017) for more details about the Barnes filter.
Figure 9 shows the composite synoptic conditions at 500 and 800 hPa in spring of 2017–2018. In the case of Low_Wind (Figure 9A), the mid-high latitudes (about 45–60°N) to the north of the TGC area are dominated by a southwest-northeast orientated ridge extending from the Pamirs to the west of the Lake Baikal, accompanied with negative relative vertical vorticity (hereafter, vertical vorticity for short). On the two sides of the ridge, the westerlies present a weak cyclonic curvature, corresponding to the positive vertical vorticity there. As in the mid-lower latitudes, there are separately positive and negative vertical vorticity along the southern and northern periphery of the Tibetan Plateau. This is due to the blocking of westerlies by this high plateau (Figure 9C). The impinging westerlies are forced to deflect and detour the plateau, forming the cyclonic and anticyclonic vertical vorticity mentioned above.
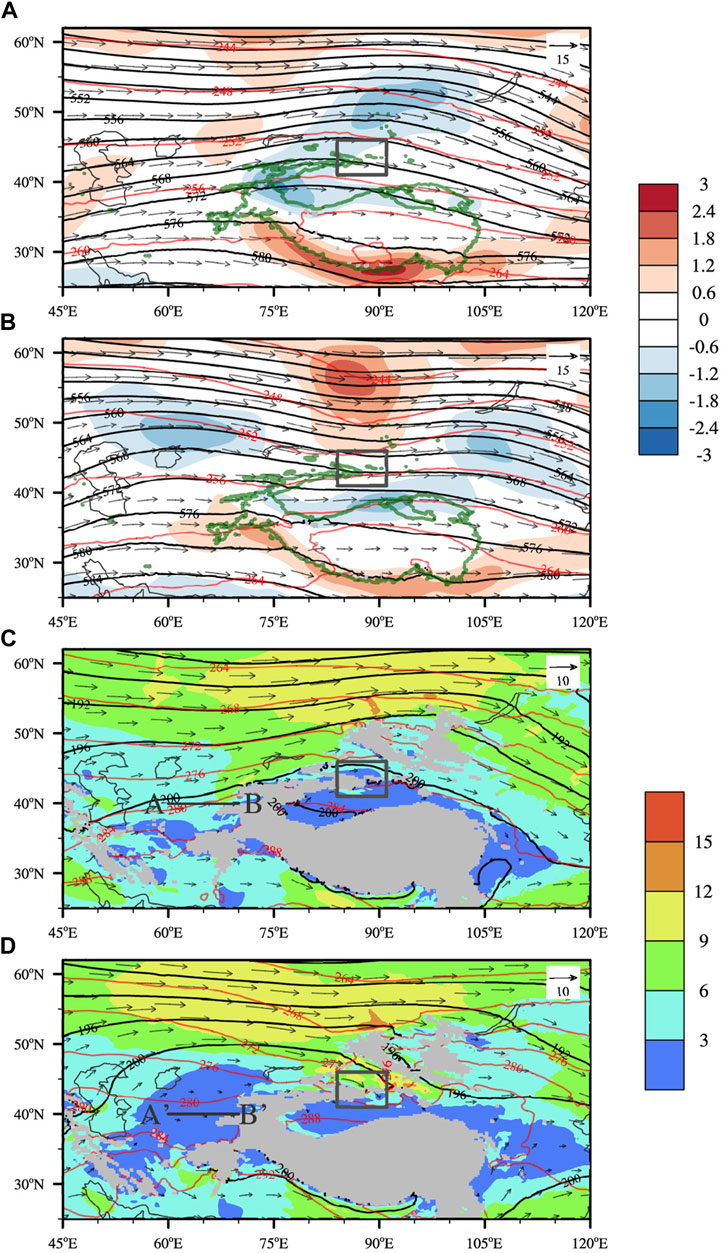
FIGURE 9. Composite geopotential height (black contours, unit:10 gpm), temperature (red contours, unit: K), horizontal wind fields (vectors) and relative vertical vorticity (shading, unit: 10−4 s−1) at 500 hPa in the cases of (A) Low_Wind and (B) High_Wind. (C) and (D) are the same as (A) and (B) but at 800 hPa with the shading for horizontal wind speed (unit: ms−1). The green isolines in (A) and (B) denote the elevation of 3,000 m, while the black boxes indicate the location of the Tianshan Grand Canyon (TGC). Line AB and Line A’ B’ indicate the vertical planes on which Froude Numbers are calculated.
During the period of High_Wind (Figure 9B), the 500-hPa circulation presents a similar pattern in the mid-lower latitudes. However, the circulation pattern is reversed in the mid-high latitudes. To the north of the TGC, there occurs a generally meridional trough, along with two ridges on its east and west sides, respectively. As in the lower troposphere (Figure 9D), there is greater blocking of westerlies by the Tibetan Plateau, given the remarkable expansion of weak wind (wind speed less than 3 m s−1) area to the west of the Tibetan Plateau.
Quantitatively, the degree of flow blocking by terrain can be measured by using a nondimensional parameter, i.e., Froude number
In response to the enhanced low-level airflow blocking in the High_Wind case, there is more prominent northward flow deflection to the west of the Tibetan Plateau, beginning from about 50°E (Figure 9D), i.e., further upstream of the plateau than in the Low_Wind case (Figure 9C). Consequently, more warm air is transported poleward from the lower latitudes. In accordance with the quasi-geostrophic geopotential tendency equation, the amplification of warm advection in the lower troposphere is favorable for the development of ridge in the middle troposphere (Holton 2004). The circulation difference (High_Wind minus Low_Wind) at 500 hPa clearly shows a warm-core high pressure anomaly between 45°E and 75°E in the mid-high latitudes (Figure 10A). The low-level flow deflection is increased on the southern flank of the Tibetan Plateau as well, producing a cyclonic low-pressure anomaly over and downstream of the Tibetan Plateau which acts to enhance the poleward warm advection (not shown). This leads to the differential anticyclonic vortex extending from the Tibetan Plateau to Northeast China (Figure 10A).
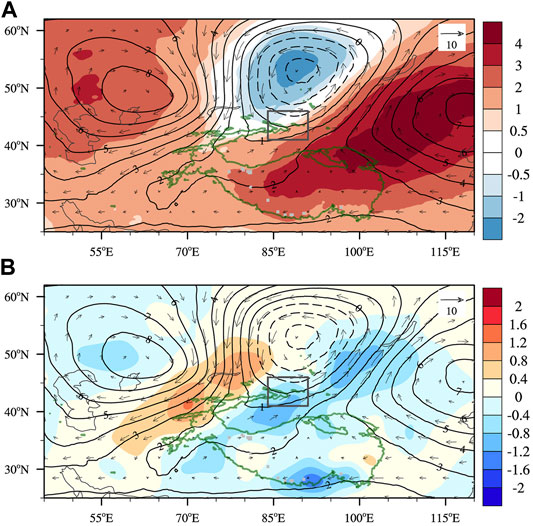
FIGURE 10. (A) Differences between the composite geopotential height (contours, unit:10 gpm), temperature (shading, unit: K) and horizontal wind fields (vectors) at 500 hPa in the cases of Low_Wind and High_Wind (High_Wind minus Low_Wind). (B) is the same as (A) but with the shading denoting the vertical velocity (unit: Pa s−1). The green isolines designate the elevation of 3,000 m, while the black boxes indicate the location of the Tianshan Grand Canyon (TGC).
To the north of the Tianshan Mountain is a differential cold, cyclonic vortex, which is consistent with the opposite circulation patterns, i.e., trough and ridge in the High_Wind and Low_Wind cases, respectively (Figures 9A,B). The northerlies between the cyclonic and the western anticyclonic vortices turn to be northeasterlies along the Tianshan Mountain and Pamirs which are approximately in the southwest-northeast orientation. Adiabatic sinking motion is induced by these equatorward flows moving on isentropic surfaces (Figure 10B). The accumulation of descending air mass generates high-pressure anomaly in the lower troposphere (not shown) as well as at the surface (Figure 11). On the contrary, there is predominantly low-pressure anomaly to the south of the Tianshan Mountain, due to the ascending motion ahead of the mid-tropospheric trough (Figures 9D, 10A). These high- and low-pressure anomalies on the two sides of the Tianshan Mountain create a southeastward-directed pressure gradient force across the TGC which, as will be shown in the next, drives the northwesterly high winds in southern TGC.
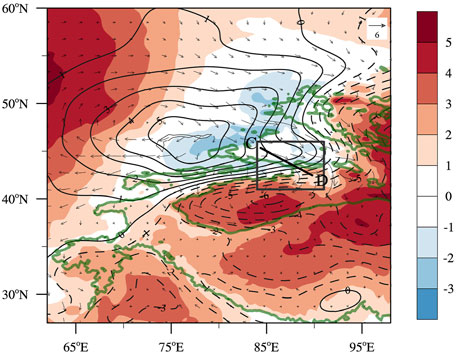
FIGURE 11. Differences between the composite pressure (contour, unit: hPa), temperature (shading, unit: K), and horizontal wind fields (vector) at the surface in the two cases of Low_Wind and High_Wind (High_Wind minus Low_Wind). The green isoline denotes the elevation of 3,000 m, while the black box indicates the location of the Tianshan Grand Canyon (TGC).
3.4 Mesoscale Orographic Flow Structure
To understand the formation of northwesterly high winds in southern TGC, the features of mesoscale orographic flow in the vertical plane across the TGC (line CD in Figure 11) in the two cases of Low_Wind (Figure 12A) and High_Wind (Figure 12B) are examined, respectively. Since the formation of downslope windstorms is closely related to the upstream flow configuration, Figure 13 further displays the vertical profiles of mean horizontal wind, potential temperature and buoyancy frequency averaged within a 1°×1° box centered at point C (Figure 11), i.e., upstream region of the TGC.
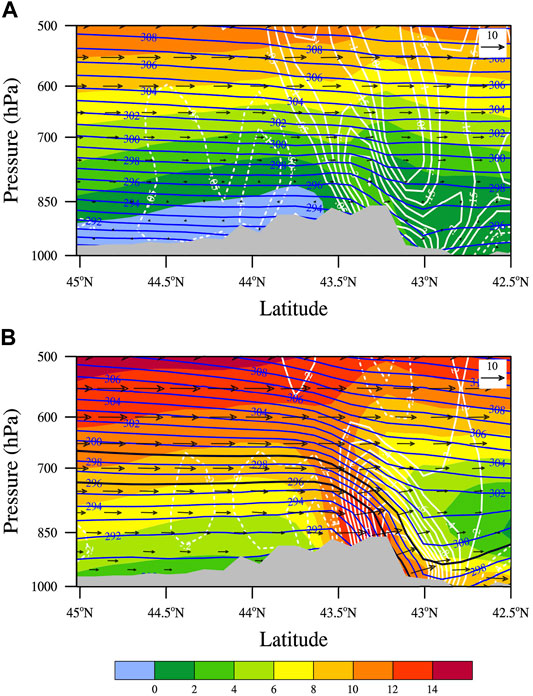
FIGURE 12. Composite potential temperature (blue contours, unit: K), horizontal wind speed (shading, unit: m s−1), vertical velocity (white contours, unit: Pa s−1) and wind fields (vectors) in the vertical plane along line CD in Figure 11 in the two cases of (A) Low_Wind and (B) High_Wind.
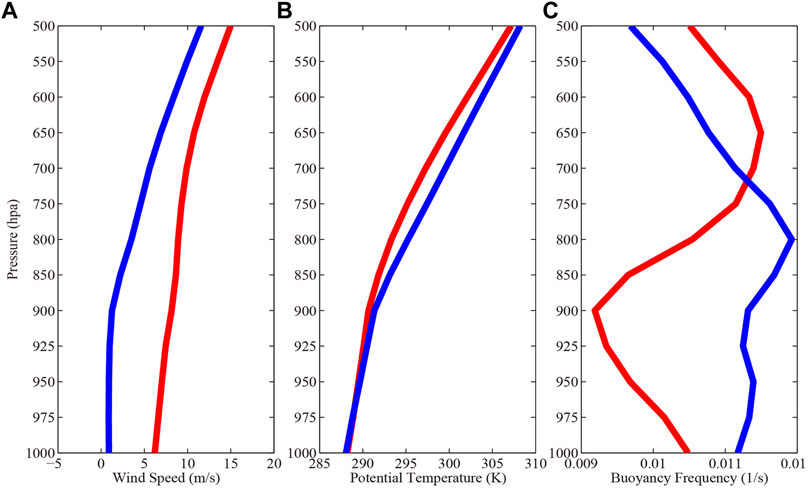
FIGURE 13. Vertical profiles of (A) horizontal wind speed, (B) potential temperature, and (C) buoyancy frequency in the upstream region of the Tianshan Grand Canyon (TGC). Red lines are for the case of High_Wind while blue lines are for Low_Wind. These profiles are obtained by areal average within a 1° × 1° box centered at point C in Figure 11.
The low-level incoming winds northwest of the TGC are significantly stronger in the High_Wind case than in Low_Wind (Figures 12A,B). The former shows a mean upstream wind speed of 7.3 m s−1 in the layer between the surface and the TGC peak, while it is only 1.5 m s−1 in the latter. Moreover, the upstream mid-lower troposphere is colder in the High_Wind case, especially around 700 hPa (Figures 12A,B, 13B). It can be attributed to the cold advection behind the mid-latitude trough (Figure 9B). However, this post-trough cold advection is largely cancelled by the adiabatic warming of subsidence there (Figure 10), resulting in a bottom layer with almost the same temperature as in the Low_Wind case below about 950 hPa (Figure 13B). Given these thermal differences, the upstream flow in the High_Wind case shows a weaker static stability below about 700 hPa than its Low_Wind counterpart (Figure 13C). Specifically, the layer-mean buoyancy frequencies between the surface and the TGC peak in these two cases are N = 0.0097 s−1 and N = 0.0133 s−1, respectively.
Based upon the layer-mean upstream U and N, along with the maximum elevation of H = 1,352 m for the TGC, it is readily to obtain the nondimensional Froude number of Fr = 0.1 in the Low_Wind case. This extremely-low Froude number suggests that the low-level incoming wind is largely blocked by the TGC, which thus produces the upwind flow reversal zone (Smolarkiewicz and Rotunno, 1989) of southeasterlies on the northern slope of the TGC (Figure 12A). The salient upstream flow blocking reduces the effective terrain height and hence triggers very weak OGWs (Smith, 1989; Xu et al., 2013), as indicated by the small-amplitude disturbances of potential temperature over the peak of the TGC. On the lee slope, both the vertical velocity and horizontal wind are very weak, which are in general smaller than 0.5 Pa s−1 and 2 m s−1, respectively. On the contrary, the High_Wind case possesses a moderate Froude number of Fr = 0.69, given its much stronger low-level upstream wind and weaker static stratification. This corresponds to the nonlinear high-drag flow regime (Miranda and James, 1992), which is featured by partial blocking upstream, gravity wave breaking aloft, and high winds on the lee slope. As shown in Figure 12B, the airflow that goes over the TGC peak descends significantly, with the maximum vertical velocity and horizontal wind speed in excess of 3 Pa s−1 and 12 m s−1, respectively.
In the case of High_Wind the large-amplitude potential temperature perturbations on the lee slope (Figure 12B) resemble internal hydraulic jump (Smith, 1985). It forms as the incoming flow is subcritical in the upstream but changes to be supercritical at the top of the obstacle (e.g., Durran, 1986). In a shallow water, the flow regime can be easily determined from the Froude number
Seen from Figure 12B, the high-speed downslope winds mainly come from the flow of potential temperature between 296 and 299 K. The thickness of this fluid layer is about 1,100 m in the upstream region of the TGC, along with a mean flow speed of 10 m s−1 and buoyancy frequency of 0.011 s−1. The stratified-flow Froude number is thus 0.81, less than unity. This subcritical flow descends on approaching the TGC, with the fluid layer being compressed on the windward slope. Over the TGC peak, the layer thickness shrinks substantially to 550 m, whereas the horizontal wind speed increases to 11.3 m s−1 given the conversion of flow potential energy to kinematic energy. In the meanwhile, the stratified-flow Froude number has increased to FrStratified = 1.58, that is, the upstream incoming flow experiences a transition from subcritical to supercritical. In this regard, the airflow continues to sink on the lee slope and finally produces high winds, i.e., downslope windstorms. According to the mesoscale flow structure, the northwesterly high winds are firstly onset near the mountain peak, which then blow downslope toward the basin. During this process, the downslope flow is accelerated at the expense of potential energy. Therefore, the winds at Yiwanquan, Toksun, and Aydingkol Lake are stronger than at Dabancheng. It also explains why the diurnal peak of high wind occurrence at Yiwanquan and Toksun is later than at Dabancheng but earlier than at Aydingkol Lake, given their geographical locations.
It is noteworthy that there is a local wind maximum on the mountain top, near the exit of the TGC (Figure 12B). It is attributed to the gap wind effect, which plays an important role for the formation of high winds near the exit region of a barrier gap (Gaberšek and Durran, 2004). Apparently, the TGC is a gap between two high mountains to its west and east (Figure 1B). The dynamics of gap wind are also controlled by the non-dimensional Froude number,
4 Summary and Discussion
Based on the hourly surface wind observations at six automatic weather stations, this work investigates the characteristics of high winds in the Tianshan Grand Canyon (TGC) region, Northwest China. Three high wind (with surface wind speed more than 10 m s−1) indices are considered, i.e., high wind hour (HWH), station high wind event (SHWE), and regional high wind event (RHWE).
In the period of 2017–2018, there are more than 4,000 HWHs in the TGC region. These high winds are mainly northwesterly/westerly winds except in Urumqi which is dominated by southeasterly winds. Nearly all the HWHs take place in the southern TGC, accounting for more than 98% of the total. The intensity of HWHs (in terms of surface wind speed) is stronger in southern than in northern TGC. HWHs most often occur in spring and summer, with the least occurrence in winter. However, the winter HWHs have an intensity comparable to that in spring, both of which are stronger than in autumn and summer. The occurrence of HWHs shows an apparent diurnal variation. At Dabancheng, i.e., near the crest of the TGC, high winds most frequently happen in the afternoon, with the lowest occurrence frequency in the mid-night. Downstream of Dabancheng, the diurnal peak of HWHs is delayed, implying that the high winds are firstly onset within the canyon and then progress southward to the foothill.
For persistent high winds lasting for more than 3 h at individual stations, i.e., SHWE, they are most common in spring and summer. The spring SHWEs possess a longer lifetime and stronger intensity than their summer counterparts. There is a much lower occurrence frequency of SHWEs in winter, which are generally short-lived in spite of an intensity comparable to that in spring. The statistical features of RHWEs (which refer to persistent high winds for southern TGC as a whole) are similar to that of SHWEs, high winds are prone to occur in spring, along with a longer lifetime. In order to explore the seasonal variation, we examine the differences between the composite large-scale circulations in spring and winter when the occurrence frequencies of high winds are the most and least in the year. The springtime circulation shows a cyclonic circulation anomaly to the north of the TGC compared to its winter counterpart (not shown), which is similar to the circulation differences between High_Wind and Low_Wind cases in Figure 10A. The low-level northwesterly flow is conductive to the generation of high winds in southern TGC. This explains why the high winds are more prone to occur in spring. Moreover, the low-level northwesterly winds in the upstream region (i.e., north) of the TGC are the strongest in winter, followed by spring and autumn, with the weakest in summer (not shown). This is in good agreement with the seasonal variation of RHWEs intensity in southern TGC.
The favorable synoptic conditions leading to the intense and persistent RHWEs in spring are investigated through composite analysis of the FNL reanalysis. Most importantly, a 500-hPa trough is present in the mid-high latitudes to the north of the TGC, accompanied with a ridge to its west and east, respectively. The circulation pattern is just reversed when no RHWE occurs. The sinking motion behind the trough dynamically causes a surface high pressure in the upstream region (i.e., north) of the TGC, which drives a stronger northwesterly wind than in the case of no RHWEs. Meanwhile, the cold advection behind the trough cools the mid-lower troposphere, yet this cooling effect is largely cancelled by the adiabatic warming of subsidence in the bottom layer. This consequently gives rise to a more unstable lower troposphere than in the case of no RHWEs which, in conjunction with the faster incoming flow, tends to inhibit the low-level flow blocking in the upstream region of the TGC.
Close examination of the mesoscale flow structure shows that, when RHWE occurs in southern TGC, the orographic flow is in a nonlinear high-drag regime. Large-amplitude potential temperature perturbations are found over the lee slope, which resembles internal hydraulic jump within a stratified flow. This is confirmed by quantitative analysis of the shallow-water-like Froude number that the incoming flow experiences a transition from subcritical in the upstream to supercritical at the TGC peak. Downslope windstorms are produced since the potential energy is continuously converted to kinematic energy in the entire period of airflow traversing the TGC. The gap wind effect also plays a role in enhancing the winds in the exit region of the canyon. On the contrary, in the case of no RHWE, the low-level incoming flow is mainly blocked by the TGC, given its much weaker wind speed and stronger static stability. As such, there are only weak OGW activities over the TGC, with no high winds generated on the lee slope.
The favorable synoptic conditions and mesoscale flow structure obtained in this preliminary study provides some useful insights into the formation and prediction of high winds in the TGC area. However, the coarse observational network and 0.25° FNL reanalysis cannot well resolve the complex terrain and thus fine-scale structure and evolution of high winds. For example, as shown in Figure 12B, there is no critical level (i.e., zero-wind level) in the composite wind fields. This differs notably from previous case studies of high winds in this region using high-resolution numerical simulations (e.g., Lu et al., 2014; Zhang et al., 2018; Ding et al., 2019). In this regard, high-resolution numerical simulations will be conducted in the future to better understand the mechanisms of high winds through quantitative budget analyses of horizontal momentum and/or kinematic energy (e.g., Ding et al., 2019; Fu et al., 2020). The seasonal variation of high winds is also an interesting topic that deserves further research.
Data Availability Statement
The raw data supporting the conclusion of this article will be made available by the authors, without undue reservation.
Author Contributions
TX and XX designed the definition of three high wind indices and analyzed the observation data and the reanalysis data. TX plotted the figures with the assistance of PW. TX wrote the manuscript with support from XX and SZ. YW, JM, JD, and AA all contributed to the final version of the manuscript.
Funding
This study is mainly supported by the Second Tibetan Plateau Scientific Expedition and Research (STEP) program (2019QZKK0105), and the National Natural Science Foundation of China (42122036, 91837207). TX is also supported by the National Key R&D Programs of China (2018YFC1507300). SZ is supported by the National Natural Science Foundation of China (42105007). JD is supported by the National Natural Science Foundation of China (41905045).
Conflict of Interest
The authors declare that the research was conducted in the absence of any commercial or financial relationships that could be construed as a potential conflict of interest.
Publisher’s Note
All claims expressed in this article are solely those of the authors and do not necessarily represent those of their affiliated organizations, or those of the publisher, the editors and the reviewers. Any product that may be evaluated in this article, or claim that may be made by its manufacturer, is not guaranteed or endorsed by the publisher.
Acknowledgments
We thank the National Meteorological Information Centre of China Meteorological Administration (CMA) for offering the observational data. We also thank reviewers for their comments on the manuscript.
Supplementary Material
The Supplementary Material for this article can be found online at: https://www.frontiersin.org/articles/10.3389/feart.2022.926339/full#supplementary-material
References
Abatzoglou, J. T., Barbero, R., and Nauslar, N. J. (2013). Diagnosing Santa Ana Winds in Southern California with Synoptic-Scale Analysis. Wea. Forecast. 28 (3), 704–710. doi:10.1175/waf-d-13-00002.1
Ágústsson, H., and Ólafsson, H. (2007). Simulating a Severe Windstorm in Complex Terrain. metz 16 (1), 111–122. doi:10.1127/0941-2948/2007/0169
Barnes, S. L. (1973). Mesoscale Objective Map Analysis Using Weighted Time-Series Observations. NOAA Tech. Memo. ERL NSSL-62. Norman, OK 73069: National Severe Storms Laboratory, 60pp.
Cao, Y., and Fovell, R. G. (2016). Downslope Windstorms of San Diego County. Part I: A Case Study. Mon. Wea. Rev. 144 (2), 529–552. doi:10.1175/mwr-d-15-0147.1
Clark, T. L., and Peltier, W. R. (1984). Critical Level Reflection and the Resonant Growth of Nonlinear Mountain Waves. J. Atmos. Sci. 41 (21), 3122–3134. doi:10.1175/1520-0469(1984)041<3122:clratr>2.0.co;2
Clark, T. L., and Peltier, W. R. (1977). On the Evolution and Stability of Finite-Amplitude Mountain Waves. J. Atmos. Sci. 34 (11), 1715–1730. doi:10.1175/1520-0469(1977)034<1715:oteaso>2.0.co;2
Ding, J., Chen, Y., Wang, Y., and Xu, X. (2019). The Southeasterly Gale in Tianshan Grand Canyon in Xinjiang, China: a Case Study. J. Meteorological Soc. Jpn. 97 (1), 55–67. doi:10.2151/jmsj.2019-002
Doyle, J. D., Durran, D. R., Chen, C., Colle, B. A., Georgelin, M., Grubišić, V., et al. (2000). An Intercomparison of Model-Predicted Wave Breaking for the 11 January 1972 Boulder Windstorm. Mon. Wea. Rev. 128 (3), 901–914. doi:10.1175/1520-0493(2000)128<0901:aiompw>2.0.co;2
Doyle, J. D., and Shapiro, M. A. (2000). A Multi-Scale Simulation of an Extreme Downslope Windstorm over Complex Topography. Meteorology Atmos. Phys. 74 (1), 83–101. doi:10.1007/s007030070027
Drobinski, P., Steinacker, R., Richner, H., Baumann-Stanzer, K., Beffrey, G., Benech, B., et al. (2007). Föhn in the Rhine Valley during MAP: A Review of its Multiscale Dynamics in Complex Valley Geometry. Q.J.R. Meteorol. Soc. 133 (625), 897–916. doi:10.1002/qj.70
Durran, D. R. (1986). Another Look at Downslope Windstorms. Part I: The Development of Analogs to Supercritical Flow in an Infinitely Deep, Continuously Stratified Fluid. J. Atmos. Sci. 43 (21), 2527–2543. doi:10.1175/1520-0469(1986)043<2527:aladwp>2.0.co;2
Elvidge, A. D., Renfrew, I. A., King, J. C., Orr, A., and Lachlan-Cope, T. A. (2016). Foehn Warming Distributions in Nonlinear and Linear Flow Regimes: A Focus on the Antarctic Peninsula. Q.J.R. Meteorol. Soc. 142 (695), 618–631. doi:10.1002/qj.2489
Fu, S. M., Jin, S. L., Shen, W., Li, D. Y., Liu, B., and Sun, J. H. (2020). A Kinetic Energy Budget on the Severe Wind Production that Causes a Serious State Grid Failure in Southern Xinjiang China. Atmos. Sci. Lett. 21 (7), e977. doi:10.1002/asl.977
Gaberšek, S., and Durran, D. R. (2004). Gap Flows through Idealized Topography. Part I: Forcing by Large-Scale Winds in the Nonrotating Limit. J. Atmos. Sci. 61, 2846–2862. doi:10.1175/jas-3340.1
Gohm, A., and Mayr, G. J. (2004). Hydraulic Aspects of Föhn Winds in an Alpine Valley. Q. J. R. Meteorol. Soc. 130 (597), 449–480. doi:10.1256/qj.03.28
Holton, J. R. (2004). An Introduction to Dynamic Meteorology. 4th ed.. Elsevier Academic Press, 535pp. doi:10.1119/1.1987371
Hughes, M., and Hall, A. (2010). Local and Synoptic Mechanisms Causing Southern California's Santa Ana Winds. Clim. Dyn. 34 (6), 847–857. doi:10.1007/s00382-009-0650-4
Jiang, Q., and Doyle, J. D. (2005). Wave Breaking Induced Surface Wakes and Jets Observed during a Bora Event. Geophys. Res. Lett. 32 (17), L17807. doi:10.1029/2005gl022398
Jones, C., Fujioka, F., and Carvalho, L. M. V. (2010). Forecast Skill of Synoptic Conditions Associated with Santa Ana Winds in Southern California. Mon. Wea. Rev. 138 (12), 4528–4541. doi:10.1175/2010mwr3406.1
Klemp, J. B., and Lilly, D. K. (1978). Numerical Simulation of Hydrostatic Mountain Waves. J. Atmos. Sci. 35 (1), 78–107. doi:10.1175/1520-0469(1978)035<0078:nsohmw>2.0.co;2
Klemp, J. B., and Lilly, D. R. (1975). The Dynamics of Wave-Induced Downslope Winds. J. Atmos. Sci. 32 (2), 320–339. doi:10.1175/1520-0469(1975)032<0320:tdowid>2.0.co;2
Li, M., Zhang, G. X., Ma, Y. F., and Huang, H. Y. (2014). The Characteristics of Inversion at the Windward Slope of Tianshan Mountains during Gale Processes in 30 Km Wind Zone. J. Arid Land Resour. Environ. 28 (11), 193–198. doi:10.13448/j.cnki.jalre.2014.11.032
Long, R. R. (1955). Some Aspects of the Flow of Stratified Fluids, III. Continuous Density Gradients. Tellus 7 (3), 341–357. doi:10.3402/tellusa.v7i3.8900
Lu, B., Shi, Y. Q., Wang, G. H., and Yue, B. (2014). Numerical Study of Severe Downslope Winds at Kelamayi, XinJiang. Acta Meteorol. Sin. 72 (6), 1218–1230. doi:10.11676/qxxb2014.068
Miranda, P. M. A., and James, I. N. (1992). Non-linear Three-Dimensional Effects on Gravity-Wave Drag: Splitting Flow and Breaking Waves. Q.J R. Met. Soc. 118 (508), 1057–1081. doi:10.1002/qj.49711850803
Norte, F. A., Ulke, A. G., Simonelli, S. C., and Viale, M. (2008). The Severe Zonda Wind Event of 11 July 2006 East of the Andes Cordillera (Argentine): a Case Study Using the BRAMS Model. Meteorol. Atmos. Phys. 102 (1), 1–14. doi:10.1007/s00703-008-0011-6
Norte, F. A. (2015). Understanding and Forecasting Zonda Wind (Andean Foehn) in Argentina: A Review. Acs 05 (3), 163–193. doi:10.4236/acs.2015.53012
Otero, F., and Araneo, D. (2021). Zonda Wind Classification Using Machine Learning Algorithms. Int. J. Climatol. 41 (No. S1), 1097–0088. doi:10.1002/joc.6688
Raphael, M. N. (2003). The Santa Ana Winds of California. Earth Interact. 7 (8), 1–13. doi:10.1175/1087-3562(2003)007<0001:tsawoc>2.0.co;2
Seluchi, M. E., Norte, F. A., Satyamurty, P., and Chou, S. C. (2003). Analysis of Three Situations of the Foehn Effect over the Andes (Zonda Wind) Using the Eta-CPTEC Regional Model. Wea. Forecast. 18 (3), 481–501. doi:10.1175/1520-0434(2003)18<481:aotsot>2.0.co;2
Smith, R. B. (1989). Hydrostatic Airflow over Mountains. Adv. Geophys. 31, 1–41. doi:10.1016/S0065-2687(08)60052-7
Smith, R. B. (1985). On Severe Downslope Winds. J. Atmos. Sci. 42 (23), 2597–2603. doi:10.1175/1520-0469(1985)042<2597:osdw>2.0.co;2
Smolarkiewicz, P. K., and Rotunno, R. (1989). Low Froude Number Flow Past Three-Dimensional Obstacles. Part I: Baroclinically Generated Lee Vortices. J. Atmos. Sci. 46 (8), 1154–1164. doi:10.1175/1520-0469(1989)046<1154:lfnfpt>2.0.co;2
Steinhoff, D. F., Bromwich, D. H., and Monaghan, A. (2013). Dynamics of the Foehn Mechanism in the McMurdo Dry Valleys of Antarctica from Polar WRF. Q.J.R. Meteorol. Soc. 139 (675), 1615–1631. doi:10.1002/qj.2038
Stiperski, I., and Grubišić, V. (2011). Trapped Lee Wave Interference in the Presence of Surface Friction. J. Atmos. Sci. 68 (4), 918–936. doi:10.1175/2010jas3495.1
Xu, X., Xue, M., and Wang, Y. (2013). Gravity Wave Momentum Flux in Directional Shear Flows over Three-Dimensional Mountains: Linear and Nonlinear Numerical Solutions as Compared to Linear Analytical Solutions. J. Geophys. Res. Atmos. 118 (14), 7670–7681. doi:10.1002/jgrd.50471
Xu, X., Xue, M., Wang, Y., and Huang, H. (2017). Mechanisms of Secondary Convection within a Mei-Yu Frontal Mesoscale Convective System in Eastern China. J. Geophys. Res. Atmos. 122 (1), 47–64. doi:10.1002/2016jd026017
Keywords: high winds, orography, gravity waves, downslope windstorms, synoptic conditions
Citation: Xi T, Xu X, Wei P, Wang Y, Ming J, Zhang S, Ding J and Abulikemu A (2022) On the High Winds in the Tianshan Grand Canyon in Northwest China: General Features, Synoptic Conditions, and Mesoscale Structures. Front. Earth Sci. 10:926339. doi: 10.3389/feart.2022.926339
Received: 22 April 2022; Accepted: 08 June 2022;
Published: 28 June 2022.
Edited by:
Haishan Chen, Nanjing University of Information Science and Technology, ChinaReviewed by:
Shenming Fu, Institute of Atmospheric Physics (CAS), ChinaYu Du, Sun Yat-sen University, China
Copyright © 2022 Xi, Xu, Wei, Wang, Ming, Zhang, Ding and Abulikemu. This is an open-access article distributed under the terms of the Creative Commons Attribution License (CC BY). The use, distribution or reproduction in other forums is permitted, provided the original author(s) and the copyright owner(s) are credited and that the original publication in this journal is cited, in accordance with accepted academic practice. No use, distribution or reproduction is permitted which does not comply with these terms.
*Correspondence: Xin Xu, eGlueHVAbmp1LmVkdS5jbg==; Shushi Zhang, emhhbmdzc0BjbWEuZ292LmNu
 Tao Xi1
 Xin Xu
 Abuduwaili Abulikemu