 Jeffrey A. Steadman
 Karsten Goemann
 Jay M. Thompson
 Colin M. MacRae
 Ivan Belousov
 Max Hohl
- 1Centre for Ore Deposit and Earth Sciences, University of Tasmania, Hobart, TAS, Australia
- 2Central Science Laboratory, University of Tasmania, Hobart, TAS, Australia
- 3United States Geological Survey, Denver, CO, United States
- 4CSIRO Mineral Resources, Clayton, VIC, Australia
Hyperspectral cathodoluminescence (CL), geochemical, and geochronological characterization of a series of apatite-bearing samples from within and around the Ernest Henry IOCG deposit, NW Queensland, Australia, have revealed complex mineral parageneses and a spectrum of U-Pb ages that point to the effects of multiple geological processes. No two samples are identical, either in geochemistry or texture, despite their relative proximity to one another (all samples within 5 km from Ernest Henry). Hyperspectral CL maps reveal diverse internal textures and emissions ranging from near infrared (NIR) to near ultraviolet (UV) with a complex series of spectra in all samples, requiring the fitting more than 40 individual peaks (both sharp and broad) to capture the observed variability. Imaging analyses via LA-ICPMS show that apatite from the Ernest Henry district is enriched above background in a variety of trace elements, including Na, Mg, Al, Si, V, Mn, As, Sr, Y, the rare Earth elements (REEs), Pb, Th, and U. Samples outside the ore zone display chondrite-normalized REE profiles that are consistent with either a magmatic or hydrothermal origin, whereas ore zone apatite exhibits profiles that are decidedly hydrothermal in nature. Moreover, specific zones within ore zone apatite grains are very As-rich (up to 7 wt% As2O5), and the effect of such high As on the hyperspectral CL signature of these zones is a pronounced dampening of CL emission, regardless of REE concentrations. Uranium-Pb dating of the same samples (via LA-ICPMS) has yielded a diverse array of overlapping Mesoproterozoic ages ranging from 1,580 ± 34 Ma to 1,533 ± 61 Ma. These results correlate to published ages that constrain hydrothermal alteration in the Ernest Henry area, both before and during Cu-Au mineralization. Collectively, these data highlight the complexity of apatite studies at Ernest Henry, the broader Cloncurry district, and probably analogous terranes elsewhere. A combination of micro-scale methods such as those used in this study are shown to be essential for accurately deciphering geological information contained within petrogenetic indicator minerals.
1 Introduction
Apatite [Ca5(F,Cl,OH)(PO4)3] is a common accessory mineral in many sedimentary, igneous, metamorphic, and hydrothermal environments. Its stability over a wide range of temperatures and pressures enables it to be used as a petrogenetic and resistate indicator mineral, a vector toward hydrothermal mineralization, and a proxy for early life on Earth, among other applications (Belousova et al., 2001; Belousova et al., 2002; Harlov et al., 2002; Hughes and Rakovan, 2015; Apukhtina et al., 2016; Bouzari et al., 2016; Krneta et al., 2016; Krneta et al., 2017; Mao et al., 2016; Mercer et al., 2020). Furthermore, its ability to incorporate ppm-level U and Pb into its structure also makes it suitable for geochronological analysis, although its closure temperature (≤550°C; Chew and Spikings, 2015) is not as high as other minerals that scavenge these metals [e.g., zircon (>900°C); Lee et al., 1997], and thus its U- Pb isotopic character is more susceptible to resetting during tectonothermal events (e.g., Kirkland et al., 2018).
Due to its composition and crystallographic structure, apatite also exhibits cathodoluminescence (CL) under bombardment by electrons. Apatite luminescence has been known and studied for many years, and it remains a powerful tool for determining apatite paragenesis, structure, and composition (e.g., Blasse, 1975; Waychunas, 2002; Fau et al., 2022). The CL effect is caused primarily by elemental substitution within the crystal lattice. For instance, multiple elements can substitute for Ca2+ in apatite, such as the rare Earth elements (REEs; e.g., Ce3+, Eu2+, Dy3+, etc.), Sr2+, and Mn2+. Some of these elements produce characteristic sharp peaks at specific wavelengths (e.g., Dy3+: 480, 575, and 750 nm), whereas others exhibit broad emissions (e.g., Ce3+, centered at 375 nm; Kempe and Götze, 2002; Gaft et al., 2015). Although luminescence studies (both steady-state and time-resolved types) provide a significant amount of information regarding the presence of certain CL activators in individual apatite crystals, they are not always able to quantify the concentration of these elements due to CL emission dampening and sensitization effects. Dampening or quenching is caused by the presence of certain elements (e.g., Fe2+; Roeder et al., 1987) that reduce the CL emission of various activators, whereas sensitization results from the fact that the REEs commonly “boost” the CL emissions of each other under excitation. Other non-REE elements can also sensitize the REEs (e.g., Mn2+; Kempe and Götze, 2002). Therefore, non-luminescence techniques that are designed to quantify elements at trace concentrations, such as LA-ICPMS, can be used in conjunction with luminescence techniques to help constrain the presence of specific elements.
In this paper, we report the results of a combined hyperspectral CL, LA-ICPMS trace element imaging, and U-Pb geochronological study on a suite of apatite-bearing samples from within and around the Ernest Henry iron oxide copper-gold (IOCG) deposit, which is the largest of its kind in the Cloncurry district, northwest Queensland, and the second largest IOCG deposit in Australia (after Olympic Dam). To date, no previous hyperspectral CL studies of apatite from Ernest Henry have been published. Our data highlight the multiphase history of the hydrothermal system at Ernest Henry as recorded in apatite. They also carry important implications for the use of apatite as a resistate indicator mineral in the broader Cloncurry district and in other similar terranes globally.
2 Geologic context
2.1 Regional and local geology
Numerous previous authors have studied the local geology around Ernest Henry in detail (e.g., Twyerould, 1997; Mark et al., 2000; Mark et al., 2006; Rusk et al., 2010; Cave et al., 2018). Readers are referred to these works for more information. However, a synopsis is provided here.
The Ernest Henry Cu-Au deposit is situated approximately 40 km NE of the town of Cloncurry and is concealed by roughly 30 m of flat-lying Mesozoic marine sedimentary rocks (Figures 1A,B). The Mesozoic units overlie Paleoproterozoic metavolcanic and metasedimentary rocks comprising the Eastern Fold Belt of the Mount Isa Inlier. Ernest Henry is hosted by felsic to intermediate metavolcanic rocks belonging to the Mount Fort Constantine Formation, which were emplaced between 1,750 and 1,740 Ma and intruded by the Ernest Henry diorite at ca. 1,650 Ma (Figure 1C; Page and Sun, 1998; Mark et al., 2006; Cave et al., 2018). These rocks were subsequently deformed and metamorphosed during the polyphase Isan Orogeny, which occurred over the interval 1,600–1,500 Ma (Page and Sun, 1998). The latter stages of the Isan Orogeny also overlapped with the intrusion of the Williams-Naraku Batholiths (Page and Sun, 1998).
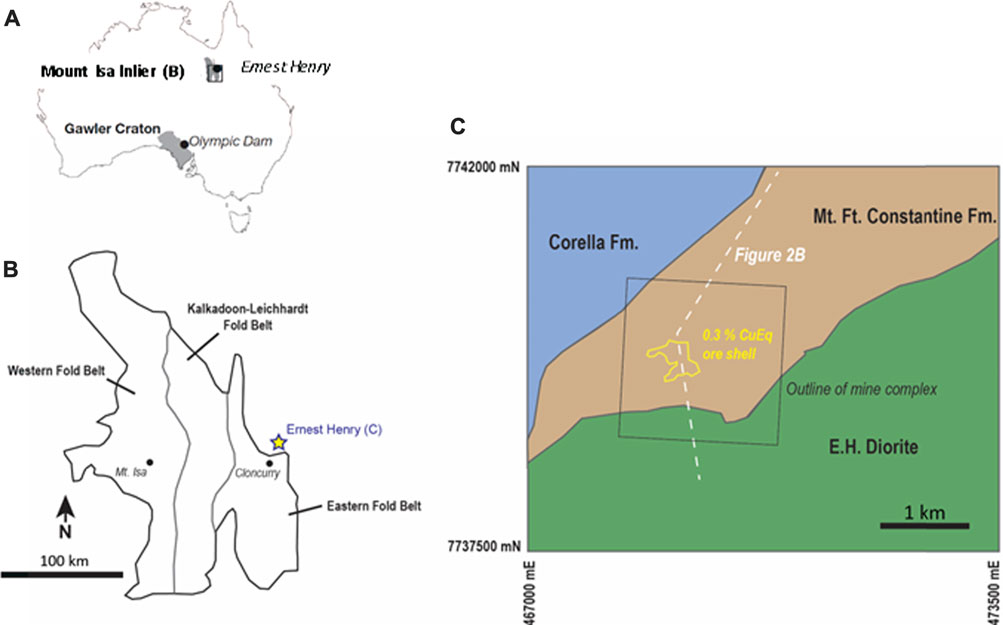
FIGURE 1. (A) Map of Australia, showing the location of the Mount Isa Inlier and Ernest Henry. Also shown is the Gawler Craton and Olympic Dam. After Williams et al. (2005). (B) Schematic of the Mount Isa Inlier, showing the three major tectonostratigraphic domains (Western Fold Belt, Kalkadoon-Leichhardt Fold Belt, and Eastern Fold Belt). Ernest Henry is situated NE of Cloncurry. (C) Generalized geologic map of the Proterozoic rock units in the Ernest Henry area, illustrating the location and extent of the mine complex. Ernest Henry is hosted within correlatives to the Paleoproterozoic Mount Fort Constantine Volcanics, a sequence of felsic-intermediate metavolcanic rocks intercalated with minor carbonate-rich metasedimentary rock units. The deposit is underlain by the younger but still Paleoproterozoic Corella Formation to the NW, a heterogenous sequence of deformed and metamorphosed carbonaceous shale and limestone, whereas the late Paleoproterozoic Ernest Henry Diorite overlies the host metavolcanic package to the SE. After Schlegel et al. (2022).
Multiple stages of alteration affected the host rocks of Ernest Henry and the broader Cloncurry district (Mark et al., 2006). The earliest event produced voluminous Na-Ca-rich mineralogy, dominated by albite and lesser scapolite. This was followed by K-Fe-rich alteration, in which magnetite is one of the major components, together with biotite and K-feldspar. This alteration stage is thought to immediately precede Cu-Au mineralization at Ernest Henry (Mark et al., 2006).
Copper-Au mineralization at Ernest Henry is contained within a single large continuous breccia pipe that plunges steeply to the SSE for over 1 km (Figure 1D). The core of the pipe is a matrix-supported breccia zone that transitions first to a clast-supported breccia zone and then to a diffuse zone of so-called “crackle veining” before disappearing altogether into unfractured metavolcanic rocks (Twyerould, 1997; Mark et al., 2006). Copper and Au grades are highest in the core of the breccia pipe. The breccia pipe is bound by two major structures, the Footwall and Hangingwall Shear Zones.
2.2 Paragenetic context of apatite at Ernest Henry
Apatite is a common mineral both within the Ernest Henry mine and in the surrounding district. In general terms, apatite is regarded as a component of both the regional Na-Ca-rich alteration assemblage as well as the proximal K-Fe alteration assemblage (e.g., Mark et al., 2006). However, it is not clear whether all apatite within the mine itself formed during the same event or during multiple events (cf. Cave et al., 2018). Nevertheless, apatite formation in and around Ernest Henry likely spans a large time interval (≥50 Ma), making it a key petrogenetic mineral for understanding hydrothermal fluid evolution in this area.
3 Sampling and methodology
3.1 Sampling and analysis preparation
All samples in this study were taken from six public domain drill holes stored at the Queensland Department of Resources’ Exploration Data Centre in Zillmere, QLD. Figure 2A illustrates the approximate collar locations for the sampled drill holes relative to the Ernest Henry mine complex. Nine apatite-bearing samples were analyzed using at least one of the three methods employed in this study. In certain instances, multiple apatite grains within one sample were analyzed with one or more techniques.
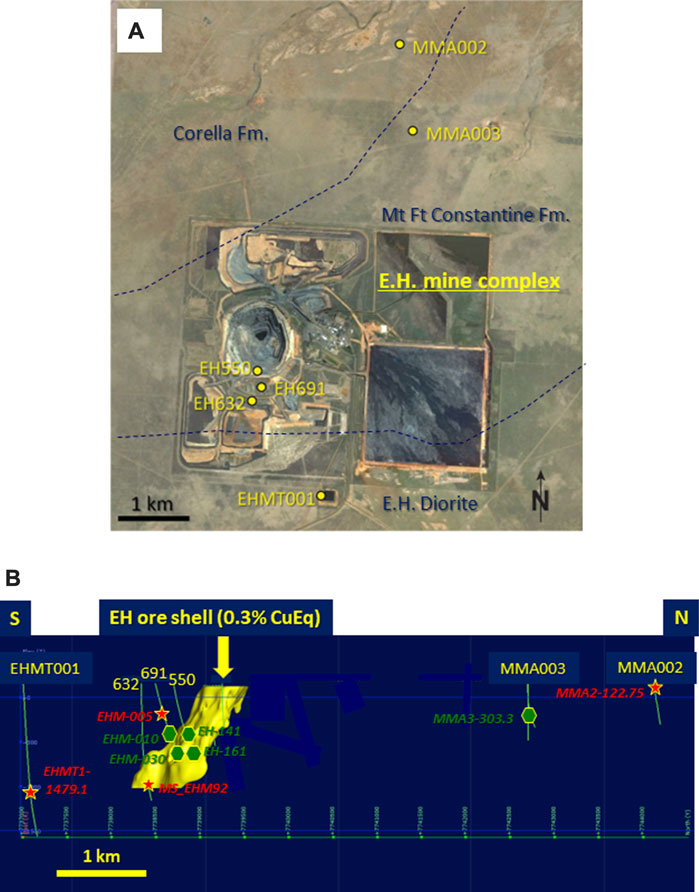
FIGURE 2. (A) Satellite image of the Ernest Henry mine complex and surrounding area. The collar location of drill holes sampled as part of this study are shown on the image. (B) Cross-section (looking west) through the Ernest Henry 0.3% copper equivalent (CuEq) grade shell, illustrating the traces of drill holes sampled in this study. The distance between drill holes EHMT001 and MMA002 is approximately 9 km. Names for samples are provided next to their respective symbols (i.e., star or hexagon). Stars on the cross section are samples included in the main body of this paper, whereas those marked by hexagons are included in the supplementary data attached to this manuscript.
Figure 2B shows the drill traces of the sampled holes as well as the distribution of samples in cross-sectional view, with reference to the 0.3% copper equivalent (CuEq) grade shell, which defines the ore zone. As shown in Figure 2B, three of the six holes (EH550, EH632, and EH691) intersect the Ernest Henry ore body at depth, whereas the other three holes (EHMT001, MMA003, and MMA002) are located at varying distances outside the ore body. Samples indicated by stars on the figure are included in this paper, whereas samples denoted by hexagons are located in the Supplementary Material attached to this paper.
Halved or quartered sections of drill core were selected based on their mineralogy, with specific focus on apatite-bearing segments. Additionally, three of our nine samples were borrowed from the “UNCOVER: Cloncurry” sample suite, collected by the Commonwealth Scientific and Industrial Research Organisation (CSIRO) in 2014. Unlike the rest of our samples, these are 25 mm × 25 mm × 25 mm “plugs” of micro-core taken from the center of uncut NQ or HQ drill core, as opposed to 10–20 cm halved or quartered sections of NQ core. Offcut sections made by previous CSIRO personnel were utilized in this study.
All samples were mounted in epoxy resin and polished using diamond paste at the University of Tasmania’s lapidary facilities. Petrographic characterization followed a two-stage protocol, beginning with whole-mount photomicrography via automated optical microscopy at CODES, and then whole-mount Mineral Liberation Analysis (MLA) using an FEI MLA650 scanning electron microscope (SEM) housed at the Central Science Laboratory (CSL), University of Tasmania (UTAS). Suitable samples were then targeted for more detailed back-scattered electron (BSE) imaging. Instrumentation used for detailed BSE imaging was a Hitachi SU-70 field emission (FE) SEM (CSL, UTAS), equipped with a Hitachi photo-diode BSE detector, an Oxford AZTec energy dispersive x-ray spectrometry (EDS) system, and an XMax 80 silicon drift detector (SDD).
3.2 Hyperspectral CL analysis
All hyperspectral CL mapping was done at CSL, UTAS, using a JEOL JXA-8530F Plus field emission electron probe microanalyzer (EPMA) fitted with a JEOL xCLent V spectral CL system and modified quartz glass optics. The electron beam was operated at an accelerating voltage of 20 kV, a beam current of 20 nA, a beam diameter of 2–5 μm (depending on grain size), mapping by continuous stage scanning with a pixel dwell time of 20 ms, and step size matching the beam diameter for most maps. In some maps of the ore-zone samples included in the supplementary data, a smaller step size of 0.5–1 μm was used with a 2 μm beam diameter due to the small grain size. This approach was chosen based on electron beam damage tests on nearby apatite grains for different beam diameters (i.e., by holding the beam in one spot and collecting spectra in 10 ms intervals), which showed a faster drop in CL intensity when reducing the beam diameter compared to longer exposure at 2 μm.
Spectral data were acquired with a Peltier-cooled Ocean Optics QEPro grating CCD spectrometer with 1,024 channels and a spectral range of 196–988 nm (corresponding to an energy range of around 1.255–6.3 eV). The spectrometer was connected to the light optical system of the EPMA instrument with a 300 μm core diameter optical fibre through a 100 µm entrance aperture. Secondary electron and backscattered electron images and wavelength dispersive X-ray spectrometry (WDS) distribution maps (ore zone samples: Si Kα, P Kα, Ca Kα, Fe Kα, As Lα; non-ore zone samples: Si Kα, F Kα, Ca Kα Fe Kα, Mg Kα) were acquired simultaneously with the hyperspectral CL. EPMA point analyses were also undertaken on the ore zone samples to verify element concentrations. For all electron beam methods, the samples were coated with around 10 nm of carbon in an HHV Auto306 carbon evaporator.
The CL data were processed with the JEOL xCLent V Analysis program. For general textural assessment and qualitative visualization of zoning within the apatite crystals, images loosely resembling visible light color CL images were extracted from the full hyperspectral data by defining three “region of interest” (ROI) windows, setting the spectral range of 590–750 nm as red color, 495–590 nm as green, and 400–495 nm as blue to produce a mixed RGB image. Infrared and ultraviolet components of the CL spectra are not represented in these images, and they are not comparable to flood-gun CL microscopy images. These mixed RGB images were used as a guide to select a range of different areas in the apatite crystals and inspect their respective CL spectra for peak fitting. In many of the maps, other minerals such as calcite surround the apatite which have a very different CL spectral response. An average CL spectrum for apatite was created from each map by selecting all apatite pixels in the image using Ca-BSE scatter plots. A range of pseudo-Voigt peaks were then fitted to the spectra in energy space to achieve the best possible overall match with the lowest residual. Gaussian to Lorentzian peak shape ratios were adjusted based on best fit. These sets of peaks were then fitted using a least-squares approach to all apatite pixels in each map, with peak positions, shapes, and widths fixed and only peak height allowed to vary during the least-squares fitting, resulting in a range of extracted peak intensity distribution images for each map (MacRae et al., 2009).
3.3 LA-ICPMS trace element imaging
Trace element imaging analysis of apatite-bearing samples was completed at the CODES Analytical Laboratories using a Resolution S-155 laser ablation system coupled to an Agilent 7900 quadrupole ICP-MS. Ablation took place in helium flowing at 0.35 L/min and was immediately mixed with Ar carrier gas flowing at 1.05 L/min after the ablation. A set of adjacent lines was rastered across the sample in a grid pattern from left to right and top to bottom. The laser was fired at a 10 Hz repetition rate and fluence of 3.5 J/cm2 at the sample. A square laser beam was used for all images. Beam diameter varied between 4 and 34 μm, and the rastering speed was matched to the beam diameter (i.e., 16 μm beam, 16 μm/s raster speed). The ICP-MS was tuned for low oxides (ThO/Th ≈ 0.15%) while maintaining a sensitivity of ≈9,000 cps/ppm for 238U while ablating the NIST612 glass with a 40 μm line scan at 10 Hz, 3.5 J/cm2, and 3 μm/s scan speed. Laser ablation map areas were matched as closely as possible to the hyperspectral CL map areas to be able to correlate both datasets.
Samples were analyzed across two sessions using two different analytical methods, one containing 28 masses and the other containing 33 masses. The element list for the first method is as follows: 23Na, 24Mg, 31P, 43Ca, 51V, 55Mn, 57Fe, 75As, 88Sr, 89Y, 139La, 140Ce, 141Pr, 146Nd, 147Sm, 153Eu, 157Gd, 159Tb, 163Dy, 165Ho, 166Er, 169Tm, 172Yb, 175Lu, 206Pb, 208Pb, 232Th, and 238U. Detector dwell times were 2 ms for P, 5 ms for Na, Mg, Ca, Mn, Sr, Y and 10 ms for all other elements. The element list for the second method is the same as the first, but with 65Cu, 59Co, and 34S added to monitor for sulfide inclusions; 49Ti to monitor for rutile or titanite inclusions; and mass 150 added to monitor for potential mass interferences on 75As from doubly charged 150Nd and 150Sm. Production of doubly charged species was at the level of 0.15% and therefore is considered negligible for these relatively high As apatite samples. Detector dwell times were 2 ms for P, S, Ca, Ti, and mass 150; 5 ms for Na, Mg, Mn, Sr, and Y; 10 ms for V, Fe, Co, Cu, and As; and 8 ms for all other elements.
Trace element abundances in apatite were calibrated on the NIST610 glass using values of Jochum et al. (2011), using secondary standard corrections based on the compositions of glasses BCR-2G and GSD-1G (GeoReM preferred values; http://georem.mpch-mainz.gwdg.de/). Quantification was performed using 43Ca as the internal standard element, normalizing all measured cations to the Ca site total of stoichiometric apatite (39 wt% Ca). The OD306 apatite and the NIST610, BCR-2G and GSD-1G glasses were analyzed in duplicate at the beginning, end, and every 60 min throughout the analytical session. Raw counts per second (cps) data were converted to parts per million (ppm) values using the Laser Ablation Data Reduction software package (LADR; Danyushevsky and Norris, 2018) for interval selection. The data were then visualized using the R software package.
3.4 U-Pb geochronology
Finally, geochronological analyses by LA-ICP-MS were also performed at the CODES Analytical Laboratories using the same laser system and ICP-MS as for the trace element imaging, but with the addition of N2 gas flowing at 1.6 ml/min right before the plasma torch to improve sensitivity and using 2.1 J/cm2 fluence for apatites. Analyses were also done with two slightly different methods. The list of elements for the first session of apatite geochronology method was as follows: 31P, 43Ca, 56Fe, 140Ce, 202Hg, 204Pb, 206Pb, 207Pb, 208Pb, 232Th, and 238U, with dwell times of 2 ms for 31P, 56Fe, and 140Ce; 5 ms for 43Ca and 202Hg; 10 ms for 204Pb, 208Pb, and 232Th; 20 ms for 238U; 30 ms for 206Pb; and 40 ms for 207Pb. The list of elements for the second session also included 23Na, 51V, 88Sr, 139La, 141Pr, 146Nd, 147Sm, 153Eu, 157Gd, 159Tb, 163Dy, 165Ho, 166Er, 169Tm, 172Yb, 175Lu, and 235U, with dwell times of 5 ms for 43Ca and 202Hg; 10 ms for 204Pb, 208Pb, and 232Th; 20 ms for 238U; 30 ms for 206Pb; 40 ms for 207Pb; and 2 ms for all other elements.
The quantification of U-Pb concordia intercept ages was done according to the methodology presented in Thompson et al. (2016), but with the OD306 apatite (Thompson et al., 2016) as the calibration material for the 206Pb/238U ratio and using the LADR software package. A correction for common Pb in the OD306 apatite is performed on a sweep-by-sweep basis according to Chew et al. (2014) using the 207Pb correction method. 207Pb/206Pb ratios were calibrated using the NIST610 glass, using the Pb isotopic values of Baker et al. (2004). The calibration of the U-Pb ages was checked using several apatite reference materials that were treated as unknowns: 401 apatite (Thompson et al., 2016), Durango apatite (McDowell et al., 2005) and the McClure Mountain apatite (Schoene and Bowring, 2006).
Uncertainties were calculated according to the protocol of Horstwood et al. (2016), where random sources of uncertainty (e.g., counting statistic variations related to signals on unknowns and calibration of Pb/U and Pb-Pb ratios, etc.) are presented, followed by fully propagated uncertainties, including systematic uncertainties related to uncertainty in calibration material compositions, decay constant uncertainties, and long-term variance.
4 Results
4.1 Apatite hyperspectral CL mapping
4.1.1 General features
Figures 3A–D illustrates the mixed RGB CL images of the four apatite grains included in this paper. Sample metadata (including proximity to Ernest Henry) may be found in Table 1.
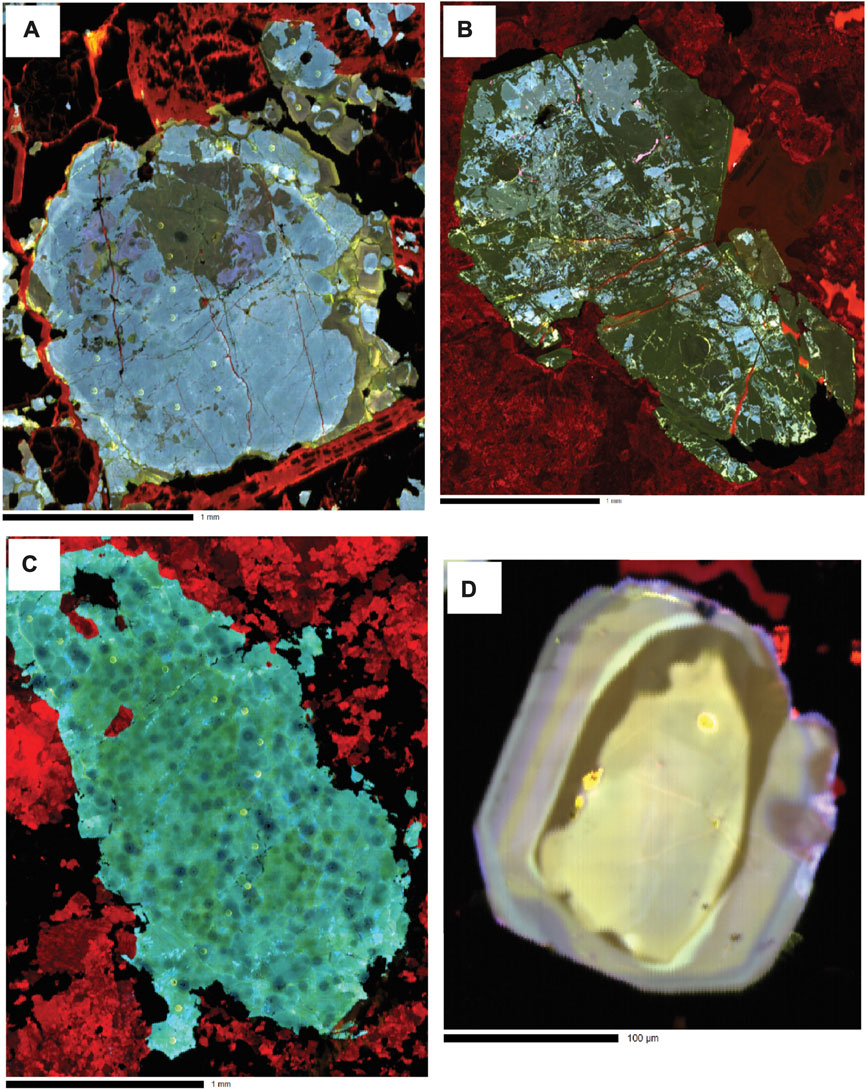
FIGURE 3. Mixed RGB hyperspectral CL images of four apatite grains from the Ernest Henry area. Images are arranged according to the sample’s location from the deposit, starting with the most distal sample. (A) MMA2-122.75. (B) EHMT1-1479.1. (C) EHM-005. (D) MS_EHM92.
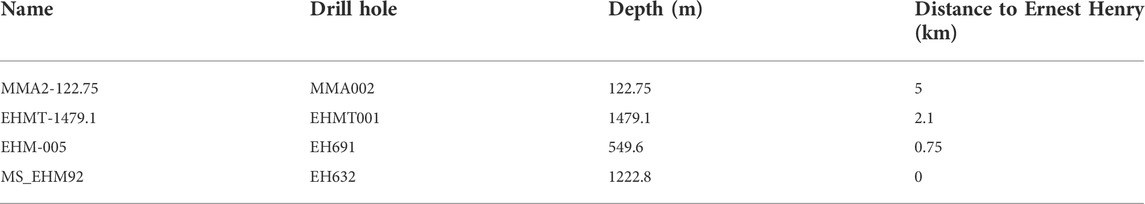
TABLE 1. Apatite sample information.
Regardless of their proximal or distal location relative to the mine, all four samples display a wide range of textural and spectral features, but the main spectral features are similar in all imaged grains. However, all four samples display evidence of dissolution and recrystallization processes—for instance, MMA2-122.75 has three main internal zones that exhibit dissolution-reprecipitation processes: the first is a small brownish green “core” low in CL intensity, located in the upper middle section of the grain (Figure 3A). This zone is enveloped by a much larger zone higher in CL intensity that characterizes most of the grain. The third zone is a rim surrounding the blue zone which again has a different CL response. The matrix surrounding both these apatite grains contains abundant calcite and/or feldspar (largely albite). Magnetite, pyrite, and minor amphibole (black, altered partially to calcite) are also present in MMA2-122.75. In contrast, sample EHMT1-1479.1exhibits no uniform internal zonation but has intense internal fracturing with no preferred orientation (Figure 3B).
The apatite in sample EHM-005 contains abundant thorite (ThSiO4) inclusions, which have created a mosaic pattern of radiation haloes that are clearly visible in CL (Figure 3C; also see Supplementary Appendix A, p. 9–12). These haloes exhibit muted CL emissions compared to areas of the grain that are free of thorite inclusions. This is due to the structural damage to the apatite crystal caused by alpha particle decay. Feldspar (albite) and magnetite comprise the matrix to this grain. In contrast, the ore zone apatite sample MS_EHM92 preserves growth zonation that has not been preserved in the other three samples. However, evidence of partial dissolution and reprecipitation in MS_EHM92 is apparent at the boundary of the core and the low CL intensity zone immediately outboard of the core: the contact between these two zones is irregular and varies in width, unlike the zones closer to the rim of the grain which are more consistent in appearance (Figure 3D). The low CL intensity of the interior rim is likely due to high As in this region of the sample (approximately 1.5 wt% As2O5; see supplementary EPMA spot analyses in Supplementary Appendix C). It is important to note that the mixed RGB images do not necessarily show all spectral variations, as changes in small peaks may be masked by more dominant changes in larger peaks, and information outside the visible light range is not shown.
4.1.2 CL peak matching
Between 30–45 unique peaks ranging from 1.25 to 4 eV (300–∼1,000 nm) were identified across the sample suite, including a mixture of sharp and broad spectral emissions (Supplementary Appendix A; also see full peak table in Supplementary Appendix B). Figures 4A,B illustrates an example of a combined apatite spectrum for one of our samples (MMA2-122.75), and Figure 5 showcases how different regions of the same sample can contain different spectral features.
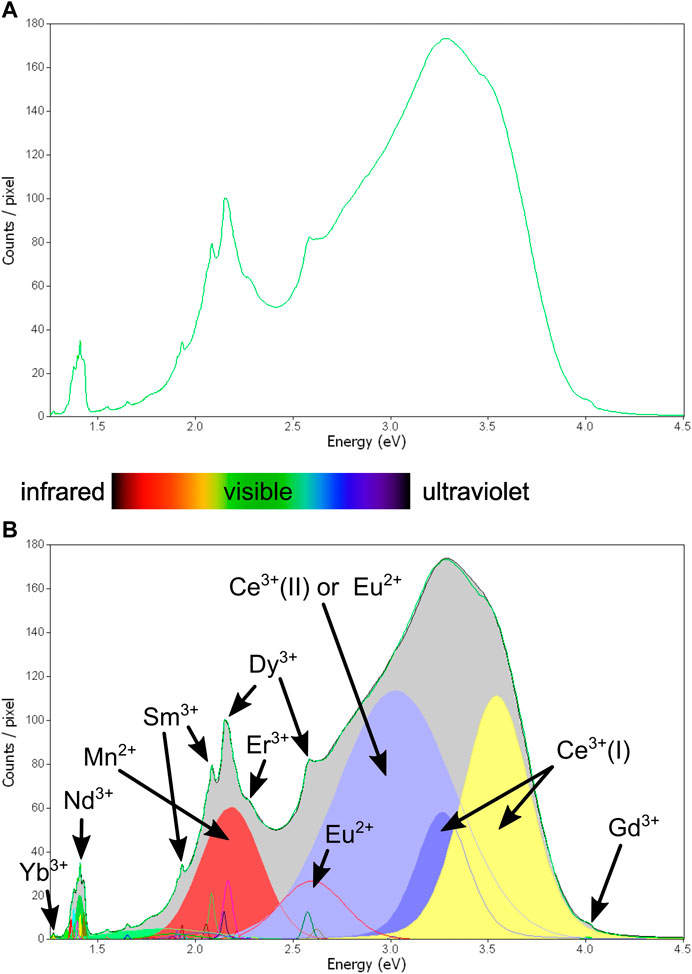
FIGURE 4. Example for peak fitting of the hyperspectral CL data. Green line: average spectrum of all apatite pixels combined for sample MMA2-122.75. Black line: sum of all fitted peaks. Some fitted peaks match literature data well and can be identified with high confidence (Nd3+, Dy3+, Sm3+, Mn2+), others where elements only have a single small peak within the spectral range are less certain (Er3+, Gd3+) and fitting. Some additional peaks were identified without match in the literature, e.g., see the broad peak at around 2.6 eV.
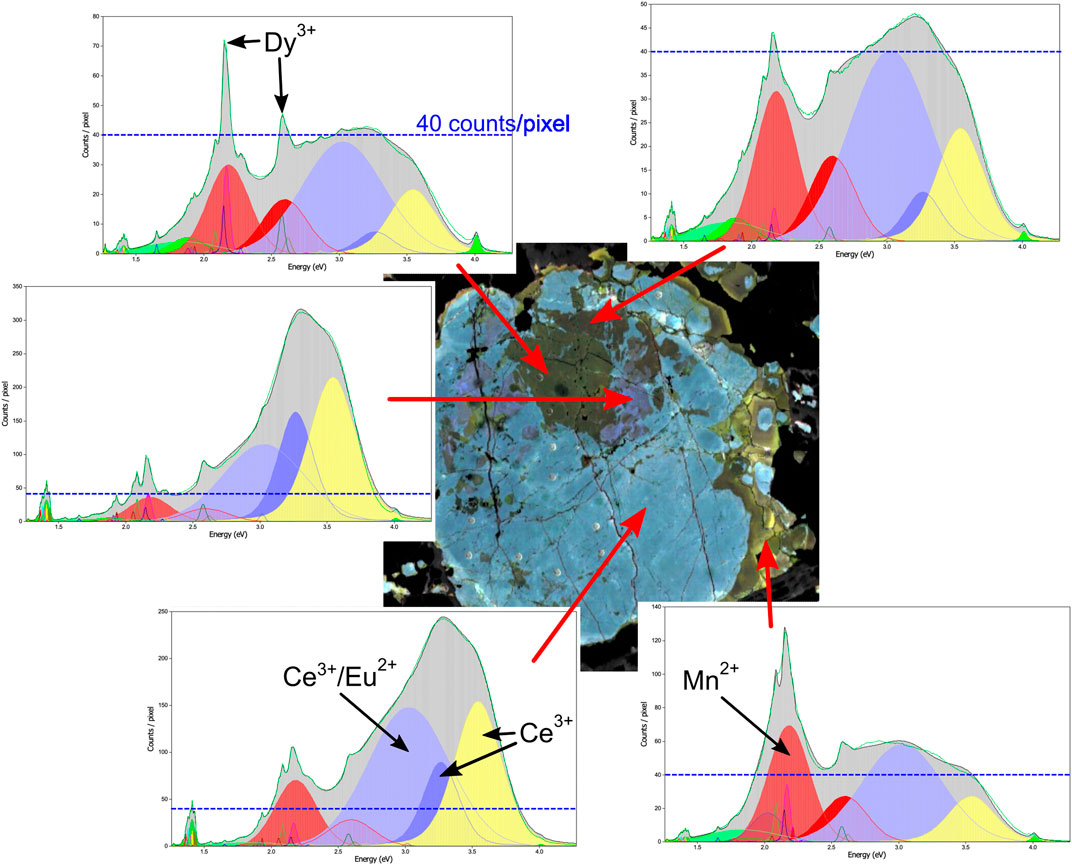
FIGURE 5. Example spectra for different regions in sample MMA2-122.75. Blue dashed lines show 40 counts/pixel intensity level in different spectra for comparison. The upper center of the grain is characterised by low CL intensity in 2–4 eV range and low overall CL emission, which is up to a factor of 8 higher in the surrounding regions. The outer rim areas show a strong Mn2+ peak at 2.2 eV. The sharp Dy3+ and Sm3+ emissions do not have a pronounced effect in the mixed RGB image.
The combined total CL intensity and mixed RGB images for all four images are displayed in Figures 6A–9A and selected spectral maps related to the presence or activity of specific elements are illustrated in Figures 6B–9B, starting with the most distal sample (MMA2-122.75) and finishing with the ore zone sample (MS_EHM92). The peaks were matched to literature data using the built-in luminescence database (MacRae and Wilson, 2008) and the literature compilation of Gaft et al. (2015). A summary of the results is presented below.
• Nd3+: A cluster of up to eight closely spaced narrow peaks was identified for Nd3+ in the spectral range from 867 to 923 nm. Except for sample MS_EHM92, all Nd3+ peaks were combined into a single image for ease of illustration due to their overall good correlation in scatter plots (see example for sample EHMT1-1479.1 in Supplementary Appendix A, page 35). The multiple, closely spaced peaks are ascribed to different charge compensations for Nd3+, all of which are located in the higher symmetry Ca(I) sites (Gaft et al., 2015), indicating no preferential charge compensation in this case.
• Dy3+: Sharp Dy3+ peaks were identified across all samples, with the strongest peak center generally located between 575 and 580 nm. However, slight shifts in peak positions were observed between samples, which can be attributed to subtle changes in the apatite structure due to compositional variation. A secondary peak was also observed at 481–486 nm, along with a weaker peak at 750–755 nm. Many maps also show another peak centered at 566–572 nm, which overlaps and correlates well with the main peak at 575–580 nm.
• Sm3+: Sharp peaks are present in all samples (somewhat like those for Dy3+ but generally lower in intensity), with the two main peaks centered at 596–603 nm and 641–646 nm, respectively. A weaker double peak at 700–710 nm is only detectable in areas with higher concentrations of Sm3+. A second weak double peak at 798–808 nm can be assigned to either Sm3+ or Nd3+. As with Dy3+, the main Sm3+ peak typically overlaps with a weaker peak at around 595 nm showing a similar distribution.
• Mn2+: A broad emission was identified in the yellow visible range at 565–570 nm in all samples, matching that reported in the literature (e.g., Perseil et al., 2000).
• Ce3+/Eu2+: All samples show broad emissions in the near UV range at 343–355 nm and 370–380 nm that are consistent with Ce3+ substituting on the Ca (I) site (Gaft et al., 2015). Similar broad emissions appear in the visible range at 405–445 nm and to a lesser extent at 465–485 nm. The former has been attributed to Ce3+ substituting on the Ca (II) site (Gaft et al., 2015) or Eu2+ (Kempe and Götze 2002), whereas the latter is more consistent with the 450 nm emission described by Gaft et al., 2015 for Eu2+.
The peak centered between 465 and 480 nm—which has been fitted in all maps and could also be potentially related to Eu2+ emission—shows different behavior in different samples (see Supplementary Appendix A, p. 29–34, and 36–40). In the case of MMA-122.75 and EHMT1-1479.1, the distribution of this peak shows good correlation with the Mn2+ maps at around 570 nm (Figures 6B, 7B), but in the case of EHM-005 and MS_EHM92, it is correlated to Ce3+ (I) at around 350 nm (Figures 8, 9B).
• Gd3+: Most samples show a small, sharp peak in the UV range with the center at 310–315 nm which can potentially be assigned to Gd3+. The fitting accuracy of this peak is hampered due to its location on the shoulder of the broad peak at 343–355 nm, which is usually much higher in intensity. REE3+ emissions can be affected by energy transfer and migration between different ions—for example, Gd3+ is known to sensitize the CL emissions of other rare Earth ions like Ce3+ (Gaft et al., 2015).
• Er3+: Some samples also exhibit a small, sharp peak at around 540 nm which may be assigned to Er3+. Accurate fitting of this peak is again affected by the underlying strong broad emissions.
• Yb3+: Another common small peak in the IR range, commonly centered between 973 and 978 nm, can be assigned to Yb3+. However, Yb3+ emissions are also known to be enhanced by energy transfer from Nd3+ (Gaft et al., 2015).
• Tb3+: Some of the apatite grains (including those in MS_EHM92) show additional small sharp peaks centered at 433–438, 411–417, and 381–388 nm, all of which can be assigned to Tb3+. The peaks are most visible in areas with strong emissions for neighboring REE, such as Dy3+. However, as for Gd3+ and Er3+, the fitting of these peaks is compromised by the strong underlying broad emissions in the 300–500 nm range.
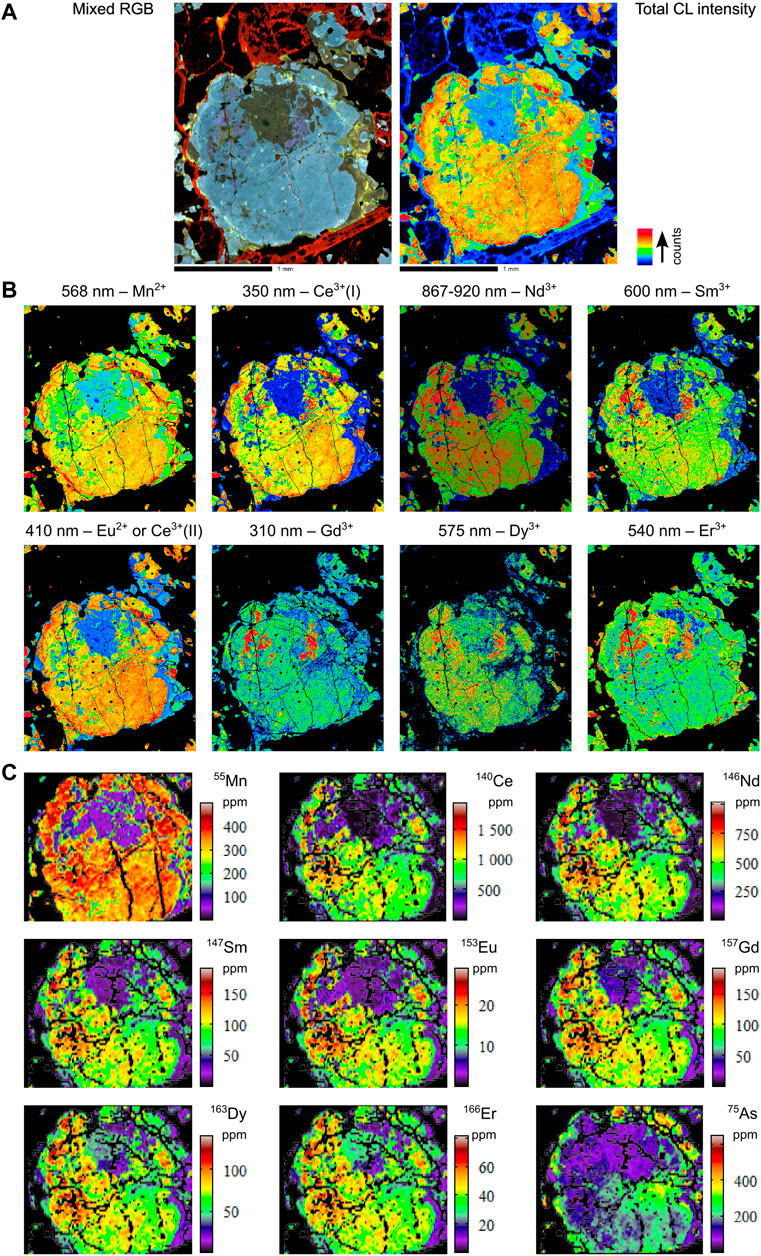
FIGURE 6. Combined hyperspectral CL and LA-ICPMS images of selected elements for sample MMA2-122.75. (A) Total CL intensity and mixed RGB images. (B) Hyperspectral CL images. (C) LA-ICPMS images.
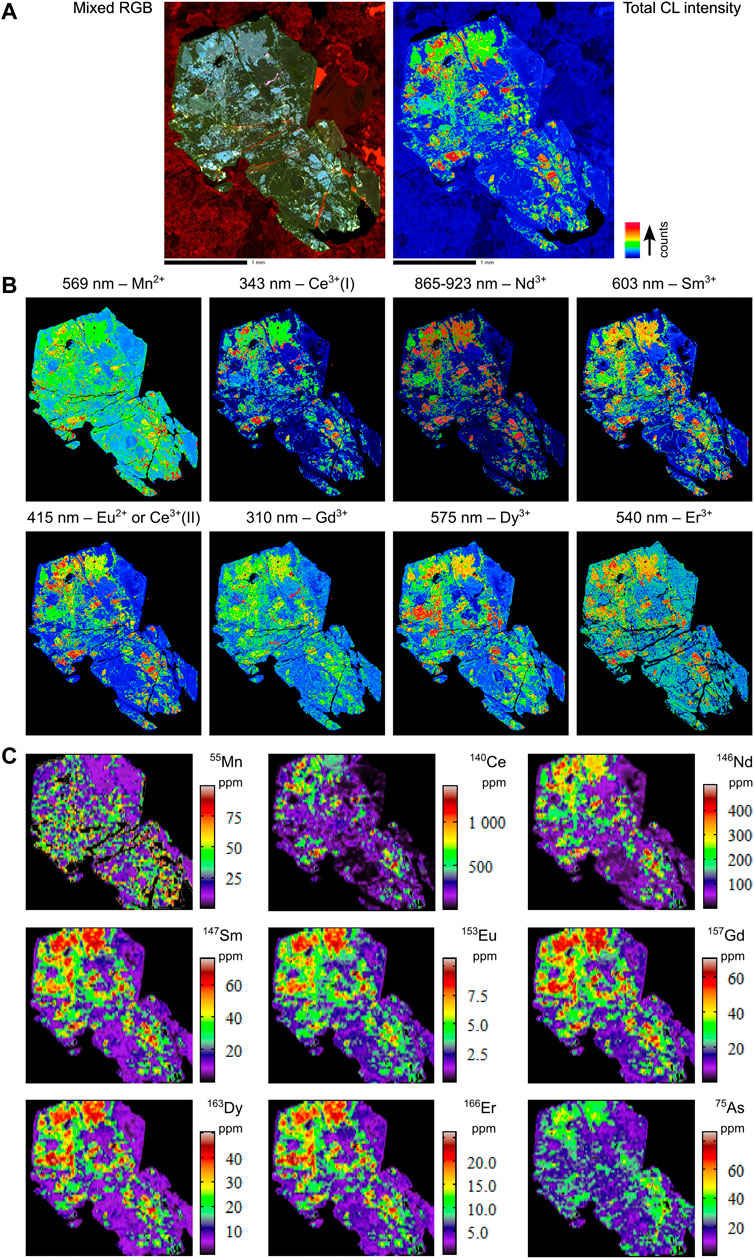
FIGURE 7. Combined hyperspectral CL and LA-ICPMS images of selected elements for sample EHMT1-1479.1. (A) Total CL intensity and mixed RGB images. (B) Hyperspectral CL images. (C) LA-ICPMS images.
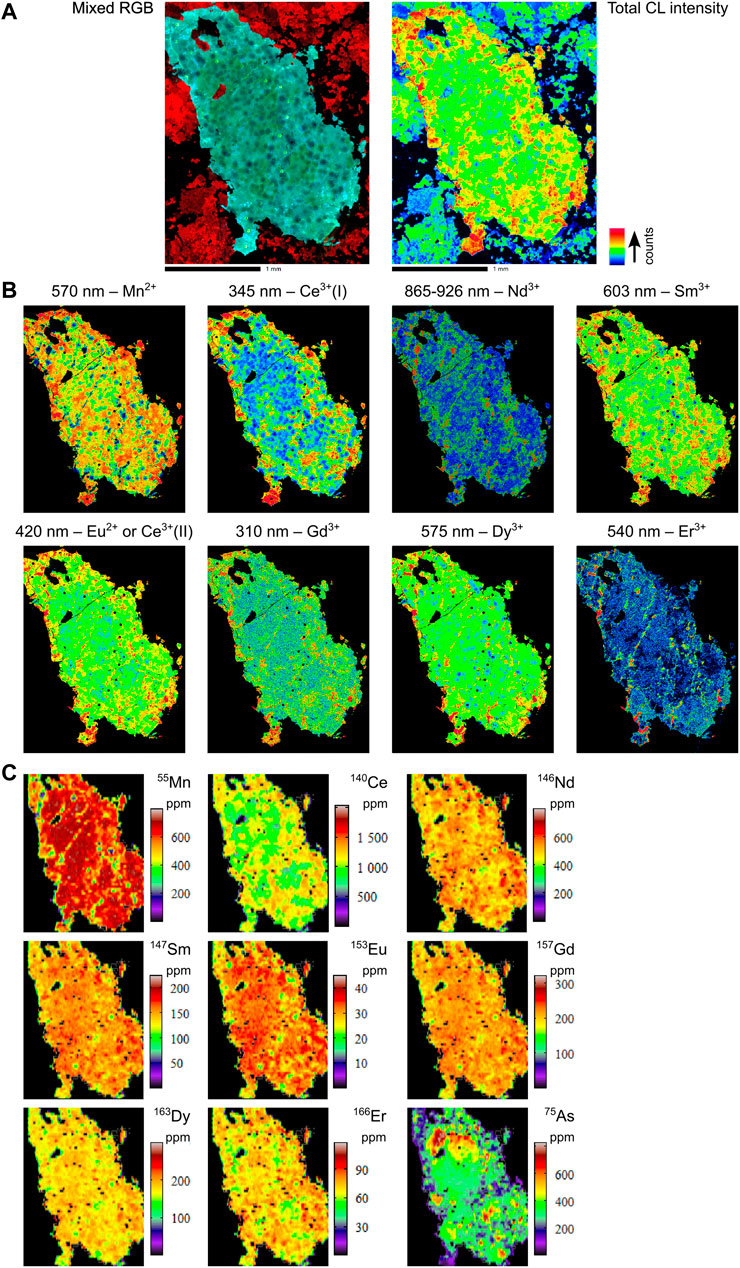
FIGURE 8. Combined hyperspectral CL and LA-ICPMS images of selected elements for sample EHM-005. (A) Total CL intensity and mixed RGB images. (B) Hyperspectral CL images. (C) LA-ICPMS images.
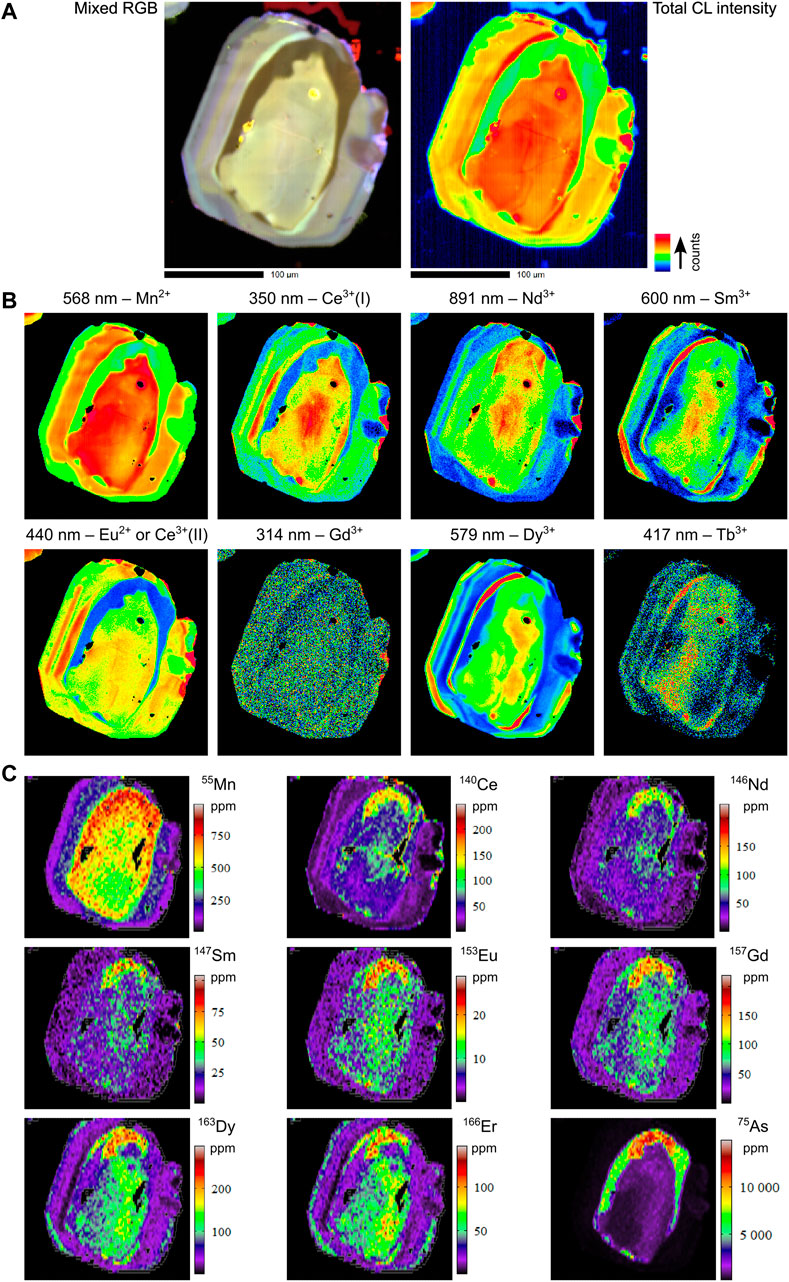
FIGURE 9. Combined hyperspectral CL and LA-ICPMS images of selected elements for sample MS_EHM92. (A) Total CL intensity and mixed RGB images. (B) Hyperspectral CL images. Note that in this sample no peak was detected for Er3+ at 540 nm, but Tb3+ peaks were identified, hence the strongest map for the strongest Tb3+ peak at 417 nm is shown here instead of the 540 nm Er3+ map. (C) LA-ICPMS images.
Further small, sharp peaks are visible to varying extents in some samples, with peak centers at 496–497 nm (width 20–30 nm FHWM), as well as 472–476, 447–455, and 405 nm (all with typical widths of 5–12 nm FWHM). None of these peaks could be confidently assigned to specific elements based on information available in the literature. The peak at around 450 nm could potentially be caused by Tm3+, but a second peak expected at around 360 nm for Tm3+ was not detected in any of the samples. Lastly, no peaks were identified for Sr2+, even though all our samples contain measurable Sr (see Supplementary Appendix A).
4.2 Apatite LA-ICPMS trace element imaging and REE+Y systematics
Laser ablation ICPMS trace element images were obtained on the same apatite grains which were characterized via hyperspectral CL imaging to assist with identifying the elements responsible for some of the spectral features, especially those with broad, overlapping emissions. Figures 6C–9C contain selected trace element images for the four samples focused on in this paper. In general terms, the elements selected for display in Figures 6C–9C are those which have corresponding features recorded in the hyperspectral CL maps (Figures 6B–9B). All other masses that were analyzed in these four LA-ICPMS images—together with the LA-ICPMS of the remaining nine samples – may be found in Supplementary Appendix A, p. 42–49.
All samples are enriched in REE+Y (REY; e.g., up to 750 ppm La, 2,500 ppm Ce, and 1,400 ppm Y; ΣREE between 0.1–0.6 wt%) as well as Na (≤600 ppm), V (≤5 ppm), Mn (≤750 ppm), As (up to 1.1 wt% in MS_EHM92; ≤800 ppm in the other three samples), Sr (≤300 ppm), Pb (≤15 ppm), Th (≤80 ppm), and U (≤10 ppm; Supplementary Appendix A. In particular, apatite from the ore zone samples EH-161 and EHM-030 have extreme As enrichments (up to 5 wt%), which, together with MS_EHM92, correlate positively with the REEs and Mn (Supplementary Appendix A, p. 42 and 45; also see Supplementary Appendix C for EPMA As measurements). Importantly, the zonation patterns in trace elements for all samples mirrors broadly the zonation patterns observed in the hyperspectral CL images.
Figures 10A–D illustrates the median chondrite normalized REE profiles for the four main samples in this study. Red lines are the median value for the entire apatite grain, whereas black lines are the median REY profile for the matrix surrounding the apatite in each LA-ICPMS image. The blue line in the REY profile for sample MS_EHM92 indicates the zone of elevated As. EHM-005 is the most REY-enriched of the four samples (relative to chondrite), whereas EHMT1-1479.1 is the most REE-depleted of the four samples. Notwithstanding these variations in chondrite-normalized enrichment, the shape of the REY profiles of the apatite grains in each sample generally parallel those in the matrix, albeit at higher levels of enrichment. In the case of MS_EHM92, the REY profiles for the apatite (both the high-As and low-As zones) have slightly more convex shapes in the MREE-HREE than the matrix, which is almost exclusively chalcopyrite. All four samples exhibit negative Eu anomalies (Eu/Eu* = 0.45–0.6).
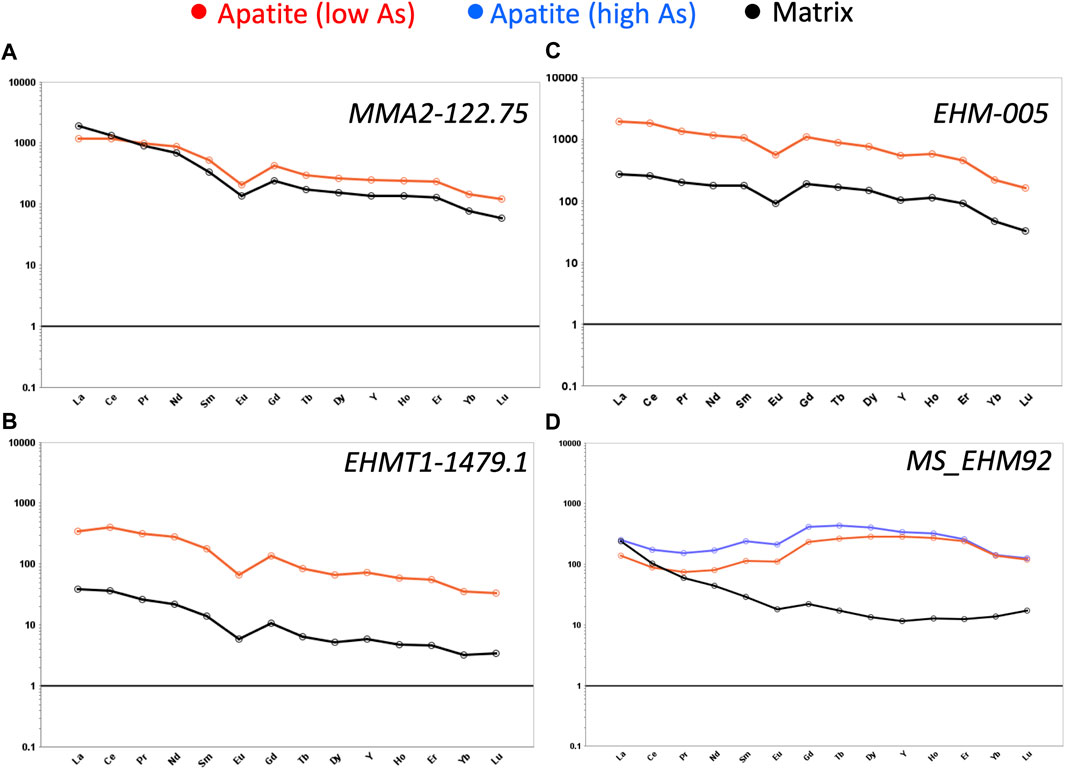
FIGURE 10. Rare earth element (REE) spider plots, normalized to chondrite (Sun and McDonough, 1995). (A) MMA2-122.75. (B) EHMT1-1479.1. (C) EHM-005. (D) MS_EHM92.
4.3 Apatite U-Pb dating
U-Pb ages for the apatite reference materials treated as unknowns, 401 apatite, McClure Mountain apatite and Durango apatite, were all well within uncertainty of their respective published ages (see Supplementary Appendix A, p. 51). Figures 11A–D contains Tera-Wasserburg U-Pb plots for four of the nine apatite samples in this study. Table 2 contains the dates, uncertainties and initial Pb isotopic compositions for these four samples.
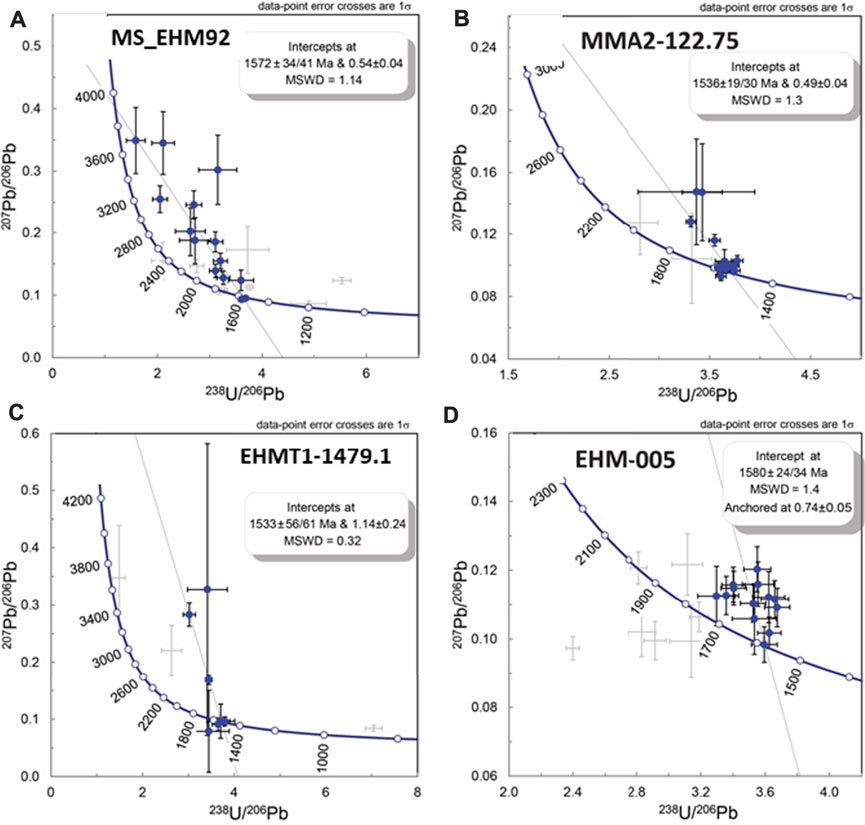
FIGURE 11. Uranium-Pb Tera-Wasserburg diagrams for apatite in samples MS_EHM-92, MMA2-122.75, EHMT1-1479.1, and EHM-005. Solid black error bars with blue circles are analyses used in the intercept date calculation, whereas the grey error bars are analyses not used due to evidence of Pb loss or addition of un-supported radiogenic Pb. Intercept date uncertainties are internal (analytical) followed by fully propagated systematic uncertainties. All samples except EHM-005 are un-anchored isochrons with the upper intercept on the 207Pb/206Pb axis stated after the intercept age. Sample EHM-005 is anchored to a 207Pb/206Pb ratio of 0.74 ± 0.05.
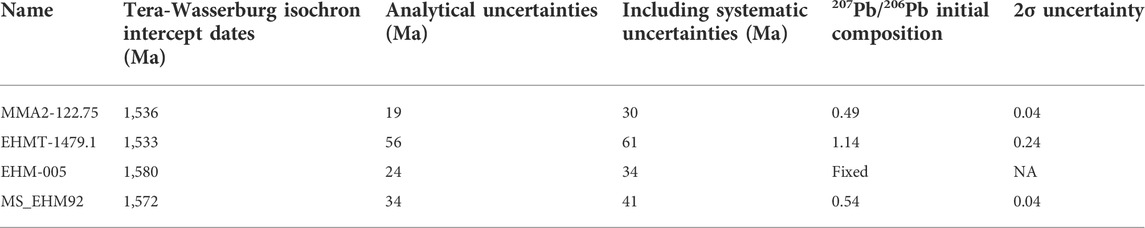
TABLE 2. Apatite U-Pb geochronology.
Apatite in this study generally showed a mixing trend between in-grown Pb from the decay of U and initial Pb. Some samples showed significant scatter on the plots, shown as gray error bars in Figures 11A–D. Furthermore, multiple analyses from each sample displayed one or more types of open system behavior, and portions of most analyses exhibited Pb loss, leading to variable U/Pb ratios and anomalously young ages that were correlated to increasing U contents (Supplementary Appendix A, p. 52, and Supplementary Appendix D). Additionally, several analyses across multiple samples showed mixtures with at least two different initial Pb components.
Several dates reported in Table 2 (EHM-005; EHMT1-1479.1; MS_EHM92) and one date reported in Appendices A and D (EH-161) are within uncertainty of previous U-Pb dates determined on two ore zone apatite samples from Ernest Henry by Cave et al. (2018), which were 1,584 ± 22 Ma and 1,587 ± 22 Ma. However, dates for samples MMA2-122.75 (Table 2), EHM-010, and EHM-030 (Supplementary Appendices A,D) are younger outside analytical uncertainties and fully propagated uncertainties (except MMA2-122.75 for fully propagated uncertainties). Notably, two proximal samples from the same drill hole (EHM-005 and EHM-010, both from drill hole EH691; Figure 2B) are only ∼60 m apart from each other but record significantly different U-Pb dates.
5 Discussion
5.1 Trace and rare Earth element constraints on apatite formation at Ernest Henry
5.1.1 REY
Chondrite-normalized REY profiles in apatite have been used previously to distinguish magmatic from hydrothermal apatite in IOCG and other types of deposits (e.g., Mao et al., 2016; Krneta et al., 2017; Mercer et al., 2020). In the case of Krneta et al. (2017)’s study of apatite within and around Olympic Dam, the REY profiles for magmatic and distal hydrothermal apatite exhibited a high degree of similarity (e.g., high LREE:HREE ratios and negative Eu anomalies), whereas apatite from the core of the ore zone was considerably different from either the magmatic or distal hydrothermal examples. In particular, the high-grade ore zone apatite from Olympic Dam contained much lower LREE and much higher MREE than either of the other two types, and it also exhibited a weak positive Eu anomaly. Hydrothermal apatite from areas of low-grade mineralization displayed hybrid REY profiles.
As displayed in Figures 10A–C, all three of our apatite samples located outside the Ernest Henry ore zone exhibit similar LREE-enriched and HREE-depleted profiles to each other, which resemble somewhat the profiles of magmatic and distal hydrothermal apatite around Olympic Dam (Krneta et al., 2017), as well as apatite from the Kiirunavaara iron oxide-apatite (IOA) deposit, Sweden (Harlov et al., 2002; Mercer et al., 2020), and apatite from the Wernecke IOCG breccia complex, Canada (Mao et al., 2016). On the other hand, the REY profiles of our three distal samples do not correlate well with the REY profiles of hydrothermal apatite from either the Pea Ridge IOA deposit or the Boss IOCG deposit, southeast Missouri (Mercer et al., 2020), but they do resemble some of those published by Cave et al. (2018) from the “Inter-Lens” region of the Ernest Henry mine. The Inter-Lens is generally thought to represent an uneconomic zone of low-grade mineralization that effectively bifurcates the high-grade ore body at depth.
In contrast to the three distal samples, the REY profile of our ore zone apatite sample (MS_EHM92) is characterized by a flatter slope (i.e., lower La/Lu ratios), lower LREE and higher MREE-HREE contents than the other three (Figure 10D). Nonetheless, its REY profile does not correspond well to that of ore zone apatite from any of the above IOCG or IOA systems. On the other hand, the REY profile of MS_EHM92 fits well with sample BC22 from Cave et al. (2018), especially the “altered dark regions” of apatite from that sample which are elevated in As but depleted in REY. Cave et al. (2018) postulated that such REY patterns in high-As apatite at Ernest Henry were produced by a hot (>250°C), acidic, saline brine (likely sedimentary in origin) that partially dissolved preexisting apatite and reprecipitated new apatite wherein the LREE were lost to the fluid.
5.1.2 Trace elements (+LREE)
In a recent review, O’Sullivan et al. (2020) synthesized apatite trace and REY data from over 350 global samples representing seven main rock types. Their statistical analyses enabled them to differentiate the samples petrogenetically on a plot of Sr/Y vs. ΣLREE (where LREE = La-Nd). Li et al. (2022) simplified this diagram into three main fields—magmatic, metamorphic/granitic, and hydrothermal CDR (coupled dissolution-reprecipitation)—which we have reproduced here (Figures 12A–D). Note that the data on these plots are taken from the LA-ICPMS images in Figures 6C–9C that is, each point on the diagrams in Figures 12A–D represents a pixel on the LA-ICPMS trace element map for that sample. Thus, these diagrams represent over 40,000 individual analyses across the four grains.
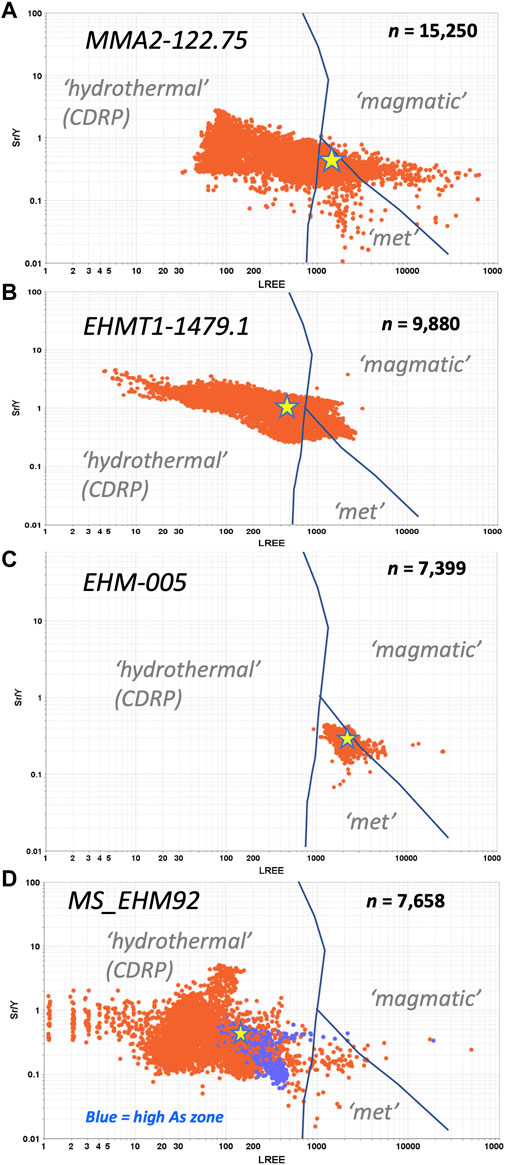
FIGURE 12. LREE (La to Nd) vs. Sr/Y diagrams. (A) MMA2-122.75; (B) EHMT1-1479.1. (C) EHM-005. (D) MS_EHM92. Stars on each diagram indicate the mean values for LREE and Sr/Y in each sample.
Of the four samples examined in this paper, only EHM-005 exhibits a constrained spatial distribution on the Sr/Y vs. LREE diagram (Figure 12C). The fact that these data are not widely dispersed across the diagram and lie close to the join between the “magmatic” and “metamorphic/S-type granitoid” fields indicates that this apatite may have an igneous origin and has not been greatly disturbed by recrystallization, despite the obvious metasomatism that has affected the host rock (i.e., albite-rich alteration). On the other hand, both MMA2-122.75 and EHMT1-1479.1 display profiles that overlap all three fields (Figures 12A,B, respectively). However, the mean values of both these samples (yellow stars) nevertheless plot within or close to the “hydrothermal (CDR)” field, which suggests that these apatites may be igneous in origin, too, but have experienced substantial recrystallization and alteration of their primary compositions. This interpretation is further supported by the lack of coherent chemical zonation in either the hyperspectral CL maps or the LA-ICPMS images for both samples. In contrast to the preceding three samples, our ore zone sample MS_EHM92 (Figure 12D) plots furthest from the “magmatic” and “metamorphic” joins in the “hydrothermal (CDR)” field. This, together with the unique MREE-enriched chondrite-normalized REY profile, points to a hydrothermal origin for apatite in this sample, consistent with its position in the ore zone.
5.2 Apatite As-REY relationships at Ernest Henry and other IOCG systems: Constraints on fluid source, or a diagnostic of intrinsic factors?
As mentioned in Section 4.3, the REY contents of our ore zone sample, MS_EHM92, reach their highest values where As concentrations are also at their highest (Figure 9C). This positive correlation between As and REY contents in ore zone apatite from Ernest Henry contrasts with the studies of Cave et al. (2018) and Krneta et al. (2017), who recorded negative As-REY relationships in their apatite samples from Ernest Henry and Olympic Dam, respectively. For example, in both Krneta et al. (2017) and Cave et al. (2018), the areas of their apatite samples which were dark in BSE images contained the highest As concentrations, whereas our samples exhibit the opposite correlation. In contrast, other previous studies of apatite from the Ernest Henry ore zone found the same positive As-BSE brightness correlations that we have documented here (e.g., Rusk et al., 2010; Liu et al., 2017).
Furthermore, as stated above in Section 5.1.1, the negative As-REY relationship observed in apatite under BSE, together with the depletion in LREE on chondrite-normalized diagrams, led Cave et al. (2018) to favor the presence of high temperature saline brines during the formation of As-rich apatite at Ernest Henry. Although independent evidence exists for the presence of such fluids in the Ernest Henry hydrothermal system (e.g., Kendrick et al., 2007), the evident contrast in compositions between the samples of Cave et al. and ours (and those of previous workers) suggests that either brines were not involved in the formation of all As-rich apatite at Ernest Henry, or that intrinsic parameters (e.g., the oxidation state of As) exerted the primary control on the uptake of As into apatite. For instance, As3+ may compete for substitution in the apatite structure with other REE3+, whereas As5+ incorporation would leave REE3+ unaffected (Liu et al., 2017). It is also possible that As-REY relationships in apatite are zoned with respect to location in the Ernest Henry system. Further studies are required to fully understand the interactions between As, REY, and apatite in Ernest Henry and other IOCG deposits globally.
5.3 Comparison of hyperspectral CL data with LA-ICPMS trace element data
The hyperspectral CL and LA-ICPMS trace element datasets collected in this study correspond generally well to one another, but they also exhibit key differences. We step through each of the four samples presented in this manuscript and refer the reader to Supplementary Appendix A for further information on these and the other five samples we analyzed.
5.3.1 MMA2-122.75
The relationship between the hyperspectral CL and LA-ICPMS data for sample MMA2-122.75 is mixed. For example, several small high-intensity areas in the hyperspectral CL maps do not have correspondingly high REE concentrations in those regions, according to the LA-ICPMS data (e.g., see CL images for Gd3+, Dy3+, Sm3+, and to a lesser extent Ce3+in Figure 6B; also see Dy3+ and 163Dy images in Figures 6B,C, respectively). Furthermore, the high-intensity areas also show an inverse correlation with 232Th and 238U, both of which are below detection in these areas (see full LA-ICPMS image for MMA2-122.75 in Supplementary Appendix A, p. 47). The radioactive decay of Th and U in apatite damages the crystal structure locally, which in turn can reduce CL response. This indicates that these areas of the apatite grain may be the most pristine and therefore have the highest REE3+ CL emissions.
On the other hand, positive correlations between the two sets of data are also present in MMA2-122.75. For instance, the upper central region of this apatite shows very low concentrations for the LREE in the LA-ICPMS maps (e.g., see the 140Ce and 146Nd images, Figure 6C), with changes in concentrations of up to three orders of magnitude between this zone and the surrounding area. However, the difference in concentrations between these two zones is less pronounced in the MREE and HREE (e.g., see 157Gd and 166Er images, Figure 6C). This correlates well with the corresponding CL maps for these elements, where the 350 and 380 nm maps assigned to Ce3+(I), and the combined 867–920 nm map for Nd3+, also show very low intensity in this region (Figure 6B). This also includes the 800 nm map (Supplementary Appendix A, p. 36), which, based on data from the literature, can be assigned to either Nd3+ or Sm3+, but given the present context, is more likely attributable to Nd3+. On the other hand, the broad CL emission at 410 nm—which can either be assigned to Eu2+ or Ce3+(II) (see discussion above)—does not show the same very low intensities, which may be an indication that this emission is due to Eu2+ rather than Ce3+.
5.3.2 EHM-005
In the case of sample EHM-005, there is an apparent inverse correlation between the two techniques: for example, the areas of highest 153Eu concentration in the LA-ICPMS image appear to correspond to the areas of lowest CL intensity for the Eu2+ peak at 420 nm, and vice versa (Figures 8B,C). One explanation for this difference is that some of the Eu in this sample may be present as Eu3+. The identification of Eu3+ would provide important constraints on the oxygen fugacity conditions of the fluid during apatite crystallization. Furthermore, Eu3+ has been identified previously via hyperspectral CL analysis in other minerals (e.g., scheelite; MacRae et al., 2009).
However, Eu3+ CL emissions are typically orders of magnitude weaker than Eu2+ emissions, and in steady-state luminescence spectroscopy (including the method used in this study), Eu3+ is often obscured by stronger emissions from luminescence centers of other elements. Indeed, Eu3+ emission lines in apatite have so far been detected by time-resolved luminescence spectroscopy alone, with centers at 574, 589–590, 617–618, 651, and 695–700 nm (Gaft et al., 2015; Fau et al., 2022). Many of our CL maps show a small, sharp peak at around 650 nm which could potentially be assigned to Eu3+ (see Supplementary Appendix A), but this peak also shows a very good correlation to other peaks assigned to Sm3+, and it does not seem likely that Sm3+ and Eu3+ would have a similar distribution. Peaks at 574 and 700 nm are strongly interfered by Dy3+ and Sm3+, and no additional peaks were detected at 590 and 618 nm.
It is also possible that the assignment of the 465 nm peak to Eu2+ (after Gaft et al., 2015) is incorrect, or that the radiation damage haloes around the thorite inclusions have caused a reduction in CL emission at that wavelength. The haloes are most clearly visible in the Ce3+ CL maps, and to a lesser extent in the other REE3+ maps. In the former case, the 465 nm peak seems to correspond more strongly to Mn2+ rather than Eu2+ in our data.
5.3.3 MS_EHM92
The ore zone sample MS_EHM92 is different again, in that the zones of highest REE concentration overlap with the zones of highest As concentration, yet the presence of As in those zones reduces the CL emission of the REEs and Mn2+ and masks their presence (e.g., see Eu2+ and 153Eu maps, Figures 9B,C). Note also that the overall concentration of REEs in sample MS_EHM92 is significantly lower than in the other three samples (approximately an order of magnitude), yet this alone does not seem to exert as strong a control on CL emission as does high As concentrations. Moreover, our data suggest that only As concentrations in excess of 5,000 ppm (i.e., the minimum value in the high As zone of MS_EHM92) are likely to effect such changes: for instance, in EHM-005, the zones of highest As concentration (∼800 ppm) exhibit no discernable change in CL emission from other areas of the grain which have far lower As (Figures 8B,C). Furthermore, samples EHM-010 and MMA3-303.3 both have maximum As concentrations that exceed 1,000 ppm (Supplementary Appendix A, p. 31, 37, 44, and 48), but neither sample contains regions that exhibit the same kind of dampened CL emission as in MS_EHM92.
5.3.4 EHMT1-1479.1
In contrast to the other three samples, there is a good degree of fit between the CL and LA-ICPMS maps of all elements in sample EHMT1-1479.1 (e.g., see Sm3+ and 147Sm images in Figures 7B,C). This is intriguing for at least one reason—namely, the fact that this sample exhibits the most chaotic internal texture of the four samples in this study, wherein the zonation patterns follow no apparent growth zones, and the distribution of trace elements is heterogeneous. Although the apatite grain EHM-005 also lacks definable internal growth zones, the distribution of trace elements in that sample is more evenly distributed than in EHMT1-1479.1 (Figure 8C).
5.4 Arsenic in Ernest Henry apatite: Geochemical vectoring characteristics, hyperspectral effects, and links to regional Fe-Mn alteration
The As-rich nature of apatite from the Ernest Henry ore zone has been known for many years (e.g., Cleverley, 2006; Rusk et al., 2010; Liu et al., 2017; Cave et al., 2018; this study), though the restricted spatial distribution of this feature has not been emphasized previously. We maintain that the peculiar affinity for As-rich apatite in the Ernest Henry ore zone makes it one of the best indicator minerals for proximity to Cu-Au targets like Ernest Henry in the Cloncurry district. The levels of As in ore zone apatite far exceed the levels of As in apatite from outside the ore zone, even if not very far outside it: for example, whereas apatite from sample EH-141—located less than 10 m outside the 0.3% copper equivalent (CuEq) grade shell–contains discrete internal zones with over 1 wt% As (Supplementary Appendix A, p. 6), sample EHM-005—which lies less than 300 m outside the ore zone – contains less than 1,000 ppm As, a difference of more than one order of magnitude (Figure 8C).
On the other hand, there is also a certain degree of asymmetry in the halo of As-rich apatite at Ernest Henry, in that apatite from drill hole EH242—located at a slightly greater radial distance from the ore zone than EHM-005 (∼350 m) but in a northeast-trending fault zone—contain As values exceeding 4,000 ppm (see Steadman, 2021). This is further underscored by apatite in drill hole MMA003, which, despite being nearly 4 km NE of the mine, nonetheless contains elevated As (∼2,000 ppm; Supplementary Appendix A, p. 48). This suggests that As-bearing apatite may also fingerprint hydrothermal fluid flux related to Cu-Au mineralization in and around Ernest Henry.
Previous researchers obtained EPMA chemical data on As-rich ore zone apatite from Ernest Henry (Cleverley, 2006; Rusk et al., 2010) and also ascertained the likely oxidation state of As in ore zone apatite via X-Ray Absorption Near-Edge Spectroscopy (XANES) and Extended X-Ray Absorption Fine Spectroscopy (EXAFS; Liu et al., 2017). However, to date, no hyperspectral CL work has been done to understand the effect of weight-percent As on the luminescence characteristics of apatite from this deposit. As shown in Figures 3D, 9B, and throughout the hyperspectral CL data in Supplementary Appendix A (with one exception), weight-percent levels of As impart an overall dampening effect on CL brightness in ore zone apatite from Ernest Henry, resulting in a pronounced dark brown/green appearance in the mixed RGB images that seems to intensify with increasing As content (Supplementary Appendix A). Furthermore, the brown/green color is consistent across all mixed RGB images of ore zone samples, regardless of the concentration of As (Supplementary Appendix A). Only one apatite grain from ore zone sample EHM-030 exhibits strong CL emission in a zone of weight-percent As, and that at a specific wavelength (600 nm, assigned to Sm3+; Supplementary Appendix A, p. 32). The reasons for this unique behavior are unclear at present.
A similar relationship between weight-percent As content and reduced CL emission in apatite was also recorded from several metamorphosed Mn deposits in Italy. Perseil et al. (2000) described this effect as “quenching” of the CL emission by As, but it is more likely a reduction of the CL emission due to the change in the apatite crystal structure caused by the incorporation of larger amounts of As (cf. Liu et al., 2017). In contrast, our apatite samples from outside the ore zone neither contain weight-percent As nor do they exhibit any correlation between As content and CL emission (e.g., see Figures 6–8).
Apatite containing weight-percent levels of As appears to be most common in metamorphosed Mn deposits, such as those studied by Perseil et al. (2000), whereas it is comparatively rare in other types of ore systems (e.g., see Rusk et al., 2010, and references therein). For instance, the highest As2O5 concentrations ever reported in ore-associated natural apatite (>13 wt%) come from a cluster of metamorphosed Mn deposits in the Swiss Alps (Brugger and Gieré, 1999). We also note that apatite with equivalent As2O5 concentrations was reported recently from an active fumarole field in the Kamchatka Peninsula, Russia (Pekov et al., 2022). Moreover, As-rich apatite is present in unmetamorphosed Fe-Mn deposits, as well. For example, a tabular body of hematite ± bixbyite mineralization near the Emmie Bluff IOCG prospect, South Australia, contains apatite with up to 2.5 wt% As (Steadman et al., 2018).
Manganese is known to be anomalous in multiple hydrothermal minerals in the vicinity of Ernest Henry (i.e., within 2 km of the mine; Rusk et al., 2010): for example, the Mn-rich epidote piemontite [Ca2(Fe,Mn,Al)3(SiO4)3(OH)] has been reported from areas south of the mine complex (J. Huntington and C. Dhnaram, pers. comm.), and Mn-rich garnet (spessartine and calderite) is a common constituent of the early hydrothermal alteration assemblages (Twyerould, 1997; Mark et al., 2006). As noted by Mark et al. (2006), the Mn-rich nature of hydrothermal alteration minerals in and around Ernest Henry is a curious aspect of this deposit, especially when compared to other IOCG deposits elsewhere in the world that lack such Mn-rich hydrothermal alteration assemblages (e.g., Olympic Dam; Candelaria; etc.). On the other hand, there are numerous deposits in the Cloncurry district that exhibit Mn-anomalous alteration assemblages, such as Cannington, Maronan, and SWAN (Bodon, 1998; Walters and Bailey, 1998; Cloutier, 2021; Spry and Teale, 2021). The former two are Broken Hill-type (BHT) Pb-Zn-Ag deposits, which are believed to form initially from seafloor exhalative processes, whereas SWAN is considered an IOCG deposit. However, unlike Ernest Henry, none of these systems is known to contain As-rich apatite, although no detailed study of apatite has, to the best of our knowledge, yet been carried out in these systems.
5.5 Apatite geochronology at Ernest Henry—Challenges, successes, and constraints on geologic processes
Most of our apatite isochrons show an initial Pb isotopic composition that is highly radiogenic, more so than those published in the Cave et al. (2018) study. However, we agree with their interpretation that such compositions likely indicate ancient re-mobilization of Pb from one or more U-rich sources. Sample EHM-005 contains the most obvious example of unsupported radiogenic Pb addition in our samples (Figure 11D, gray crosses to the left of the concordia curve; also see sample EH-161 in Supplementary Appendix A, p. 51).
If the apatite grains in MMA2-122.75, EHM-005, and EHMT1-1479.1 are igneous in origin rather than hydrothermal (as argued above in Section 5.1), the apparent problem of their young U-Pb dates must be addressed. The U-Pb crystallization dates for the Mount Fort Constantine Volcanics—the temporal equivalents of which host the apatite in our samples as well as the Ernest Henry Cu-Au orebody—range from 1,760 to 1,740 Ma, and the last known magmatic activity prior to Cu-Au mineralization in the immediate Ernest Henry area was the intrusion of the Ernest Henry diorite at 1,650 Ma. Granitic rocks of the Williams-Naraku Batholith, whose crystallization dates overlap partially with our apatite dates as well as published dates for Cu-Au mineralization at Ernest Henry (1,540–1,500 Ma; Mark et al., 2006), are no closer than 10 km west of the mine.
The U-Pb ages of all four apatite grains in this study (including uncertainties) are such that a hydrothermal interpretation of their origins is permissible. However, given the other geochemical evidence presented in this paper, we are inclined to interpret our ore zone sample MS_EHM92 alone as hydrothermal in origin, whereas we interpret the three distal samples as magmatic in origin. Consequently, we view the latter three samples’ U-Pb ages as adulterated, likely by hydrothermal fluids before, during, or after Cu-Au mineralization. This interpretation differs somewhat from that of Cave et al. (2018), who posited a pre-ore timing and metamorphic/hydrothermal origin for the apatite samples in their study. However, the fact that our ages are within error of theirs makes it possible that both their samples and ours formed and/or were reformed in the same event (or series of events). The combined utilization of more precise dating methods (e.g., SIMS) and other mineral systems that are less susceptible to isotopic overprinting are required to resolve the complexities observed in apatite from Ernest Henry and the surrounding area.
6 Conclusion
The combined hyperspectral CL, LA-ICPMS trace element imaging, and U-Pb geochronological study of apatite from the Ernest Henry IOCG deposit has yielded important petrogenetic information about this mineral in the context of a large, long-lived magmatic-hydrothermal ore system. Hyperspectral CL and LA-ICPMS trace element mapping have revealed complex internal textures that exhibit the effects of coupled dissolution-reprecipitation processes (CDRP). Furthermore, these processes have led to the creation and/or destruction of specific internal zones, leading to the loss, gain, and/or redistribution of trace elements and changes in CL response. The alteration of original chemistries via CDRP also likely redistributed radiogenic isotopes and facilitated the growth and incorporation of high U and/or Th minerals in some samples, leading to complex U-Pb systematics. The high As content of ore zone apatite samples at Ernest Henry potentially points to a geochemical link between this deposit and other deposits in the Cloncurry district that contain anomalously Mn-rich mineralogy in their hydrothermal alteration assemblages, such as Cannington. Finally, the multi-faceted complexity of apatite at Ernest Henry underscores the need for the utilization of multiple techniques at multiple scales to unlock the information this mineral contains (Williams et al., 2005; Schlegel et al., 2022).
Data availability statement
The datasets presented in this study can be found in online repositories. The names of the repository/repositories and accession number(s) can be found in the article/Supplementary Material. Data related to the LA-ICPMS maps may be obtained by contacting the senior author (see title page for contact details).
Author contributions
JS—conception and writing of manuscript; drafting of figures. KG—conception and writing of manuscript; hyperspectral CL; drafting of figures. JT—U-Pb geochronology; writing of manuscript. CM–hyperspectral CL interpretation. IB—U-Pb geochronology and LA-ICPMS trace element imaging; writing of manuscript. MH—drafting of figures.
Acknowledgments
JS would like to thank the Geological Survey of Queensland (Department of Resources) for their financial and logistical support of this work through the project, “Mineral Geochemistry Vectoring: Uncovering Northwest Queensland’s Hidden Potential,” funded through the Strategic Resources Exploration Program. Special thanks to Vladimir Lisitsin, Courteney Dhnaram, Helen Degeling, and Fred von Gnielinski for their support and input throughout. Thanks to Dr. Jim Austin (CSIRO) for access to the “UNCOVER: Cloncurry” sample suite. JS also thanks Shaun Barker for the initial inspiration to undertake this work. The reviews of Claire Wade and Liam Courtney-Davies helped to improve the quality of the manuscript significantly. Finally, the patience of Guest Editor Cristiana Ciobanu cannot be gainsaid.
Conflict of interest
Authors JS, IB, and MH were employed by Centre for Ore Deposit and Earth Sciences and author CM was employed by Commonwealth Scientific and Industrial Research Organisation (CSIRO).
The remaining authors declare that the research was conducted in the absence of any commercial or financial relationships that could be construed as a potential conflict of interest.
Publisher’s note
All claims expressed in this article are solely those of the authors and do not necessarily represent those of their affiliated organizations, or those of the publisher, the editors and the reviewers. Any product that may be evaluated in this article, or claim that may be made by its manufacturer, is not guaranteed or endorsed by the publisher.
Supplementary material
The Supplementary Material for this article can be found online at: https://www.frontiersin.org/articles/10.3389/feart.2022.926114/full#supplementary-material
Supplementary Appendix A | Supplementary Data file, incl. SEM/BSE images, extra CL/ICPMS data, etc.
Supplementary Appendix B | Fitted CL peak table.
Supplementary Appendix C | EPMA spot analyses.
Supplementary Appendix D | Full U-Pb geochronology data table.
References
Apukhtina, O. B., Kamenetsky, V. S., Ehrig, K., Kamenetsky, M. B., McPhie, J., Maas, R., et al. (2016). Postmagmatic magnetite-apatite assemblage in mafic intrusions: A case study of dolerite at olympic Dam, south Australia. Contrib. Mineral. Pet. 171 (2). doi:10.1007/s00410-015-1215-7
Baker, J., Peate, D., Waight, T., and Meyzen, C. (2004). Pb isotopic analysis of standards and samples using a 207Pb–204Pb double spike and thallium to correct for mass bias with a double-focusing MC-ICP-MS. Chem. Geol. 211, 275–303. doi:10.1016/j.chemgeo.2004.06.030
Belousova, E. A., Walters, S., Griffin, W. L., and O’Reilly, S. Y. (2001). Trace-element signatures of apatites in granitoids from the Mt Isa Inlier, northwestern Queensland. Aust. J. Earth Sci. 48, 603–619. doi:10.1046/j.1440-0952.2001.00879.x
Belousova, E. A., Griffin, W. L., O’Reilly, S. Y., and Fisher, N. I. (2002). Apatite as an indicator mineral for mineral exploration: Trace element compositions and their relationship to host rock type. J. Geochem. Explor. 76, 45–69. doi:10.1016/s0375-6742(02)00204-2
Blasse, G. (1975). Influence of local charge compensation on site occupation and luminescence of apatites. J. Solid State Chem. 14, 181–184. doi:10.1016/0022-4596(75)90009-2
Bodon, S. (1998). Paragenetic relationships and their implications for ore Genesis at the Cannington Ag-Pb-Zn deposit, Mount Isa inlier, Queensland, Australia. Econ. Geol. 93, 1463–1488. doi:10.2113/gsecongeo.93.8.1463
Bouzari, F., Hart, C. J. R., Bissig, T., and Barker, S. (2016). Hydrothermal alteration revealed by apatite luminescence and chemistry: A potential indicator mineral for exploring covered porphyry copper deposits. Econ. Geol. 111, 1397–1410. doi:10.2113/econgeo.111.6.1397
Brugger, J., and Gieré, R. (1999). As, Sb, Be, and Ce enrichment in minerals from a metamorphosed Fe-Mn deposit, Val Ferrera, eastern Swiss Alps. Can. Min. 37, 37–52.
Cave, B. W., Lilly, R., Glorie, S., and Gillespie, J. (2018). Geology, apatite geochronology, and geochemistry of the ernest Henry inter-lens: Implications for a re-examined deposit model. Minerals 8, 405. doi:10.3390/min8090405
Chew, D. M., Petrus, J. A., and Kamber, B. S. (2014). U–Pb LA–ICPMS dating using accessory mineral standards with variable common Pb. Chem. Geol. 363, 185–199. doi:10.1016/j.chemgeo.2013.11.006
Chew, D. M., and Spikings, R. A. (2015). Geochronology and thermochronology using apatite: Time and temperature, lower crust to surface. Elements 11, 189–194. doi:10.2113/gselements.11.3.189
Cleverley, J. S. (2006). Using the chemistry of apatite to track fluids in Fe-oxide Cu-Au systems. Geochim. Cosmochim. Acta 70, A105. doi:10.1016/j.gca.2006.06.124
Cloutier, J. (2021). Geology and mineral chemistry at the Mt Elliot, Corbould, and SWAN deposits. Brisbane, QLD: Internal report to Geological Survey of Queensland, 47.
Danyushevsky, L. V., and Norris, C. A. (2018). Software and protocols for improved accuracy of LA-ICP-MS analysis via quantification of matrix effects. Goldsch. Conf. Abs. 2018, 513.
Fau, A., Beyssac, O., Gauthier, M., Panczer, G., Gasnault, O., Meslin, P-Y., et al. (2022). Time-resolved Raman and luminescence spectroscopy of synthetic REE-doped hydroxylapatites and natural apatites. Am. Mineral. 107, 1341–1352. doi:10.2138/am-2022-8006
Gaft, M., Reisfeld, R., and Panczer, G. (2015). Modern luminescence spectroscopy of minerals and materials. Second edition. Springer Mineralogy, 606. doi:10.1007/978-3-319-24765-6
Harlov, D. E., Andersson, U. B., Förster, H-J., Nyström, J. O., Dulski, P., and Broman, C. (2002). Apatite–monazite relations in the Kiirunavaara magnetite–apatite ore, northern Sweden. Chem. Geol. 191, 47–72. doi:10.1016/s0009-2541(02)00148-1
Horstwood, M. S. A., Kosler, J., Gehrels, G., Jackson, S. E., McLean, N. M., Paton, C., et al. (2016). Community-derived standards for LA-ICP-MS U-(Th-)Pb geochronology – uncertainty propagation, age interpretation and data reporting. Geostand. Geoanal. Res. 40, 311–332. doi:10.1111/j.1751-908X.2016.00379.x
Hughes, J. M., and Rakovan, J. F. (2015). Structurally robust, chemically diverse: Apatite and apatite supergroup minerals. Elements 11, 165–170. doi:10.2113/gselements.11.3.165
Jochum, K. P., Weis, U., Stoll, B., Kuzmin, D., Yang, Q., Raczek, I., et al. (2011). Determination of reference values for NIST SRM 610-617 glasses following ISO guidelines. Geostand. Geoanal. Res. 35, 397–429. doi:10.1111/j.1751-908x.2011.00120.x
Kempe, U., and Götze, J. (2002). Cathodoluminescence (CL) behaviour and crystal chemistry of apatite from rare-metal deposits. Mineral. Mag. 66, 151–172. doi:10.1180/0026461026610019
Kendrick, M. A., Mark, G., and Phillips, D. (2007). Mid-crustal fluid mixing in a proterozoic Fe oxide–Cu–Au deposit, ernest Henry, Australia: Evidence from Ar, Kr, Xe, Cl, Br, and I. Earth Planet. Sci. Lett. 256, 328–343. doi:10.1016/j.epsl.2006.12.032
Kirkland, C. L., Yakymchuk, C., Szilas, K., Evans, N., Hollis, J., McDonald, B., et al. (2018). Apatite: A U-Pb thermochronometer or geochronometer? Lithos 318-319, 143–157. doi:10.1016/j.lithos.2018.08.007
Krneta, S., Ciobanu, C. L., Cook, N. J., Ehrig, K., and Kontonikas-Charos, A. (2016). Apatite at olympic Dam, south Australia: A petrogenetic tool. Lithos 262, 470–485. doi:10.1016/j.lithos.2016.07.033
Krneta, S., Ciobanu, C. L., Cook, N. J., Ehrig, K., and Kontonikas-Charos, A. (2017). Rare Earth element behaviour in apatite from the Olympic Dam Cu-U-Au-Ag deposit, South Australia. Minerals 7, 135. doi:10.3390/min7080135
Lee, J. K. W., Williams, I. S., and Ellis, D. J. (1997). Pb, U, and Th diffusion in natural zircon. Nature 390, 159–162. doi:10.1038/36554
Li, J., Ye, C., and Ying, J. (2022). In Situ geochemical and Sr-Nd isotope analyses of apatite from the Shaxiongdong alkaline-carbonatite complex (South Qinling, China): Implications for magma evolution and mantle source. Minerals 12. doi:10.3390/min12050587
Liu, W., Mei, Y., Etschmann, B., Brugger, J., Pearce, M., Ryan, C. G., et al. (2017). Arsenic in hydrothermal apatite: Oxidation state, mechanism of uptake, and comparison between experiments and nature. Geochim. Cosmochim. Acta 196, 144–159. doi:10.1016/j.gca.2016.09.023
MacRae, C. M., Wilson, N. C., and Brugger, J. (2009). Quantitative cathodoluminescence mapping with application to a kalgoorlie scheelite. Microsc. Microanal. 15, 222–230. doi:10.1017/S1431927609090308
MacRae, C. M., and Wilson, N. C. (2008). Luminescence database I—minerals and materials. Microsc. Microanal. 14, 184–204. doi:10.1017/S143192760808029X
Mao, M., Rukhlov, A. S., Rowins, S. M., Spence, J., and Coogan, L. A. (2016). Apatite trace element compositions: A robust new tool for mineral exploration. Econ. Geol. 111, 1187–1222. doi:10.2113/econgeo.111.5.1187
Mark, G., Oliver, N. H. S., Williams, P. J., Valenta, R. K., and Crookes, R. A. (2000). “The evolution of the Ernest Henry Fe oxide-Cu-Au hydrothermal system,”. Hydrothermal iron oxide copper-gold and related deposits: A global perspective. Editor T. M. Porter, 1, 123–136.
Mark, G., Oliver, N. H. S., and Williams, P. J. (2006). Mineralogical and chemical evolution of the Ernest Henry Fe oxide-Cu-Au ore system, Cloncurry district, northwest Queensland, Australia. Min. Depos. 40, 769–801. doi:10.1007/s00126-005-0009-7
McDowell, F. W., McIntosh, W. C., and Farley, K. A. (2005). A precise 40Ar–39Ar reference age for the Durango apatite (U–Th)/He and fission-track dating standard. Chem. Geol. 214, 249–263. doi:10.1016/j.chemgeo.2004.10.002
Mercer, C. N., Watts, K. E., and Gross, J. (2020). Apatite trace element geochemistry and cathodoluminescent textures – A comparison between regional magmatism and the Pea Ridge IOAREE and Boss IOCG deposits, southeastern Missouri iron metallogenic province, USA. Ore Geol. Rev. 116, 103129. doi:10.1016/j.oregeorev.2019.103129
O‘Sullivan, G., Chew, D., Kenny, G., Henrichs, I., and Mulligan, D. (2020). The trace element composition of apatite and its application to detrital provenance studies. Earth. Sci. Rev. 201, 103044. doi:10.1016/j.earscirev.2019.103044
Page, R. W., and Sun, S-S. (1998). Aspects of geochronology and crustal evolution in the Eastern Fold Belt, Mt Isa inlier. Aust. J. Earth Sci. 45, 343–361. doi:10.1080/08120099808728396
Pekov, I. V., Koshlyakova, N. N., Zubkova, N. V., Krzatala, A., Belakovskiy, D. A., Galuskina, I. O., et al. (2022). Pliniusite, Ca5(VO4)3F, a new apatite-group mineral and the novel natural ternary solid-solution system pliniusite-svabite-fluorapatite. Am. Mineral. 107, 1626–1634. doi:10.2138/am-2022-8100
Perseil, E-A., Blanc, P., and Ohnenstetter, D. (2000). As-bearing fluorapatite in manganiferous deposits from St. Marcel-Praborna, Val D’Aosta, Italy. Can. Mineralogist 38, 101–117. doi:10.2113/gscanmin.38.1.101
Roeder, P. L., MacArthur, D., Ma, X-P., Palmer, G. R., and Mariano, A. N. (1987). Cathodoluminescence and microprobe study of rare Earth elements in apatite. Am. Min. 72, 801–811.
Rusk, B., Oliver, N., Cleverley, J., Blenkinsop, T., Zhang, D., Williams, P., et al. (2010). “Physical and chemical characteristics of the Ernest Henry iron oxide copper gold deposit, Australia: Implications for IOCG Genesis,”. Hydrothermal iron oxide copper-gold and related deposits: A global perspective. Editor T. M. Porter, 3, 201–218.
Schlegel, T. U., Birchall, R., Shelton, T. D., and Austin, J. R. (2022). Mapping the mineral zonation at the Ernest Henry iron oxide copper-gold deposit Vectoring to Cu-Au mineralization using modal mineralogy. Econ. Geol. 117, 485–494. doi:10.5382/econgeo.4915
Schoene, B., and Bowring, S. A. (2006). U–Pb systematics of the McClure mountain syenite: Thermochronological constraints on the age of the 40Ar/39Ar standard MMhb. Contrib. Mineral. Pet. 151, 615–630. doi:10.1007/s00410-006-0077-4
Spry, P. G., and Teale, G. S. (2021). A classification of broken hill-type deposits: A critical review. Ore Geol. Rev. 130, 103935. doi:10.1016/j.oregeorev.2020.103935
Steadman, J. A., Large, R. R., Gregory, D. D., Meffre, S., Cracknell, M. J., Kuhn, S., et al. (2018). Summary and final report on pyrite, magnetite, and hematite mineral geochemistry, South Australia. Adelaide, SA: Internal report to Geological Survey of South Australia, 30.
Steadman, J. A. (2021). Mineralogical and trace element characterization of the ernest Henry Cu-Au deposit, Mt Isa inlier, Northwest Queensland. Brisbane, QLD: Internal report to Geological Survey of Queensland, 35.
Thompson, J. M., Meffre, S., Maas, R., Kamenetsky, V., Kamenetsky, M., Goemann, K., et al. (2016). Matrix effects in Pb/U measurements during LA-ICP-MS analysis of the mineral apatite. J. Anal. At. Spectrom. 31, 1206–1215. doi:10.1039/C6JA00048G
Twyerould, S. (1997). The geology and genesis of the Ernest Henry Fe-Cu-Au deposit, northwest Queensland, Australia. Eugene, OR: Unpublished PhD thesis, University of Oregon, 520.
Walters, S., and Bailey, A. (1998). Geology and mineralization of the Cannington Ag-Pb-Zn deposit: An example of broken hill-type mineralization in the eastern succession, Mount Isa inlier, Australia. Econ. Geol. 93, 1307–1329. doi:10.2113/gsecongeo.93.8.1307
Waychunas, G. A. (2002). Apatite luminescence. Rev. Min. Geochem. 78, 175–217. doi:10.2138/rmg.2014.78.5
Keywords: apatite, hyperspectral cathodoluminescence, IOCG, LA-ICPMS, arsenic
Citation: Steadman JA, Goemann K, Thompson JM, MacRae CM, Belousov I and Hohl M (2022) Hyperspectral cathodoluminescence, trace element, and U-Pb geochronological characterization of apatite from the Ernest Henry iron oxide copper-gold (IOCG) deposit, Cloncurry district, Queensland. Front. Earth Sci. 10:926114. doi: 10.3389/feart.2022.926114
Received: 22 April 2022; Accepted: 16 August 2022;
Published: 04 October 2022.
Edited by:
Cristiana Liana Ciobanu, University of Adelaide, AustraliaReviewed by:
Claire Wade, Geological Survey of South Australia, AustraliaLiam Courtney-Davies, Curtin University, Australia
Copyright © 2022 Steadman, Goemann, Thompson, MacRae, Belousov and Hohl. This is an open-access article distributed under the terms of the Creative Commons Attribution License (CC BY). The use, distribution or reproduction in other forums is permitted, provided the original author(s) and the copyright owner(s) are credited and that the original publication in this journal is cited, in accordance with accepted academic practice. No use, distribution or reproduction is permitted which does not comply with these terms.
*Correspondence: Jeffrey A. Steadman, SmVmZi5TdGVhZG1hbkB1dGFzLmVkdS5hdQ==