 Bin Zeng
 Yucong Zhu1
- 1School of River and Ocean Engineering, Chongqing Jiaotong University, Chongqing, China
- 2Key Laboratory of Geological Hazards Mitigation for Mountainous Highway and Waterway, Chongqing Municipal Education Commission, Chongqing Jiaotong University, Chongqing, China
Double-O-tube shield tunneling technology has gained extensive attention due to saving space and the high cost-effectiveness of the underground construction method. Estimating and predicting DOT shield tunneling-induced soil displacements is essential to prevent damage to nearby aboveground and underground structures in densely populated urban areas. This study develops a device for modeling DOT shield tunneling based on transparent soil technology and image processing technique and investigates soil displacement during the construction process of the DOT shield tunnel, which is considered in the uniform convergence mode (UCM) of soil loss. Meanwhile, the soil displacement under the non-uniform convergence mode (NCM) is analyzed contrastively using a two-dimension particle flow code (PFC2D). The results show that horizontal displacements increase gradually when the shield tail passes the monitoring face, while settlements increase rapidly. The maximum horizontal displacement of the surface and the maximum surface settlement under NCM are slightly larger than those under UCM. A trapezoid-shaped failure pattern of soil is experienced at three tunnel depths. The maximum soil displacement under NCM is 1.93, 2.10, and 2.05 times, respectively, as much as that under UCM, corresponding to H/D (the ratio of the tunnel depth to the tunnel diameter) = 1.0, 1.5, and 2.0. The soil arch effect above DOT tunnels arises as the DOT tunnel depth increases. Moreover, the experimental and numerical results are adopted to assess the validity of the proposed model, which indicates that the proposed model is close to the test results of the disturbance zone on DOT tunnels.
1 Introduction
With the rapid development of urban underground, the double-o-tube (DOT) shield tunneling method, which can be applied to construct two tunnels synchronously using one shield machine, is gradually used in the Asian area. For instance, Japanese construction teams used this method for the first time in 1989. Moreover, according to the summary of Fang et al. (2012), twenty DOT shield tunneling projects were completed successfully in Japan (Oda and Yonei, 1993; Kanai, 2004) and China (Chow, 2006; Shen et al., 2009; Zeng and Huang, 2016) from 1989 to 2010.
Tunneling-induced soil displacements are inevitable and unexpected in DOT shield tunneling, affecting surface and subsurface structures (Mair et al., 2013). The factors of tunneling-induced soil displacement are complex, mainly including tunnel geometry, excavation method, tunnel depth, geological conditions (Cui et al., 2021; Zhou et al., 2021; Li et al., 2022), shield machines (He and Kusiak, 2017; Li et al., 2021a; Li et al., 2021b), and workmanship quality (Atkinson and Potts, 1977). Furthermore, the relationships between soil displacements and these parameters are nonlinear (Attewell and Farmer, 1974). In order to get over the issues, related research about tunneling-induced soil displacement has been made as an attempt to investigate its mechanism. Methods for solving the problem may be classified into four categories: field monitoring methods, analytical methods, experimental methods, and numerical methods. Historically, field monitoring methods played an essential role in developing criteria for predicting expected surface settlements, including the Gaussian distribution curve proposed first by Peck (1969) and its improvements (O'Reilly and New, 1982; Mair et al., 1995). Analytical methods, such as the complex variable method (Verruijt, 1997; Zhang et al., 2011) and the stochastic medium theory (Yang et al., 2004), are always used to predict tunneling-induced soil displacement. The centrifuge model method is used to shrink the scale of practical engineering to simulate the process of tunnel excavation, which is widely used in physical method tests (Franza et al., 2019; Giardina et al., 2020). Finite element analysis, a typical numerical simulation method, can be used to consider the nonlinear interaction between the tunnel and the soil to estimate soil displacements due to tunneling (Zhang et al., 2012; Miro et al., 2015). In addition, other numerical simulations (Chen et al., 2016) and theoretical analyses (Iskander, 2010; Zeng et al., 2016) have been applied to predict and estimate soil displacements due to DOT shield tunneling. Centrifuge modeling also played a crucial role in estimating soil displacements in the past 40 decades. Nevertheless, it merely measures soil displacements at the model boundaries (Ahmed and Iskander, 2011).
Therefore, the method adopted in this study makes use of a transparent soil technique, image processing technology, and discrete element method (DEM) to measure soil displacement response attributable to the DOT shield tunneling. A transparent soil modeling system considering three buried depths was used to simulate the process of the DOT shield tunneling under the uniform convergence mode (UCM). Through this modeling system, the process of the soil displacement induced by DOT shield tunneling can be monitored. The tunnel lining structure is displaced downward by gravity and contacts the lower soil during actual construction, resulting in a non-uniform convergence mode rather than a uniform convergence mode (Loganathan and Poulos, 1998). Thus, a two-dimension particle flow code (PFC2D) was used to simulate the DOT shield tunneling models under the non-uniform convergence mode (NCM).
2 Methods
2.1 Transparent Soil Testing Technique
2.1.1 Experimental Apparatus
The model testing system is shown in Figure 1, which is used to monitor soil displacements during DOT shield tunneling, including a plexiglass model tank, a computer, the optical platform, a disk laser, a charge-coupled device (CCD) high-speed industrial camera, and processing software for particle image velocimetry (PIV) of digital images (Figure 1A). The disk laser, EP532-3W, has a 10–25° light angle and less than 1 mm thickness. The CCD high-speed industrial camera, Lumenera LT425, is of a high resolution of 2048 × 2048 pixels, an active area of 11.264 × 11.264 mm, a pixel size of 5.5 × 5.5 μm, a frame rate of 90 FPS at full resolution, and a sensitivity of 13.7 DN/(NJ/cm2). A camera control program can continuously record the soil displacement process during DOT tunneling. The optical platform is made of ferromagnetic stainless steel, which has a core structure with honeycomb support on top that provides considerable resistance to the interference, as shown in Figure 1B. PIV software can be used to post-process photographs that are obtained by modeling. According to measure data summarized by Sadek (2002) and Ni et al. (2010), the precision of PIV non-interference technology is competent to complete geotechnical modeling.
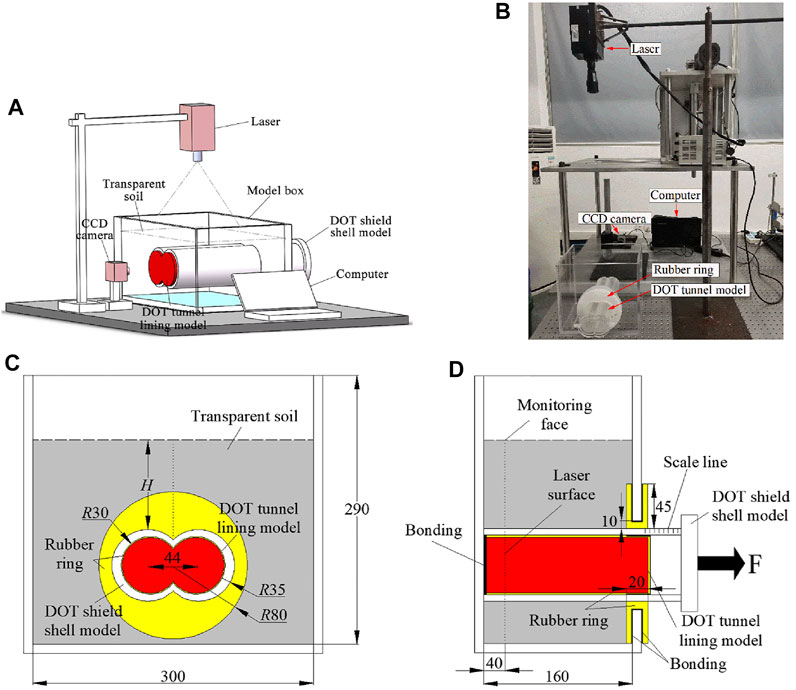
FIGURE 1. Test setup and model details (unit: mm). (A) Schematic diagram of the transparent soil model testing system; (B) picture of the test setup; (C) schematic diagram of model details in front view; (D) schematic diagram of model details in horizontal view.
The physical model size is based on the DOT shield tunnel project in Aichi Prefecture, Japan. In order to effectively reduce the boundary effects of the model, it is dimensioned approximately 1:100 to the geometric prototype. As shown in Figure 1C and 1 day, a Plexiglas acrylic model with 320 mm long, 180 mm wide, and 300 cm high is used to contain the transparent soil, in which the thickness of each wall is 10 mm. In addition, a DOT-shaped hole is designed at the front of the model tank, which has two circles with a diameter of 90 mm. Both circle centers are 98 mm from the bottom of the tank and 128 mm from the sidewall, and the distance between the two circle centers is 44 mm. The DOT tunnel lining model, a DOT cylinder at a red area, is bonded to the back of the model tank from the inside out, with 200 mm length and 60 mm diameter, as shown in Figure 1D. The DOT tunnel lining model is covered with a rubber film of negligible strength, a 0.5 mm thick layer, which is used to prevent the pore flow of liquid and fused quartz into the inside of the DOT shield shell model. There is a 70-mm-diameter DOT-shaped rubber ring (yellow area) wrapped around the hole’s edge, which is used to prevent the pore flow liquid from leaking. The DOT shield shell model with 70 mm diameter and 10 mm thickness resembles a DOT-shaped semi-closed sleeve, representing the ground loss of tail void and over-excavation void (i.e., UCM), covered on the DOT tunnel lining model.
2.1.2 Transparent Soil Material
Mannheimer and Oswald. (1993) developed a genuinely transparent mud, which was used to study non-Newtonian flow problems in soils. Further analysis of the consolidation properties revealed that the geotechnical properties of this hybrid material were similar to those of natural sand, which provided ideas for later research on transparent soil. In recent years, the rapid development of transparent soil materials that enable the observation of displacement fields within the medium and PIV technique has been successfully applied to research tunnels (Ahmed and Iskander, 2012), pile foundations (Chen et al., 2014), and landslides (Wang et al., 2018).
The transparent soil material adopted in this experiment is fused quartz, the No. 15 mineral white oil, and n-dodecane. Fused quartz has a particle size of 0.5–1 mm, maximum dry density of 1.381 g/cm3, minimum of 1.087 g/cm3, relative density of 54%, and the internal friction angle was 37.6° (Table 1). Moreover, the size distribution curve for the transparent soil is shown in Figure 2A. The No. 15 mineral white oil and n-dodecane were selected to prepare pore flow liquid, which was mixed with the fused quartz to complete the transparent soil (Kong et al., 2016). In this experiment, the mass ratio of the pore flow liquid is 5.5:1 (the 15th mineral white oil and n-dodecane) and has a refractive index of 1.4585, which ensures that the transparent soil is configured to a higher transparent depth. For instance, the apparent word “soil” can be lightly observed through the transparent soil with a refractive index of 1.4585, as shown in Figure 2B.
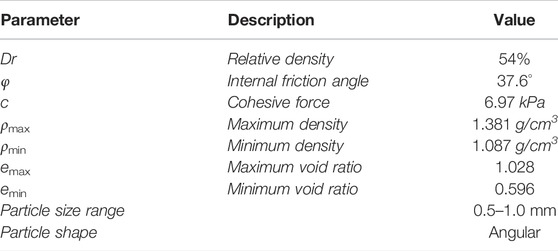
TABLE 1. Physical and mechanical parameters of the transparent soil.
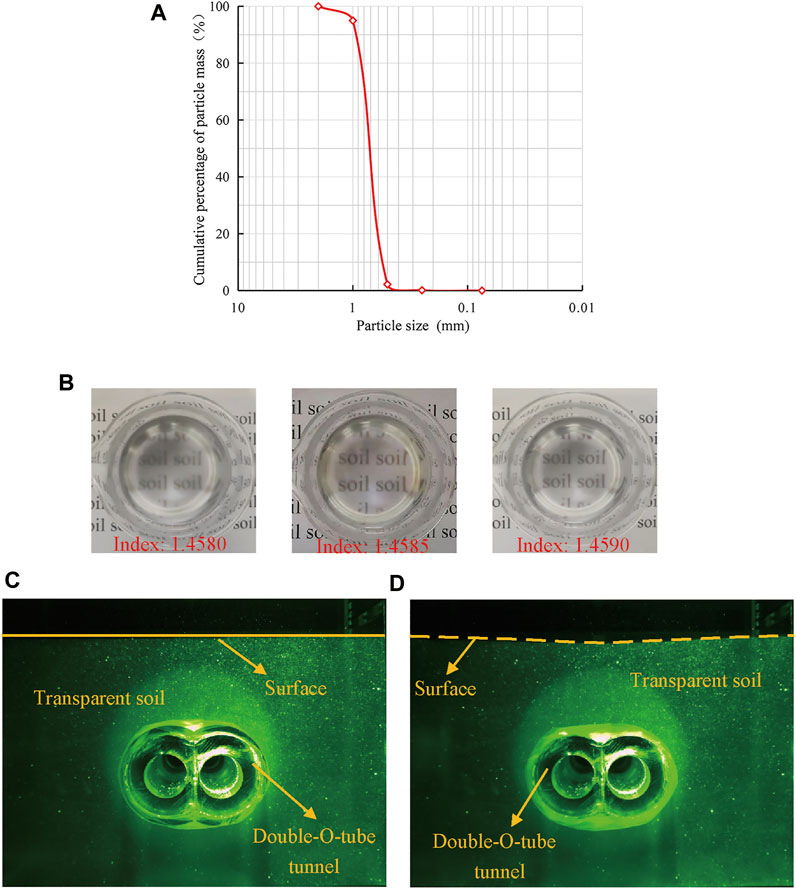
FIGURE 2. Particle size distribution curve, transparency, and comparison of tunneling. (A) Particle size distributions of transparent granular materials; (B) transparency of transparent soil with different refractive indexes; (C) model before tunneling; (D) model after tunneling.
2.1.3 Testing Process
In this study, three relative tunnel depth tests of the DOT shield tunnel (H/D, the ratio of the tunnel depth to the tunnel diameter) were carried out with H/D = 1.0, 1.5, and 2.0, while the size of the DOT tunnel section remains the same. The testing process can be divided into three sections: test preparation, test installation, and test operation. During the test preparation, the transparent soil is prepared in the model tank and then placed in a vacuum device to remove visible air bubbles inside for improving transparency; 40 kg of weights are placed on the surface of transparent soil to consolidate for 12 h. Then, a disk laser and a CCD camera must be installed in the test installation above and behind the model box, respectively. At last, the test operation is carried out in the dark according to the digital image correlation (DIC) principle. The monitoring face is set at the position of the laser face, 40 mm from the rear of the model box (Figure 2C). Furthermore, the DOT shield shell model is slowly and carefully extracted to simulate the process of DOT shield tunneling and every excavation footage length is 0.05D, recorded as 2D. After each extraction has been accomplished, it should be left for 20 min until the transparent soil movement has been completed. The apparent surface settlement at H/D = 1.0 is witnessed from the laser face, as shown in Figure 2D.
2.2 DEM Numerical Simulation
2.2.1 Numerical Model
Discrete element methods (DEM) are used to analyze the geotechnical issue from a microscopic perspective and develop apace in decades. A particle flow code (PFC) is a typical discrete element numerical simulation method based on the motion and interaction of spherical particles. Mechanical parameter calibration is one of the essential things for simulating the geotechnical case before building a numerical model. The choice of the contact models is the key to simulating nature rock and soil before running the simulation. In general, the linear contact model (Zhang H. et al., 2016; Jia et al., 2018), the rrlinear contact model (Xiang et al., 2018; Lu et al., 2019), and the parallel bond contact model (Huang et al., 2015; Rafiee et al., 2018) are used to simulate nature clay, sand, and rock, respectively.
Verruijt and Booker (1996) proposed to present a non-uniform convergence mode, and Loganathan and Poulos (1998) modified the uniform convergence mode. The schematic diagrams of the two convergence modes are shown in Figure 3, where g is the gap thickness. Notably, the outside circle has a tunnel depth and a radius of R0, and the radius of the inside circle is R. The two-dimension particle flow code (PFC2D) is used to simulate the non-uniform convergence mode (NCM) during DOT shield tunneling.
FIGURE 3. Convergence mode caused by DOT tunnel tunneling. (A) Uniform convergence mode and (B) non-uniform convergence mode.
In the numerical simulation, the size of the numerical model is the same as that of the laser face in transparent soil modeling, as shown in Figure 4A. The particle filling length L0 is 275 mm and the distance between the centers of the two tunnels is 44 mm. The particle filling height H0 is 205 , 240, and 275 mm, respectively, corresponding to H/D = 1.0, 1.5, and 2.0. The wall element is used to generate the sidewalls of the model, which are assumed to be completely rigid. Its length is 300 mm and the gap thickness g is 10 mm. The ball elements are generated according to the experimental glass sand gradation, the radius of the ball elements varies from 2.5 to 5.0 mm, and the total number of particles is 15,903 (H/D = 2.0). The radius of the ball elements is enlarged five times the than transparent soil.
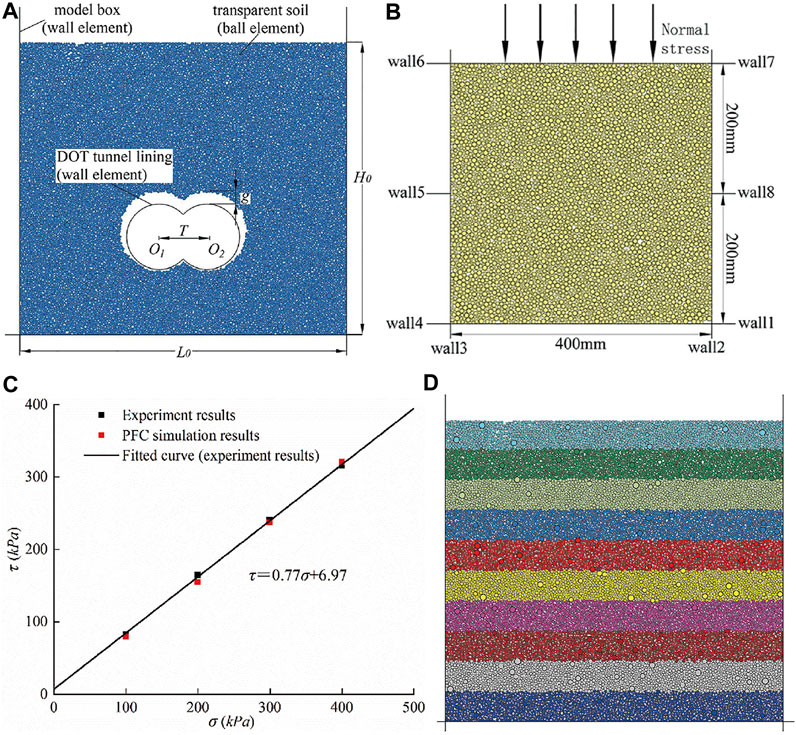
FIGURE 4. Numerical model and PFC direct shear test. (A) PFC simulation model; (B) direct shear test for parameter calibration; (C) comparison of the stress–strain correlation in a directional shear test; (D) stratified underpressure method in the simulation process.
2.2.2 Mechanical Parameter Calibration
To identify the microscopic parameters of the transparent soil in the PFC2D numerical model, a series of direct shear tests were carried out through the laboratory test and PFC2D numerical simulation, where the normal stresses were set to 100kPa, 200kPa, 300kPa, and 400kPa, respectively. The numerical model of the transparent soil shear box is shown in Figure 4B. According to the aforementioned research, the rrlinear contact model is suitable for simulating the transparent soil in PFC2D. The microscopic parameters are adjusted until the shear stress in the numerical simulation is close to the laboratory test results under the same normal stresses. As shown in Figure 4C, the internal friction angle and cohesion of the transparent soil are finally determined to be 37.6° and 6.97kPa, respectively, which are very similar to the mechanical parameters of natural sand. The corresponding microscopic parameters are listed in Table 2.
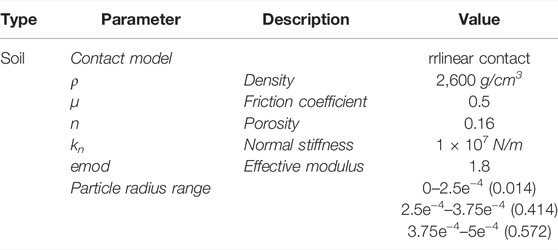
TABLE 2. Calibration results of microscopic parameters in the PFC2D model.
2.2.3 Simulation Process
The PFC simulation is completed in four steps as follows:
(1) The wall elements are generated according to the model box, and the particles are filled to a height of 205 , 240, and 275 mm, respectively, corresponding to H/D = 1.0, 1.5, and 2.0.
(2) As shown in Figure 4D, the stratified underpressure method is used to consolidate every soil layer of 20.5, 24, and 27.5 mm, respectively, corresponding to H/D = 1.0, 1.5, and 2.0.
(3) Giving ball elements gravity and performing balance calculations.
(4) According to the DOT tunnel under NCM, ball elements at the excavation face of the tunnel are deleted to simulate the soil loss of tail void and over-excavation void. Then, wall elements required for tunnel support are generated. Eventually, DOT shield tunneling is completed after the balance calculation.
3 Results and Analysis
3.1 Horizontal Displacement
3.1.1 UCM
Damage to constructions and services can be incurred as a result of the horizontal displacement of the surface. The horizontal soil displacements observed at different test stages are normalized by the tunnel diameter D, and the ratio of horizontal displacement of the surface U to the tunnel diameter D is defined as the relative horizontal displacement, that is, U/D, while the horizontal distance far away from the tunnel axis x to the tunnel diameter D is defined as the distance from the DOT tunnel centerline, that is, x/D. Figure 5 shows the dynamic horizontal displacements of the surface in the cross-section. Overall, the U/D during DOT tunneling experienced an upward trend from L = 0 mm to L = 160 mm (L represents excavation footage) under UCM, and the monitoring face is installed at L = 40 mm. The process of DOT shield tunneling induces very few horizontal displacements of the surface when the shield tail does not pass the monitoring face. However, it can be seen that the U/D increases sharply when the shield tail passes the monitoring face a long distance from L = 40 mm to L = 120 mm. The horizontal displacements of the surface almost experienced a stability from L = 120 mm to L = 160 mm. In addition, the maximum horizontal displacements are located at x = 0.6D to x = 0.8D and x = -0.6D to x = -0.8D. As a result, the U/D increases gradually when the shield shell passes by the monitoring face; nevertheless, it can be witnessed that the U/D increases rapidly at long-distance and then plateau when the shield tail passes the monitoring face.
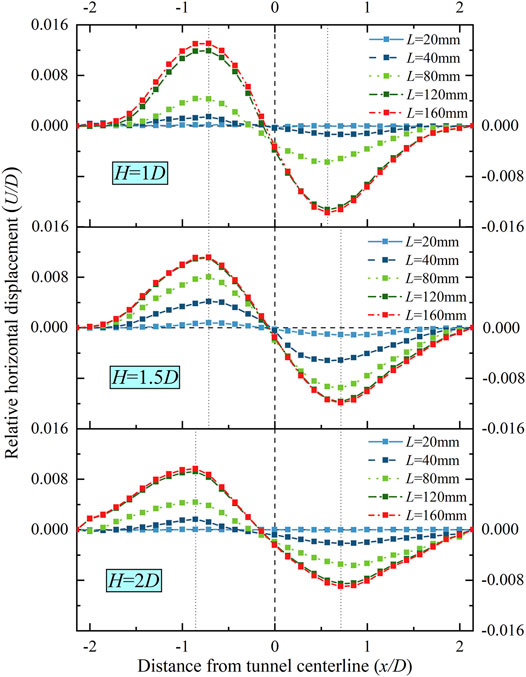
FIGURE 5. Dynamic horizontal displacement of the surface.
3.1.2 Comparison Between UCM and NCM
It is assumed that the soil rebound under the tunnel is not considered in two convergence modes. Figure 6A shows the horizontal displacement of the surface under UCM and NCM. The trend of curves under UCM is similar to that under NCM when the relative tunnel depth is 1.0, 1.5, and 2.0. The horizontal displacement of the surface declines with the increase in relative depth. In the area close to the tunnel centerline (-0.7D < x < 0.7D), the UCM result is smaller than the NCM result, which means that DOT shield tunneling under the UCM is prone to induce horizontal displacement of the surface in this area. The maximum horizontal displacements are mainly located at x = ±0.7D. Figure 6B shows the maximum horizontal displacement of the surface under the two convergence modes; the maximum values on the left side (referred to as LS) and those on the right side (referred to as RS) at H/D = 1.0, 1.5, and 2.0 are indicated. The maximum horizontal displacements of the surface on the LS under the NCM are 1.14, 1.15, and 1.09 times larger than those under the UCM while the maximum horizontal displacements of the surface on the RS under the NCM are 1.05, 1.10, and 1.15 times larger than those under the UCM, respectively, corresponding to H/D = 1.0, 1.5, and 2.0. As a result, the maximum horizontal displacement of the surface under the NCM is slightly higher than that under the UCM.
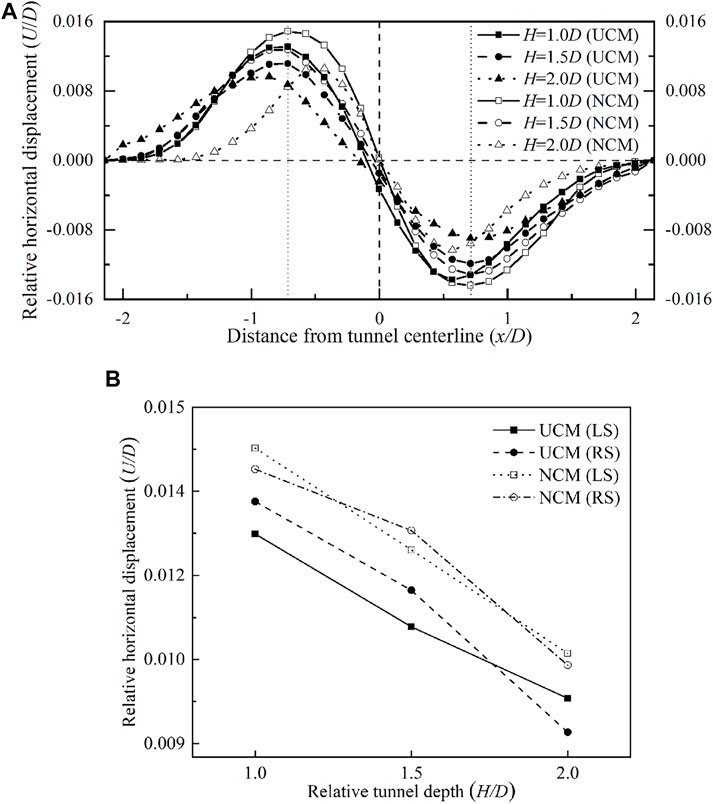
FIGURE 6. Horizontal displacement of the surface induced by DOT tunneling. (A) Comparison of horizontal displacement of the surface between UCM and NCM; (B) comparison of maximum horizontal displacement of the surface between UCM and NCM.
3.2 Settlement
3.2.1 UCM
Structures above the longitudinal section of the DOT tunnel are significantly affected by the settlement caused by the tunneling. The typical settlement curves observed in the transparent soil model are shown in Figure 7 for three tunnel depths. The ratio of the settlement S to the tunnel diameter D is defined as the relative settlement, that is, S/D, and the ratio of the buried depth of soil z to the tunnel diameter D is defined as the relative buried depth of soil, that is, z/D. From the overall perspective, stratum settlements under UCM are symmetrical. With the increase of the z/D, the S/D at three H/D ratios increases. In the area of the DOT longitudinal section (0.75D < x < 0.75D), the results at H = 1D are the largest among the three tunnel depths when z = 0.2D and z = 0.4D, while results at H = 1.5D become the largest when z = 0.6D and z = 0.8D, which means that the shallower the DOT tunnel depth is, the larger the settlements induced by the excavation above 0.4D of the longitudinal section of the tunnel will be. Moreover, the increasing rate of maximum settlements at H = 1D witnessed a significant decrease trend.
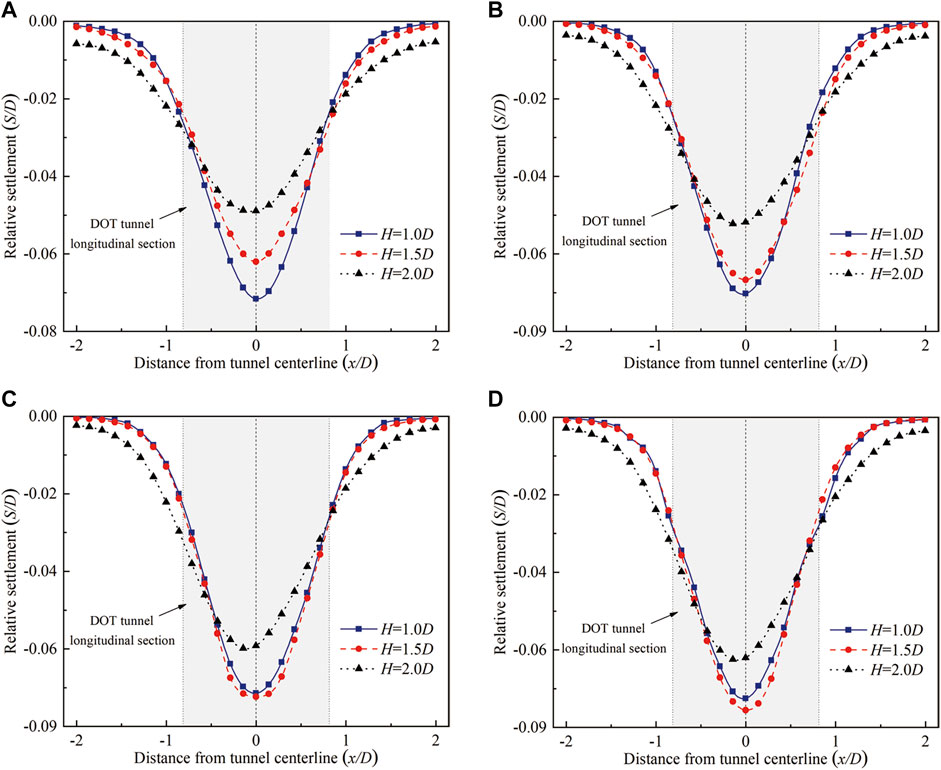
FIGURE 7. Comparison of settlements under UCM. (A) z = -0.2D, (B) z = -0.4D, (C) z = -0.6D, and (D) z = -0.8D.
The surface and subsurface settlements of the excavation process under the UCM with three tunnel depths are shown in Figure 8. As stratum settlements under the UCM are symmetrical, feature points in Figure 8 are selected at the left side of the tunnel centerline. Moreover, the horizontal soil layers z = 0D, z = 0.5H, and z = H-0.2D are indicated at three tunnel depths. It is obvious that the performance of the settlements of excavation is similar. In step 1 of UCM results, settlements at H = 1D are almost zero before the DOT shield tail’s arrival, while small settlements can be seen at H = 1.5D and H = 2D, which is due to the shield tail in this step being close to the monitoring face. However, results in step 2 are witnessed a rapid increase trend; settlements are strongly influenced by DOT shield tunneling, which is due to the shield tail in this step being far away from the monitoring face (40 mm < L < 100 mm). In other words, the passage of the DOT shield is the riskiest stage for adjacent structures above the DOT tunnel. Settlements are shown to be stable in step 3, which means that the process of DOT shield tunneling can induce no settlement in this step. Settlements at the DOT tunnel longitudinal section are larger than those far from the longitudinal section at three relative tunnel depths due to the significant impact of the tail void and over-excavation void on settlements above the DOT tunnel.
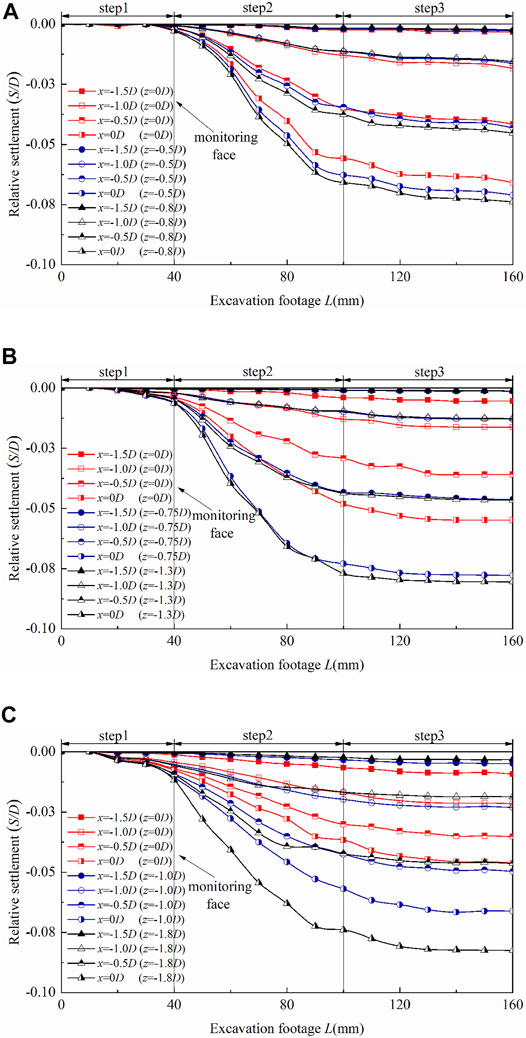
FIGURE 8. Dynamic settlement of the excavation process under UCM. (A) H = 1.0D, (B) H = 1.5D, and (C) H = 2.0D.
3.2.2 Comparison Between UCM and NCM
According to the cavity contraction theory, the equivalent soil loss parameter under UCM is 0.5 g = 5mm, while the equivalent soil loss parameter under NCM is g = 10mm, as shown in Figure 3. The eventual surface settlement troughs under UCM and NCM are shown in Figure 9A, while the maximum surface settlements under two convergence modes are shown in Figure 9B. Both UCM and NCM results match well with Peck’s Gaussian curve (Peck, 1969). Surface settlement troughs at the longitudinal section under NCM are larger than those under UCM. With the DOT tunnel depths increasing, surface settlements at the DOT longitudinal section decrease. A similar result can be included in Figure 9B; maximum surface settlements decrease with the DOT tunnel depths increasing. Maximum surface settlements under NCM are 1.27, 1.20, and 1.17 times as much as those under UCM, respectively, corresponding to H/D = 1.0, 1.5, and 2.0.
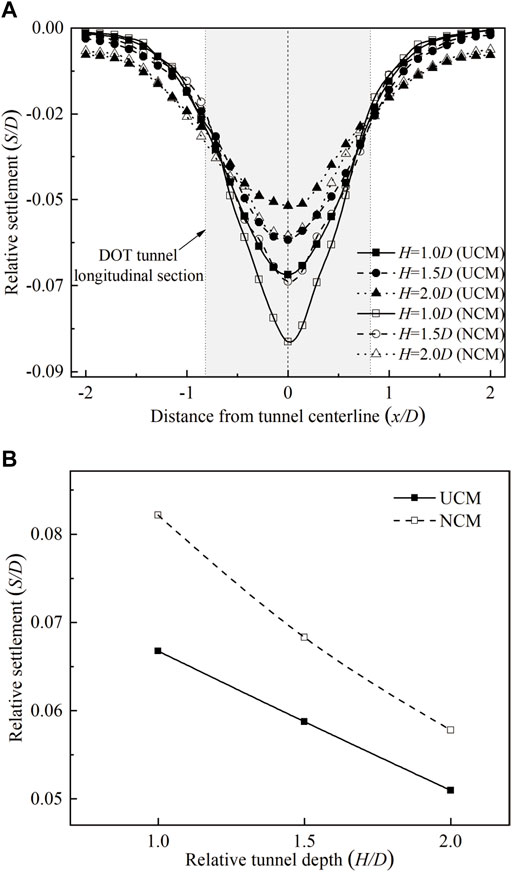
FIGURE 9. Surface settlement induced by DOT tunneling. (A) Comparison of the surface settlement between UCM and NCM;(B) comparison of the maximum surface settlement between UCM and NCM.
3.3 Displacement Field
3.3.1 Vectors and Contours
Internal strains are significant for analyzing tunneling induced on buildings and underground facilities. Vectors and contours of soil displacement around the DOT tunnel under UCM are shown in Figure 10, and contours of soil displacement under NCM are shown in Figure 11. The contours of soil displacement d are calculated by (U2+S2) 0.5, where dmax is the maximum soil displacement. Moreover, the ratio of the soil displacement d to the tunnel diameter D is defined as the relative soil displacement, that is, d/D. Similar vectors and contours of soil displacement under NCM have been analyzed by Zeng et al. (2016). The maximum soil displacement is located at the top of the excavation face under the two convergence modes. The relative ratio of maximum soil displacements is 0.071, 0.079, and 0.086, respectively, under UCM, while that is 0.137, 0.166, and 0.177, respectively, under NCM, corresponding to H/D = 1.0, 1.5, and 2.0. Maximum soil displacement under NCM is 1.93, 2.10, and 2.05 times larger, respectively, than that under UCM, corresponding to H/D = 1.0, 1.5, and 2.0. As a result, the maximum soil displacement under NCM is larger than that under UCM.
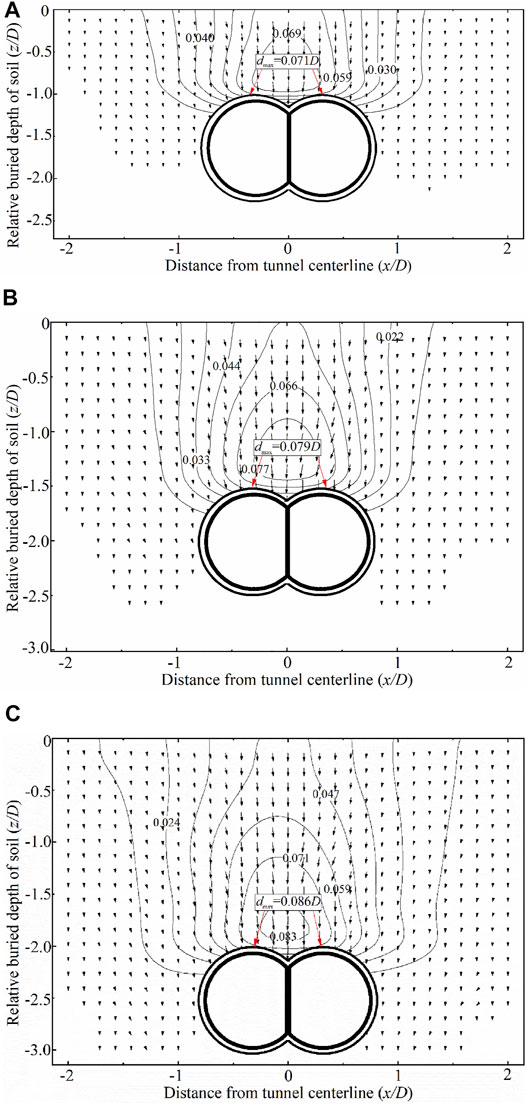
FIGURE 10. Displacement field of three buried depths in transparent soil models. (A) H = 1.0D, (B) H = 1.5D, and (C) H = 2.0D.
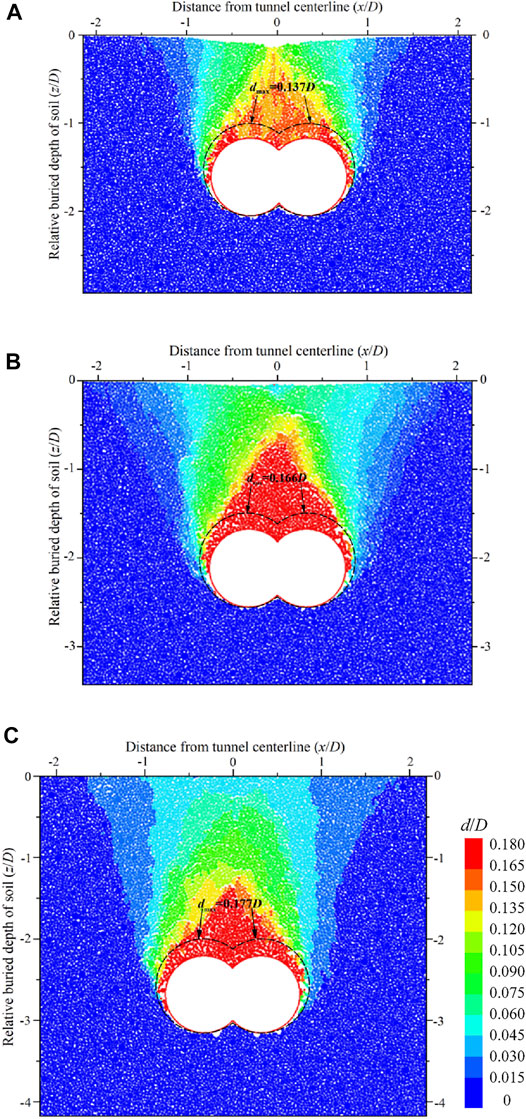
FIGURE 11. Displacement map in PFC simulation. (A) H = 1.0D, (B) H = 1.5D, and (C) H = 2.0D.
3.3.2 Displacement Pattern
Figure 10; Figure 11 show that the DOT tunneling-induced soil displacement zone is similar to an inverted trapezoid shape under two convergence modes, which is defined as the disturbance zone. Xiang et al. (2018) pointed out that a funnel-shaped failure pattern in transparent soil displacement of circular tunnels was witnessed. Nevertheless, the displacement pattern of soil induced by DOT tunneling is similar to an inverted trapezoid-shaped failure pattern.
3.4 Soil Arching Effect
As shown in Figure 12A, an arch zone, a loosened zone, and a stability zone will form above tunnels due to the tunnel over-excavation (He and Zhang, 2015; Chen et al., 2022). The eventual results of the soil arching effect under NCM and the differences of contact force recorded in PFC2D at three tunnel depths are shown in Figures 12B–D. It can be seen that DOT shield tunneling induces uneven soil displacement and stress changes. The DOT shield tunneling induces soil displacement around the tunnel, which is transmitted upward from the top of the DOT tunnel, and soils within a range in the upper part of the DOT tunnel form a loosened zone. The upper part of the loosened zone becomes denser and forms an arch zone, and the upper part of the arch zone forms a new related stability zone. According to the eventual results of the soil arching effect under NCM, soil displacement induced by DOT tunneling forms a loosened zone and a stability zone in the disturbance zone at H = 1D, as shown in Figure 12B. However, Figures 12C, D show that DOT tunneling induces soil displacement to form an arch zone, a loosened zone, and a stability zone at H = 1.5D and H = 2D, respectively. According to the force chain diagram under NCM, there is no arch-shaped force chain in the upper part of the DOT tunnel at H = 1D (in Figure 12B), while force chains (in Figures 12C, D) form an arch-shape at H = 1.5D and H = 2D. Sun and Liu. (2014) summarized that soil arch effects are present at tunnel depths above 1.5D in circular tunnels, and similar results are found in DOT tunnels. Consequently, the soil arch effect above DOT tunnels arises as the DOT tunnel depth increases.
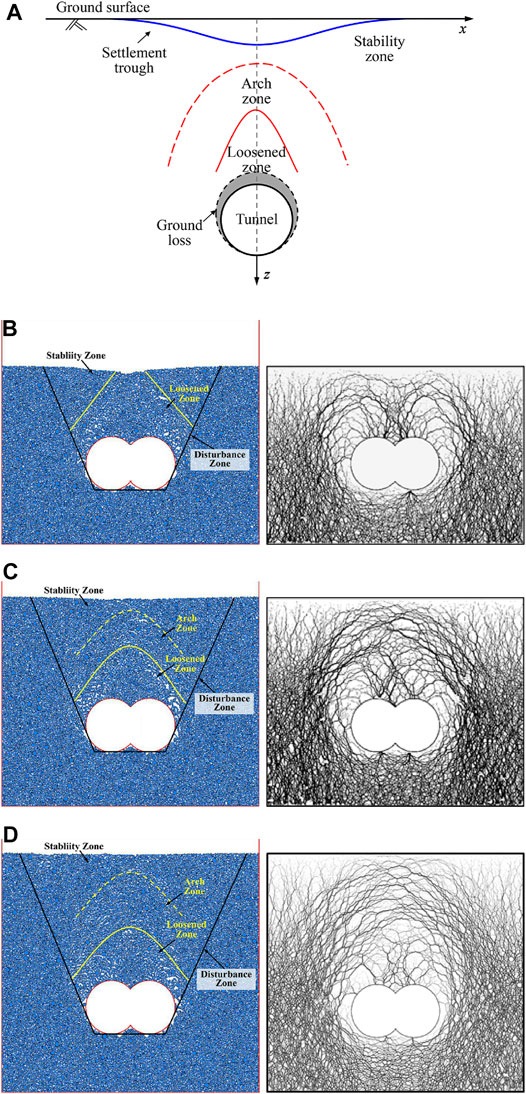
FIGURE 12. Soil arching effect induced by tunneling under NCM. (A) Schematic diagram of the circular tunnel (Chen et al., 2022); (B) numerical result at H = 1.0D; (C) numerical result at H = 1.5D; and (D) Numerical result at H = 2.0D.
3.5 Disturbance Zone
3.5.1 Description of the Disturbance Zone Model
According to the aforementioned disturbance zone in model test results and numerical results, a new analytical model to predict the DOT tunneling-induced soil displacement effect area was proposed. Figure 13A gives an illustration of the disturbance zone model. Lin et al. (2019) pointed out that the shearing bands began to develop at the bottom of the tunnel based on the numerical simulation results. Therefore, this study assumes that the disturbance zone range begins to develop at the bottom of the tunnel and extends along with the tangent point of the DOT tunnel excavation face to the surface.
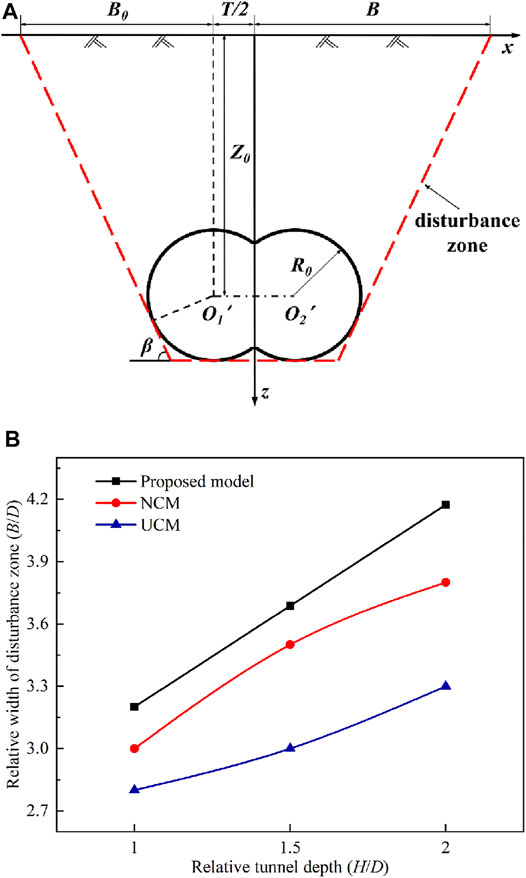
FIGURE 13. Disturbance zone induced by DOT shield construction. (A) Illustration of the disturbance zone model; (B) comparison of the width of the disturbance zone obtained from the proposed model with transparent soil model tests and PFC model tests.
3.5.2 The Width of the Disturbance Zone (B)
The width of the disturbance zone has a great influence on surface and subsurface soil displacement. The different yield points of the shear bands and their extension directions result in various widths of the disturbance zone (Terzaghi, 1943; Zhang Z. et al., 2016). Moreover, the width of the disturbance zone is highly correlated with the differences between the buried depth of the tunnel center Z0 and the internal friction angle φ. The disturbance zone consists of a tangent line at the bottom of the DOT shield tunnel and an inclination line tangent to the DOT tunnel (inclination angle is β) (Lin et al., 2022). Thus, the width of the disturbance zone is as follows:
where B = the width of the disturbance zone; Z0 = buried depth of the tunnel center; R0 = convergence radius of the DOT shield tunnel; T = distance between the centers of the two tunnels; and β = 45o + φ/2.
3.5.3 Validation of the Proposed Model
To verify the validation of the proposed model, a comparative analysis of the results of the transparent soil model tests and the numerical model tests was presented in this study. The parameters R0, D, T, and φ were 35, 70, 22 mm, and 37.6°, respectively, confirmed based on transparent soil model tests.
Figure 13B shows a comparison of the relative width of the disturbance zone B/D obtained from the proposed model, transparent soil model tests, and PFC model tests. It can be seen from Figure 13B that the B/D increases nonlinearly when the relative tunnel depth H/D increases. The B/D ratios obtained from the proposed model at three H/D ratios are somewhat higher than those under NCM and UCM. Moreover, the B/D ratios under NCM at three H/D ratios areslightly higher than those under UCM. The B/D obtained from the proposed model is 1.07, 1.05, and 1.10 times as much as that under NCM, respectively, and that is 1.14, 1.23, and 1.26 times as much as that under UCM, respectively, corresponding to H/D = 1.0, 1.5, and 2.0. Meanwhile, the B/D obtained from the proposed model is close to the results of transparent soil model tests and PFC model tests. Therefore, the aforementioned example validates that the proposed model is rational and effective.
4.Conclusion
Based on transparent soil model tests and PFC2D simulation, the main conclusions can be summarized as follows:
(1) The horizontal displacements of the surface increase under UCM gradually when the shield shell passes by the monitoring face, while the horizontal displacements of the surface under UCM increase rapidly in long distances and then tend to be stable when the shield tail passes the monitoring face. The maximum horizontal displacement of the surface under NCM is slightly larger than that under UCM.
(2) The main settlement occurs when the DOT shield shell passes and the shield tail passes the monitoring face. During these two steps, the settlements at the surface and subsurface are more than three-quarters of the eventual settlement. The maximum surface settlements under NCM are 1.27, 1.20, and 1.17 times as much as those under the UCM, corresponding to H/D = 1.0, 1.5, and 2.0. Hence, the driving speed of the DOT shield tunneling machine plays an essential role in controlling the settlement during the DOT tunneling process.
(3) The maximum soil displacement under NCM is larger than that under UCM. The maximum soil displacement under NCM is 1.93, 2.10, and 2.05 times, respectively, as much as that under UCM, corresponding to H/D = 1.0, 1.5, and 2.0. A trapezoid-shaped failure pattern of soil is experienced at three tunnel depths. Moreover, the soil arch effect above DOT tunnels arises as the DOT tunnel depth increases.
(4) Compared with the transparent soil model tests and the PFC model, the proposed model is close to the test results of the disturbance zone of DOT tunnels, indicating that the proposed model is effective.
Data Availability Statement
The original contributions presented in the study are included in the article/Supplementary Material; further inquiries can be directed to the corresponding author.
Author Contributions
BZ: software and writing—original draft preparation; YuZ: resources, data curation, and project; SY and YoZ: validation and investigation; LH and RM: editing.
Funding
This work is funded by the National Natural Science Foundation of China (No. 52108304), China Postdoctoral Science Foundation (No. 2019M653343), and Chongqing Postdoctoral Science Foundation (No. cstc2019jcyj-bshX012).
Conflict of Interest
The authors declare that the research was conducted in the absence of any commercial or financial relationships that could be construed as a potential conflict of interest.
Publisher’s Note
All claims expressed in this article are solely those of the authors and do not necessarily represent those of their affiliated organizations, or those of the publisher, the editors, and the reviewers. Any product that may be evaluated in this article, or claim that may be made by its manufacturer, is not guaranteed or endorsed by the publisher.
References
Ahmed, M., and Iskander, M. (2011). Analysis of Tunneling-Induced Ground Movements Using Transparent Soil Models. J. Geotech. Geoenviron. Eng. 137 (5), 525–535. doi:10.1061/(asce)gt.1943-5606.0000456
Ahmed, M., and Iskander, M. (2012). Evaluation of Tunnel Face Stability by Transparent Soil Models. Tunn. Undergr. Space Technol. 27 (1), 101–110. doi:10.1016/j.tust.2011.08.001
Atkinson, J. H., and Potts, D. M. (1977). Subsidence above Shallow Tunnels in Soft Ground. J. Geotech. Engrg. Div. 103, 307–325. doi:10.1061/ajgeb6.0000402
Attewell, P. B., and Farmer, I. W. (1974). Ground Deformations Resulting from Shield Tunnelling in London Clay. Can. Geotech. J. 11 (3), 380–395. doi:10.1139/t74-039
Chen, R. P., Song, X., Meng, F. Y., Wu, H. N., and Lin, X. T. (2022). Analytical Approach to Predict Tunneling-Induced Subsurface Settlement in Sand Considering Soil Arching Effect. Comput. Geotechnics 141, 104–492. doi:10.1016/j.compgeo.2021.104492
Chen, S. L., Lee, S. C., and Wei, Y. S. (2016). Numerical Analysis of Ground Surface Settlement Induced by Double-O Tube Shield Tunneling. J. Perform. Constr. Facil. 30 (5), 10. doi:10.1061/(asce)cf.1943-5509.0000732
Chen, Z., Omidvar, M., Iskander, M., and Bless, S. (2014). Modelling of Projectile Penetration Using Transparent Soils. Int. J. Phys. Model. Geotechnics 14 (3), 68–79. doi:10.1680/ijpmg.14.00003
Chow, B. (2006). Double-O-tube Shield Tunneling Technology in the Shanghai Rail Transit Project. Tunn. Undergr. Space Technol. 21 (6), 594–601. doi:10.1016/j.tust.2005.11.003
Cui, S., Pei, X., Jiang, Y., Wang, G., Fan, X., Yang, Q., et al. (2021). Liquefaction within a Bedding Fault: Understanding the Initiation and Movement of the Daguangbao Landslide Triggered by the 2008 Wenchuan Earthquake (Ms = 8.0). Eng. Geol. 295, 106455. doi:10.1016/j.enggeo.2021.106455
Fang, Y.-S., Kao, C.-C., and Shiu, Y.-F. (2012). Double-O-Tube Shield Tunneling for Taoyuan International Airport Access MRT. Tunn. Undergr. Space Technol. 30, 233–245. doi:10.1016/j.tust.2012.03.001
Franza, A., Marshall, A. M., and Zhou, B. (2019). Greenfield Tunnelling in Sands: the Effects of Soil Density and Relative Depth. Géotechnique 69, 297–307. doi:10.1680/jgeot.17.p.091
Giardina, G., Losacco, N., Dejong, M. J., Viggiani, G. M. B., and Mair, R. J. (2020). Effect of Soil Models on the Prediction of Tunnelling-Induced Deformations of Structures. Proc. Institution Civ. Eng. - Geotechnical Eng. 173 (5), 379–397. doi:10.1680/jgeen.18.00127
He, L., and Zhang, Q. B. (2015). Numerical Investigation of Arching Mechanism to Underground Excavation in Jointed Rock Mass. Tunn. Undergr. Space Technol. 50, 54–67. doi:10.1016/j.tust.2015.06.007
He, Y., and Kusiak, A. (2017). Performance Assessment of Wind Turbines: Data-Derived Quantitative Metrics. IEEE Trans. Sustain. Energy 9 (1), 65–73. doi:10.1109/TSTE.2017.2715061
Huang, D., Cen, D., Ma, G., and Huang, R. (2015). Step-path Failure of Rock Slopes with Intermittent Joints. Landslides 12 (5), 911–926. doi:10.1007/s10346-014-0517-6
Iskander, M. (2010). Modelling with Transparent Soils: Visualizing Soil Structure Interaction and Multi Phase Flow, Non-intrusively. Heidelberg, Germany: Springer Verlag Berlin.
Jia, M., Yang, Y., Liu, B., and Wu, S. (2018). PFC/FLAC Coupled Simulation of Dynamic Compaction in Granular Soils. Granul. matter 20 (4), 76. doi:10.1007/s10035-018-0841-y
Kanai, M. (2004). State-of-the-art Tunnelling Technology to Create Urban Underground Space – Japanese Challenge. Tunn. Undergr. Space Technol. 19 (4-5), 307. doi:10.1016/j.tust.2004.01.032
Kong, G. Q., Zhou, L. D., Wang, Z. T., Yang, G., and Li, H. (2016). Shear Modulus and Damping Ratios of Transparent Soil Manufactured by Fused Quartz. Mater. Lett. 182, 257–259. doi:10.1016/j.matlet.2016.07.012
Li, H., Deng, J., Feng, P., Pu, C., Arachchige, D., and Cheng, Q. (2021a). Short-term Nacelle Orientation Forecasting Using Bilinear Transformation and ICEEMDAN Framework. Front. Energy Res. 9, 780928. doi:10.3389/fenrg.2021.780928
Li, H., Deng, J., Yuan, S., Feng, P., and Arachchige, D. (2021b). Monitoring and Identifying Wind Turbine Generator Bearing Faults Using Deep Belief Network and EWMA Control Charts. Front. Energy Res. 9, 799039. doi:10.3389/fenrg.2021.799039
Li, H., He, Y., Xu, Q., Deng, j., Li, W., and Wei, Y. (2022). Detection and Segmentation of Loess Landslides via Satellite Images: a Two-phase Framework. Landslides 19 (3), 673–686. doi:10.1007/s10346-021-01789-0
Lin, X.-T., Chen, R.-P., Wu, H.-N., and Cheng, H.-Z. (2019). Three-dimensional Stress-Transfer Mechanism and Soil Arching Evolution Induced by Shield Tunneling in Sandy Ground. Tunn. Undergr. Space Technol. 93, 103104. doi:10.1016/j.tust.2019.103104
Lin, X., Chen, R., Wu, H., Meng, F., Su, D., and Han, K. (2022). Calculation of Earth Pressure Distribution on the Deep Circular Tunnel Considering Stress-Transfer Mechanisms in Different Zones. Tunn. Undergr. Space Technol. 119, 10421. doi:10.1016/j.tust.2021.104211
Loganathan, N., and Poulos, H. G. (1998). Analytical Prediction for Tunneling-Induced Ground Movements in Clays. J. Geotechnical Geoenvironmental Eng. 124 (9), 846–856. doi:10.1061/(asce)1090-0241(1998)124:9(846)
Lu, Z., Yao, A., Su, A., Ren, X., Liu, Q., and Dong, S. (2019). Re-recognizing the Impact of Particle Shape on Physical and Mechanical Properties of Sandy Soils: A Numerical Study. Eng. Geol. 253, 36–46. doi:10.1016/j.enggeo.2019.03.011
Mair, R. J., Taylor, R. N., and Bracegirdle, A. (1995). Subsurface Settlement Profiles above Tunnels in Clays. Géotechnique 45, 361–362. doi:10.1680/geot.1995.45.2.361
Mair, R., Soga, K., and Wongsaroj, J. (2013). Tunnelling-Induced Consolidation Settlements in London Clay. Géotechnique 63, 1103–1115. doi:10.1680/geot.12.P.126
Mannheimer, R. J., and Oswald, C. J. (1993). Development of Transparent Porous Media with Permeabilities and Porosities Comparable to Soils, Aquifers, and Petroleum Reservoirs. Ground Water 31, 781–788. doi:10.1111/j.1745-6584.1993.tb00851.x
Miro, S., König, M., Hartmann, D., and Schanz, T. (2015). A Probabilistic Analysis of Subsoil Parameters Uncertainty Impacts on Tunnel-Induced Ground Movements with a Back-Analysis Study. Comput. Geotechnics 68, 38–53. doi:10.1016/j.compgeo.2015.03.012
Ni, Q., Hird, C. C., and Guymer, I. (2010). Physical Modelling of Pile Penetration in Clay Using Transparent Soil and Particle Image Velocimetry. Géotechnique 60 (2), 121–132. doi:10.1680/geot.8.p.052
O'reilly, M. P., and New, B. M. (1982). Settlements above Tunnels in the United Kingdom - Their Magnitude and Prediction. Tunnelling 82, 173–181.
Oda, T., and Yonei, I. (1993). Tunneling with Large-Section Overlapping Double-O-Tube Construction Plan. Tunnels Undergr. 24, 39–46.
Peck, R. B. (1969). “Deep Excavations and Tunneling in Soft Ground,” in Proc, 7th International Conference on Soil Mechanics and Foundation Engineering, Mexico City, Mexico, August 25–29, 1969 (Mexico: Deep Excavations and Tunneling in Soft Ground), 225–290.
Rafiee, R., Ataei, M., KhalooKakaie, R., Jalali, S. E., Sereshki, F., and Noroozi, M. (2018). Numerical Modeling of Influence Parameters in Cavabililty of Rock Mass in Block Caving Mines. Int. J. Rock Mech. Min. Sci. 105, 22–27. doi:10.1016/j.ijrmms.2018.03.001
Sadek, S., Iskander, M. G., and Liu, J. (2002). Geotechnical Properties of Transparent Silica. Can. Geotech. J. 39 (1), 111–124. doi:10.1139/t01-075
Shen, S.-L., Horpibulsuk, S., Liao, S.-M., and Peng, F.-L. (2009). Analysis of the Behavior of DOT Tunnel Lining Caused by Rolling Correction Operation. Tunn. Undergr. Space Technol. 24, 84–90. doi:10.1016/j.tust.2008.05.003
Sun, J., and Liu, J. (2014). Visualization of Tunnelling-Induced Ground Movement in Transparent Sand. Tunn. Undergr. Space Technol. 40, 236–240. doi:10.1016/j.tust.2013.10.009
Verruijt, A. (1997). A Complex Variable Solution for a Deforming Circular Tunnel in an Elastic Half-Plane. Int. J. Numer. Anal. Meth. Geomech. 21, 77–89. doi:10.1002/(sici)1096-9853(199702)21:2<77::aid-nag857>3.0.co;2-m
Verruijt, A., and Booker, J. R. (1996). Surface Settlements Due to Deformation of a Tunnel in an Elastic Half Plane. Géotechnique 46, 753–756. doi:10.1680/geot.1996.46.4.753
Wang, J., Liu, X., Liu, S., Zhu, Y., Pan, W., and Zhou, J. (2018). Physical Model Test of Transparent Soil on Coupling Effect of Cut-Off Wall and Pumping Wells during Foundation Pit Dewatering. Acta Geotech. 14 (1), 141–162. doi:10.1007/s11440-018-0649-2
Xiang, Y., Liu, H., Zhang, W., Chu, J., Zhou, D., and Xiao, Y. (2018). Application of Transparent Soil Model Test and DEM Simulation in Study of Tunnel Failure Mechanism. Tunn. Undergr. Space Technol. 74, 178–184. doi:10.1016/j.tust.2018.01.020
Yang, J. S., Liu, B. C., and Wang, M. C. (2004). Modeling of Tunneling-Induced Ground Surface Movements Using Stochastic Medium Theory. Tunn. Undergr. Space Technol. 19, 113–123. doi:10.1016/j.tust.2003.07.002
Zeng, B., Huang, D., and He, J. (2016). Analysis of Double-O-Tube Shield Tunnelling-Induced Soil Deformation Due to Ground Loss. Géotechnique Lett. 6 (1), 7–15. doi:10.1680/jgele.15.00099
Zeng, B., and Huang, D. (2016). Soil Deformation Induced by Double-O-Tube Shield Tunneling with Rolling Based on Stochastic Medium Theory. Tunn. Undergr. Space Technol. 60, 165–177. doi:10.1016/j.tust.2016.09.001
Zhang, C., Yu, J., and Huang, M. (2012). Effects of Tunnelling on Existing Pipelines in Layered Soils. Comput. Geotechnics 43, 12–25. doi:10.1016/j.compgeo.2012.01.011
Zhang, H., Zhang, P., Zhou, W., Dong, S., and Ma, B. (2016a). A New Model to Predict Soil Pressure Acting on Deep Burial Jacked Pipes. Tunn. Undergr. Space Technol. 60, 183–196. doi:10.1016/j.tust.2016.09.005
Zhang, Z., Huang, M., and Zhang, M. (2011). Theoretical Prediction of Ground Movements Induced by Tunnelling in Multi-Layered Soils. Tunn. Undergr. Space Technol. 26 (2), 345–355. doi:10.1016/j.tust.2010.11.005
Zhang, Z., Zhang, X., Qiu, H., and Daddow, M. (2016b). Dynamic Characteristics of Track-Ballast-Silty Clay with Irregular Vibration Levels Generated by High-Speed Train Based on DEM. Constr. Build. Mater. 125, 564–573. doi:10.1016/j.conbuildmat.2016.08.079
Keywords: double-O-tube (DOT) shield, transparent soil, PFC2D, convergence mode, burial depth, soil displacements, disturbance zone
Citation: Zeng B, Zhu Y, Ye S, Zheng Y, He L and Ma R (2022) Double-O-Tube Shield Tunneling-Induced Soil Displacement Considering Burial Depth and Convergence Mode: Transparent Soil Experiment and DEM Simulation. Front. Earth Sci. 10:925356. doi: 10.3389/feart.2022.925356
Received: 21 April 2022; Accepted: 13 May 2022;
Published: 24 June 2022.
Edited by:
Shenghua Cui, Chengdu University of Technology, ChinaReviewed by:
Qian Yin, China University of Mining and Technology, ChinaKe Zhang, Kunming University of Science and Technology, China
Copyright © 2022 Zeng, Zhu, Ye, Zheng, He and Ma. This is an open-access article distributed under the terms of the Creative Commons Attribution License (CC BY). The use, distribution or reproduction in other forums is permitted, provided the original author(s) and the copyright owner(s) are credited and that the original publication in this journal is cited, in accordance with accepted academic practice. No use, distribution or reproduction is permitted which does not comply with these terms.
*Correspondence: Bin Zeng, emJAY3FqdHUuZWR1LmNu