- 1State Key Laboratory of Simulation and Regulation of Water Cycle in River Basin, China Institute of Water Resources and Hydropower Research, Beijing, China
- 2Hydraulic and Water Resources Engineering Department, Debre Markos University Institute of Technology, Debre Markos, Ethiopia
- 3College of Resource Environment and Tourism, Capital Normal University, Beijing, China
- 4Beijing Laboratory of Water Resources Security Beijing Institute of Hydrogeology, Beijing, China
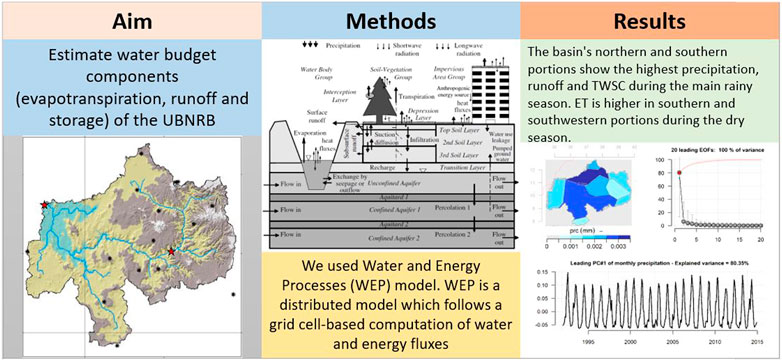
Understanding the spatial and temporal distributions and variations of basin water budget components is essential for effective water resources management. Due to a lack of basic hydro-meteorological information, the Upper Blue Nile River Basin (UBNRB) remains poorly understood in quantifying its hydrologic fluxes and associated dynamics. This study used a physically based distributed hydrologic model, WEP. We used multi-year land use information to better estimate the water budget components (evapotranspiration, runoff and storage) of the UBNRB. WEP simulation was validated at two main sections of the Upper Blue Nile river monthly from 1992 to 2014 (23 years). Results show that the basin stores a significant amount of water during the long rainy season (June to September) due to higher precipitation and limited evapotranspiration. However, it loses this storage through evapotranspiration during the dry season (October to February). The overall basin precipitation is 1,051 mm per year. Evapotranspiration accounts for 58% of the annual water budget, runoff is 25% and storage is 18%. The findings reported in this study can shed some light on understanding the UBNRB water budget dynamics and inform water management practitioners.
1 Introduction
Continually increasing human activities are affecting global and regional water resources. The effect is often reflected in the water and food insecurity, frequent hydrologic extremes and deteriorating ecosystem health (Solomon, IPCC and IPCC, 2007). The Nile river basin is one of such areas experiencing challenges arising from a growing population and increasing water demands (Taye et al., 2011). With the potential threats of climate change, the basin’s water-related problems are expected to increase shortly (Siam and Eltahir, 2017; Coffel et al., 2019). The Upper Blue Nile river basin (UBNRB) is a relatively wetter portion of the Nile. It receives significant precipitation during the long rainy season lasting from June to September (Mellander et al., 2013). However, the climate is strongly influenced by teleconnections with the El Niño–Southern Oscillation and sea surface temperatures in the Indian Ocean (Giannini et al., 2003). As a result, the UBNRB climate highly influences regional precipitation and streamflow availability in the Nile (Kim and Kaluarachchi, 2009; Taye et al., 2011). The Upper Blue Nile River, originating from Lake Tana, Ethiopia, is the primary source of water for the socio-economic activities of the country as well as the downstream riparian countries (i.e., Sudan and Egypt).
Due to its transboundary nature, the UBNRB requires special attention to understand its inherent hydrology to implement sustainable water use in the region. Amid the basin’s natural, social and political diversity and complexity (Coffel et al., 2019), it is necessary to quantify water budget components and their spatio-temporal variabilities for effective management, efficient water allocation, and sustainable planning and policymaking. Accurate estimation of flux terms such as runoff, evapotranspiration, and storage is essential to understanding basin water resources (Gao et al., 2010; Abera et al., 2017; Tong et al., 2020). In this regard, various attempts have been made to quantify the water budgets of UBNRB (Abera et al., 2017; Jung et al., 2017). However, basin-scale water budget estimations are limited due to the lack of hydro-meteorological data. Most studies focus on estimates at the sub-basin level, with relatively better information (Wale et al., 2009; Tekleab et al., 2011). Others concentrate on the estimation or characterization of only specific components such as precipitation (Abtew et al., 2009), evapotranspiration (Allam et al., 2016), or runoff (Tesemma et al., 2010).
Using a proper modeling framework and including representative basin information is essential to quantify the water budget accurately. In this regard, distributed hydrologic models enable estimating water budget components at discretized grid scales than the aggregated sub-watershed scales. As a result, accurate and spatially distributed information on basin water fluxes can be obtained and the need to lump flux terms at a watershed scale can be avoided (Vieux, 2008). In this respect, the Water and Energy Processes (WEP) model has been used in various parts of the world to estimate basin-scale water resources and water and energy fluxes (Jia et al., 2001; Jia et al., 2002; Jia et al., 2005; Jia et al., 2006; Weng et al., 2015; Li et al., 2019). Apart from its distributed nature, the WEP has the additional ability to incorporate multi-year land use information than the usual single land use data for the entire simulation. It also handles sub-grid land use heterogeneities, which is more reasonable than the usual dominant land use method (Jia et al., 2001).
The current study uses the WEP model to estimate water budget components: runoff, evapotranspiration (ET) and total water storage change (TWSC) in the UBNRB. It is also a first attempt to implement the WEP modeling framework in the UBNRB as an alternative modeling approach. In addition to the analysis of temporal variabilities, we also presented spatially distributed flux information which is left untouched in most similar studies conducted in UBNRB. Therefore, the outcomes of this study aim to provide knowledge on the spatial and temporal variabilities of water budget components of UBNRB to inform concerned stakeholders. The paper is organized as follows: firstly, descriptions of the study area, WEP model along with the study methodologies are given in Section 2, then the discussions on each water budget component are presented in Section 3. Lastly, the conclusions of the study are outlined in Section 4.
2 Materials and Methods
2.1 The Study Area
UBNRB is one of Ethiopia’s eleven drainage basins. It ranges from 7°40′ to 12°50′ latitude N to 34°50′ and 39°40′ longitude (Figure 1). With an area of 176,000 square kilometers (Conway, 2000), it drains the highlands of the northwest of the country. The source of the Blue Nile River (locally known as Abbay) is Lake Tana (area 3,060 km2). It then traverses through the rugged terrains and finally crosses the Ethio-Sudan border to join the White Nile near Khartoum, Sudan. The basin accounts for approximately 60% of the Nile’s annual flow (Conway, 2005). The climate varies widely spatially and temporally (Abtew et al., 2009; Samy et al., 2019). The basin receives its highest precipitation from June through September during the long rainy season. During the short rainy season, which lasts from March to May, the basin receives significant precipitation. The average annual rainfall for the basin ranges from 1,200 mm in the southwest section to 1,600 mm in the northeast (Kim et al., 2008).
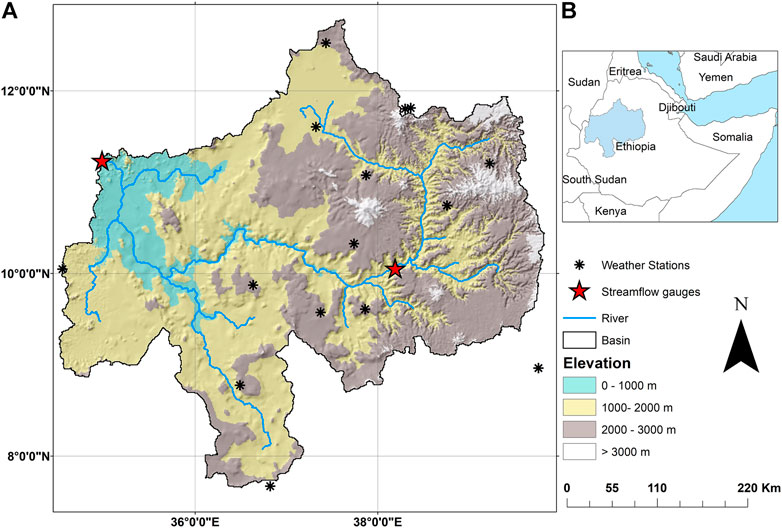
FIGURE 1. Study area. (A) The digital elevation map of the Upper Blue Nile River Basin (UBNRB) and the location of 15 weather stations. (B) Inset map showing the relative location of the study area.
The elevation map of the basin is shown in Figure 1. A diverse climate and elevation ranging from 500 to 4,160 m above sea level are typical basin characteristics.
The UBNRB is rapidly growing and its inhabitants are engaged in subsistence agriculture. As a result, the region has experienced several climate-induced agricultural threats, such as damage to crop yields (Lesk et al., 2016; Kent et al., 2017). On top of this historical risk, the rapidly growing population imposes unprecedented challenges to the already stressed ecosystem. Additionally, as climate change raises the temperatures and modifies precipitation patterns, the region will likely face periodic water and food insecurities and complex water politics leading to migration, conflict, and humanitarian disasters (Burrows and Kinney, 2016; Asseng et al., 2018). Given the potential future challenges of the region, it is imperative to understand the relationships among the hydrological components and quantify their spatial and temporal variabilities. The current study estimates UBNRB water budget components and analyzes their distribution in space and time.
2.2 WEP Model Description
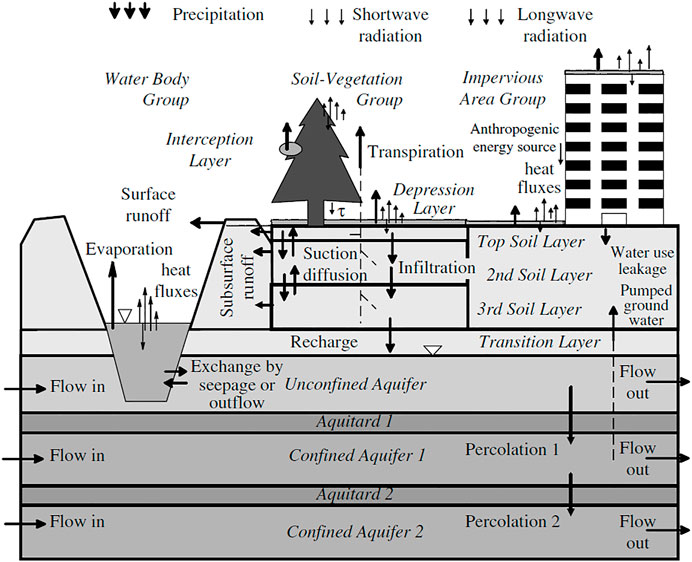
Water and Energy Processes (WEP) is a distributed model which follows a grid cell-based computation of water and energy fluxes (Jia et al., 2001). WEP can simulate hydrological processes such as evapotranspiration, surface and sub-surface runoff, infiltration, groundwater flow and river flow. Similarly, energy processes including short- and longwave radiation, latent heat flux, sensible heat flux and soil heat flux are simulated.
The model represents the state variables such as depression storage on land surfaces, soil moisture content, land surface temperature, groundwater level, river water stage, etc. The vertical structure of the WEP modeling approach within a grid cell is given in Figure 2.
Penman equation is used to calculate evaporation from water bodies. The same equation modified to incorporate the soil wetness function is used to estimate evaporation from soil surfaces (Jia et al., 2001). The Penman-Monteith equation is used to compute transpiration from vegetated surfaces. Areally averaging values obtain a grid cell evapotranspiration from each land use.
The generalized Green-Ampt infiltration equation estimates infiltration due to heavy rains. Jia and Tamai (Jia and Tamai, 1998) developed the generalized form of Green-Ampt infiltration into multi-layered soil profiles. During no heavy rain times (i.e., rainfall intensity is smaller than saturated soil hydraulic conductivity), soil moisture movement in unsaturated soils is computed using the Richards model.
Surface runoff is computed using either infiltration excess during heavy rain periods or saturation excess runoff generation mechanisms. The infiltration excess method is initiated when depression storage on land surfaces surpasses its maximum value. The excess storage undergoes evaporation and infiltration processes. On the other hand, saturation excess occurs if the groundwater level in the unconfined aquifer rises and saturates the topsoil. Subsurface runoff is computed based on land slopes and unsaturated hydraulic conductivities.
Multi-layered aquifer flow is simulated in WEP using the Boussinesq equation. The balance between unsaturated soil zone recharge, groundwater outflow to rivers, evapotranspiration from groundwater and percolation to lower aquifers explains surface and groundwater interactions. The difference in river water stage and groundwater head in unconfined aquifers is used to calculate groundwater contribution to river flows.
One dimensional kinematic wave method is used for overland flow routing between adjacent grid cells. River flow routing is accomplished using the dynamic wave method in a one-dimensional scheme. A detailed description of the WEP model and parametrization of its components is given in Jia et al. (2001).
2.3 Datasets Used
We used the HYDRO1k Digital Elevation Model (DEM) data with a spatial resolution of nearly 1 km. The dataset was developed at the U.S. Geological Survey (USGS) and accessed through the USGS EarthExplorer platform (https://earthexplorer.usgs.gov/). The DEM data was used to derive basin characteristics, including basin and sub-basin boundaries, river networks and slope. Figure 1 shows the elevation distribution in the UBNRB derived from the HYDRO1k DEM dataset.
Daily precipitation, mean temperature, relative humidity, sunshine hours and wind speed data of 15 weather stations have been used as input to the WEP model. The datasets were obtained from Ethiopia’s National Meteorology Agency (NMA). The temporal extent of the datasets is 1992–2014. The location of these weather stations is shown in Figure 1.
Monthly streamflow data from 1992 to 2014 at Kessie and El-Diem (basin outlet) stations have been collected from the Ethiopian Ministry of Water and Irrigation and various literature. Both of these stations are located on the main section of the Blue Nile river (Figure 1). The dataset is used to calibrate and validate the WEP simulation of UBNRB. The calibration period taken was 1992–2000 (9 years).
We took the Global Land Cover Characterization (GLCC) dataset to represent land cover information of UBNRB from 1992 to 2001. The GLCC was made available by the USGS and accessed through the USGS EarthExplorer platform. The GLCC was derived using an unsupervised classification of 1-km Advanced Very High-Resolution Radiometer (AVHRR) 10-days Normalized Difference Vegetation Index (NDVI) composites. It was typically developed using the AVHRR imageries dating from april 1992 through March 1993 (Loveland et al., 2000).
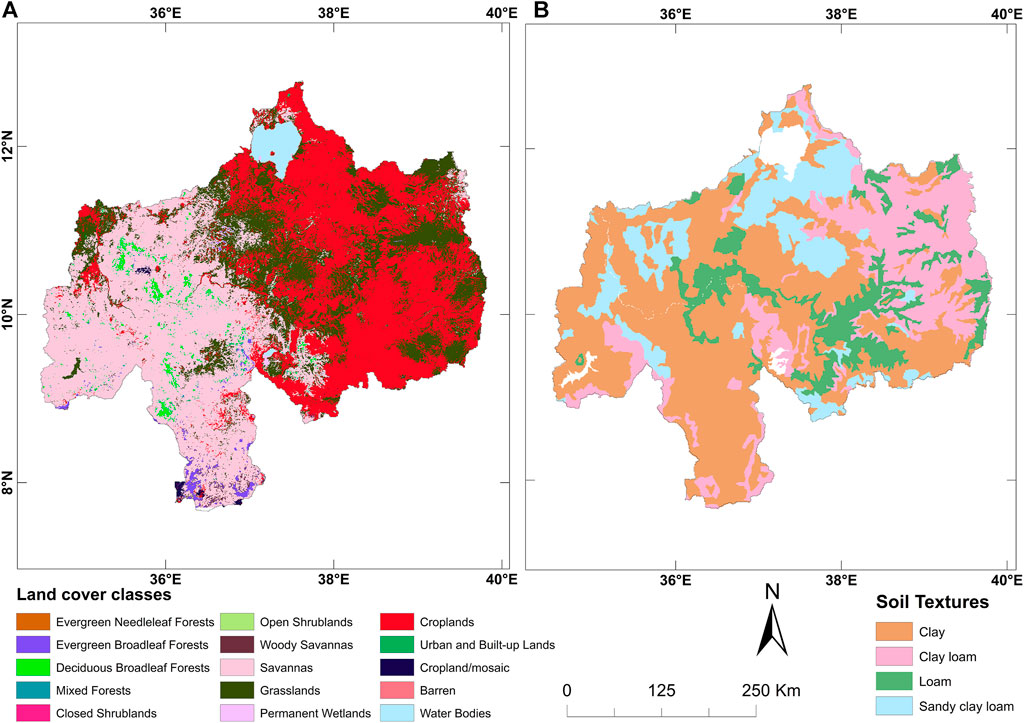
We also used the Moderate Resolution Imaging Spectroradiometer (MODIS) Land Cover Type Product (MCD12Q1) data for 2001 and 2010. The MCD12Q1 product is developed using a supervised classification of MODIS reflectance data (Friedl et al., 2002; Friedl et al., 2010). It has a resolution of 500 m and we accessed it via https://lpdaac.usgs.gov/products/mcd12q1v006/. MCD12Q1 data for the year 2010 for the UBNRB is shown in Figure 3A.
The Harmonized World Soil database (HWSD), developed by FAO and IIASA, is used to extract soil information for the study area (https://www.fao.org/soils-portal/soil-survey/soil-maps-and-databases/harmonized-world-soil-database-v12/ru/). HWSD contains over 15,000 different soil mapping units distributed all over the world. Soil information such as soil texture, available water capacity and root zone depth were extracted. HWSD soil texture distributions of UBNRB are shown in Figure 3B.
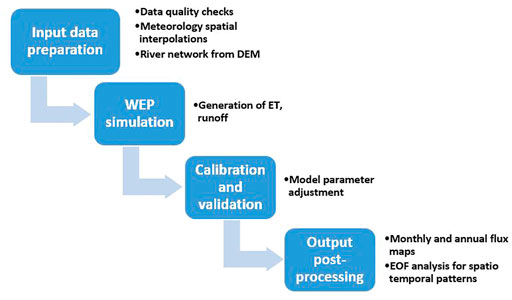
2.4 Input Data Preparation
A thorough quality check was conducted on the observed meteorological and hydrological data. The check includes assessing missing data from individual stations, detecting outliers and verifying homogeneity. Missing data for a given station were corrected against neighboring stations. The presence of outliers was verified by comparing the observation of a given day/month with the observations of other years but within the same month. The double mass curve technique described in (Searcy, 1960) was applied to check the consistency and homogeneity of each station.
We used the DEM data to delineate basin and sub-basin boundaries, extract river networks, flow direction and accumulation and slope information. The basin delineation and information extraction from the DEM were conducted using the ArcGIS Hydrology toolbox. Accordingly, 25 sub-basins were delineated and the corresponding grid cells (nearly 1 km) of each sub-basin were used as a computation unit to perform the WEP simulation.
The land use data were summarized in every WEP computation unit (grid cells) using the mosaic method (Avissar and Pielke, 1989; Jia et al., 2001). The mosaic approach enables consideration of sub-grid heterogeneity of land use. As a result, the land use classes of the GLCC and MCD12Q1 land cover datasets were categorized into six major land use classes of WEP implementation: water bodies, urban covers, urban canopies, tall vegetation, short vegetation and bare soils.
The Thiessen polygon method was adopted for spatial interpolation of meteorological data. As a result, the UBNRB was subdivided into 15 Thiessen polygon regions of precipitation, mean temperature, wind speed, sunshine hour and relative humidity.
For consistency, all the input gridded datasets were projected to UTM Zone 37N projected coordinate system. The soil and land cover datasets were also resampled to the resolution of the DEM (nearly 1 km) using the nearest neighbor resampling technique.
Figure 4 shows the workflow of the current study.
2.5 Evaluation Metrics
To measure the goodness of fit between observed and simulated discharges at the two locations, we used three indices, namely Kling Gupta Efficiency (KGE), Percent bias (PBIAS) and Pearson correlation coefficient (r).
The KGE is useful in various validation studies as it summarizes the assessment of temporal dynamics, dry and wet biases, and dispersion using a single metric: the KGE (Kling et al., 2012). The optimum value for KGE is unity. Generally, KGE values above 0.75 are considered good and values higher than 0.5 are moderately good.
PBIAS measures the average tendency of simulated values to be larger or smaller than their observed counterparts. A PBIAS value close to zero indicates a better estimation. A positive value indicates overestimation and a negative value indicates underestimation (Gupta et al., 1999; Moriasi et al., 2007).
Pearson correlation coefficient shows the linear relationship between two sets of data (Moriasi et al., 2007). A simulation with a correlation coefficient close to one is considered good. Details of the evaluation matrices used in this study are provided in the appendix.
Nash-Sutcliffe efficiency (NSE) is widely used to evaluate the performance of hydrologic models. However, in this study, we chose to use the alternative metric, the KGE. Since NSE is sensitive to extreme values, it might yield sub-optimal results when the dataset contains large outliers (Krause et al., 2005). It also masks important behaviors such as bias, randomness, and other components (Gupta and Kling, 2011). The KGE addresses these shortcomings well (Knoben et al., 2019).
Calibration is done by manual tuning of WEP model parameters. The parameters were adjusted during the calibration period (1992–2000) to obtain better estimates of water budget components. The calibration criteria were to maximize the Kling Gupta efficiency of discharges and the correlation coefficient between simulated and observed discharges. After the model calibration, all parameters were kept unchanged. Then a continuous simulation from 1992 to 2014 was performed to verify the model by using the observed monthly discharges at the two main gage stations in the basin.
3 Results and Discussions
3.1 Model Performance
The routed runoff at two locations is compared with observed discharges (Figure 5). The location of these gauge stations is given in Figure 1. During the calibration period (1992–2000), WEP model parameter values were adjusted manually to obtain better estimates of water cycle components. After the calibration process, a continuous simulation of 23 years (1992–2014) was performed by keeping the calibrated parameter values unchanged. Good values of goodness of fit indices were obtained at the internal Kessie station (KGE = 0.78, PBIAS = 0.14, r = 0.85). Model performances at the outlet El-Diem station were also good (KGE = 0.69, PBIAS = 10.14, r = 0.78), indicating the capability of the WEP model in reproducing the UBNRB hydrology.
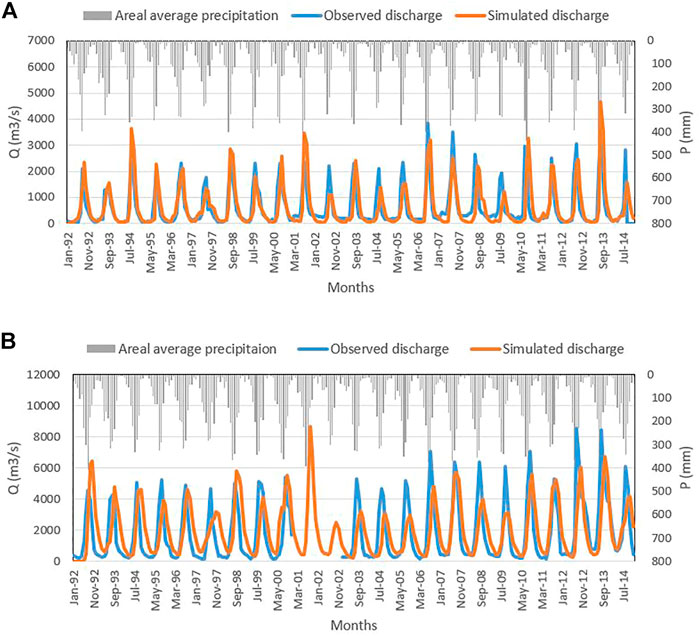
FIGURE 5. Comparison of WEP simulated monthly discharges at two locations: Kessie station (A) and El-Diem station (B).
In general, the model simulates both high flows and low flows well. At the sub-basin scale (at the outlet of the Kessie sub-basin), the simulation agrees with the observed flows for most of the simulation period. However, a slight shift of simulated discharge is apparent at the basin scale. The shift is likely due to the overestimation of land and channel slopes which ultimately caused a quicker flow at the outlet. Such increased slope could be due to the limitation of deriving accurate slope information from the coarse resolution DEM grid cells (nearly 1 km) used in the study.
A slight underestimation of discharge, especially after 2003, is also observed at El-Diem station. This underestimation is likely due to uncertainties in the soil information, such as using larger values of available water holding capacity in some soil types, which ultimately produced lesser runoff. Other errors for the mismatch between observed and simulated discharges could come from a lack of detailed information on the basin’s water use, diversions, uncertainties in input datasets and errors in observed discharges. Despite these defects, generally speaking, the simulation and the goodness of fit indices are quite encouraging and the simulated discharge hydrographs match well with the observed ones.
3.2 Precipitation Distribution
The long-term (1992–2014) mean annual precipitation distribution of UBNRB is given in Figure 6A. The southern highlands of the basin receive the highest amount of annual precipitation. In these areas, the magnitude reaches up to 1260 mm/year. On the other hand, the eastern portions receive the least annual precipitation reaching up to 720 mm/year. The central parts receive moderate annual precipitation up to 1,000 mm/year. The average annual precipitation increases from the eastern to southern direction. This pattern of increasing precipitation from eastern and northeastern portions of the basin to southern and southwestern portions is reported in Abtew et al. (2009), Abebe et al. (2020) and Abera et al. (2017).
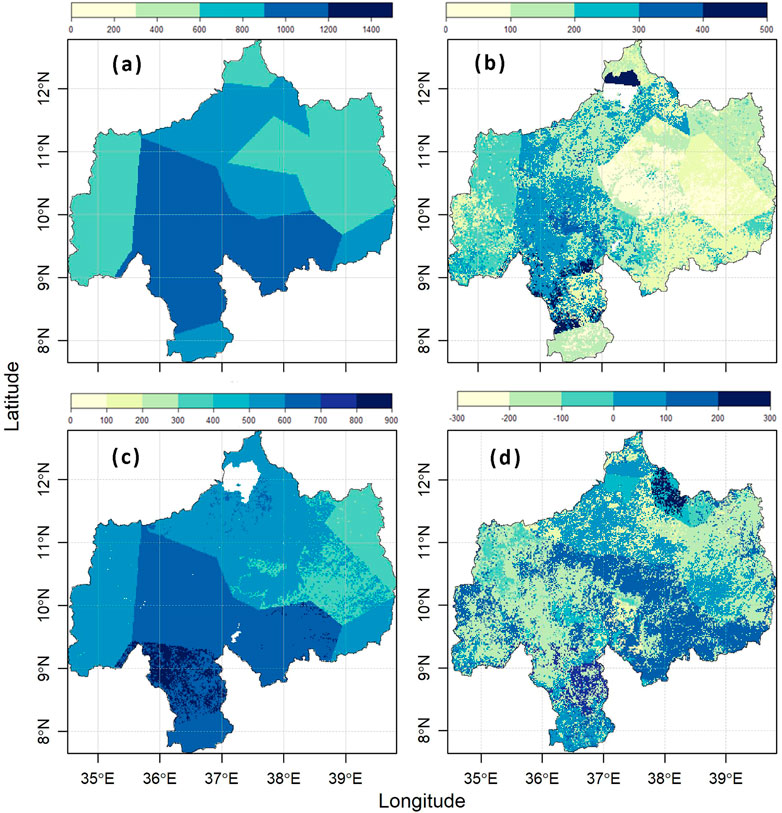
FIGURE 6. The spatial distributions of long-term mean annual water budget components: precipitation (A), runoff (B), ET (C) and TWSC (D). All units are in mm.
The long-term (1992–2014) mean monthly precipitation distribution of UBNRB for 4 months is given in Figure 7A. The months (January, april, July, and October) were selected to show the four conventional seasons (winter, spring, summer, and autumn). The basin receives higher precipitation magnitudes (up to 360 mm/month) during the long rainy season from June to September. During the short rainy season (March-May), the central and southern portions receive significant precipitation up to 56 mm/month and 100 mm/month. In the remaining months, the basin stays relatively dry. A higher seasonal precipitation variability can be observed from the monthly average maps. The complete distribution of mean monthly precipitation and other fluxes in UBNRB is given in the Supplementary Material.
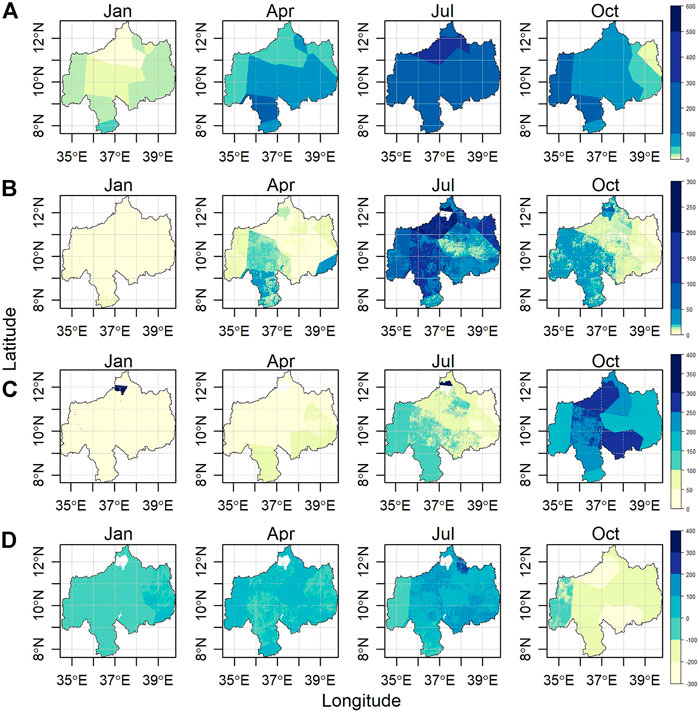
FIGURE 7. Spatial distribution of long-term mean monthly water budget (January, april, July, and October) in the UBNRB. Labels (A), (B), (C) and (D) represent the entire row. Maps for the remaining months are given in supplement.
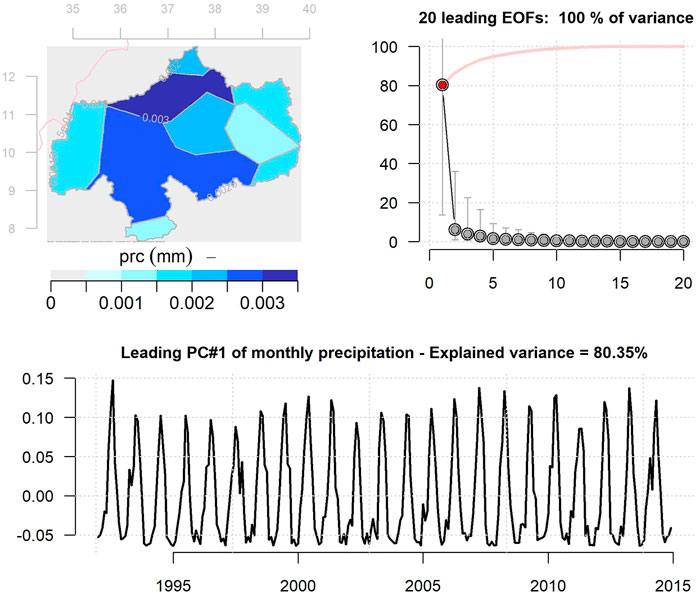
To better demonstrate the spatial and temporal variabilities in the precipitation, runoff, ET and TWSC, we conducted an empirical orthogonal functions (EOF) analysis. Figure 8 shows the output of the EOF analysis performed on the monthly precipitation of UBNRB. The first leading mode explains about 81% of the variabilities in the monthly precipitation. The spatial pattern in the first EOF (shown as the map) indicates above-average precipitation condition all over the study area. The basin’s northern and southern portions show the highest precipitation intensity in the spatial field map. The temporal variability of the first EOF (shown as time series plot of the principal component (PC)) shows the obvious annual cycles of the UBNRB precipitation. The EOF analysis results of the remaining fluxes, i.e., ET, runoff, and TWSC, are given in the current paper’s supplement.
3.3 Runoff
The spatial pattern of runoff distribution in the UBNRB generally follows the basin’s precipitation distribution. With significant precipitation, a considerable amount of runoff is generated depending on the soil conditions and land cover types. Figure 7B shows the basin’s long-term mean monthly runoff pattern. High seasonal variability of runoff following the precipitation nature is observed in the basin (Figure 7B). The long rainy season (June to December) exhibits the highest runoff generation, reaching 110 mm/month. In contrast, the short rainy season (March to May) produces significant runoff in the southern portions of the basin. Little runoff is generated during the dry season (October to February).
Outputs of EOF analysis of the monthly runoff of UBNRB are given in Supplementary Figure S5 and Supplementary Figure S6 (see Supplementary Material). The first two leading modes explain 43.96 and 18.57% of the variability in the runoff, respectively. The spatial pattern in the first EOF indicates above-average runoff conditions over most of UBNRB. The temporal variability of the first EOF showed the annual runoff variability.
3.4 Evapotranspiration
The long-term (1992–2014) mean annual ET pattern estimated by WEP is given in Figure 6C. The basin’s central and southern portions lose significant moisture through evapotranspiration, amounting to 710 mm/year and 872 mm/year. This increase in ET could be mainly due to the availability of plenty of moisture in these areas and better vegetation coverage. On the other hand, Eastern portions exhibit a smaller ET between 300 mm/year and 400 mm/year. The limitation on ET of these areas could be due to relatively smaller precipitation and seasonal crop coverage.
The long-term mean monthly ET of the basin follows a different temporal variability than precipitation and runoff (Figure 7C). The highest ET (up to 281 mm/month) is observed in the dry season (October to February). On the other hand, ET is relatively smaller (up to 145 mm/month) during the long rainy season (June to September). The eastern and northeastern portions of the basin show relatively lower mean monthly ET. Southern and southwestern areas of the basin exhibit the highest ET.
Supplementary Figure S7 (see Supplementary Material) shows the output of the EOF analysis performed on the monthly ET of UBNRB. The first leading mode explains about 85% of the variabilities in the monthly ET. The spatial pattern in the first EOF (shown as the map) indicates an above-average ET condition in most portions of the study area. Southern and southwestern portions of the basin show relatively high ET intensity in the spatial field map compared to eastern and north eastern portions. The temporal variability of the first EOF (shown as time series plot) shows the annual cycles of the UBNRB evapotranspiration.
3.5 Total Water Storage Change
Total water storage change (TWSC) was calculated as residual of WEP simulated fluxes, i.e., by subtracting runoff and ET from precipitation. The long-term (1992–2014) mean annual TWSC pattern is given in Figure 6D. The basin’s central and southern portions tend to store significant water up to 150 mm/year. On the other hand, Eastern portions experience a decline in stored water amounting up to 120 mm/year. The decline in storage could be due to water loss due to higher evapotranspiration in these areas.
Long term mean monthly distribution of TWSC in the basin is shown in Figure 7D. Following the precipitation and runoff patterns, a positive TWSC (up to +150 mm/month) is observed in the long rainy season (June to September) and short rainy seasons (March to May). A negative TWSC (up to −225 mm/month) was observed during the dry season (October to February).
Supplementary Figure S8 (see Supplementary Material) shows the output of the EOF analysis performed on the monthly TWSC of UBNRB. The first leading mode explains about 73% of the variabilities in the monthly TWSC. The spatial pattern in the first EOF (shown as the map) indicates an above-average TWSC condition in most portions of the study area. Eastern and northeastern portions of the basin show relatively lower TWSC in the spatial field map compared to southern and southwestern portions. The temporal variability of the first EOF (shown as time series plot) shows the annual cycles of the UBNRB total water storage change.
3.6 Long Term Basin Averages
The variation of mean monthly water budget fluxes in the basin for the 23 years (1992–2014) is given in Figure 9. The basin-wide average rainy season precipitation reaches the maximum (up to 234 mm) during July and the minimum (8.3 mm) during February. Monthly runoff follows the same pattern as the precipitation and attains its maximum (80.1 mm) and minimum (0.4 mm) values in the same months. On the other hand, ET gets out of phase with precipitation and attains its maximum value (110 mm) in October and its minimum value (11.1 mm) in February. This phenomenon clearly shows that more water from storage was available to ET during the dry season than the precipitation. As a result of the interplay between precipitation, runoff and ET, the storage shows a buildup (positive TWSC) during the rainy seasons and a decline (negative TWSC) during the dry season. The maximum buildup (103 mm) of storage was seen in July and the maximum decline (−56.2 mm) was in October.
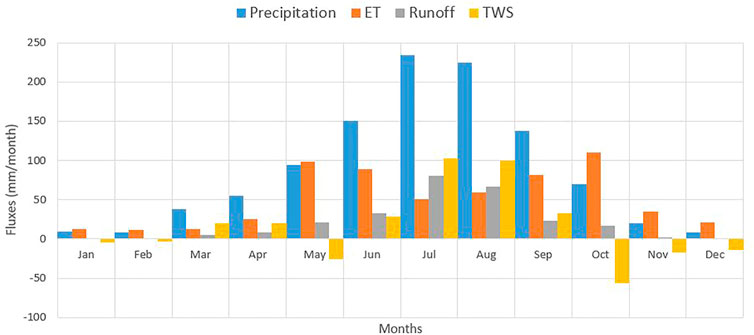
FIGURE 9. Monthly mean water-budget components on a long-term basin scale. The relative shares of the four components (Precipitation, Runoff, ET and TWSC) are shown.
The seasonal variation of basin-wide averaged water budget fluxes of UBNRB for the year 1992–2014 is shown in Figure 10. The average precipitation reaches its maximum (up to 609 mm) during the long rainy season and the minimum (26.9 mm) during the dry season. Seasonal runoff follows the same pattern as the precipitation and attains its maximum (179.3 mm) and minimum (2.5 mm) values in the same season. On the other hand, ET gets out of phase with precipitation and attains its maximum value (227.2 mm) in the September-November season and its minimum value (45.3 mm) in the dry season. The basin storage shows a buildup (positive TWSC) during the rainy seasons and a decline (negative TWSC) during the dry season. The maximum buildup (230.7 mm) of storage was seen during the June-August season and the maximum decline (−40.9 mm) was during the September-November season.
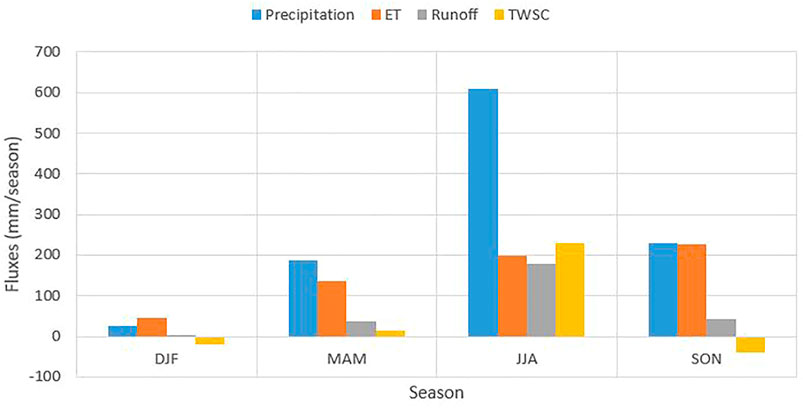
FIGURE 10. Seasonal mean water-budget components on a long-term basin scale. The relative shares of the four components (Precipitation, Runoff, ET and TWSC) are shown. DJF (December-February), MAM (March-May), JJA (June-August) and SON (September-November).
Inter-annual variation of basin-wide averaged water budget fluxes of UBNRB obtained from WEP simulation for the year 1992–2014 is shown in Figure 11. 1992 and 2000 were the rainiest years, with mean precipitation values of 1,208 mm and 1,199 mm, respectively. On the other hand, 2002 and 1995 were the driest years with mean precipitations of 859 and 890 mm, respectively. The inter-annual variability in ET, runoff and TWSC is relatively small. The 23-years basin average precipitation is 1,051 mm per year. Evapotranspiration accounts for 58% of the annual water budget, runoff is 25% and storage is 18%.
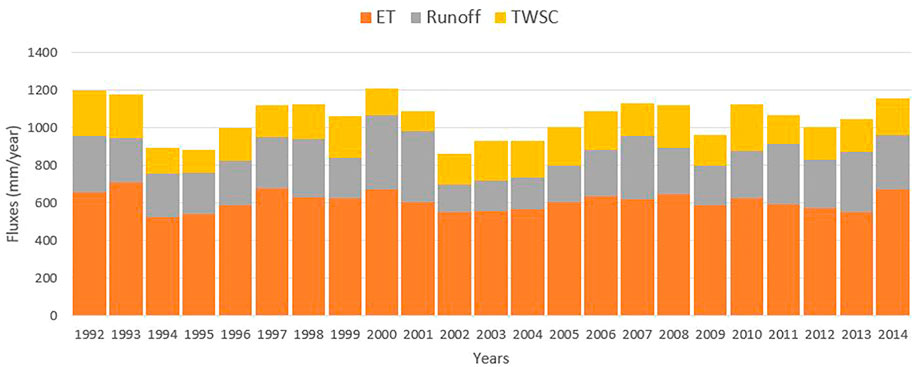
FIGURE 11. Water-budget components of the basin and its annual variabilities from 1992 to 2014. The relative share of each of the three components (Runoff, ET and TWSC) is shown. The length of the bars represents total precipitation.
4 Conclusion
The main objective of this study was to estimate the water budget and its spatial and temporal variability in the Upper Blue Nile basin. We used a physically-based distributed hydrological model to quantify water budget components. The study covered 23 years from 1992 to 2014 on a monthly temporal scale. HYDRO1k DEM, GLCC and MCD12Q1 land cover data and HWSD soil information were used for the analysis. We also used two site discharge time series and 15 ground-based meteorological stations information.
The Results Obtained Show That
• The basin-scale annual precipitation over the basin is 1,050 mm/year and is highly variable spatially. The southern parts of the basin receive the highest precipitation, which tends to decrease towards the eastern parts of the basin.
• ET is the larger flux in the water budget of the basin. The average basin-scale ET is about 608 mm/year and tends to be higher in the dry season and lower in the long rainy season.
• The WEP reproduced discharge well at the outlet station (KGE = 0.69) and Kessie station (KGE = 0.78). The long-term annual runoff of the UBN basin is about 260 mm/year and follows the precipitation pattern
Despite the encouraging results obtained, it is important to note that this study is limited by the lack of dense weather station information and the availability of detailed in-situ observations. Furthermore, we couldn’t incorporate water withdrawal and water use information in the water budget computations due to the unavailability of withdrawal and water use information. The findings reported in this study can shed some light on understanding the UBNRB water budget dynamics and inform water management practitioners. However, further research is needed to explain the spatio-temporal variabilities of UBNRB water budget components.
Data Availability Statement
The original contributions presented in the study are included in the article/Supplementary Material, further inquiries can be directed to the corresponding author.
Author Contributions
SA, TQ, and DY conceived the main idea of this manuscript. SA, XZ, and CL conducted the analysis. SA wrote the draft manuscript and all authors contributed to improving it.
Funding
This research was supported by the National Science Fund (Grant No. 51725905; 52130907).
Conflict of Interest
The authors declare that the research was conducted in the absence of any commercial or financial relationships that could be construed as a potential conflict of interest.
Publisher’s Note
All claims expressed in this article are solely those of the authors and do not necessarily represent those of their affiliated organizations, or those of the publisher, the editors and the reviewers. Any product that may be evaluated in this article, or claim that may be made by its manufacturer, is not guaranteed or endorsed by the publisher.
Acknowledgments
We would like to thank the National Meteorological Agency and the Ministry of Water and Energy of Ethiopia for the meteorological and discharge data. We also thank the three reviewers for their work that helped us to improve the quality of the manuscript.
Supplementary Material
The Supplementary Material for this article can be found online at: https://www.frontiersin.org/articles/10.3389/feart.2022.923252/full#supplementary-material
Appendix A Model goodness of fit indices used in the study
1. Kling-Gupta Efficiency
a. Modified Kling-Gupta Efficiency (KGE′)
b. Pearson correlation coefficient (r)
c. Bias ratio (β)
d. Variability ratio (γ)
Where x = observed discharge, y = simulated discharge, n = number of observations, x̄ = average of observed discharge, ȳ = average simulated discharge, sx = standard deviation of observed discharge, sy = standard deviation of simulated discharge.
2. Percent Bias
Where Pi = predicted discharge (simulation) and Oi = observed discharge.
References
Abebe, S. A., Qin, T., Yan, D., Gelaw, E. B., Workneh, H. T., Kun, W., et al. (2020). Spatial and Temporal Evaluation of the Latest High-Resolution Precipitation Products over the Upper Blue Nile River Basin, Ethiopia. Water 12, 3072. doi:10.3390/w12113072
Abera, W., Formetta, G., Brocca, L., and Rigon, R. (2017). Modeling the Water Budget of the Upper Blue Nile Basin Using the JGrass-NewAge Model System and Satellite Data. Hydrol. Earth Syst. Sci. 21, 3145–3165. doi:10.5194/hess-21-3145-2017
Abtew, W., Melesse, A. M., and Dessalegne, T. (2009). Spatial, Inter and Intra-annual Variability of the Upper Blue Nile Basin Rainfall. Hydrol. Process. 23, 3075–3082. doi:10.1002/hyp.7419
Allam, M. M., Jain Figueroa, A., McLaughlin, D. B., and Eltahir, E. A. B. (2016). Estimation of Evaporation over the Upper Blue Nile Basin by Combining Observations from Satellites and River Flow Gauges. Water Resour. Res. 52, 644–659. doi:10.1002/2015WR017251
Asseng, S., Kheir, A. M. S., Kassie, B. T., Hoogenboom, G., Abdelaal, A. I. N., Haman, D. Z., et al. (2018). Can Egypt Become Self-Sufficient in Wheat? Environ. Res. Lett. 13, 094012. doi:10.1088/1748-9326/aada50
Avissar, R., and Pielke, R. A. (1989). A Parameterization of Heterogeneous Land Surfaces for Atmospheric Numerical Models and its Impact on Regional Meteorology. Mon. Wea. Rev. 117, 2113–2136. doi:10.1175/1520-0493(1989)117<2113:apohls>2.0.co;2
Burrows, K., and Kinney, P. (2016). Exploring the Climate Change, Migration and Conflict Nexus. Int J Environ Res Public Health. 13, 443. doi:10.3390/ijerph13040443
Coffel, E. D., Keith, B., Lesk, C., Horton, R. M., Bower, E., Lee, J., et al. (2019). Future Hot and Dry Years Worsen Nile Basin Water Scarcity Despite Projected Precipitation Increases. Earth's Future 7, 967–977. doi:10.1029/2019EF001247
Conway, D. (2005). From Headwater Tributaries to International River: Observing and Adapting to Climate Variability and Change in the Nile Basin. Glob. Environ. Change 15, 99–114. doi:10.1016/j.gloenvcha.2005.01.003
Conway, D. (2000). The Climate and Hydrology of the Upper Blue Nile River. Geogr. J. 166, 49–62. doi:10.1111/j.1475-4959.2000.tb00006.x
Friedl, M. A., McIver, D. K., Hodges, J. C. F., Zhang, X. Y., Muchoney, D., Strahler, A. H., et al. (2002). Global Land Cover Mapping from MODIS: Algorithms and Early Results. Remote Sens. Environ. 83, 287–302. doi:10.1016/S0034-4257(02)00078-0
Friedl, M. A., Sulla-Menashe, B., Schneider, A., Ramankutty, N., Sibley, A., and Huang, X. (2010). MODIS Collection 5 Global Land Cover: Algorithm Refinements and Characterization of New Datasets. Remote Sens. Environ. 114, 168–182. doi:10.1016/j.rse.2009.08.016
Gao, H., Tang, Q., Ferguson, C. R., Wood, E. F., and Lettenmaier, D. P. (2010). Estimating the Water Budget of Major US River Basins via Remote Sensing. Int. J. Remote Sens. 31, 3955–3978. doi:10.1080/01431161.2010.483488
Giannini, A., Saravanan, R., and Chang, P. (2003). Oceanic Forcing of Sahel Rainfall on Interannual to Interdecadal Time Scales. Science 302, 1027–1030. doi:10.1126/science.1089357
Gupta, H. V., and Kling, H. (2011). On Typical Range, Sensitivity, and Normalization of Mean Squared Error and Nash-Sutcliffe Efficiency Type Metrics: TECHNICAL NOTE. Water Resour. Res. 47. doi:10.1029/2011WR010962
Gupta, H. V., Sorooshian, S., and Yapo, P. O. (1999). Status of Automatic Calibration for Hydrologic Models: Comparison with Multilevel Expert Calibration. J. Hydrol. Eng. 4, 135–143. doi:10.1061/(asce)1084-0699(1999)4:2(135)
Jia, Y., Kinouchi, T., and Yoshitani, J. (2005). Distributed Hydrologic Modeling in a Partially Urbanized Agricultural Watershed Using Water and Energy Transfer Process Model. J. Hydrol. Eng. 10, 253–263. doi:10.1061/(asce)1084-0699(2005)10:4(253)
Jia, Y., Ni, G., Kawahara, Y., and Suetsugi, T. (2001). Development of WEP Model and its Application to an Urban Watershed. Hydrol. Process. 15, 2175–2194. doi:10.1002/hyp.275
Jia, Y., Ni, G., Yoshitani, J., Kawahara, Y., and Kinouchi, T. (2002). Coupling Simulation of Water and Energy Budgets and Analysis of Urban Development Impact. J. Hydrol. Eng. 7, 302–311. doi:10.1061/(asce)1084-0699(2002)7:4(302)
Jia, Y., and Tamai, N. (1998). Water and Heat Balances in The Middlereach Catchment of Tama River and Sensitivity Analysis. Proc. HYDRAULIC Eng. 42, 151–156. doi:10.2208/prohe.42.151
Jia, Y., Wang, H., Zhou, Z., Qiu, Y., Luo, X., Wang, J., et al. (2006). Development of the WEP-L Distributed Hydrological Model and Dynamic Assessment of Water Resources in the Yellow River Basin. J. Hydrology 331, 606–629. doi:10.1016/j.jhydrol.2006.06.006
Jung, H. C., Getirana, A., Policelli, F., McNally, A., Arsenault, K. R., Kumar, S., et al. (2017). Upper Blue Nile Basin Water Budget from a Multi-Model Perspective. J. Hydrology 555, 535–546. doi:10.1016/j.jhydrol.2017.10.040
Kent, C., Pope, E., Thompson, V., Lewis, K., Scaife, A. A., and Dunstone, N. (2017). Using Climate Model Simulations to Assess the Current Climate Risk to Maize Production. Environ. Res. Lett. 12, 054012. doi:10.1088/1748-9326/aa6cb9
Kim, U., and Kaluarachchi, J. J. (2009). Climate Change Impacts on Water Resources in the Upper Blue Nile River Basin, Ethiopia1. JAWRA J. Am. Water Resour. Assoc. 45, 1361–1378. doi:10.1111/j.1752-1688.2009.00369.x
Kim, U., Kaluarachchi, J. J., and Smakhtin, V. U. (2008). Generation of Monthly Precipitation under Climate Change for the Upper Blue Nile River Basin, Ethiopia1. JAWRA J. Am. Water Resour. Assoc. 44, 1231–1247. doi:10.1111/j.1752-1688.2008.00220.x
Kling, H., Fuchs, M., and Paulin, M. (2012). Runoff Conditions in the Upper Danube Basin under an Ensemble of Climate Change Scenarios. J. Hydrology 424-425 (425), 264–277. doi:10.1016/j.jhydrol.2012.01.011
Knoben, W. J. M., Freer, J. E., and Woods, R. A. (2019). Technical Note: Inherent Benchmark or Not? Comparing Nash-Sutcliffe and Kling-Gupta Efficiency Scores. Hydrol. Earth Syst. Sci. 23, 4323–4331. doi:10.5194/hess-23-4323-2019
Krause, P., Boyle, D. P., and Bäse, F. (2005). Comparison of Different Efficiency Criteria for Hydrological Model Assessment. Adv. Geosci. 5, 89–97. doi:10.5194/adgeo-5-89-2005
Lesk, C., Rowhani, P., and Ramankutty, N. (2016). Influence of Extreme Weather Disasters on Global Crop Production. Nature 529, 84–87. doi:10.1038/nature16467
Li, J., Zhou, Z., Wang, H., Liu, J., Jia, Y., Hu, P., et al. (2019). Development of WEP-COR Model to Simulate Land Surface Water and Energy Budgets in a Cold Region. Hydrology Res. 50, 99–116. doi:10.2166/nh.2017.032
Loveland, T. R., Reed, B. C., Brown, J. F., Ohlen, D. O., Zhu, Z., Yang, L., et al. (2000). Development of a Global Land Cover Characteristics Database and IGBP DISCover from 1 Km AVHRR Data. Int. J. Remote Sens. 21, 1303–1330. doi:10.1080/014311600210191
Mellander, P.-E., Gebrehiwot, S. G., Gärdenäs, A. I., Bewket, W., and Bishop, K. (2013). Summer Rains and Dry Seasons in the Upper Blue Nile Basin: The Predictability of Half a Century of Past and Future Spatiotemporal Patterns. PLoS ONE 8, e68461. doi:10.1371/journal.pone.0068461
Moriasi, D. N., Arnold, J. G., Van Liew, M. W., Bingner, R. L., Harmel, R. D., and Veith, T. L. (2007). Model Evaluation Guidelines for Systematic Quantification of Accuracy in Watershed Simulations. Trans. ASABE 50, 885–900. doi:10.13031/2013.23153
Samy, A., Ibrahim, M. G., Mahmod, W. E., Fujii, M., Eltawil, A., and Daoud, W. (2019). Statistical Assessment of Rainfall Characteristics in Upper Blue Nile Basin over the Period from 1953 to 2014. Water 11, 468. doi:10.3390/w11030468
Searcy, J. K. (1960). Double-mass Curves, with a Section Fitting Curves to Cyclic Data. Washington, DC: U.S. Government Printing Office. doi:10.3133/wsp1541B
Siam, M. S., and Eltahir, E. A. B. (2017). Climate Change Enhances Interannual Variability of the Nile River Flow. Nat. Clim. Change 7, 350–354. doi:10.1038/nclimate3273
Solomon, S.Intergovernmental Panel on Climate Change, and Intergovernmental Panel on Climate Change (2007). Climate Change 2007: The Physical Science Basis: Contribution of Working Group I to the Fourth Assessment Report of the Intergovernmental Panel on Climate Change. Cambridge ; New York: Cambridge University Press.
Taye, M. T., Ntegeka, V., Ogiramoi, N. P., and Willems, P. (2011). Assessment of Climate Change Impact on Hydrological Extremes in Two Source Regions of the Nile River Basin. Hydrol. Earth Syst. Sci. 15, 209–222. doi:10.5194/hess-15-209-2011
Tekleab, S., Uhlenbrook, S., Mohamed, Y., Savenije, H. H. G., Temesgen, M., and Wenninger, J. (2011). Water Balance Modeling of Upper Blue Nile Catchments Using a Top-Down Approach. Hydrol. Earth Syst. Sci. 15, 2179–2193. doi:10.5194/hess-15-2179-2011
Tesemma, Z. K., Mohamed, Y. A., and Steenhuis, T. S. (2010). Trends in Rainfall and Runoff in the Blue Nile Basin: 1964-2003. Hydrol. Process. 24, 3747–3758. doi:10.1002/hyp.7893
Tong, K., Su, F., and Li, C. (2020). Modeling of Water Fluxes and Budget in Nam Co Basin during 1979-2013. J. Hydrometeorol. 21, 829–844. doi:10.1175/JHM-D-19-0135.1
Vieux, B. E. (2008). “Distributed Hydrologic Modeling,” in Encyclopedia of GIS. Editors S. Shekhar, and H. Xiong (Boston, MA: Springer US), 250–254. doi:10.1007/978-0-387-35973-1_317
Wale, A., Rientjes, T. H. M., Gieske, A. S. M., and Getachew, H. A. (2009). Ungauged Catchment Contributions to Lake Tana’s Water Balance. Hydrol. Process. 23 (26), 3682–3693. doi:10.1002/hyp.7284
Weng, B. S., Yan, D. H., Wang, H., Liu, J. H., Yang, Z. Y., Qin, T. L., et al. (2015). Drought Assessment in the Dongliao River Basin: Traditional Approaches vs. Generalized Drought Assessment Index Based on Water Resources Systems. Nat. Hazards Earth Syst. Sci. 15, 1889–1906. doi:10.5194/nhess-15-1889-2015
Keywords: water budget, WEP, Upper Blue Nile, runoff, evapotranspiration
Citation: Abebe SA, Qin T, Zhang X, Li C and Yan D (2022) Estimating the Water Budget of the Upper Blue Nile River Basin With Water and Energy Processes (WEP) Model. Front. Earth Sci. 10:923252. doi: 10.3389/feart.2022.923252
Received: 19 April 2022; Accepted: 13 June 2022;
Published: 06 July 2022.
Edited by:
Xingcai Liu, Institute of Geographic Sciences and Natural Resources Research (CAS), ChinaReviewed by:
Miao Yu, Nanjing University of Information Science and Technology, ChinaXizhi Lv, Yellow River Institute of Hydraulic Research, China
Huiliang Wang, Zhengzhou University, China
Copyright © 2022 Abebe, Qin, Zhang, Li and Yan. This is an open-access article distributed under the terms of the Creative Commons Attribution License (CC BY). The use, distribution or reproduction in other forums is permitted, provided the original author(s) and the copyright owner(s) are credited and that the original publication in this journal is cited, in accordance with accepted academic practice. No use, distribution or reproduction is permitted which does not comply with these terms.
*Correspondence: Tianling Qin, cWludGxAaXdoci5jb20=
 Sintayehu A. Abebe
 Tianling Qin
 Xin Zhang
 Chenhao Li
 Denghua Yan