- 1Southern Marine Science and Engineering Guangdong Laboratory (Guangzhou), Guangzhou, China
- 2National Engineering Research Center of Gas Hydrate Exploration and Development, Guangzhou Marine Geological Survey, Guangzhou, China
- 3Key Laboratory of Tectonics and Petroleum Resources, The Ministry of Education, China University of Geosciences, Wuhan, China
- 4School of Earth Resources, China University of Geosciences, Wuhan, China
The scarcity of drilling in the deep water area of Qiongdongnan Basin restricts the cognition and prediction of overpressure. In this paper, a shallow zone of overpressure at the depth of 900–1,200 m below the sea floor in the deep water area was found by analyzing electronic logs, mud pressure (Mud pressure is a product of the height of the column of mud, density and gravity acceleration) and test pressure from drill stem testing (DST) and modular dynamic testing (MDT), and the interpretation of anomalous seismic interval velocities. The shallow overpressure is a newly observed geological phenomenon in the South China Sea for which the generation mechanisms are not well understood, despite similar observations and analyses elsewhere in the world. Two representative wells, one each located in the shallow water and the deep water areas, respectively were selected to investigate the vertical distribution of the shallow overpressure. The top of the overpressure in Well A in the shallow water area is about 2,111 m below sea floor, while the top of the overpressure in Well B in the deep water area is about 1,077 m below sea floor. A pressure coefficient (i.e., ratio of pore pressure to the normal hydrostatic pressure measured from the sea surface) profile was constructed from the shallow water area to the deep water area using the calibrated relationship between seismic interval velocities and pressure data from 30 wells. The distance between the top of the overpressure and the seabed is predicted to be between 900 and 1,200 m in the deep water area Basin. Disequilibrium compaction is the interpreted primary cause of the shallow overpressure and the results of basin modeling indicate that the shallow overpressure was generated since 5.5 Ma.
Introduction
Overpressure, pore pressures in excess of hydrostatic, plays a critical role in geologic processes, such as retarding organic-matter maturation and petroleum generation (Hao et al., 1995, 1998; Zou and Peng, 2001; Radwana et al., 2020; Wang et al., 2022), improving reservoir porosity by resisting consolidation (Ma et al., 2008), driving petroleum migration (Tang and Lerche, 1993; Liu et al., 2021) and natural hydraulic fracturing (Hao et al., 2002), and inducing submarine landslides (Cobbold et al., 2004; Zhang et al., 2015). The Qiongdongnan Basin (QDNB) is an overpressured basin in the northern part of the South China Sea (Shi et al., 2013; Xu et al., 2017). Overpressure is an obvious geologic feature in the basin, where the maximum pressure coefficient from drill stem testing (DST) is as high as 2.27.
Shallow overpressure is a newly observed geological phenomenon in the Basin. Direct measurement in mudrocks from IODP Expedition 308 in the Gulf of Mexico using pore pressure penetrometers confirmed that overpressure can occur at depths of 0–600 m below the seafloor (Flemings et al., 2008; Binh et al., 2009; Long et al., 2011). Much study shows that the shallow overpressure has an important effect on submarine landslides (Dugan and Flemings, 2002; Flemings et al., 2008). Samples test from IODP Expedition 308 in the Gulf of Mexico shows that porosity varies from 80% at the seafloor to 37% at 620 m below the seafloor (Binh et al., 2009). These observations contradict the traditional thinking that overpressure is not possible in shallow formations with high porosity. Flemings et al. (2008) proposed that the high overpressures observed in IODP Expedition 308 were the result of rapid sedimentation of low permeability material from the ancestral Mississippi River. Porosity tests in the overpressure sections show that the values are high, greater than 37% in fact. The permeability values obtained from 14 consolidation tests ranged from 0.05 to 0.0001 mD under porosity conditions ranging from 33 to 47% (Binh et al., 2009). Long et al. (2011) proposed that rapid sediment consolidation near the seafloor at the IODP Expedition 308 location provided the fluid source to generate overpressure, despite the fact that these sediments have high porosity. These two opinions about the shallow overpressure formation share many similarities with the disequilibrium compaction mechanism for the generation of high pore pressures. Recent drilling indicates that shallow overpressure exists in the deep water area of the QDNB. The mechanism for the shallow overpressure in the QDNB has not been previously examined.
There are a number of papers published on overpressure generation mechanisms as a result of disequilibrium compaction (Dickinson, 1953; Skempton, 1970; Magara, 1975; Osborne and Swarbrick, 1997; Mondol et al., 2007; Tingay et al., 2009; Hua et al., 2021; Li et al., 2021), oil and gas generation (Timko and Fertl, 1971; Hedberg, 1974; Law and Dickinson, 1985; Spencer, 1987; Bredehoeft et al., 1994; Luo and Vasseur, 1996; Guo et al., 2010; Tingay et al., 2013), aquathermal pressuring (Barker, 1972; Bradley, 1975; Plumley, 1980; Sharp, 1983; Liu et al., 2019), fluid release during dehydration reactions (Powers, 1967; Schmidt, 1973; Magara, 1975; Li et al., 2016), vertical transfer of overpressures (Tingay et al., 2007), tectonic compression (Berry, 1973; Luo 2004; Luo et al., 2006; Zhang et al., 2021) and aquathermal expansion and clay dehydration (Luo and Vasseur, 1992; Osborne and Swarbrick, 1997; Wang et al., 2020). Disequilibrium compaction and oil and gas generation are believed to be the primary causes of overpressure in the young basins (Osborne and Swarbrick, 1997; Akrout et al., 2021). These reported overpressures all formed in the middle-deep formations of the basin. The mechanism of the shallow overpressure formation in the QDNB is investigated in this study.
The objectives of this article are 1) to document the characteristics of the overpressure distribution based on well-log and seismic analysis; 2) to determine the mechanism of the shallow overpressure formation in the QDNB. The method of revealing overpressure distribution we present can be applied around the world. Meanwhile, shallow overpressure was recognized as a common geological phenomenon, which provided a mechanism for submarine slope failures, fluid diapirs, and hydrocarbon migration. Revealing its distribution and genetic mechanism is of great significance for avoiding risk in construction and the prospecting of the shallow resource (e.g., natural gas hydrate).
Geological Background
The QDNB is located in the northern part of the South China Sea (108°50′—111°50′ E, 16°50′—19°00′ N). The basin covers an area of about 45,000 km2. The maximum thickness of Cenozoic sediments in the basin is in excess of 12,000 m (Wang et al., 2008; Wu et al., 2009). It can be divided into eight depocentres, namely the Yanan, Yabei, Songxi, Songdong, Ledong-Lingshui, Songnan-Baodao, Changchang and Beijiao sags (Figure 1). The basin underwent rifting from 50 to 21 Ma, thermal subsidence from 21 to 10.5 Ma, and then rapid subsidence from 10.5 Ma to the present. The break-up unconformity of T60 (21 Ma) divided the Cenozoic formations into two tectonic sequences. Faults are primarily distributed in the tectonic sequence of the region from the basement to the T60 horizon; the faults are seldom active in the sequences above the T60 horizon. The Eocene, Yacheng, Lingshui, Sanya, Meishan, Huangliu, Yinggehai, and Ledong formations (Fms.), can be identified with both geological and geophysical data (Figure 2). The basin has been filled by both continental and marine sequences. Continental facies dominated in the Eocene, whereas marine facies dominate from the Oligocene Yacheng formation (Fm.) to the present (Figure 2).
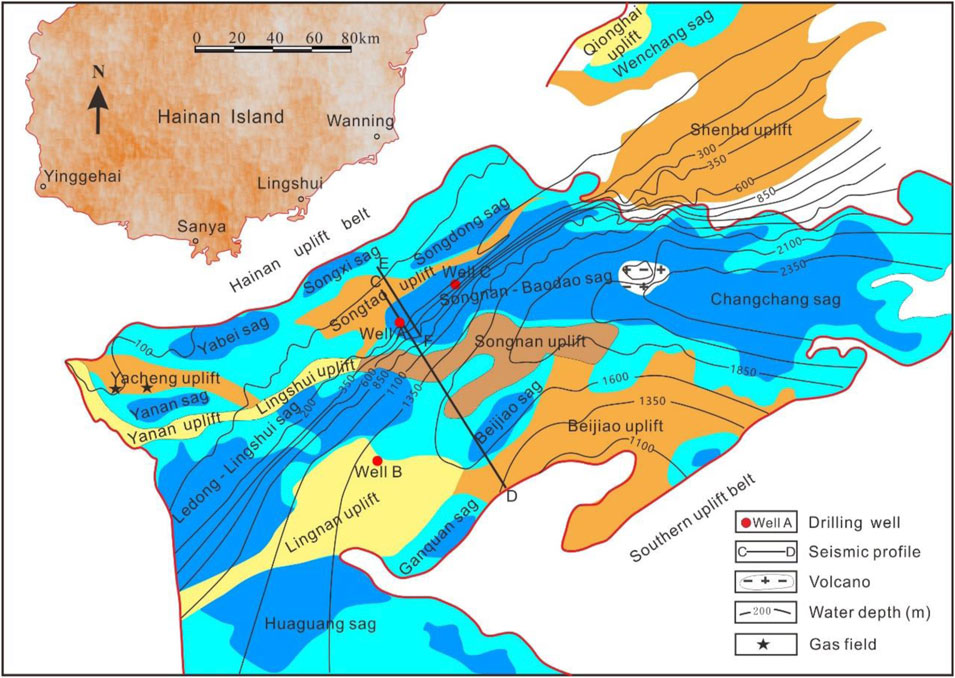
FIGURE 1. Structural features of the Qiongdongnan Basin and the location of gas fields, wells, bathymetry and locations of seismic profiles (modified after Zhu, 2007). The units of bathymetry are in meters.
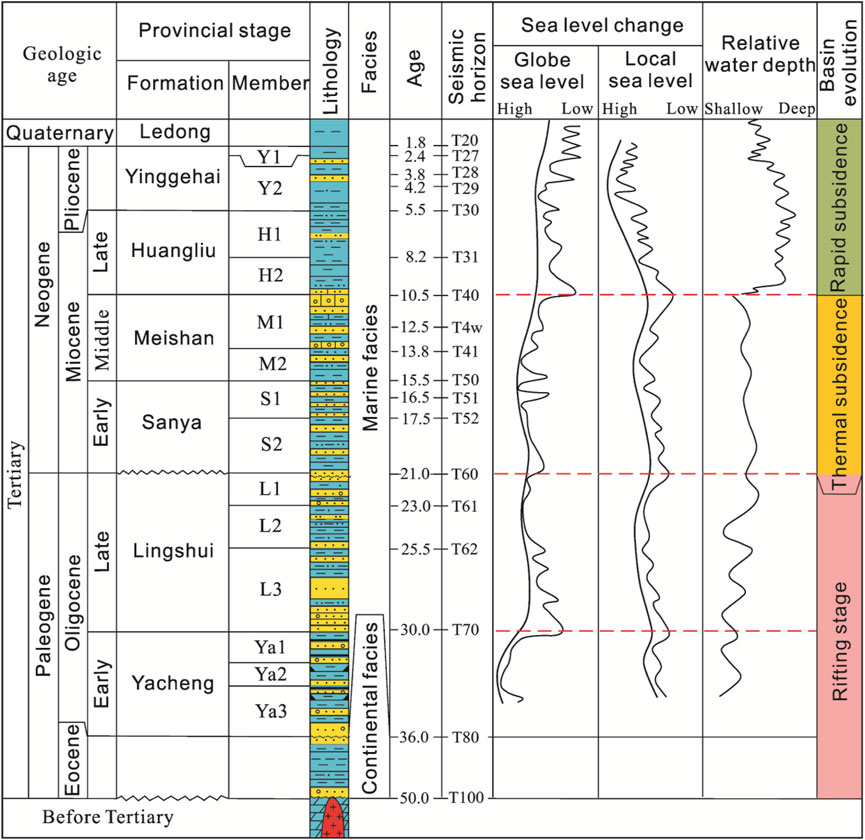
FIGURE 2. Generalized stratigraphic column of the Qiongdongnan Basin showing age, seismic horizon, sea level curves (Zhu, 2007), water depth curves and basin evolution stages.
QDNB is world-famous for its notable high overpressure. There exists a widespread strong overpressure in the middle-deep formation throughout the entire basin (2,900–5,000 m) (Xu et al., 2017). The drilling analysis showed that the maximum pressure coefficient is over 2.27 (Shi et al., 2013; Xu et al., 2017). Overpressure is mainly generated by disequilibrium compaction, associated with anomalously high porosity (Dasgupta et al., 2016). The current pressure coefficient in the western area is greater than that in the eastern area (Shi et al., 2013).
The maximum water depth can reach 2,500 m in the deep water area. Paleontological data indicate that the water depth deepened gradually from 10.5 Ma onward. Several large oil and gas fields have been discovered in the shallow water regions in the northern part of the basin. However, exploration in the QDNB is now gradually extending into deep water areas.
Data and Methods
This study employed three main approaches (Figure 3): 1) pore pressure test data and well-log analysis to confirm the presence of the shallow overpressure, 2) seismic velocities used to predict the shallow overpressure distribution, and 3) calculation of sedimentation rates and basin modeling to illustrate the shallow overpressure caused by the disequilibrium compaction.

FIGURE 3. The flow chart of studying the distribution and formation mechanism of the shallow overpressure in the QDNB.
Well-Log Responses to Overpressure Distribution
Overpressure refers to pore pressure that is greater than the corresponding hydrostatic pressure (Dutta, 2002; Radwana et al., 2020). Pore pressure in sandstone can be directly measured using repeat formation testing (RFT), modular dynamic testing (MDT) or drill stem testing (DST), which are believed to be close to the actual pore pressure. Pore pressure in the mudstones is commonly estimated based on wire-line logging methods and the analysis of drilling parameters because pore-fluid pressure in mudstones usually cannot be measured directly because of their low permeability. However, a few pore pressure test data are not sufficient for an areal overpressure analysis, so they are supplemented with electronic logs with curve responses used to predict and analyze pressure as pore pressures in seals and the associated reservoir rocks are commonly equal (Guo et al., 2010). P-wave sonic, resistivity, density and mud pressure can provide information on rock and fluid properties that are indications of overpressure (Guo et al., 2010; Li et al., 2022). For the normally pressured sediments, mudstone parameters such as P-wave sonic, resistivity, and density fit exponential model (Singha and Chatterjee, 2014). Therefore, logging parameters of normally pressured mudstone were selected from drillings to fit the compaction trend guidelines.
Two representative wells A and B located in the shallow water and the deep water respectively were selected to show the vertical distribution of overpressure. Figure 4 and Figure 5 showed that the P-wave sonic, resistivity picked from mudstone and VSP velocity for Well A and Well B in the shallow water deviate from the compaction trend and increase or decrease respectively below the normal pressure zone. Meanwhile, the calculated mud pressure and testing pressure confirmed the existence of overpressure zone below the normal pressure zone. It can be confirmed that overpressure exists below about 2,300 m in Well A and 2,550 m in Well B (Figure 4 and Figure 5). These show that the overpressure can be identified by the electric and P-wave sonic logs deviating from the normal trend of the compaction and that resistivity logs can be used to estimate the presence of overpressure in mudstones.
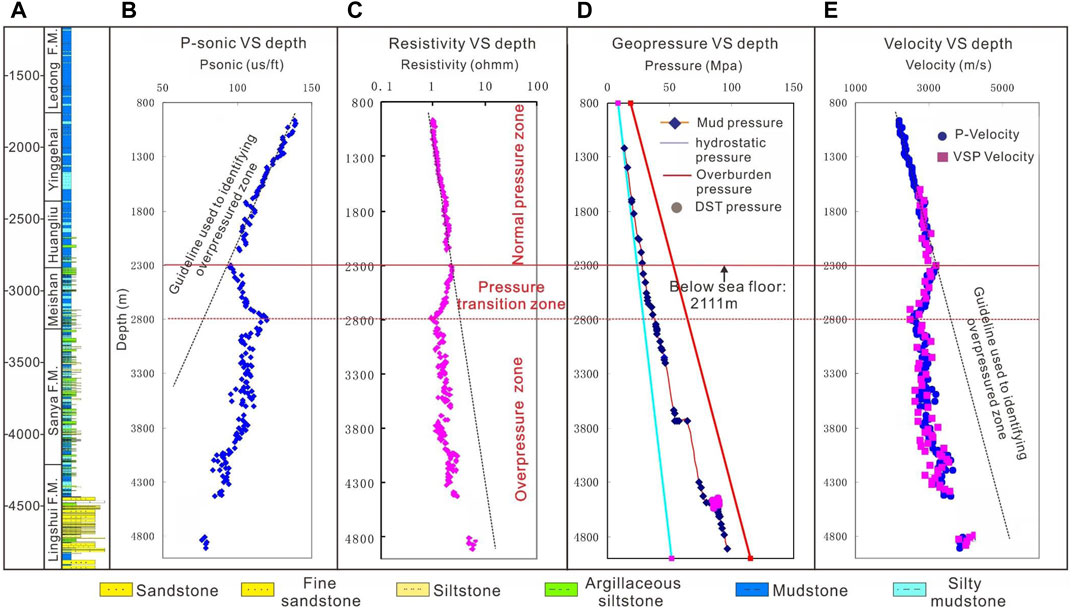
FIGURE 4. (A) Lithologic profile of Well A (B) Pseudo log of sonic P-wave transit times for mudstone. The plot shows the deviation of transit time from the compaction trend below about 2,300 m. (C) Plot of log-derived resistivity values for mudstone showing deviation from the compaction trend below about 2,300 m. (D) Plot of calculated mud pressures and drill stem test pressures showing a corresponding positive deviation from hydrostatic pressure (overpressure) below about 2,700 m. (E) Seismic velocity (VSP velocity) and P-wave sonic velocity plots that show similar deviation from the compaction trend in the overpressure section, which supports the premise that seismic velocity can be used to predict overpressure. A zone of normal pressure is evident above 2,300 m, an apparent transition zone occurs from around 2,300–2,800 m, and the decrease in velocity below 2,800 m corresponds to the zone of overpressure. The water depth in Well A is 189 m. The well location is shown in Figure 1.
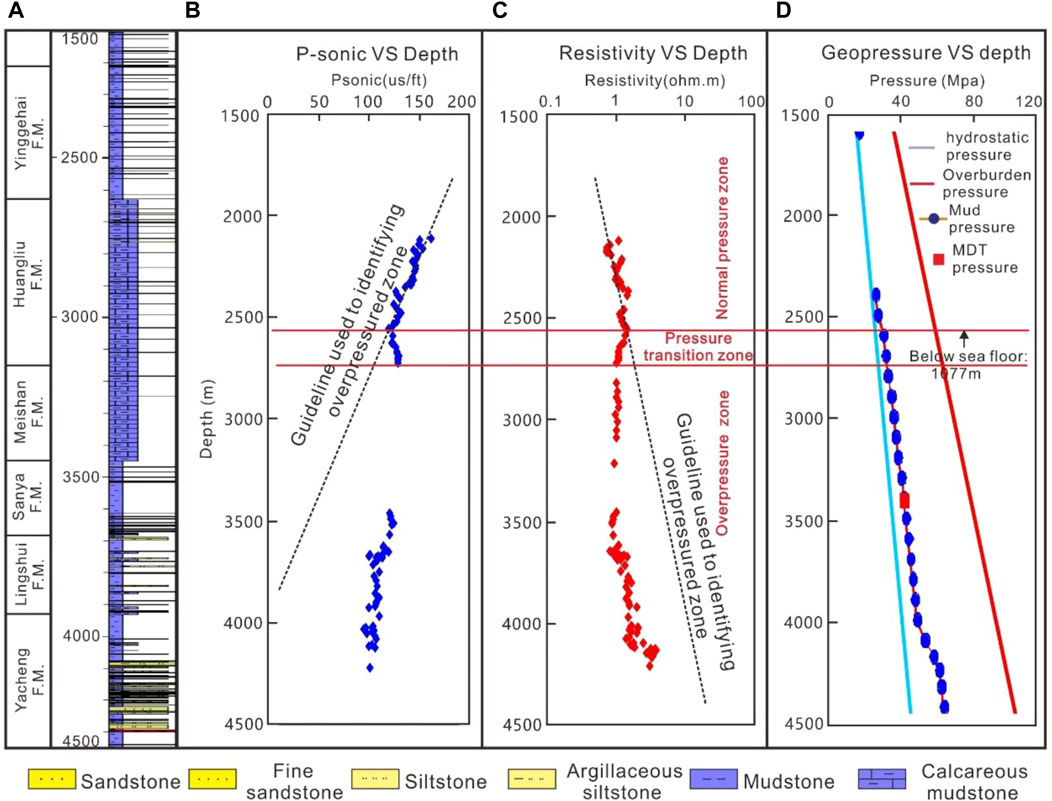
FIGURE 5. (A) Lithologic profile of Well B (B) Pseudo log of sonic P-wave transit times for mudstone. The plot shows the deviation of transit time from the compaction trend below about 2,550 m. The P-wave sonic data at the depth of 2,750–3,450 m were not measured. (C) Plot of log-derived resistivity values for mudstone showing deviation from the compaction trend below about 2,550 m. (D) Plot of calculated mud pressures and MDT pressures showing a corresponding positive deviation from hydrostatic pressure (overpressure) below about 2,550 m. A normal pressure zone, a pressure transition zone and an overpressure zone can be identified. The water depth in Well B is 1,473 m. The well location is shown in Figure 1.
Seismic Data Responses to Overpressure Distribution
The technique of using a decrease in seismic velocity to predict overpressure has been widely used since the pioneering work of Pennebaker (1968). Since then, seismic velocity has remained the main way to predict overpressure, even though other techniques have subsequently been developed such as prestack amplitude inversion and poststack amplitude inversion (Kan and Swan, 2001; Dutta, 2002; Xu et al., 2017). In order to objectively characterize the subsurface seismic velocity distribution, high-quality stacking velocity spectra are selected to illustrate the velocity variation in profile C-D (Figure 6). The seabed is seen to stack best at a velocity of 1,500 m/s. The 2000 and 2,500 m/s isolines of the stacking velocity are developed further by analysis of the stacking velocity spectra. Figure 6 shows that near the seafloor seismic wave velocities increase from 1,500 m/s to 2000 m/s (or to 2,500 m/s) over a thicker sedimentary section as water depth increases. This shows that the seismic interval velocity in the uppermost seafloor will decrease dramatically as the seawater depth increases; this is in accordance with the Dix velocity transformation relationship for stacking velocities, RMS velocities and interval velocities (Dutta, 2002; Yuan et al., 2021). As a result, there appears to be shallow overpressure in the deep water area.
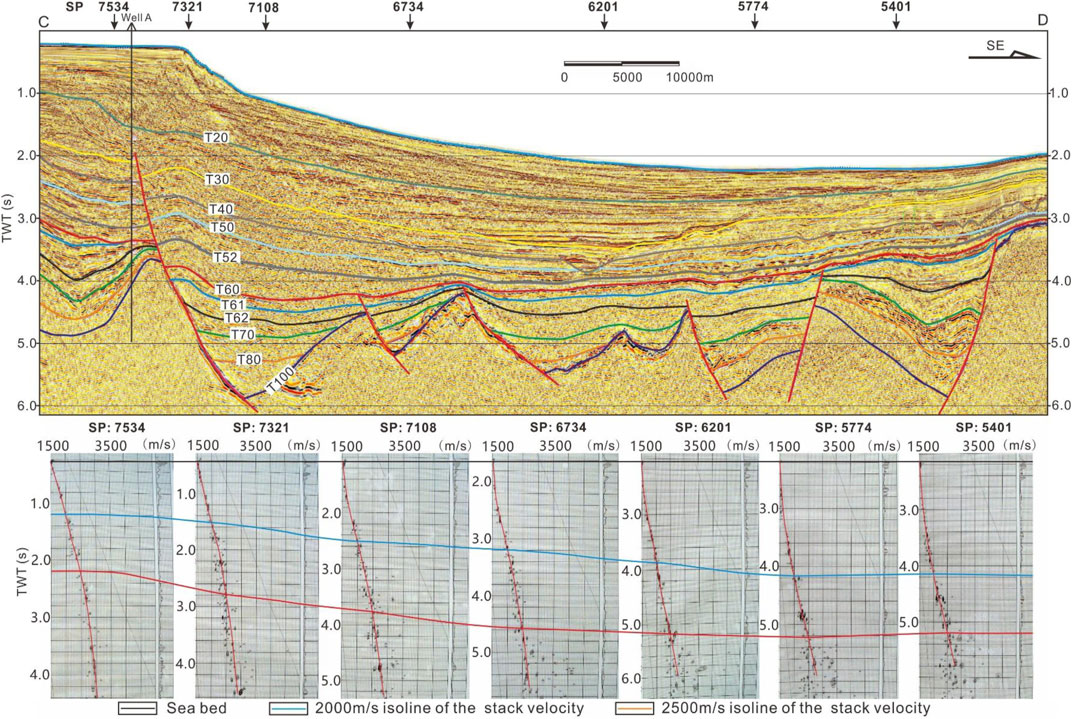
FIGURE 6. Top interpreted seismic cross-section, showing the site of Well A and the selected points for the stacking velocity analysis. (Bottom) Selected stacking velocity spectra, and the 2000 m/s and 2,500 m/s isolines of the stacking velocity. The cross section location is shown in Figure 1.
In order to further illustrate the distribution of overpressure, a pressure profile needs to be created by examining the relationship between interval velocities and pressure coefficients. In the past few decades, many methods have used seismic velocities to predict overpressure (Pennebaker, 1968; Eaton, 1972; Kan and Swan, 2001; Dutta, 2002; Sayers et al., 2002; Carcione et al., 2003; Abiola and Ayenuro, 2021; Prankada et al., 2021). Figures 4, 5 show that there exists a clear response between the overpressured interval and P-sonic curve, and indicate that overpressure can be predicted by the deviation of the seismic velocity, so the method of Eaton (1972) was selected to identify the position of overpressure in profile C-D. To use Eaton’s method, the deviation of the velocity from the normal compaction velocity needs to be estimated. A normal velocity trend starting from the seabed was created based on P-velocity data from the 8 wells with the normal pressure (blue line) and the interval velocities calculated from the stacking velocities (red line) (Figure 7A). Pressure coefficients measured by DST data were selected to fit the relationship between the deviation of the velocity and the pressure coefficients (Figure 7B). The correlation coefficient between these two parameters can reach 0.79 (Figure 7B). According to this relationship, a pressure coefficient profile was then obtained for profile C-D (Figure 8).
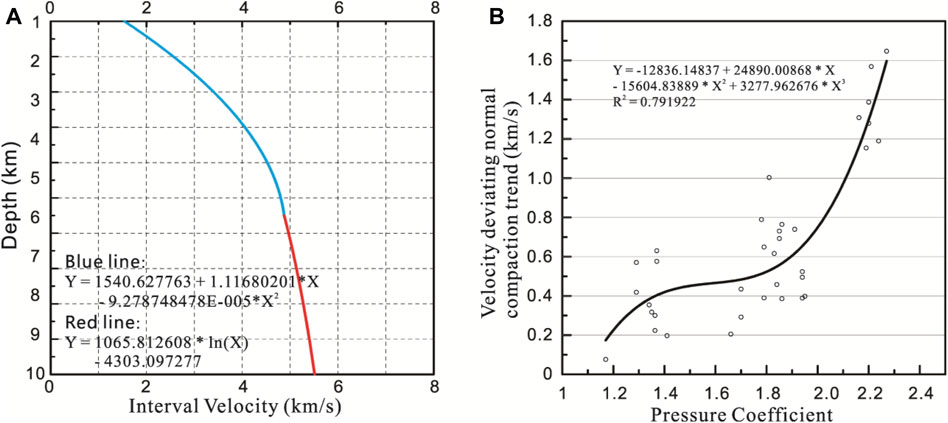
FIGURE 7. (A) Reconstructed normal velocity trend starting from the seabed that is based on the P-velocity data from 8 wells characterized by the normal pressure (blue line) and the interval velocities calculated from the stacking velocities (red line). (B) Relationship between the velocity values deviating from the normal compaction trend and the pressure coefficient of wells in the Qiongdongnan Basin.
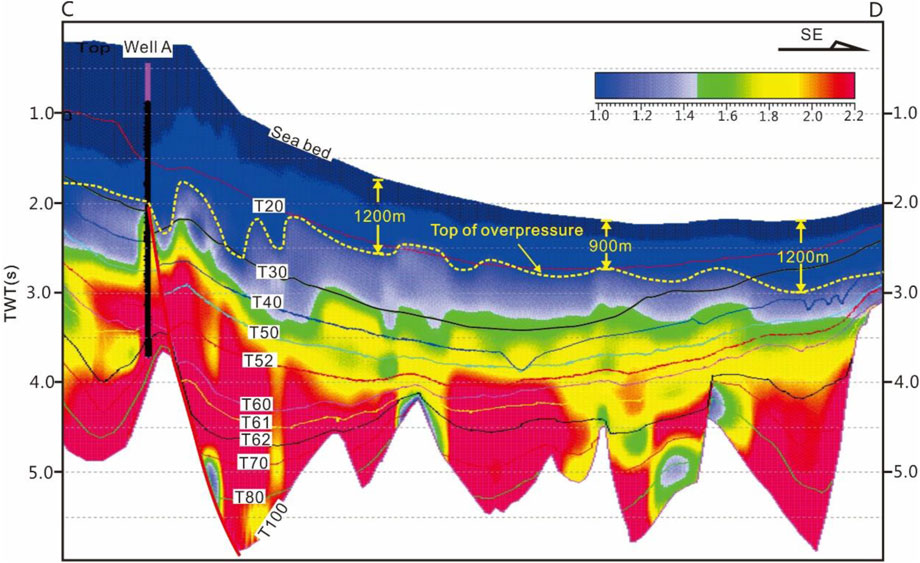
FIGURE 8. Pressure coefficient profile and interpreted top of overpressure of cross section CD, which shows the position of shallow overpressure in the deep water area of the Qiongdongnan Basin. The cross section location is shown in Figure 1.
Modeling of Overpressure
In order to ascertain the age of the shallow overpressure in the deep water parts of the QDNB, 1D modeling was carried out for the position MN at the profile C-D using the PetroMod software (Figure 9). The selected position for 1D modeling is far from the slope, so the effect of horizontal compressive stresses from the gravitational load of the clastic wedge on the generation of the shallow overpressure can be ignored. The input data for the basin modeling include age, lithology, erosion thickness, faults activity, heat flow, paleo water depth, kerogen type, TOC, and HI (Xu et al., 2017; Zhang and Li, 2021). Some of these parameters such as age, lithology, and paleo water depth are listed in Figure 2, Figure 9A and Table 1, respectively. The erosion thickness of T70, T60 and T40 are generally 100∼250 m, 200∼500 m, and 100∼300 m, respectively. Fault activity can be identified by analyzing the faults distribution and comparing the Formation thickness between footwall block and hanging wall block. Active faults can be defined as high permeability channels in the PetroMod software. Heat flow in the QDNB is 58.7–87.1 mW/m2 with a tendency to increase from the continental shelf to the continental slope owing to the lithospheric/crustal thinning in the Cenozoic (Yuan et al., 2009). Shi et al. (2003) collected 592 heat flow measurements in the South China Sea and established a relationship between the heat flow and the age. Shi et al. (2003) report that the heat flow in the area selected for their study could be derived from the empirical function given by Parsons and Sclater (1977) as follows, and we assigned heat flow values at different stages using this function:
Where Q is the heat flow; t is the age of the formation.
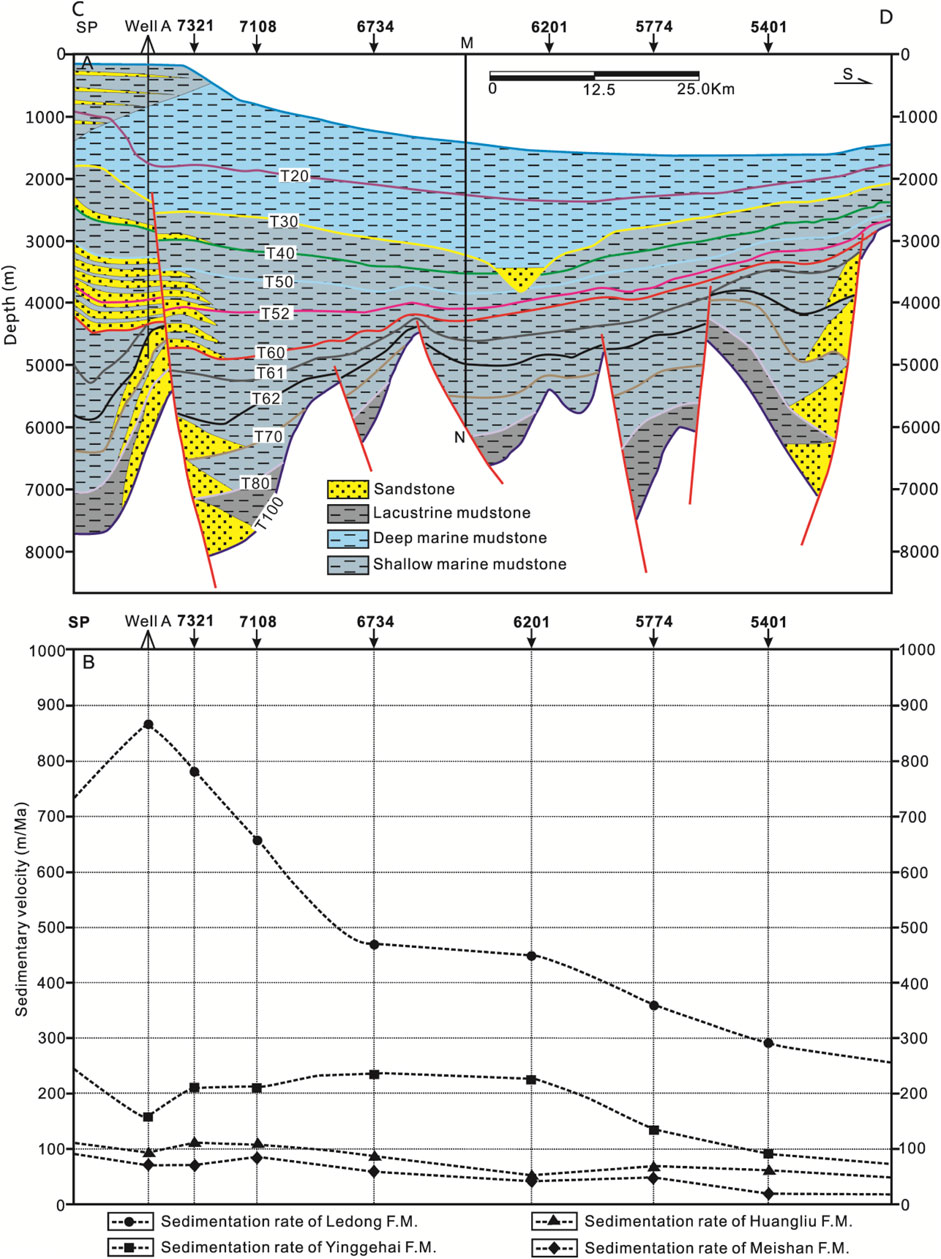
FIGURE 9. (A) Lithologic cross-section of Profile CD. (B) Sedimentation rates of the different formations showing the sedimentation rates of the Ledong and Yinggehai Formations were greater than other Formations. The cross section location is shown in Figure 1.
In order to understand the seawater depth variation over time in the QDNB, continuous samples from some wells in the shallow water area were collected and analyzed for foraminifer distributions (Zhu, 2007). This analysis indicates that the water depth in the QDNB has increased since 10.5 Ma (Figure 2). Because the wells sampled and tested lie in the shallow water area, the results cannot completely support the occurrence of the same processes in the deep water. However, it is known that continental margins are characterized by the slope break, an important feature that is used to separate shallow shelf and deeper slope waters. Figure 10 shows that the slope break began forming about 5.5 Ma, and that the seawater depth was relatively constant in the QDNB before that time. By integrating the results of the slope break migration, seawater depth variations can be estimated based on a regularly varying velocity with depth. Table 1 shows that the seawater depth in the deep water area dramatically deepened since 5.5 Ma. The paleotemperature parameters were calculated through the change of paleo water depths. The organic matter types are type II in Eocene and type III in Oligocene and Miocene (Zuo et al., 2022). The average contents of total organic carbon (TOC) in Eocene, Oligocene and Miocene are 1.5, 1.0 and 0.6%, respectively. The hydrogen index (HI) values in Eocene, Oligocene and Miocene are 300 mg/g, 260 mg/g and 204 mg/g, respectively.
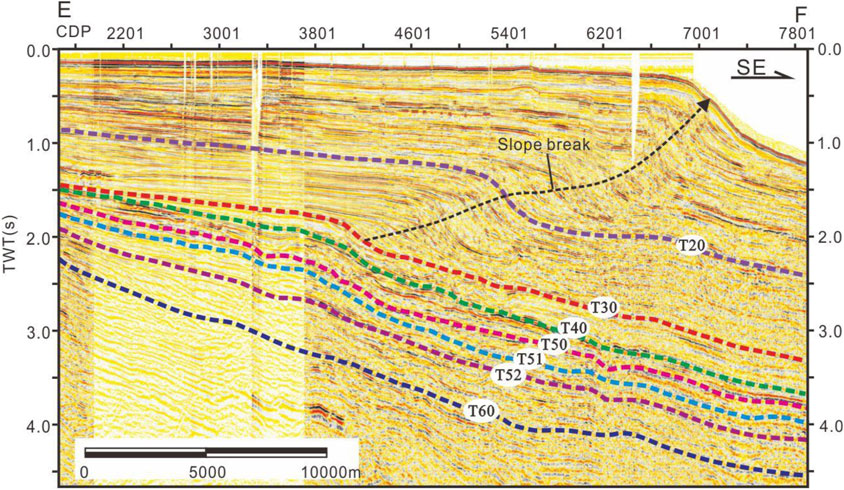
FIGURE 10. Seismic cross-section showing the position of the prominent slope break that formed during deposition of the Yinggehai and Ledong Formations, in response to a dramatic deeping of seawater around 5.5 Ma. The location of the cross section is shown in Figure 1.
Results and Discussion
Shallow Overpressure Presence in the Deep Water Area
The measured data from DST, P-sonic and resistivity logs are the most reliable indicator for overpressure. Figure 4 shows that the P-wave sonic, resistivity picked from mudstone and VSP velocity for Well A in the shallow water deviate from the compaction trend and increase or decrease respectively below about 2,300 m. The calculated mud pressure and testing pressure show that overpressure exists below 2,300 m in Well A. The pressure coefficients measured by the drill stem test (DST) are 1.95, and 1.94 at the depth of 4,446 m and 4,475–4,508 m, respectively. Figure 5 shows that the P-wave sonic and the resistivity for Well B in the deep water deviate from the normal compaction trend and increase or decrease respectively below about 2,550 m. There are no data at the depth of 2,750–3,450 m in Figure 5B because the P-wave sonic data at the depth of 2,750–3,450 m has not been measured, but the resistivity log clearly indicates a drop in resistivity (Rt) indicative of overpressure below about 2,550 m. Calculate pressures from mud weight (Mud pressure) and MDT pressures (test pressures) confirm the overpressured zone below about 2,550 m. The pressure coefficient measured by the modular dynamic tester (MDT) is 1.23 at the depth of 3,400 m. This measured pressure coefficient should be less than the true value because the pore-fluid pressure in the mudstones is very difficult to balance and to be directly measured because of their low permeability. Therefore, the normal pressure zone, pressure transition zone and overpressure zone can be identified according to the logs variation.
The water depth in Well A is 189 m and that in Well B is 1,473 m. If the water depth is subtracted from the total depth of Well A and Well B, the top of the overpressure in Well A is about 2,111 m below the sea floor, and that in Well B is about 1,077 m below sea floor. The present depth of the overpressure in the deep water area is shallower than the reported depth in the middle-deep formations of the basin and deeper than the depth reported by Flemings et al. (2008), Binh et al. (2009) and Long et al. (2011) in the Gulf of Mexico. This shows that there is a relatively shallow overpressure in the deep water area of the QDNB.
The top of overpressure for profile C-D can be identified according to the classification of the overpressure, as long as the pressure coefficient is greater than 1.27 (Hunt, 1990) (Figure 8). Figure 4 shows that the top of the overpressure in Well A is at about 2,300 m. The top of the overpressure interpreted in Figure 8 shows that the value in the Well A area is about 2.0 s, which converts to about 2,300 m using the VSP data from Well A. The comparison shows that there is a good agreement between the predicted top of the overpressure in Figure 8 and the identified top of the overpressure in Figure 4. Secondly, the pressure coefficients from DST of Well A are 1.95, and 1.94 at the depth of 4,446 m and 4,475–4,508 m, respectively, which belong to the Lingshui Fm. The predicted pressure coefficient in the Lingshui Fm. shown in Figure 8 is about 2.04, there exists a little bias between the predicted pressure coefficient and the actual test pressure coefficient. This comparison indicates that the pressure coefficient profile shown in Figure 8 can be used to analyze the overpressure distribution. Figure 8 shows that the distance from the seafloor to the top of overpressure is greater in the shallow water than that in the deep water. Figure 9A shows that there are differences in sedimentary facies between the shallow water and deep water. The higher permeability of sediments in shallow water is conducive to pressure relief, and the activation of faults at the edge of the basin can also lead to the reduction of pressure, which may be the reason why the distance from the seafloor to the top of overpressure is greater in the shallow water than that in the deep water. This indicates that shallow overpressure exists in the deep water, where the top of overpressure is about 900–1,200 m into the seafloor. There is a very good agreement between drilling data and seismic data response to the shallow overpressure.
Mechanisms of Shallow Overpressure Generation
As mentioned above, disequilibrium compaction and oil and gas generation are believed to be the primary causes of overpressure in sedimentary basins (Osborne and Swarbrick, 1997; Hua et al., 2021; Li et al., 2021). In an extensional tectonic setting such as the QDNB, tectonic compression is not a probable mechanism for overpressure development (Zhang et al., 2021). Although there exists a possible effect of the horizontal compressive stresses from the components of the clastic wedge weight at the slop on the generation of the shallow overpressure in the zones of the slope or near the base of the slope, this effect only limits the zones of the slope or near the base of the slope. Figure 1 shows that Well B locates in about 1380 m of water depth right at the plain of the basin indicated by the big space of contours rather than at the slop or base of the slope, where is in the Lingnan uplift formed before 21.0 Ma and covered by the Sanya, Meishan, Huangliu, Yinggehai and Ledong Fms., so disequilibrium compaction is primarily controlled by the overburden pressure rather than the horizontal stress. Secondly, if the horizontal stress act on the formation drilled by well B, it is much less than the overburden pressure. The horizontal stress is one of the components of the weight contributed by the interval of 180–1380 m of the clastic wedge above Well B, if the slop angle is about 10°, then the maximum horizontal stress calculated based on the trigonometric function equals about the weight of 208 m Formation. The overpressure top of Well B is about 1,077 m below sea floor, so the vertical stress is equivalent to the weight of 1077 m Formation. The comparison between the horizontal stress and the overburden pressure shows that maximum stress is still overburdened pressure, therefore, the disequilibrium compaction is controlled by the overburden pressure rather than the horizontal stress. These indicate that the effect of the horizontal compressive stresses from the gravitational load of the clastic wedge on the shallow overpressure can be ignored in the QDNB. The vertical transfer of the basal overpressures is unlikely because of the lack of faulting in the shallow strata. Oil and gas generation is not a likely process for generating shallow overpressure as these rocks are thermally immature. The most probable mechanism is disequilibrium compaction.
The formation age of the shallow overpressure in the deep water parts of the QDNB can be ascertained by basin modeling. The modeling result shows that the excess pressure isoline of 5 MPa lies at the top of the Yinggehai Fm. as shown in Figure 11. The modeled pressure coefficient is about 1.2 when the excess pressure is 5 MPa at the depth of 2,268 m. The results of modeling agree with the other indicators of a shallow overpressure in the deep water indicated by Well B and overpressure prediction shown in Figure 5 and Figure 8. The basin modeling (presented in Figure 11) suggests that the overpressure formed at about 5.5 Ma, during the deposition of the sediment of the Yinggehai and Ledong Fms.
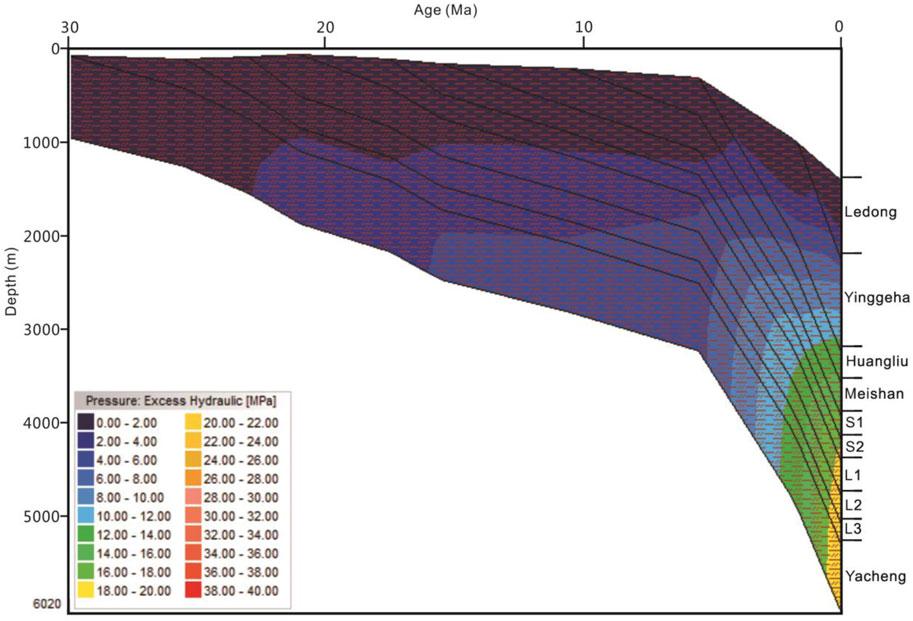
FIGURE 11. Modelling of the evolution of excess pressure at position MN in Figure 8, Based on this model overpressure was generated beginning approximately 5.5 Ma.
Rapid deposition of low permeability sediment generates pore fluid overpressure because fluids cannot escape as the sediment compacts (Gordon and Flemings, 1998; Flemings et al., 2008; Wang et al., 2016). In order to ascertain if such a disequilibrium compaction process caused the shallow overpressure in the deep water parts of the QDNB, sedimentation rates were calculated at the same seven observation points where stacking velocities were determined in profile C-D (Figure 9B and Table 2). Figure 9B shows that the sedimentation rates of the Ledong and Yinggehai Fms. were greater than those of the Huangliu and Meishan Fms. and that the sedimentation rate of the Ledong Fm. was far greater than that of the Yinggehai Fm. The sedimentation rate of the Ledong Fm. gradually decreased from a value of 871.7 m/Ma in the shallow area to 288.9 m/Ma in the deep area, whereas the maximum sedimentation rate, 237.6 m/Ma, of the Yinggehai Fm. occurred in the deep water area (Figure 9B). The lithologic profile in Figure 9A shows that mudstone is the main sedimentary rock in the deep water area, and that few faults are evident above the T60 horizon in the QDNB as shown in Figure 6. The shallow overpressure in the QDNB was generated in 5.5 Ma, during this period, there deposited the Yinggehai and Ledong Fms. characterized by high sedimentation rates. These indicate that disequilibrium compaction is the primary cause of the shallow overpressure in the QDNB.
Secondly, overpressures generated by disequilibrium compaction are associated with anomalously high porosity (Sayers et al., 2002) and low density compared with normally pressured sediments (Guo et al., 2010). Figure 12 shows that the decreasing density in the overpressured section of well C indicates that disequilibrium compaction is a primary cause of overpressure in the shallow water parts of the QDNB. Although Well B lies in the deep water area, we believe that the evidence supports our contention that disequilibrium compaction is a primary cause of overpressure in the deep water parts of the QDNB.
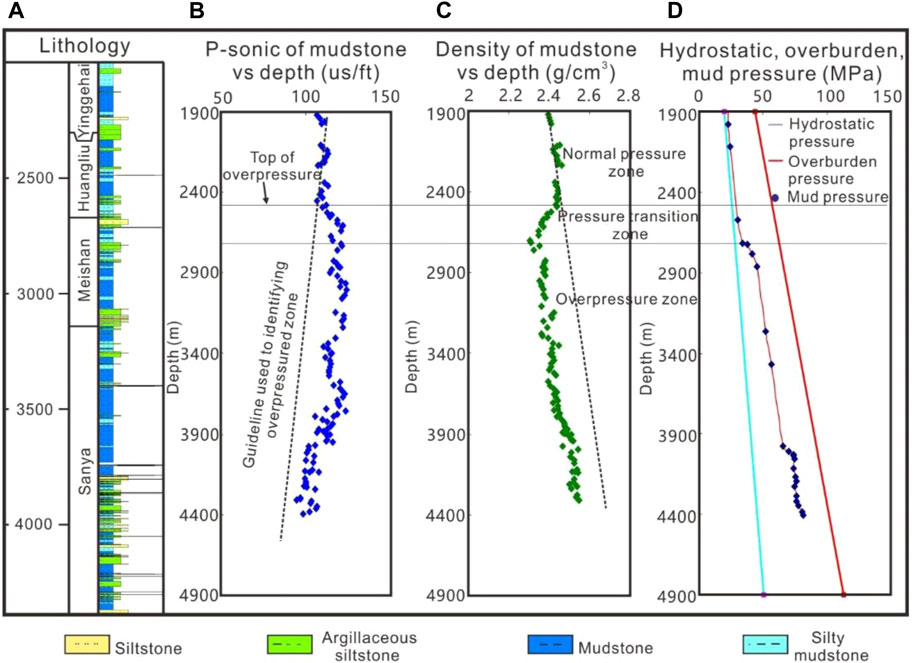
FIGURE 12. (A) Lithologic profile of Well C (B) Pseudo log of sonic P-wave transit times for mudstone. The plot shows the deviation of transit time from the compaction trend below about 2,450 m. (C) Plot of log-derived density values for mudstone showing deviation from the compaction trend below about 2,450 m. (D) Plot of calculated mud pressures showing a corresponding positive deviation from hydrostatic pressure (overpressure) below about 2,450 m. The decreasing density in the overpressured section of well C indicates that disequilibrium compaction is a primary cause of overpressure in the Qiongdongnan Basin.
Conclusion
Through the above analysis, some important conclusions can be drawn.
1) The P-wave sonic and resistivity logs are reliable pressure indicators in the QDNB with all overpressured mudstones having higher P-wave sonic and lower resistivity compared with normally pressured mudstones at a given depth. Thus, the overpressure caused by disequilibrium compaction can be identified by the P-wave sonic and resistivity logs.
2) Pore pressures profiles can be predicted with confidence in the QDNB using the method of “normal compaction trend” based on a calibrated relationship between seismic interval velocities and pressure data from wells.
3) A shallow zone of overpressure is present in the deep water area of the QDNB based on drilling and anomalous seismic interval velocities. The distance between the top of the overpressure and the seabed is 900–1,200 m in the deep water area of the QDNB.
4) Disequilibrium compaction in the deep water is the primary cause of the shallow overpressure in the QDNB, which occurred since about 5.5 Ma.
Data Availability Statement
The original contributions presented in the study are included in the article/Supplementary Material, further inquiries can be directed to the corresponding authors.
Author Contributions
JR: Methodology, Investigation, Formal analysis, Writing—Original Draft. LX: Supervision, Funding acquisition, Writing—review and editing. WS: Supervision, Funding acquisition, Conceptualization. WY: Writing—review and editing. RW: Investigation, Formal analysis. YH: Supervision and software. HD: Software.
Funding
This work was carried out with support from Key Special for Introduced Talents Team of Southern Marine Science and Engineering Guangdong Laboratory (Guangzhou) [No. GML2019ZD0102].
Conflict of Interest
The authors declare that the research was conducted in the absence of any commercial or financial relationships that could be construed as a potential conflict of interest.
Publisher’s Note
All claims expressed in this article are solely those of the authors and do not necessarily represent those of their affiliated organizations, or those of the publisher, the editors and the reviewers. Any product that may be evaluated in this article, or claim that may be made by its manufacturer, is not guaranteed or endorsed by the publisher.
Acknowledgments
The authors would like to express their sincere appreciations to Keyu Liu of CSIRO Australia, James Puckette and Mark Tingay of University of Adelaide for their valuable comments and suggestions. Thanks to the editor and reviewers for the suggestions and other assistance for improving this manuscript.
References
Abiola, O., and Ayenuro, T. G. (2021). Prediction of Abnormal Pressure from AVO Velocities over “Safety” Field, Onshore Niger Delta, Nigeria. Petroleum Res. 6 (1), 26–41. doi:10.1016/j.ptlrs.2020.09.002
Akrout, D., Ahmadi, R., Mercier, E., and Montacer, M. (2021). Present-day Overpressure in Southern Tunisia: Characterization, Possible Causes and Implications for Drilling Operations. J. Afr. Earth Sci. 184, 104356. doi:10.1016/j.jafrearsci.2021.104356
Barker, C. (1972). Aquathermal Pressuring: Role of Temperature in Development of Abnormal-Pressure Zones. AAPG Bull. 56, 2068–2071. doi:10.1306/819a41b0-16c5-11d7-8645000102c1865d
Berry, F. (1973). High Fluid Potentials in California Coast Ranges and Their Tectonic Significance. AAPG Bull. 57, 1219–1249. doi:10.1306/83d90e8a-16c7-11d7-8645000102c1865d
Binh, N. T. T., Tokunaga, T., Nakamura, T., Kozumi, K., Nakajima, M., Kubota, M., et al. (2009). Physical Properties of the Shallow Sediments in Late Pleistocene Formations, Ursa Basin, Gulf of Mexico, and Their Implications for Generation and Preservation of Shallow Overpressures. Mar. Petroleum Geol. 26, 474–486. doi:10.1016/j.marpetgeo.2009.01.018
Bradley, J. (1975). Abnormal Formation Pressure. AAPG Bull. 59, 957–973. doi:10.1306/83d91efc-16c7-11d7-8645000102c1865d
Bredehoeft, J. D., Wesley, J. B., and Fouch, T. D. (1994). Simulations of the Origin of Fluid-Pressure, Fracture Generation and Movement of Fluids in the Uinta Basin, Utah. AAPG Bull. 78, 1729–1747. doi:10.1306/a25ff279-171b-11d7-8645000102c1865d
Carcione, J. M., Helle, H. B., Pham, N. H., and Toverud, T. (2003). Pore Pressure Estimation in Reservoir Rocks from Seismic Reflection Data. Geophysics 68, 1569–1579. doi:10.1190/1.1620631
Cobbold, P. R., Mourgues, R., and Boyd, K. (2004). Mechanism of Thin-Skinned Detachment in the Amazon Fan: Assessing the Importance of Fluid Overpressure and Hydrocarbon Generation. Mar. Petroleum Geol. 21, 1013–1025. doi:10.1016/j.marpetgeo.2004.05.003
Dasgupta, S., Chatterjee, R., and Mohanty, S. P. (2016). Magnitude, Mechanisms, and Prediction of Abnormal Pore Pressure Using Well Data in the Krishna-Godavari Basin, East Coast of India. Bulletin 100, 1833–1855. doi:10.1306/05131615170
Dickinson, G. (1953). Geological Aspects of Abnormal Reservoir Pressures in Gulf Coast Louisiana. AAPG Bull. 37, 410–432. doi:10.1306/5ceadc6b-16bb-11d7-8645000102c1865d
Dugan, B., and Flemings, P. B. (2002). Fluid Flow and Stability of the US Continental Slope Offshore New Jersey from the Pleistocene to the Present. Geofluids 2, 137–146. doi:10.1046/j.1468-8123.2002.00032.x
Dutta, N. C. (2002). Geopressure Prediction Using Seismic Data: Current Status and the Road Ahead. Geophysics 67 (6), 2012–2041. doi:10.1190/1.1527101
Flemings, P., Long, H., Dugan, B., Germaine, J., John, C., Behrmann, J., et al. (2008). IODP Expedition 308 ScientistsPore Pressure Penetrometers Document High Overpressure Near the Seafloor where Multiple Submarine Landslides Have Occurred on the Continental Slope, Offshore Louisiana, Gulf of Mexico. Earth Planet. Sci. Lett. 269, 309–325. doi:10.1016/j.epsl.2007.12.005
Gordon, D. S., and Flemings, P. B. (1998). Generation of Overpressure and Compaction-Driven Fluid Flow in a Plio-Pleistocene Growth-Faulted Basin, Eugene Island 330, Offshore Louisiana. Basin Res. 10, 177–196. doi:10.1046/j.1365-2117.1998.00052.x
Guo, X. W., He, S., Liu, K. Y., Song, G. Q., Wang, X. J., and Shi, Z. S. (2010). Oil Generation as the Dominant Overpressure Mechanism in the Cenozoic Dongying Depression, Bohai Bay Basin, China. AAPG Bull. 94, 1859–1881. doi:10.1306/05191009179
Hao, F., Li, S., Dong, W., Hu, Z., and Huang, B. (1998). Abnormal Organic-Matter Maturation in the Yinggehai Basin, South China Sea: Implications for Hydrocarbon Expulsion and Fluid Migration from Overpressured Systems. J. Pet. Geol. 21 (4), 427–444. doi:10.1111/j.1747-5457.1998.tb00794.x
Hao, F., Li, S. T., Gong, Z. S., and Yang, J. M. (2002). Mechanism of Diapirism and Episodic Fluid Injections in the Yinggehai Basin. Sci. China Ser. D – Earth Sci. 45 (2), 151–159. doi:10.1360/02yd9017
Hao, F., Sun, Y. C., Li, S. T., and Zhang, Q. M. (1995). Overpressure Retardation of Organic-Matter Maturation and Petroleum Generation–A Case Study from the Yinggehai and Qiongdongnan Basins, South China Sea. AAPG Bull. 79 (4), 551–562. doi:10.1306/8d2b158e-171e-11d7-8645000102c1865d
Hedberg, H. H. (1974). Relation of Methane Generation to Undercompacted Shales, Shale Diapirs, and Mud Volcanoes. AAPG Bull. 58, 661–673. doi:10.1306/83d91466-16c7-11d7-8645000102c1865d
Hua, Y., Guo, X., Tao, Z., He, S., Dong, T., Han, Y., et al. (2021). Mechanisms for Overpressure Generation in the Bonan Sag of Zhanhua Depression, Bohai Bay Basin, China. Mar. Petroleum Geol. 128, 105032. doi:10.1016/j.marpetgeo.2021.105032
Hunt, J. M. (1990). Generation and Migration of Petroleum from Abnormally Pressured Fluid Compartments. AAPG Bull. 74, 1–12. doi:10.1306/0c9b21eb-1710-11d7-8645000102c1865d
Kan, T. K., and Swan, H. W. (2001). Geopressure Prediction from Automatically‐derived Seismic Velocities. Geophysics 66, 1937–1946. doi:10.1190/1.1487135
Law, B., and Dickinson, W. (1985). Conceptual Model for Origin of Abnormally Pressured Gas Accumulations in Low-Permeability Reservoirs. AAPG Bull. 69, 1295–1304. doi:10.1306/ad462bd7-16f7-11d7-8645000102c1865d
Li, C., Luo, X., Zhang, L., Fan, C., Xu, C., Liu, A., et al. (2022). New Understanding of Overpressure Responses and Pore Pressure Prediction: Insights from the Effect of Clay Mineral Transformations on Mudstone Compaction. Eng. Geol. 297, 106493. doi:10.1016/j.enggeo.2021.106493
Li, C., Zhang, L., Luo, X., LeiYu, Y. L., Yu, L., Cheng, M., et al. (2021). Overpressure Generation by Disequilibrium Compaction or Hydrocarbon Generation in the Paleocene Shahejie Formation in the Chezhen Depression: Insights from Logging Responses and Basin Modeling. Mar. Petroleum Geol. 133, 105258. doi:10.1016/j.marpetgeo.2021.105258
Li, S., Yuan, Y., Sun, W., Sun, D., and Jin, Z. (2016). Formation and Destruction Mechanism as Well as Major Controlling Factors of the Silurian Shale Gas Overpressure in the Sichuan Basin, China. J. Nat. Gas Geoscience 1 (4), 287–294. doi:10.1016/j.jnggs.2016.09.002
Liu, H., Yuan, F., Jiang, Y., Zhao, M., Chen, K., Guo, Z., et al. (2019). Mechanisms for Overpressure Generated by the Undercompaction of Paleogene Strata in the Baxian Depression of Bohai Bay Basin, China. Mar. Petroleum Geol. 99, 337–346. doi:10.1016/j.marpetgeo.2018.10.001
Liu, J., Liu, T., Liu, H., He, L., and Zheng, L. (2021). Overpressure Caused by Hydrocarbon Generation in the Organic-Rich Shales of the Ordos Basin. Mar. Petroleum Geol. 134, 105349. doi:10.1016/j.marpetgeo.2021.105349
Long, H., Flemings, P. B., Germaine, J. T., and Saffer, D. M. (2011). Consolidation and Overpressure Near the Seafloor in the Ursa Basin, Deepwater Gulf of Mexico. Earth Planet. Sci. Lett. 305, 11–20. doi:10.1016/j.epsl.2011.02.007
Luo, X. R., Liu, L. J., and Li, X. Y. (2006). Overpressure Distribution and Pressuring Mechanism on the Southern Margin of the Junggar Basin. Northwest. China. Chin. Sci. Bull. 51 (19), 2383–2390. doi:10.1007/s11434-006-2126-9
Luo, X. R. (2004). Quantitative Analysis on Overpressuring Mechanism Resulted from Tectonic Stress. Chin. J. Geophys. – Chin. Ed. 47 (6), 1086–1093. doi:10.1002/cjg2.608
Luo, X. R., and Vasseur, G. (1996). Geopressuring Mechanism of Organic Matter Cracking: Numerical Modeling. AAPG Bull. 80 (6), 856–874. doi:10.1306/64ED88EA-1724-11D7-8645000102C1865D
Luo, X., and Vasseur, G. (1992). Contributions of Compaction and Aquathermal Pressuring to Geopressure and the Influence of Environmental Conditions. AAPG Bull. 76, 1550–1559. doi:10.1306/bdff8a42-1718-11d7-8645000102c1865d
Ma, Y. S., Guo, T. L., Zhao, X. F., and Cai, X. Y. (2008). The Formation Mechanism of High-Quality Dolomite Reservoir in the Deep of Puguang Gas Field. Sci. China Ser. D Earth Sci. 51, 53–64. doi:10.1007/s11430-008-5008-y
Magara, K. (1975). Reevaluation of Montmorillonite Dehydration as Cause of Abnormal Pressure and Hydrocarbon Migration. AAPG Bull. 59, 292–302. doi:10.1306/83d91c7c-16c7-11d7-8645000102c1865d
Mondol, N. H., Bjørlykke, K., Jahren, J., and Høeg, K. (2007). Experimental Mechanical Compaction of Clay Mineral Aggregates-Changes in Physical Properties of Mudstones during Burial. Mar. Petroleum Geol. 24, 289–311. doi:10.1016/j.marpetgeo.2007.03.006
Osborne, M. J., and Swarbrick, R. E. (1997). Mechanisms for Generating Overpressure in Sedimentary Basins: a Re-evaluation. AAPG Bull. 81, 1023–1041. doi:10.1306/522b49c9-1727-11d7-8645000102c1865d
Parsons, B., and Sclater, J. G. (1977). An Analysis of the Variation of Ocean Floor Bathymetry and Heat Flow with Age. J. Geophys. Res. 82, 803–827. doi:10.1029/jb082i005p00803
Pennebaker, E. S. (1968). Seismic Data Indicate Depth, Magnitude of Abnormal Pressure. World oil. 166, 73–78.
Plumley, W. J. (1980). Abnormally High Fluid Pressure: Survey of Some Basic Principles. AAPG Bull. 64, 414–430. doi:10.1306/2f919409-16ce-11d7-8645000102c1865d
Powers, M. C. (1967). Fluid-release Mechanisms in Compacting Marine Mudrocks and Their Importance in Oil Exploration. AAPG Bull. 51, 1240–1254. doi:10.1306/5d25c137-16c1-11d7-8645000102c1865d
Prankada, M., Yadav, K., and Sircar, A. (2021). Analysis of Wellbore Stability by Pore Pressure Prediction Using Seismic Velocity. Energy Geosci. 2 (4), 219–228. doi:10.1016/j.engeos.2021.06.005
Radwan, A. E., Abudeif, A. M., Attia, M. M., ElkhawagaAbdelghanya, M. A. W. K., Abdelghany, W. K., and Kasem, A. A. (2020). Geopressure Evaluation Using Integrated Basin Modelling, Well-Logging and Reservoir Data Analysis in the Northern Part of the Badri Oil Field, Gulf of Suez, Egypt. J. Afr. Earth Sci. 162, 103743. doi:10.1016/j.jafrearsci.2019.103743
Sayers, C. M., Johnson, G. M., and Denyer, G. (2002). Predrill Pore‐pressure Prediction Using Seismic Data. Geophysics 67, 1286–1292. doi:10.1190/1.1500391
Schmidt, G. W. (1973). Interstitial Water Composition and Geochemistry of Deep Gulf Coast Shales and Sandstones. AAPG Bull. 57, 321–337. doi:10.1306/819a426e-16c5-11d7-8645000102c1865d
Sharp, J. M. (1983). Permeability Controls on Aquathermal Pressuring. AAPG Bull. 67, 2057–2061. doi:10.1306/ad4608cd-16f7-11d7-8645000102c1865d
Shi, W., Xie, Y., Wang, Z., Li, X., and Tong, C. (2013). Characteristics of Overpressure Distribution and its Implication for Hydrocarbon Exploration in the Qiongdongnan Basin. J. Asian Earth Sci. 66 (apr.8), 150–165. doi:10.1016/j.jseaes.2012.12.037
Shi, X. B., Qiu, X. L., and Xia, K. Y. (2003). Heat Flow Characteristics and its Tectonic Significance of South China Sea. J. Trop. Oceanogr. 22 (2), 63–73. (in Chinese with English abstract). doi:10.1016/s1367-9120(03)00059-2
Singha, D. K., and Chatterjee, R. (2014). Detection of Overpressure Zones and a Statistical Model for Pore Pressure Estimation from Well Logs in the Krishna-Godavari Basin, India. Geochem. Geophys. Geosyst. 15, 1009–1020. doi:10.1002/2013gc005162
Skempton, A. W. (1970). Consolidation of Clays by Gravitational Compaction. Q. J. Geol. Soc. 125, 373–411. doi:10.1144/gsjgs.125.1.0373
Spencer, C. (1987). Hydrocarbon Generation as a Mechanism for Overpressure in Rocky Mountain Region. AAPG Bull. 71, 368–388. doi:10.1306/94886eb6-1704-11d7-8645000102c1865d
Tang, J., and Lerche, I. (1993). Geopressure Evolution, Hydrocarbon Generation and Migration in the Beaufort-Mackenzie Basin, Canada: Results from Two-Dimensional Quantitative Modelling. Mar. Petroleum Geol. 10, 373–393. doi:10.1016/0264-8172(93)90082-4
Timko, D. J., and Fertl, W. H. (1971). Relationship between Hydrocarbon Accumulation and Geopressure and its Economic Significance. J. Petroleum Technol. 23, 923–933. doi:10.2118/2990-pa
Tingay, M. R. P., Hillis, R. R., Swarbrick, R. E., Morley, C. K., and Damit, A. R. (2009). Origin of Overpressure and Pore-Pressure Prediction in the Baram Province, Brunei. Bulletin 93, 51–74. doi:10.1306/08080808016
Tingay, M. R. P., Hillis, R. R., Swarbrick, R. E., Morley, C. K., and Damit, A. R. (2007). Vertically Transferred' Overpressures in Brunei: Evidence for a New Mechanism for the Formation of High-Magnitude Overpressure. Geology 35, 1023–1026. doi:10.1130/G23906A.1
Tingay, M. R. P., Morley, C. K., Laird, A., Limpornpipat, O., Krisadasima, K., Pabchanda, S., et al. (2013). Evidence for Overpressure Generation by Kerogen-To-Gas Maturation in the Northern Malay Basin. Bulletin 97, 639–672. doi:10.1306/09041212032
Wang, X., He, S., Wei, A., Liu, Q., and Liu, C. (2016). Typical Disequilibrium Compaction Caused Overpressure of Paleocene Dongying Formation in Northwest Liaodongwan Depression, Bohai Bay Basin, China. J. Petroleum Sci. Eng. 147, 726–734. doi:10.1016/j.petrol.2016.09.014
Wang, X. J., Wu, S. G., Dong, D. D., Gong, Y. H., and Chai, C. (2008). Characteristics of Gas Chimney and its Relationship to Gas Hydrate in the Qiongdongnan Basin. Mar. Geol. Quat. Geol. 28 (3), 103–108. (in Chinese with English abstract). doi:10.16562/j.cnki.0256-1492.2008.03.021
Wang, R., Shi, W. Z., Xie, X. Y., Zhang, W., Qin, S., Liu, K., et al. (2020). Clay Mineral Content, Type, and Their Effects on Pore Throat Structure and Reservoir Properties: Insight From the Permian Tight Sandstones in the Hangjinqi Area, North Ordos Basin, China. Mar. Petroleum Geol. 115, 104281. doi:10.1016/j.marpetgeo.2020.104281
Wang, R., Liu, K., Shi, W. Z., Qin, S., Zhang, W., Qi, R., et al. (2022). Reservoir Densification, Pressure Evolution, and Natural Gas Accumulation in the Upper Paleozoic Tight Sandstones in the North Ordos Basin, China. Energies 15, 1990. doi:10.3390/en15061990
Wu, S. G., Sun, Q. L., Wu, T. Y., Yuan, S. Q., Ma, Y. B., and Yao, G. S. (2009). Polygonal Fault and Oil-Gas Accumulation in Deep-Water Area of Qiongdongnan Basin. Acta Pet. Sin. A 30 (1), 22–26. (in Chinese with English abstract). doi:10.7623/syxb200901005
Xu, Q., Shi, W., Xie, Y., Wang, Z., Li, X., and Tong, C. (2017). Identification of Low-Overpressure Interval and its Implication to Hydrocarbon Migration: Case Study in the Yanan Sag of the Qiongdongnan Basin, South China Sea. Plos One 12 (9), e0183676. doi:10.1371/journal.pone.0183676
Yuan, Y., Zhu, W., Mi, L., Zhang, G., Hu, S., and He, L. (2009). "Uniform Geothermal Gradient" and Heat Flow in the Qiongdongnan and Pearl River Mouth Basins of the South China Sea. Mar. Petroleum Geol. 26, 1152–1162. doi:10.1016/j.marpetgeo.2008.08.008
Yuan, H. M., Wang, Y., and Wang, X. C. (2021). Seismic Methods for Exploration and Exploitation of Gas Hydrate. J. Earth Sci. 32 (4), 839–849. doi:10.1007/s12583-021-1502-3
Zhang, F., Lu, X., Botterill, S., Gingras, M., Zhuo, Q., and Zhong, H. (2021). Horizontal Tectonic Stress as a Cause of Overpressure in the Southern Margin of the Junggar Basin, Northwest China. J. Petroleum Sci. Eng. 205, 108861. doi:10.1016/j.petrol.2021.108861
Zhang, J. H., Lin, H. L., and Wang, K. Z. (2015). Centrifuge Modeling and Analysis of Submarine Landslides Triggered by Elevated Pore Pressure. Ocean. Eng. 109, 419–429. doi:10.1016/j.oceaneng.2015.09.020
Zhang, Y. Q., and Liu, L. (2021). Insights into the Formation Mechanism of Low Water Saturation in Longmaxi Shale in the Jiaoshiba Area, Eastern Sichuan Basin. J. Earth Sci. 32 (4), 863–871. doi:10.1007/s12583-020-1353-3
Zhu, W. L. (2007). Geological Characteristics of Nature Gas Reservoir in Northern Margin Basin of South China Sea. Beijing: Petroleum Press, 44.
Zou, Y.-R., and Peng, P. a. (2001). Overpressure Retardation of Organic-Matter Maturation: a Kinetic Model and its Application. Mar. Petroleum Geol. 18, 707–713. doi:10.1016/s0264-8172(01)00026-5
Keywords: shallow overpressure, overpressure prediction, overpressure distribution, generation mechanism, basin modeling, deep water area, qiongdongnan basin
Citation: Ren J, Xu L, Shi W, Yang W, Wang R, He Y and Du H (2022) Shallow Overpressure Formation in the Deep Water Area of the Qiongdongnan Basin, China. Front. Earth Sci. 10:922802. doi: 10.3389/feart.2022.922802
Received: 18 April 2022; Accepted: 16 June 2022;
Published: 07 July 2022.
Edited by:
Lihua Zuo, Texas A&M University Kingsville, United StatesCopyright © 2022 Ren, Xu, Shi, Yang, Wang, He and Du. This is an open-access article distributed under the terms of the Creative Commons Attribution License (CC BY). The use, distribution or reproduction in other forums is permitted, provided the original author(s) and the copyright owner(s) are credited and that the original publication in this journal is cited, in accordance with accepted academic practice. No use, distribution or reproduction is permitted which does not comply with these terms.
*Correspondence: Litao Xu, bGl0YW94dTAwMUAxNjMuY29t; Wanzhong Shi, c2hpd3pAY3VnLmVkdS5jbg==
 Jinfeng Ren1,2
 Litao Xu
 Wei Yang
 Ren Wang
 Yulin He
