- 1Department of Ocean Science and Engineering, Southern University of Science and Technology, Shenzhen, China
- 2Southern Marine Science and Engineering Guangdong Laboratory (Guangzhou), Guangzhou, China
Bottom drag coefficient is one of the key parameters in quantifying shelf hydrodynamics and sediment transport processes. It varies markedly due to dynamic forcing and bed type differences, so a set of empirical values have been used for beds of coarse material where bedforms are often present. In comparison, dramatically fewer such rule-of-thumb values are available for muddy beds. Here, we present results of variations in bottom drag as calculated from in situ measurements by bottom-mounted tripods that were placed across the top of a muddy deposit during two different deployments, one in summer and another in winter. A tidal asymmetry of bottom drag was observed, most likely caused by variations of local bed roughness. For hydrodynamically smooth (
Introduction
Within the bottom boundary layer (BBL) on an oceanic shelf, bottom friction changes the velocity profile of the flow and the production/dissipation of turbulence, thus affecting the processes of physical, biological, chemical, and sediment transport (Trowbridge and Lentz, 2018). Among the numerous hydrodynamic and sediment dynamic models (Fringer et al., 2019), the current-related bed shear stress,
where
where
In the shallow water of continental shelves, the presence of surface waves (therefore wave-current interaction) impacts the hydrodynamics of the centimeter-scale wave BBL as well as the entire water column (Grant and Madsen, 1986). Wave actions change the velocity structure within the BBL and cause the flow to experience stronger drag (Grant and Madsen, 1979; Signell and List, 1997; Styles and Glenn, 2000; Nayak et al., 2015; Egan et al., 2019), but a recent study by Nelson and Fringer (2018) has shown that waves may lead to a decrease in drag on a smooth bed. Enhanced shear stress by energetic waves often leads to the resuspension of bed sediments (Brand et al., 2010; Egan et al., 2020b), which can further lead to stratification of suspended sediment and the drag-reduction effect on the flow (e.g., Wright et al., 1999; Peng et al., 2020). Therefore, the use of in situ data to obtain
Recent studies on sediment transport processes in the muddy areas of the East China Shelf Seas (ECSS) have often deployed numerical models such as the Regional Ocean Modeling System (e.g., Bian et al., 2013; Liu et al., 2015; Wang et al., 2019; Wang et al., 2020). The Regional Ocean Modeling System implements the simple quadratic drag-law approach for calculating BBL processes that require user input of the drag coefficient (Warner et al., 2008). This is often not an easy task because direct measurements of a drag coefficient are extremely scarce in the muddy areas of the ECSS due to a lack of in situ observations. Fan et al. (2019) derived the empirical relationship between
In this study, a field campaign was conducted to measure the BBL dynamics across the top of a mud deposit off the Shandong Peninsula in the Yellow Sea of China. Reynolds stress, therefore
Study Area
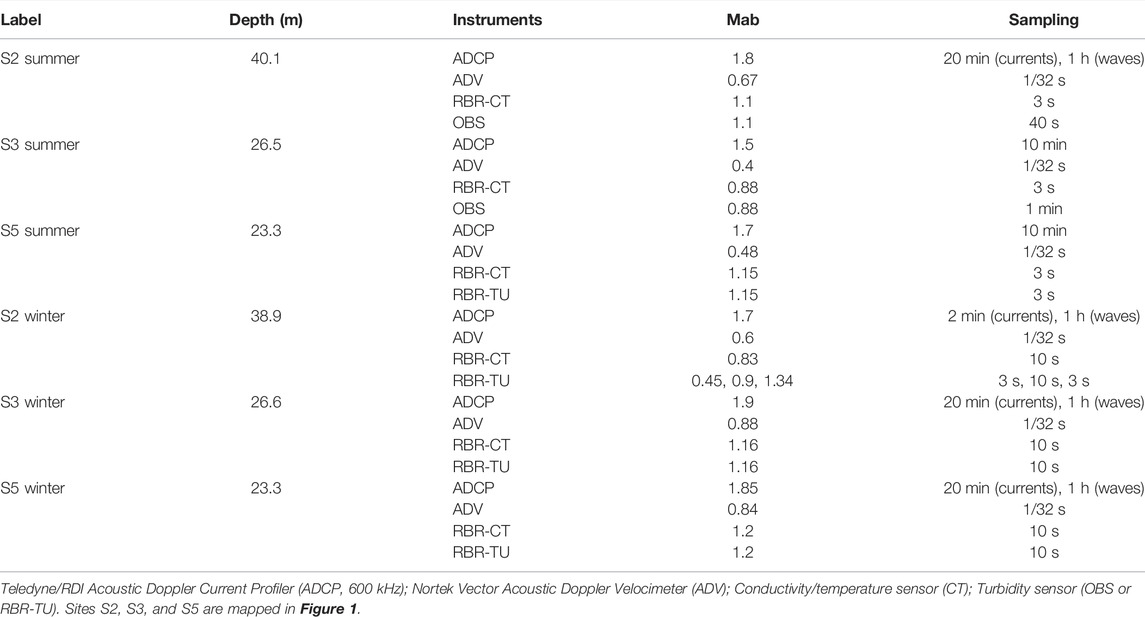
The scene of this study is around the depocenter of a muddy deposit in the coastal seas to the east of the Shandong Peninsula, China (Figure 1A). The water depths at the study stations are basically within 40 m, and their specific values are shown in Table 1. Previous sedimentary studies suggested that this muddy deposit was formed by sediments sourced from the Yellow River and transported by the Shandong Coastal Currents (SDCC), which flow out of the Bohai Sea to the Yellow Sea around the Shandong Peninsula (Figure 1A) (Alexander et al., 1991; Yang and Liu, 2007). Followed the Shepard scheme (Shepard, 1954), the surface sediment in the study area belongs to sandy silt with a mean grain size ranging from 5 to 6
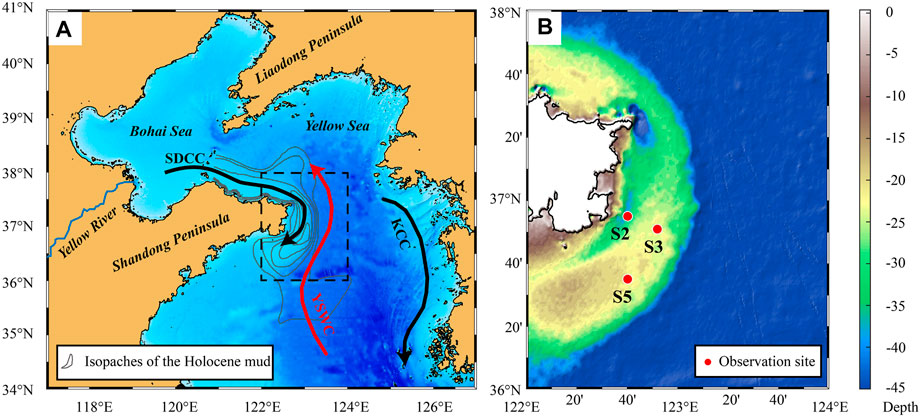
FIGURE 1. (A) Topography and currents of the Bohai and Yellow seas. The isopaches of the muddy area were from Yang and Liu (2007), and the currents were based on Bian et al. (2013). These currents are the Shandong Coastal Current (SDCC), the Yellow Sea Warm Current (YSWC), and the Korea Coastal Current (KCC) (B) The location of the observation sites.
Materials and Methods
Data Collection
Tripods were deployed at three stations on the Inner Shelf of the Shandong Peninsula during two 10-day field campaigns, one in summer (August 18–27, 2017), and another in winter (February 23–March 2, 2018) (Figure 1B). One more winter deployment (January 6–26, 2020) was conducted to make up for a fallen instrument at S2 during a previous deployment. Each tripod was equipped with an upward-looking Teledyne/RDI 600 kHz Acoustic Doppler Current Profiler (ADCP), a Nortek Vector Acoustic Doppler Velocimeter (ADV), a conductivity/temperature (CT) sensor, and a turbidity sensor (OBS or RBR-TU) (Table 1). The sampling period of each instrument is shown in Table 1. In addition, for winter observations at S2, turbidity sensors were placed at 0.45, 0.9, and 1.34 m above the bottom (mab) to record sediment concentrations within the bottom boundary layer (Table 1). CTD (SeaBird 19) packaged with Niskin bottles and a turbidity sensor was cast to collect water samples and profiles of temperature, salinity, and turbidity periodically from the watching boats that guarded each instrument against being damaged by trawling nets of passing fishing boats. These water samples were used to calibrate and convert the observed turbidities into suspended sediment concentrations (SSCs). Detailed processes of data quality assurance/quality control and calibration can be found in Qi et al. (2022).
Most ADCPs are equipped with a waving module that enables wave measurements (Table 1). In addition, hourly significant wave height and wave period data from the WaveWatch III Global Wave Model (WW3) at approximately 0.5° (∼50 km) resolution (Tolman et al., 2014), is widely used in coastal studies (e.g., Duan et al., 2020; Silva et al., 2018), were downloaded. We compared the modeled and observed significant wave height (
Tidal Analysis and Wave Parameter Estimates
We used T_TIDE, a package of routines in MATLAB for harmonic analysis, to make a tidal prediction (Pawlowicz et al., 2002). In agreement with previous studies, the dominant tidal constituent was M2, flowing southwest during flood tide and northeast during ebb tide.
The bottom wave orbital velocity,
where
Wave–Turbulence Decomposition and Turbulence Quantities
In a wavy aquatic environment, the ADV measured velocity components (
where

FIGURE 2. (A) Power spectra of velocity fluctuation and turbulent fluctuation (
Following Feddersen and Williams (2007), we used the nondimensional integrated cospectrum (ogive) for controlling the quality of WTD and the Reynolds stress estimates. The ogive for
where
After obtaining the turbulent fluctuation in three directions, we calculated the Reynolds stress, turbulent kinetic energy (TKE), and turbulent energy dissipation rates (
where
Calculation of the Bottom Drag Coefficient
The Bottom drag coefficient was estimated following Egan et al. (2020a). As
The instantaneous
Combining Eqs. 1, 2, we can deduce the dependence of
Results
Tides, Currents, Waves, and Winds
Figure 3 shows the tidal ellipses of M2 tidal components in summer and winter for each of the three stations. According to the rotation rate of the tidal ellipse, tide currents in sites S2 and S3 were reversing currents, while the tide in Site 5 (S5) was rotary currents (Figure 3). The maximum tidal velocity had a certain difference for each site, and was generally satisfied: S2>S3>S5, where the maximum tidal velocity of S2 was approximately 0.5 m/s (Figure 3).
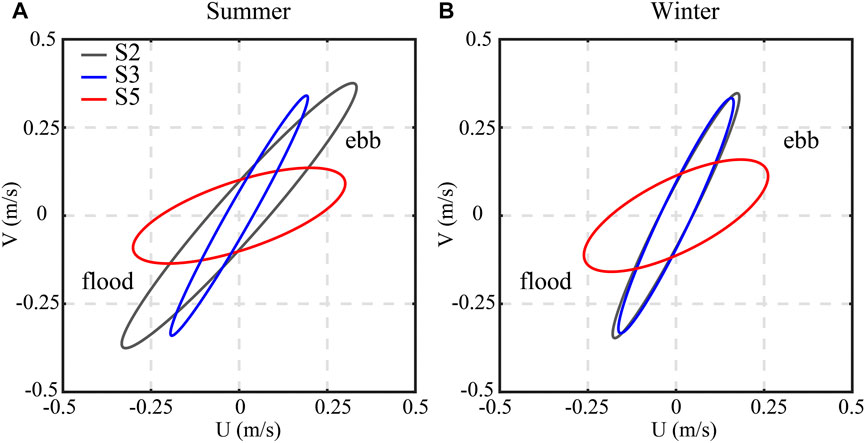
FIGURE 3. Tidal ellipses of M2 tidal components were calculated from the mean velocity at 1 mab in (A) summer and (B) winter for each of the three stations. The mean velocity was translated from ADV data by log law.
Figure 4 shows the magnitude of wave orbital velocities and wave directions. The maximum value of wave orbital velocity in summer was about 0.12 m/s (Figure 4A), and the average values were 0.01 m/s, 0.03 m/s, and 0.04 m/s at S2, S3, and S5, respectively. The wave propagation was mainly in the northwesterly direction in summer. It was not exactly matching with the direction of the instantaneous winds (Figure 5A) but was consistent with the trend of the prevailing southerly winds (Wu et al., 2019), indicating that the swell waves and background flow dominated the wave propagation.
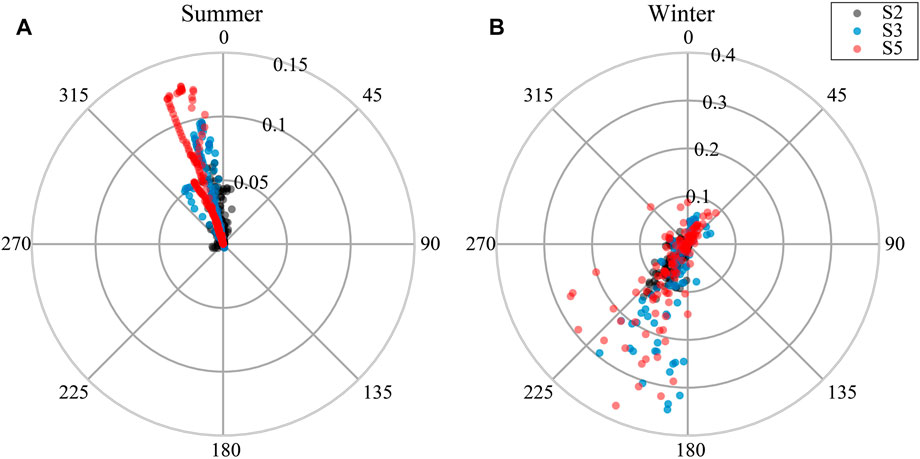
FIGURE 4. Wave magnitude and direction for three stations (S2, S3, and S5) in (A) summer and (B) winter, with 0° corresponding to the northward propagating wave, and the radial axis representing the bottom wave-orbital velocity,
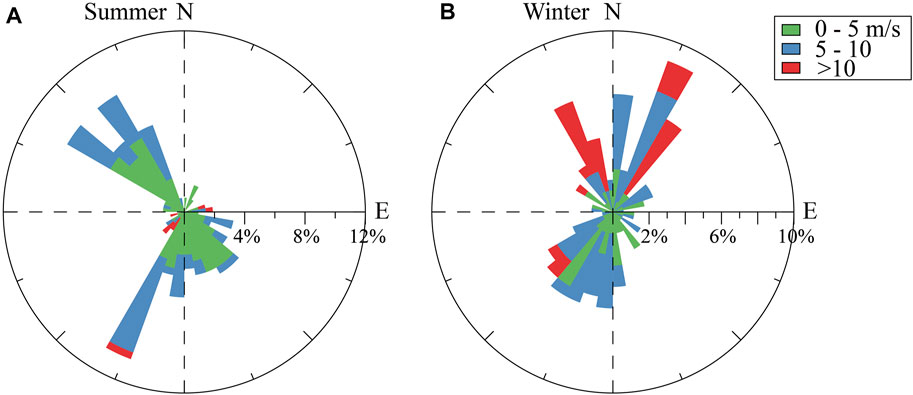
FIGURE 5. Rose diagrams of hourly averaged wind frequencies during (A) summer and (B) winter observations at S3. The greyscale indicates the categories of wind speed (m/s).
The overall intensity of waves was significantly higher in winter than that in summer (Figure 4). The maximum value of wave orbital velocity in winter was about 0.37 m/s, and the average values at S2, S3, and S5 were 0.01 m/s, 0.05 m/s, and 0.06 m/s, respectively. The wave direction was modulated by the local wind field. During periods of weak wind (wind speed less than 10 m/s), the wind direction was not fixed and was dominated alternately by southwesterly and northeasterly winds (Figure 5B). Therefore, when the orbital velocity was smaller than 0.1 m/s, the wave propagation direction was mainly southwestward or northeastward (Figure 4B). However, the stronger wind events (wind speed greater than 10 m/s) that occurred during the observation period were dominated by northerly winds (Figure 5B). Therefore, the wave propagation direction was mainly southwesterly when the orbital velocity was greater than 0.1 m/s (Figure 4B). Wave orbital velocities were higher at S3 and S5 than that at S2 because of the shallower water depth (Table 1). We used data in winter to discuss wave-current interactions in the rest of the article.
Bottom Drag Coefficient
First, we estimated time-series
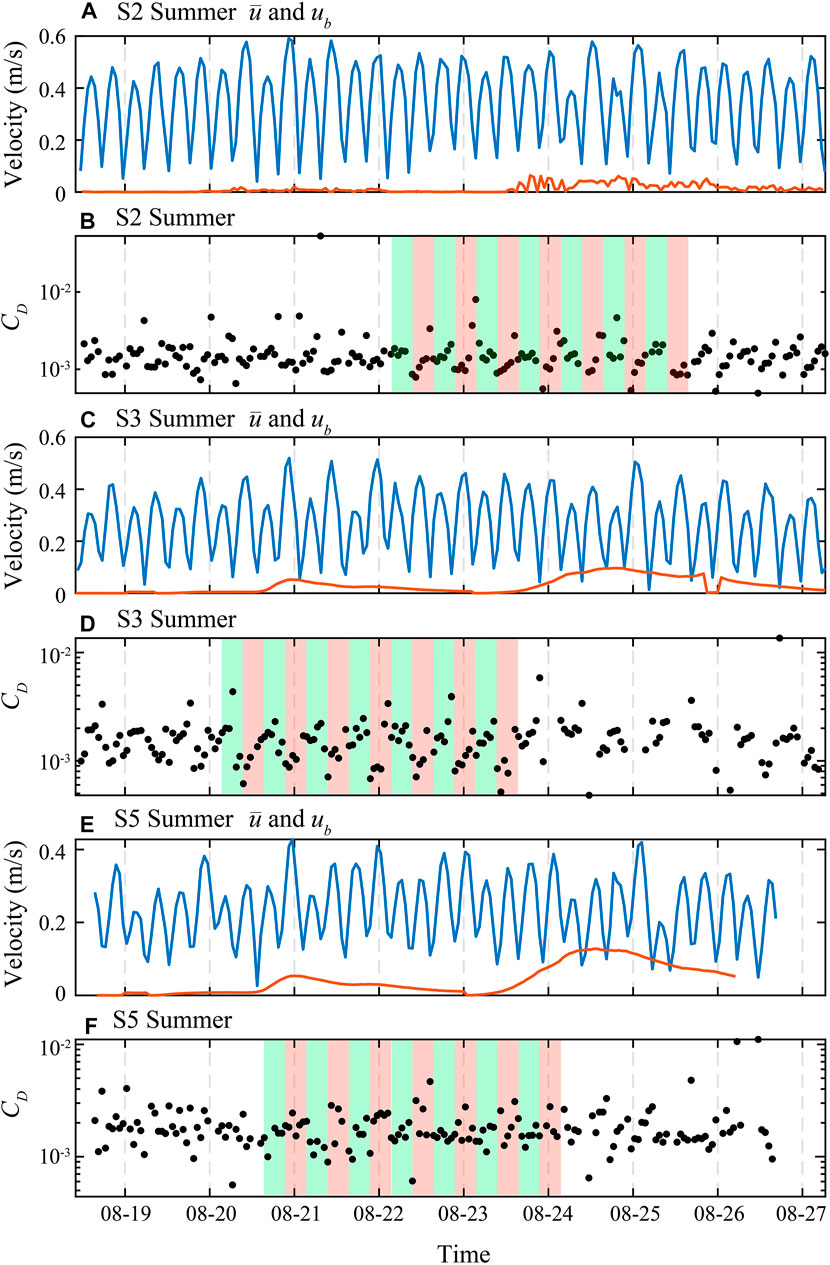
FIGURE 6. Time series of (A,C,E) ADV’s burst mean velocity (
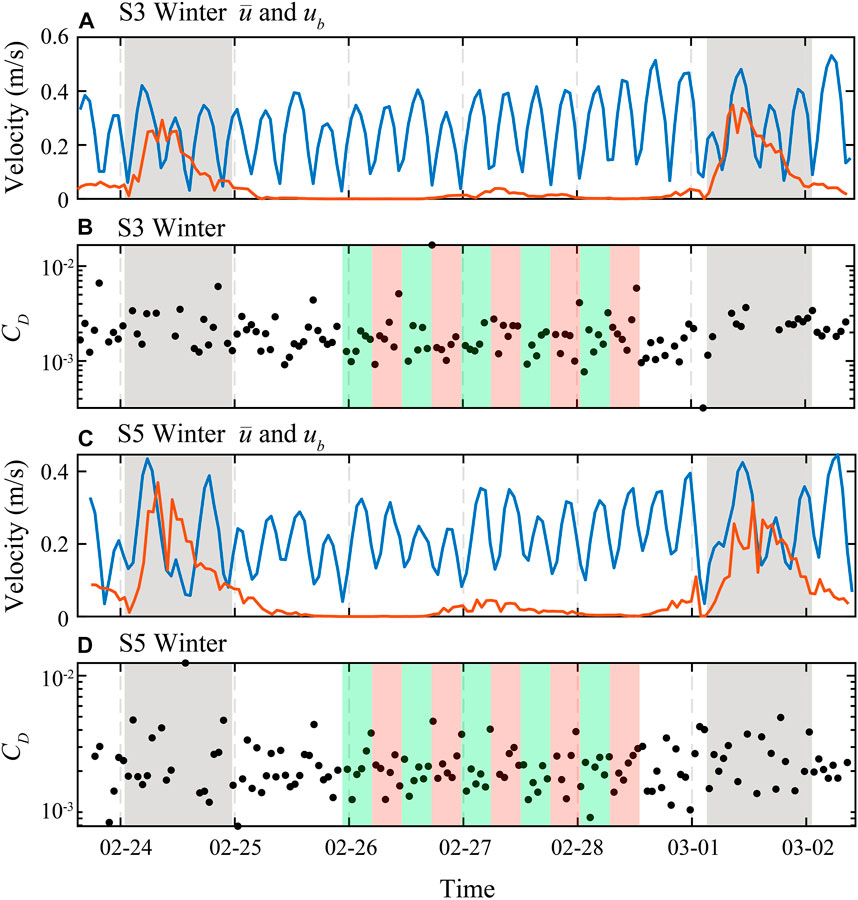
FIGURE 7. Time series of (A,C) ADV’s burst mean velocity (
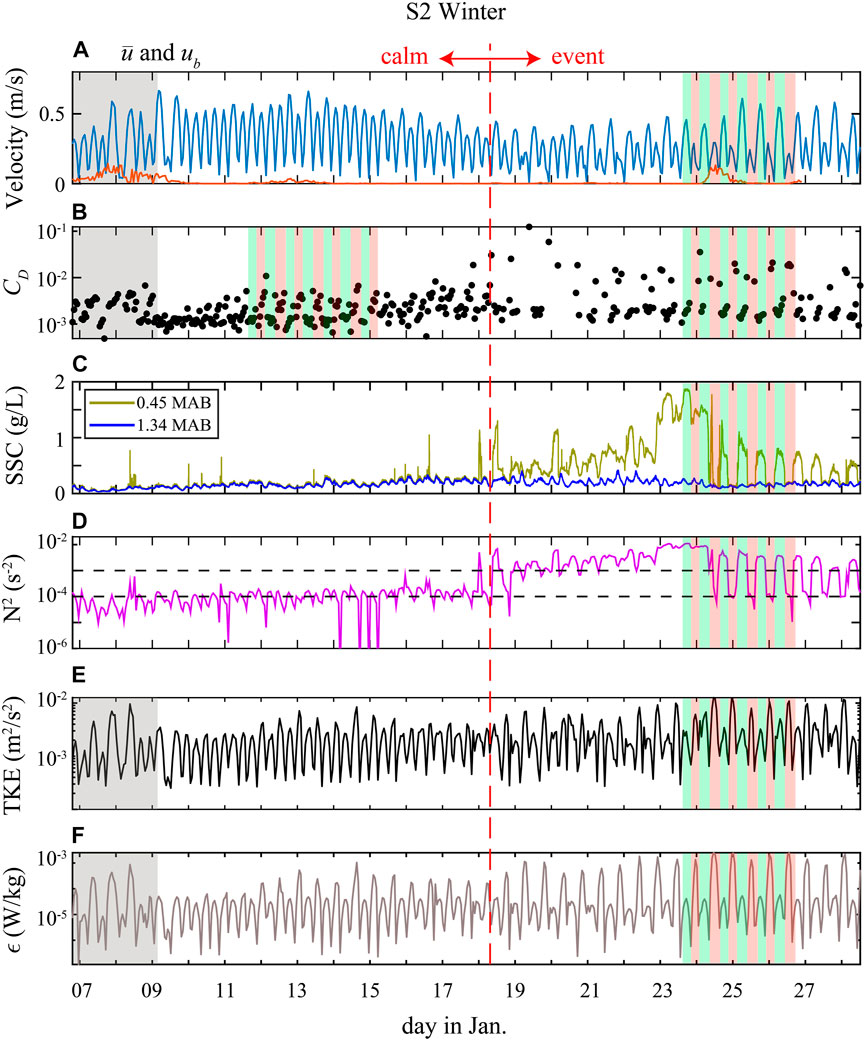
FIGURE 8. Twenty-day time series during the winter deployment at S2 showing measurements of (A) ADV’s burst mean velocity (
To recognize the flood–ebb tidal asymmetry
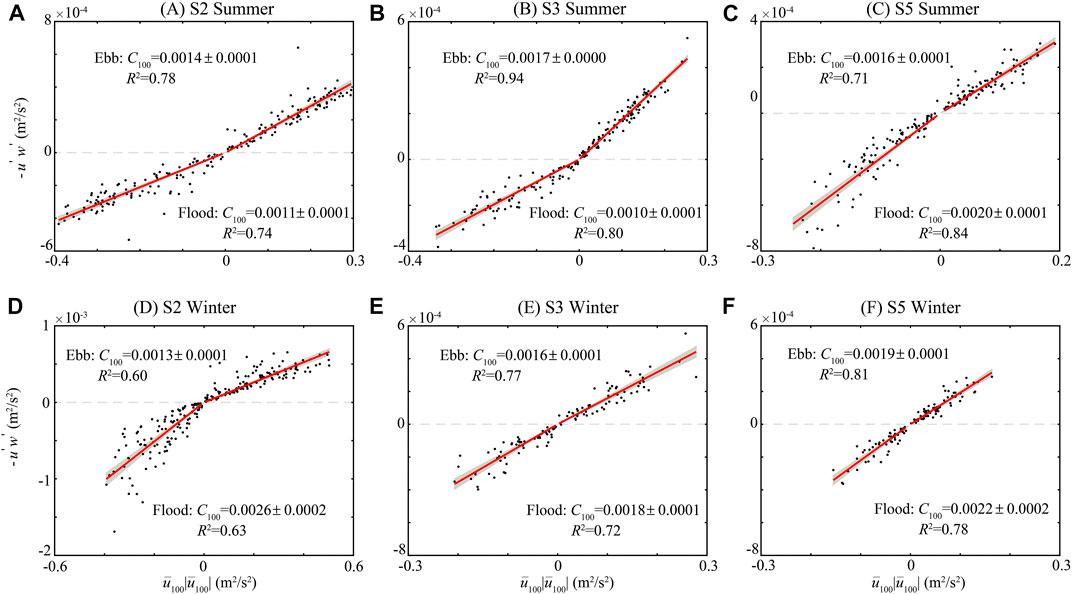
FIGURE 9. Correlation between measured turbulent Reynolds stress,
Discussion
Variation of
During event periods, the SSC at 0.45 mab was significantly higher than that of 1.34 mab, which caused significant suspended sediment stratification (Figure 8C). We used the buoyancy frequency squared,
Figure 10 shows the estimated
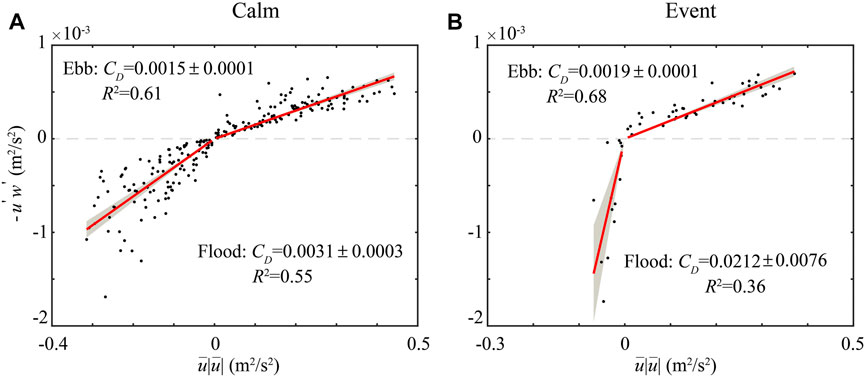
FIGURE 10. Correlation between measured turbulent Reynolds stress,
Flood–Ebb Asymmetry of
The variation of
Combined with the above analysis, variation in the tidal asymmetry
where
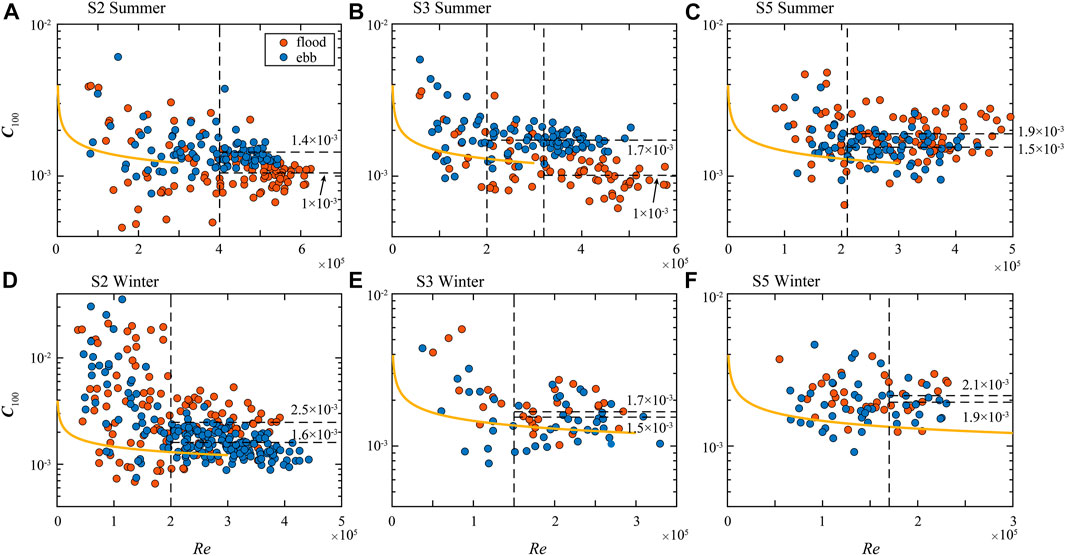
FIGURE 11. Scatter plots of drag coefficient estimated at 1 mab,

TABLE 2. The mean value of
Bottom Drag Enhanced by Waves
In addition to the change in roughness, the bottom drag experienced by currents could be enhanced by waves, which do affect the flood–ebb asymmetry

FIGURE 12. Correlation between measured turbulent Reynolds stress,
To quantify the effect of waves, we used a one-dimensional time-dependent model, referred to as the Grant-Madsen (GM) model, that incorporates the combined effects of a steady current in the presence of oscillatory waves (Grant and Madsen, 1979). In the GM model, the friction velocity combined waves and currents (
where
where
Based on the observed data, we calculated the
Figure 13A shows the estimates
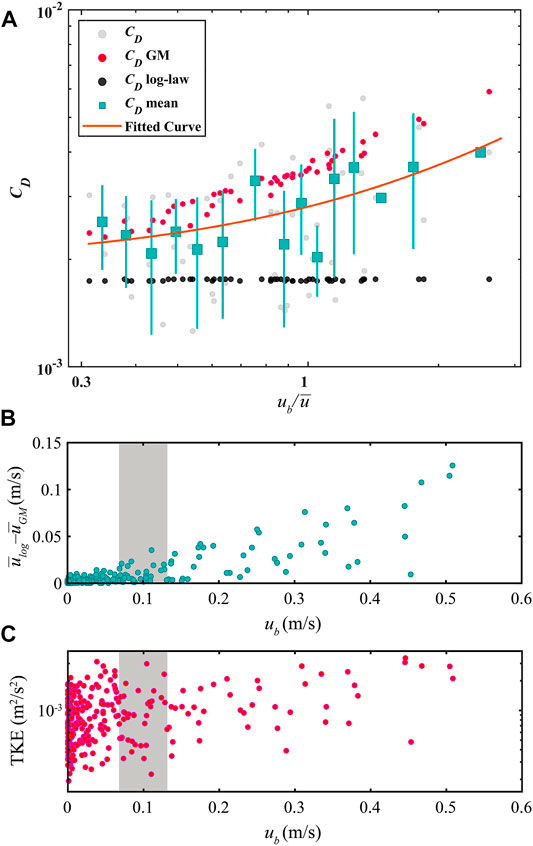
FIGURE 13. (A) Scatter plots of
Conclusion
In situ observations of currents, waves, and suspended sediment concentration at three stations on the muddy deposits off the Shandong Peninsula was conducted to investigate the variation of the bottom drag coefficient. Data collected in both summer and winter highlight the tidal variations and the effect of winter storm events. The results show that the estimated
In this work, we provide an accurate estimate of
Data Availability Statement
The original contributions presented in the study are included in the article/Supplementary Material; further inquiries can be directed to the corresponding author.
Author Contributions
JX and ZL: conceptualization, methodology, and reviewing. FQ: conceptualization, methodology, data curation, analyses, and original draft preparation.
Funding
The authors gratefully acknowledge the financial support of the Key Special Project for Introduced Talents Team of the Southern Marine Science and Engineering Guangdong Laboratory (Guangzhou) (GML2019ZD0210), Guangdong Basic and Applied Basic Research Foundation (2021B1515120080) and the National Natural Science Foundation of China (NSFC, Grant No. 41530966).
Conflict of Interest
The authors declare that the research was conducted in the absence of any commercial or financial relationships that could be construed as a potential conflict of interest.
Publisher’s Note
All claims expressed in this article are solely those of the authors and do not necessarily represent those of their affiliated organizations, or those of the publisher, the editors, and the reviewers. Any product that may be evaluated in this article, or claim that may be made by its manufacturer, is not guaranteed or endorsed by the publisher.
Acknowledgments
Special thanks go to Baoduo Wang, Meng Liu, Zhiwen Wang, and Xiaohang Liu for their support in fieldwork.
Supplementary Material
The Supplementary Material for this article can be found online at: https://www.frontiersin.org/articles/10.3389/feart.2022.921995/full#supplementary-material
References
Adams, C. E., and Weatherly, G. L. (1981). Some Effects of Suspended Sediment Stratification on an Oceanic Bottom Boundary Layer. J. Geophys. Res. 86 (C5), 4161–4172. doi:10.1029/JC086iC05p04161
Alexander, C. R., DeMaster, D. J., and Nittrouer, C. A. (1991). Sediment Accumulation in a Modern Epicontinental-Shelf Setting: The Yellow Sea. Mar. Geol. 98 (1), 51–72. doi:10.1016/0025-3227(91)90035-3
Baas, J. H., Baker, M. L., Malarkey, J., Bass, S. J., Manning, A. J., Hope, J. A., et al. (2019). Integrating Field and Laboratory Approaches for Ripple Development in Mixed Sand-Clay-EPS. Sedimentology 66 (7), 2749–2768. doi:10.1111/sed.12611
Bass, S. J., Aldridge, J. N., McCave, I. N., and Vincent, C. E. (2002). Phase Relationships between Fine Sediment Suspensions and Tidal Currents in Coastal Seas. J. Geophys. Res. 107 (C10), 3146. doi:10.1029/2001jc001269
Bian, C., Jiang, W., and Greatbatch, R. J. (2013). An Exploratory Model Study of Sediment Transport Sources and Deposits in the Bohai Sea, Yellow Sea, and East China Sea. J. Geophys. Res. Oceans 118 (11), 5908–5923. doi:10.1002/2013JC009116
Brand, A., Lacy, J. R., Hsu, K., Hoover, D., Gladding, S., and Stacey, M. T. (2010). Wind-enhanced Resuspension in the Shallow Waters of South San Francisco Bay: Mechanisms and Potential Implications for Cohesive Sediment Transport. J. Geophys. Res. 115. doi:10.1029/2010JC006172
Bricker, J. D., Inagaki, S., and Monismith, S. G. (2005). Bed Drag Coefficient Variability under Wind Waves in a Tidal Estuary. J. Hydraul. Eng. 131 (6), 497–508. doi:10.1061/(asce)0733-9429(2005)131:6(497)
Bricker, J. D., and Monismith, S. G. (2007). Spectral Wave-Turbulence Decomposition. J. Atmos. Ocean. Technol. 24 (8), 1479–1487. doi:10.1175/JTECH2066.1
Chriss, T. M., and Caldwell, D. R. (1982). Evidence for the Influence of Form Drag on Bottom Boundary Layer Flow. J. Geophys. Res. 87 (C6), 4148. doi:10.1029/JC087iC06p04148
Chriss, T. M., and Caldwell, D. R. (1984). Universal Similarity and the Thickness of the Viscous Sublayer at the Ocean Floor. J. Geophys. Res. 89 (C4), 6403–6414. doi:10.1029/JC089iC04p06403
Duan, H., Xu, J., Wu, X., Wang, H., Liu, Z., and Wang, C. (2020). Periodic Oscillation of Sediment Transport Influenced by Winter Synoptic Events, Bohai Strait, China. Water 12 (4), 986. doi:10.3390/w12040986
Egan, G., Chang, G., Revelas, G., Monismith, S., and Fringer, O. (2020a). Bottom Drag Varies Seasonally with Biological Roughness. Geophys. Res. Lett. 47 (15). doi:10.1029/2020GL088425
Egan, G., Cowherd, M., Fringer, O., and Monismith, S. (2019). Observations of Near‐Bed Shear Stress in a Shallow, Wave‐ and Current‐Driven Flow. J. Geophys. Res. Oceans 124 (8), 6323–6344. doi:10.1029/2019JC015165
Egan, G., Manning, A. J., Chang, G., Fringer, O., and Monismith, S. (2020b). Sediment‐Induced Stratification in an Estuarine Bottom Boundary Layer. J. Geophys. Res. Oceans 125 (8). doi:10.1029/2019JC016022
Fan, R., Zhao, L., Lu, Y., Nie, H., and Wei, H. (2019). Impacts of Currents and Waves on Bottom Drag Coefficient in the East China Shelf Seas. J. Geophys. Res. Oceans 124 (11), 7344–7354. doi:10.1029/2019JC015097
Feddersen, F., Gallagher, E. L., Guza, R. T., and Elgar, S. (2003). The Drag Coefficient, Bottom Roughness, and Wave-Breaking in the Nearshore. Coast. Eng. 48 (3), 189–195. doi:10.1016/s0378-3839(03)00026-7
Feddersen, F., and Williams, A. J. (2007). Direct Estimation of the Reynolds Stress Vertical Structure in the Nearshore. J. Atmos. Ocean. Technol. 24 (1), 102–116. doi:10.1175/JTECH1953.1
Fong, D. A., Monismith, S. G., Stacey, M. T., and Burau, J. R. (2009). Turbulent Stresses and Secondary Currents in a Tidal-Forced Channel with Significant Curvature and Asymmetric Bed Forms. J. Hydraul. Eng. 135 (3), 198–208. doi:10.1061/(asce)0733-9429(2009)135:3(198)
Francis P. Shepard, F. P. (1954). Nomenclature Based on Sand-Silt-Clay Ratios. Sepm Jsr Vol. 24 (3), 151–158. doi:10.1306/d4269774-2b26-11d7-8648000102c1865d
Fringer, O. B., Dawson, C. N., He, R., Ralston, D. K., and Zhang, Y. J. (2019). The Future of Coastal and Estuarine Modeling: Findings from a Workshop. Ocean. Model. 143, 101458. doi:10.1016/j.ocemod.2019.101458
Grant, W. D., and Madsen, O. S. (1979). Combined Wave and Current Interaction with a Rough Bottom. J. Geophys. Res. 84 (C4), 1797–1808. doi:10.1029/JC084iC04p01797
Grant, W. D., and Madsen, O. S. (1986). The Continental-Shelf Bottom Boundary Layer. Annu. Rev. Fluid Mech. 18 (1), 265–305. doi:10.1146/ANNUREV.FL.18.010186.001405
Green, M. O., and Mccave, I. N. (1995). Seabed Drag Coefficient under Tidal Currents in the Eastern Irish Sea. J. Geophys. Res. 100 (C8), 16057–16069. doi:10.1029/95JC01381
Harris, C. K., and Wiberg, P. L. (2001). A Two-Dimensional, Time-dependent Model of Suspended Sediment Transport and Bed Reworking for Continental Shelves. Comput. Geosciences 27 (6), 675–690. doi:10.1016/S0098-3004(00)00122-9
Herrmann, M. J., and Madsen, O. S. (2007). Effect of Stratification Due to Suspended Sand on Velocity and Concentration Distribution in Unidirectional Flows. J. Geophys. Res. 112 (C2). doi:10.1029/2006jc003569
Jones, N. L., and Monismith, S. G. (2008). Modeling the Influence of Wave-Enhanced Turbulence in a Shallow Tide- and Wind-Driven Water Column. J. Geophys. Res. 113, 1–13. doi:10.1029/2007JC004246
Kaimal, J. C., Wyngaard, J. C., Izumi, Y., and Coté, O. R. (1972). Spectral Characteristics of Surface-Layer Turbulence. Q.J R. Met. Soc. 98 (417), 563–589. doi:10.1002/QJ.49709841707
Liu, S., Qiao, L., Li, G., Li, J., Wang, N., and Yang, J. (2015). Distribution and Cross-Front Transport of Suspended Particulate Matter over the Inner Shelf of the East China Sea. Cont. Shelf Res. 107, 92–102. doi:10.1016/j.csr.2015.07.013
Liu, Z., and Wei, H. (2007). Estimation to the Turbulent Kinetic Energy Dissipation Rate and Bottom Shear Stress in the Tidal Bottom Boundary Layer of the Yellow Sea. Progress in Natural Science 17, 289–297. doi:10.1080/10020070612331343260
MacVean, L. J., and Lacy, J. R. (2014). Interactions between Waves, Sediment, and Turbulence on a Shallow Estuarine Mudflat. J. Geophys. Res. Oceans 119 (3), 1534–1553. doi:10.1002/2013JC009477
Magaldi, M. G., Özgökmen, T. M., Griffa, A., and Rixen, M. (2009). On the Response of a Turbulent Coastal Buoyant Current to Wind Events: the Case of the Western Adriatic Current. Ocean. Dyn. 60 (1), 93–122. doi:10.1007/s10236-009-0247-9
Mo, D., Hou, Y., Li, J., and Liu, Y. (2016). Study on the Storm Surges Induced by Cold Waves in the Northern East China Sea. J. Mar. Syst. 160, 26–39. doi:10.1016/j.jmarsys.2016.04.002
Naimie, C. E., Blain, C. A., and Lynch, D. R. (2001). Seasonal Mean Circulation in the Yellow Sea } a Model-Generated Climatology. Cont. Shelf Res. 21 (6), 667–695. doi:10.1016/S0278-4343(00)00102-3
Nayak, A. R., Li, C., Kiani, B. T., and Katz, J. (2015). On the Wave and Current Interaction with a Rippled Seabed in the Coastal Ocean Bottom Boundary Layer. J. Geophys. Res. Oceans 120 (7), 4595–4624. doi:10.1002/2014jc010606
Nelson, K. S., and Fringer, O. B. (2018). Sediment Dynamics in Wind Wave‐Dominated Shallow‐Water Environments. J. Geophys. Res. Oceans 123 (10), 6996–7015. doi:10.1029/2018jc013894
Pawlowicz, R., Beardsley, B., and Lentz, S. (2002). Classical Tidal Harmonic Analysis Including Error Estimates in MATLAB Using T_TIDE. Comput. Geosciences 28 (8), 929–937. doi:10.1016/S0098-3004(02)00013-4
Peng, Y., Yu, Q., Yang, Y., Wang, Y., Wang, Y. P., and Gao, S. (2020). Flow Structure Modification and Drag Reduction Induced by Sediment Stratification in Coastal Tidal Bottom Boundary Layers. Estuar. Coast. Shelf Sci. 241, 106829. doi:10.1016/j.ecss.2020.106829
Perlin, A., and Kit, E. (2002). Apparent Roughness in Wave-Current Flow: Implication for Coastal Studies. J. Hydraul. Eng. 128 (8), 729–741. doi:10.1061/(asce)0733-9429(2002)128:8(729)
Peters, H. (1999). Spatial and Temporal Variability of Turbulent Mixing in an Estuary. J. Mar. Res. 57 (6), 805–845. doi:10.1357/002224099321514060
Qi, F., Wu, X., Wang, Z., Wang, C., Duan, H., Liu, M., et al. (2022). Transport and Deposition Processes of the Sediment Depocenter off the Shandong Peninsula: An Observational Study. Cont. Shelf Res. 244, 104763. doi:10.1016/j.csr.2022.104763
Ruessink, B. G. (2010). Observations of Turbulence within a Natural Surf Zone. J. Phys. Oceanogr. 40 (12), 2696–2712. doi:10.1175/2010jpo4466.1
Safak, I. (2016). Variability of Bed Drag on Cohesive Beds under Wave Action. Water 8 (4), 131. doi:10.3390/w8040131
Saha, S., Moorthi, S., Wu, X., Wang, J., Nadiga, S., Tripp, P., et al. (2014). The NCEP Climate Forecast System Version 2. J. Clim. 27 (6), 2185–2208. doi:10.1175/JCLI-D-12-00823.1
Scully, M. E., Trowbridge, J. H., Sherwood, C. R., Jones, K. R., and Traykovski, P. (2018). Direct Measurements of Mean Reynolds Stress and Ripple Roughness in the Presence of Energetic Forcing by Surface Waves. J. Geophys. Res. Oceans 123 (4), 2494–2512. doi:10.1002/2017jc013252
Sherwood, C. R., Lacy, J. R., and Voulgaris, G. (2006). Shear Velocity Estimates on the Inner Shelf off Grays Harbor, Washington, USA. Cont. Shelf Res. 26 (17-18), 1995–2018. doi:10.1016/j.csr.2006.07.025
Signell, R. P., and List, J. H. (1997). Effect of Wave-Enhanced Bottom Friction on Storm-Driven Circulation in Massachusetts Bay. J. Waterw. Port Coast. Ocean Eng. 123 (5), 233–239. doi:10.1061/(asce)0733-950x(1997)123:5(233)
Soulsby, R. L. (1983). Chapter 5 the Bottom Boundary Layer of Shelf Seas. Elsevier Oceanogr. 35, 189–266. doi:10.1016/S0422-9894(08)70503-8
Soulsby, R. L., and Dyer, K. R. (1981). The Form of the Near-Bed Velocity Profile in a Tidally Accelerating Flow. J. Geophys. Res. 86 (C9), 8067–8074. doi:10.1029/JC086iC09p08067
Soulsby, R. L. (2006). Simplified Calculation of Wave Orbital Velocities. Wallingford: HR Wallingford Ltd.
Soulsby, R. L. (1997). The Dynamics of Marine Sands: A Manual for Practical Applications. London: Thomas Thelford.
Sreenivasan, K. R., and Katepalli, R. (1995). On the Universality of the Kolmogorov Constant. Phys. Fluids 7 (11), 2778–2784. doi:10.1063/1.868656
Sternberg, R. W. (1970). Field Measurements of the Hydrodynamic Roughness of the Deep-Sea Boundary. Deep Sea Res. Oceanogr. Abstr. 17 (3), 413–420. doi:10.1016/0011-7471(70)90056-2
Sternberg, R. W. (1968). Friction Factors in Tidal Channels with Differing Bed Roughness. Mar. Geol. 6 (3), 243–260. doi:10.1016/0025-3227(68)90033-9
Styles, R., and Glenn, S. M. (2000). Modeling Stratified Wave and Current Bottom Boundary Layers on the Continental Shelf. J. Geophys. Res. 105 (C10), 24119–24139. doi:10.1029/2000jc900115
Teague, W. J., Perkins, H. T., Hallock, Z. R., and Jacobs, G. A. (1998). Current and Tide Observations in the Southern Yellow Sea. J. Geophys. Res. 103 (C12), 27783–27793. doi:10.1029/98jc02672
Tolman, H. L., Accensi, M., Alves, H., Ardhuin, F., Bidlot, J., Booij, N., et al. (2014). User Manual and System Documentation of WAVEWATCH III R Version 4.18.
Trembanis, A. C., Wright, L. D., Friedrichs, C. T., Green, M. O., and Hume, T. (2004). The Effects of Spatially Complex Inner Shelf Roughness on Boundary Layer Turbulence and Current and Wave Friction: Tairua Embayment, New Zealand. Cont. Shelf Res. 24 (13-14), 1549–1571. doi:10.1016/j.csr.2004.04.006
Trowbridge, J. H., and Lentz, S. J. (2018). The Bottom Boundary Layer. Annu. Rev. Mar. Sci. 10, 397–420. doi:10.1146/annurev-marine-121916-063351
Tu, J., Fan, D., and Voulgaris, G. (2021). Field Observations of Turbulence, Sediment Suspension, and Transport under Breaking Tidal Bores. Mar. Geol. 437, 106498. doi:10.1016/j.margeo.2021.106498
Tu, J., Fan, D., Zhang, Y., and Voulgaris, G. (2019). Turbulence, Sediment‐Induced Stratification, and Mixing under Macrotidal Estuarine Conditions (Qiantang Estuary, China). J. Geophys. Res. Oceans 124 (6), 4058–4077. doi:10.1029/2018jc014281
Van Rijn, L. C. (1993). Principles of Sediment Transport in Rivers, Estuaries and Coastal Seas Part 1. Amsterdam: Aqua Publications.
Van Rijn, L. C. (2007). Unified View of Sediment Transport by Currents and Waves. I: Initiation of Motion, Bed Roughness, and Bed-Load Transport. J. Hydraul. Eng. 133 (6), 649–667. doi:10.1061/(asce)0733-9429(2007)133:6(649)
Vieira da Silva, G., Toldo Jr., E. E., Klein, A. H. d. F., and Short, A. D. (2018). The Influence of Wave-, Wind- and Tide-Forced Currents on Headland Sand Bypassing - Study Case: Santa Catarina Island North Shore, Brazil. Geomorphology 312, 1–11. doi:10.1016/J.GEOMORPH.2018.03.026
Wang, A., Ralston, D. K., Bi, N., Cheng, Z., Wu, X., and Wang, H. (2019). Seasonal Variation in Sediment Transport and Deposition on a Muddy Clinoform in the Yellow Sea. Cont. Shelf Res. 179, 37–51. doi:10.1016/j.csr.2019.04.009
Wang, C., Liu, Z., Harris, C. K., Wu, X., Wang, H., Bian, C., et al. (2020). The Impact of Winter Storms on Sediment Transport through a Narrow Strait, Bohai, China. J. Geophys. Res. Oceans 125 (6), e2020JC016069. doi:10.1029/2020jc016069
Wang, D., Liu, Q., and Lv, X. (2014). A Study on Bottom Friction Coefficient in the Bohai, Yellow, and East China Sea. Math. Problems Eng. 2014, 1–7. doi:10.1155/2014/432529
Warner, J. C., Sherwood, C. R., Signell, R. P., Harris, C. K., and Arango, H. G. (2008). Development of a Three-Dimensional, Regional, Coupled Wave, Current, and Sediment-Transport Model. Comput. Geosciences 34 (10), 1284–1306. doi:10.1016/j.cageo.2008.02.012
Wiberg, P. L., and Sherwood, C. R. (2008). Calculating Wave-Generated Bottom Orbital Velocities from Surface-Wave Parameters. Comput. Geosciences 34 (10), 1243–1262. doi:10.1016/j.cageo.2008.02.010
Wilkinson, R. H. (1985). Variation of Roughness Length of a Mobile Sand Bed in a Tidal Flow. Geo-Marine Lett. 5 (4), 231–239. doi:10.1007/BF02233808
Wright, L. D. (1989). Benthic Boundary Layers of Estuarine and Coastal Environments. Rev. Aquatic Sci. 1, 75–95.
Wright, L. D., Kim, S. C., and Friedrichs, C. T. (1999). Across-shelf Variations in Bed Roughness, Bed Stress and Sediment Suspension on the Northern California Shelf. Mar. Geol. 154 (1), 99–115. doi:10.1016/S0025-3227(98)00106-6
Wu, H., Wang, Y. P., Gao, S., Xing, F., Tang, J., and Chen, D. (2022). Fluid Mud Dynamics in a Tide-Dominated Estuary: A Case Study from the Yangtze River. Cont. Shelf Res. 232, 104623. doi:10.1016/j.csr.2021.104623
Wu, X., Xu, J., Wu, H., Bi, N., Bian, C., Li, P., et al. (2019). Synoptic Variations of Residual Currents in the Huanghe (Yellow River)-Derived Distal Mud Patch off the Shandong Peninsula: Implications for Long-Term Sediment Transport. Mar. Geol. 417, 106014. doi:10.1016/j.margeo.2019.106014
Xu, J. P., and Wright, L. D. (1995). Tests of Bed Roughness Models Using Field Data from the Middle Atlantic Bight. Cont. Shelf Res. 15, 1409–1434. doi:10.1016/0278-4343(94)00083-Y
Xu, P., Mao, X., and Jiang, W. (2017). Estimation of the Bottom Stress and Bottom Drag Coefficient in a Highly Asymmetric Tidal Bay Using Three Independent Methods. Cont. Shelf Res. 140, 37–46. doi:10.1016/j.csr.2017.04.004
Yang, Z. S., and Liu, J. P. (2007). A Unique Yellow River-Derived Distal Subaqueous Delta in the Yellow Sea. Mar. Geol. 240 (1-4), 169–176. doi:10.1016/j.margeo.2007.02.008
Keywords: continental shelf, drag coefficient, muddy deposit, tidal asymmetry, wave–current interaction
Citation: Qi F, Liu Z and Xu J (2022) Bottom Drag Variations Under Waves and Currents: A Case Study on a Muddy Deposit off the Shandong Peninsula. Front. Earth Sci. 10:921995. doi: 10.3389/feart.2022.921995
Received: 17 April 2022; Accepted: 12 May 2022;
Published: 01 July 2022.
Edited by:
Ya Ping Wang, East China Normal University, ChinaCopyright © 2022 Qi, Liu and Xu. This is an open-access article distributed under the terms of the Creative Commons Attribution License (CC BY). The use, distribution or reproduction in other forums is permitted, provided the original author(s) and the copyright owner(s) are credited and that the original publication in this journal is cited, in accordance with accepted academic practice. No use, distribution or reproduction is permitted which does not comply with these terms.
*Correspondence: Jingping Xu, eHVqcEBzdXN0ZWNoLmVkdS5jbg==
 Fukang Qi
 Zhiqiang Liu
 Jingping Xu