- 1Key Laboratory of Mountain Hazards and Earth Surface Processes/Institute of Mountain Hazards and Environment, Chinese Academy of Sciences, Chengdu, China
- 2University of Chinese Academy of Sciences, Beijing, China
- 3College of Civil Engineering & Architecture, China Three Gorges University, Yichang, China
Large earthquakes can trigger landslides and collapses, which not only increase the mass of loose solid materials but also change the topography of catchments. Debris flow activity in response to earthquakes is of widespread concern; however, most studies have focused on the material conditions and flow property variations prior to and after earthquakes. In this study, we investigate temporal variations in the debris flow activity in a typical catchment in the Wenchuan Earthquake area via the sediment connectivity index (IC), which reflects the sediment delivery efficiency in the catchment. The IC values in different tributaries and during different time periods were calculated to determine their spatial distribution and temporal variations. The results show that high IC values are distributed in downstream tributaries near the main fault. The IC values decreased significantly following a 2008 Wenchuan Earthquake, indicating a continuous decrease in the sediment transfer ability. The debris flow history and loose solid material amounts were also investigated via field surveys. The debris flow activity is closely related to variations in the solid material source amounts and the IC values in the catchment. This study provides a new insight into the assessment of debris flow activity with respect to its close relationship with the distribution of loose solid materials and the sediment connectivity.
1 Introduction
Earthquakes that occur in mountains can instantaneously change landscapes, release massive amounts of energy, and trigger large numbers of landslides as sources of debris flows. Earthquakes play an important role in increasing erosion, sediment transport, and deposition (Pearce and Watson, 1983; Pearce and Watson, 1986; Guo et al., 2016; Fan et al., 2019a; Hu et al., 2019). For example, an earthquake that occurred on May 12, 2008, in Wenchuan County, Sichuan Province, China, triggered more than 56,000 landslides and collapses (Parker et al., 2011; Fan et al., 2019a), with abundant loose solid materials retained in channels and on hillslopes. Debris flows subsequently occurred very frequently in the following years, especially in the rainy seasons in neighboring catchments close to the epicenter (Cui et al., 2009; Guo et al., 2015; Guo et al., 2016; Fan et al., 2019a). The influence of an earthquake is estimated to last more than 20 years (Dadson et al., 2004; Tang et al., 2009; Guo et al., 2016). Therefore, it is necessary, both scientifically and practically, to assess the debris flow activity and its temporal evolution.
Earthquakes influence debris flows by creating numerous material sources for debris flows and by changing the topography of the slopes and channels, both of which need to be considered in evaluations of post-earthquake debris flows. Previous studies have indicated that there are temporal variations in the post-earthquake debris flow activity; for example, Fan et al. (2019a) proposed spatial and temporal patterns of enhanced mass wasting based on multi-temporal inventories of coseismic landslides and collapses. Guo et al. (2021) proposed variations in the characteristics of debris flows using actual monitoring data and presented increased triggering conditions after analyzing the hydrological process of debris flow formation. However, the effect of topographic variations is rarely considered.
Connectivity is a concept that represents the materials and energy transfer in a catchment system. It can be expressed at different spatio-temporal scales and is widely used in fields such as hydrology, geomorphology, geography, and landscape ecology (Michaelides and Chappell, 2009). Connectivity represents the linkage of sediment transfer in different parts of a catchment (e.g., the progress of sediment from sources thorough the catchment to the outlet) and is crucial to sediment redistribution over a landscape (Bracken et al., 2015; Najafi et al., 2021). It also provides a constructive framework to describe both the erosion and deposition processes of sediment transport with respect to the spatio-temporal variability of a catchment (Wainwright et al., 2011) and reflects the pathways of runoff and sediment at a given time as an effective concept for sediment management (Heckmann and Vericat, 2018).
Debris flows represent a special type of sediment transfer behavior in a catchment, involving a large amount material movement in a very short period. High connectivity indicates that a debris flow can be easily transferred downstream from its source in a catchment. Nevertheless, the sediment connectivity is not static; changes in the connectivity not only usually affect the development process of a debris flow, such as the addition of materials and the efficiency of sediment delivery, but can also be used as an index with which to assess the debris flow activity.
As a proxy variable, sediment connectivity is not measured directly. Various indices, existing models, and graph theories have been proposed and employed to quantify the sediment connectivity (Borselli et al., 2008; Hoffmann, 2015; Cossart and Fressard, 2017; Sadeghi et al., 2017; Zanandrea et al., 2019; Pearson et al., 2020; Najafi et al., 2021). In general, it is expressed by the sediment connectivity index (IC), which is calculated using factors affecting the sediment yield and transport, such as topographic characteristics and the vegetative cover (Foerster et al., 2014; Lisenby and Fryirs, 2017; Zanandrea et al., 2021). A model for calculating the IC value on a slope and in a small headwater catchment has been proposed (Borselli et al., 2008; Cavalli et al., 2013) based on the topographic characteristics of the catchment.
The debris flows are a special sediment transfer in a catchment. Debris flows strongly control sediment transfer patterns in mountainous catchments and their frequent and geomorphic changes are rapid. Recently, sediment connectivity method has been used in debris flows transfer (Abatti et al., 2021) and the high IC values have a superposition with debris flows path. So, sediment connectivity could be used to describe the potential transfer path for debris flows. It is a linkage of materials movements, no matter the materials come from general sediment transfer or debris flows. Here, we use this approach to investigate how the connectivity and topographic variations in a debris flow catchment, which has more extensive and complex sediment transfer behavior than a single slope, correspond to the debris flow activity in that catchment. We investigate how the variation in the loose solid materials and the sediment connectivity of a debris flow is influenced by an earthquake. Both the spatial distribution and the temporal variation of the loose solid materials and sediment connectivity were analyzed in a catchment to study the effect of an earthquake on the debris flow activity in the 2008 Wenchuan Earthquake area.
2 Study Site
The Qipangou Valley was selected to assess the debris flow activity in response to an earthquake. This valley is situated in Wenchuan County in Sichuan Province, southwestern China, approximately 44 km from the epicenter of the 2008 Wenchuan Earthquake. It is a tributary of the Minjiang River and covers an area of 54.2 km2. The elevation ranges from 1320 m at the basin outlet to 4360 m at the mountain ridge. The channel is 15.8-km long and the channel gradient is approximately 180‰. Mid-alpine mountains and deep canyon landforms characterize the catchment. It hosts a variety of glacial-erosion geomorphic structures, including a horn, cirque, and hanging valley above 3000 m. In contrast, in the main channel, the catchment is characterized by a deep-cutting V-shaped valley.
The average annual mean precipitation is 530 mm. The catchment is situated in the southern part of the Jiudingshan Cathaysian tectonic belt and is a part of the interstitial fold subsystem of the Ganzi-Songpan geosynclinal belt and the Yangtze Platform. The lithology is principally composed of dolomite, diorite, and granite, which have developed rock joints and fissures over time. As a result of the hard rocks and the stable vegetation, the primary sediment source for debris flows prior to 2008 was shallow slope sediments near the outlet. Debris flows occurred with low frequency and contained small amounts of sediment as a result of the dry climate conditions and limited source materials.
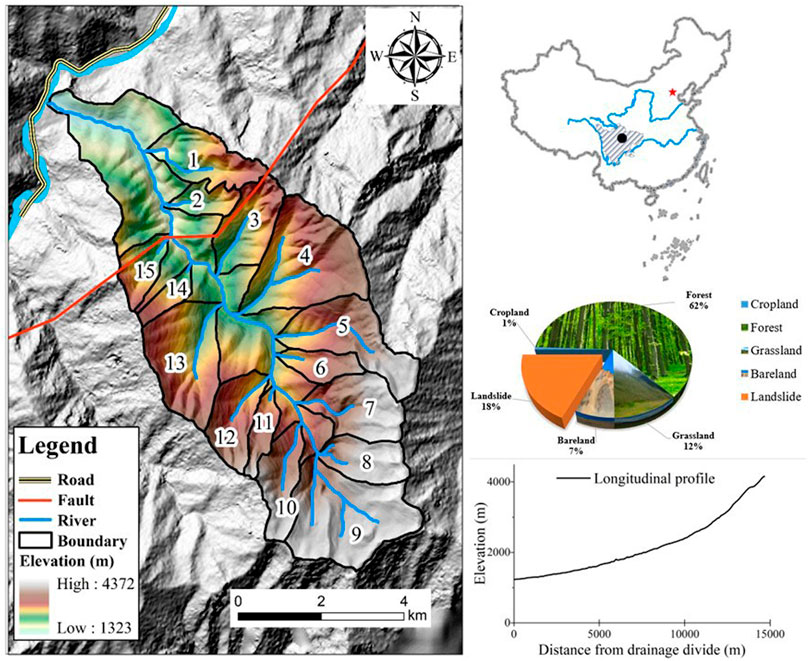
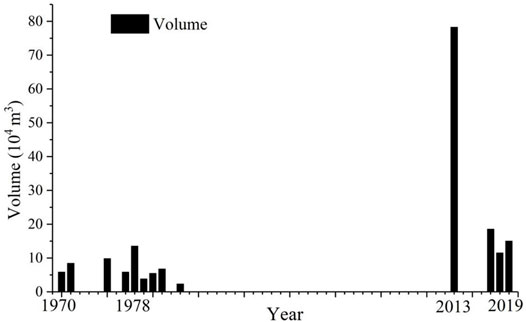
The catchment was significantly affected by the 2008 Wenchuan Earthquake, which caused large-scale collapses and landslides; for example, earthquake-related landslides occurred over 22% of the area in 2010 (Figure 1). The most disastrous debris flows event occurred on July 11, 2013; this event was triggered by a storm with 118 mm of rainfall and resulted in eight deaths and six missing, caused infrastructure destruction, and blocked the Minjiang River, forming a dammed lake. Associated debris flows are still currently active, indicating the necessity of assessing the debris flow activity in this region (Figure 2). From 2014 to 2021, we took many field investigations in Qipangou valley, and many data have been acquired, especially the real-time distribution of landslides and collapses after the 2008 Wenchuan Earthquake. Therefore, Qipangou valley is the best for this research.
3 Data Sources and Methods
3.1 Data Acquisition
The geographic information data used for this study consisted of digital elevation models (DEMs) and remote-sensing images. The studied time period was divided into periods before 2008, from 2008 to 2013, and after 2013, based on two catastrophic events: the Wenchuan Earthquake on May 12, 2008, and the debris flow on July 11, 2013. The DEM derived from the SRTM data in 2008 with a resolution of 30 m × 30 m, ALOS PALSAR data collected in 2010 with a horizontal accuracy of 12.5 m × 12.5 m, and an unmanned aerial vehicle DEM with a resolution of 12.5 m × 12.5 m were used for the topographic analyses in the different time periods. The aerial photographs from Landsat-4/5 on June 30, 2000, with a resolution of 30 m × 30 m, Ikonos on May 23, 2008, with a resolution of 1 m × 1 m, and an unmanned aerial vehicle on July 13, 2013, with a resolution of 1 m × 1 m, were used to determine the land use and analyze the debris flow sources in the different time periods (Figure 3).
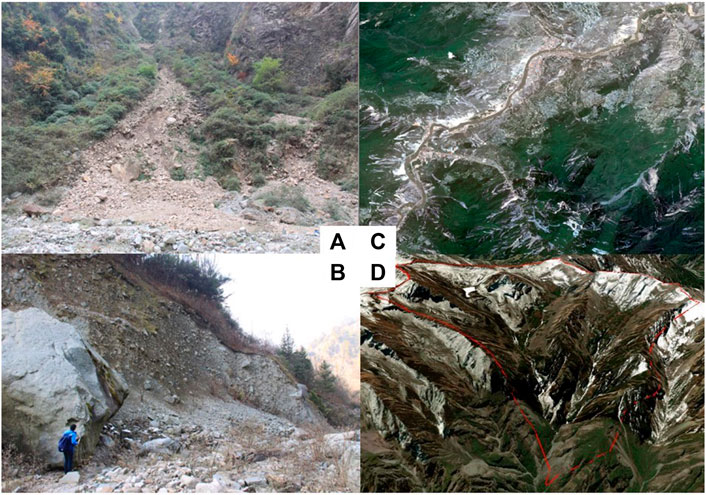
FIGURE 3. Field investigation and remote sensing images in Qipangou valley (A,B) photography of Qipangou valley (C,D) Ikonos images and UAV images of Qipangou valley.
3.2 Methods to Identify IC
In this study, we use IC to represent the potential debris flows transfer pathway and to describe the storage capacity of a debris flow catchment. IC is a dimensionless parameter that has upslope and downslope components and is therefore used to express the sediment transport and the potential connectivity between units (Figure 4). It is calculated using Eq. 1 (Crema and Cavalli, 2018), which describes the sediment changes over an entire catchment. The upslope component describes the main distribution of the sediment yield, and the amount of loose solid materials is related to the slope and the area. Sediment transfer primarily takes places in the channels in the downslope component and is influenced by the runoff length and the channel slope. The ratio of the upslope and downslope sediments could represent the sediment transfer efficiency from upslope to downslope.
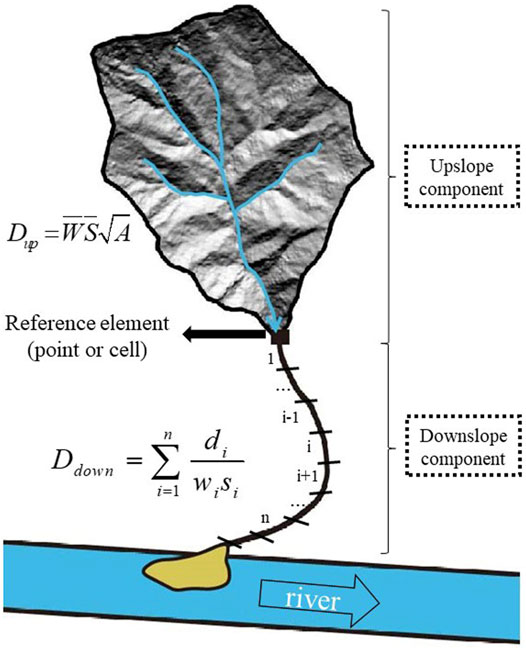
FIGURE 4. Definition of the sediment connectivity index (IC; Borselli et al., 2008).
Here, Dup and Ddown are the upslope and downslope components, respectively, of the connectivity in the catchment; s indicates the slope in Dup and Ddown [m/m]; A is the upslope contributing area [m2]; and w is the weighing factor for the upslope and downslope. In this paper, sediment connectivity is mainly expressed the potential sediment transfer pathway, which influenced by terrain characteristics. So that w is replaced with the roughness in this paper, which is the impedances for sediment transfer and computed as the standard deviation of the residual topography at a scale of few meters. (Cavalli et al., 2013). di is the length of each cell along the sediment transfer pathway [m]; wi is the weight of each cell, which represent the roughness in this paper; and si is the slope gradient of each cell [m/m]. IC is computed using the two slope components and is defined in the range of
4 Results
4.1 Debris Flow Sources in the Catchment
4.1.1 Amount and Distribution of Debris Flow Sources in the Catchment
According to field investigations and the remote-sensing interpretation, shallow slope failures, landslides, and loose solid accumulations in the channels are the main sources of the debris flows. Of these, slope sources, including landslides and shallow failures, can potentially increase the sediment connectivity, whereas solid materials in channels can decrease the connectivity (Zhou et al., 2022).
Landslides and collapses are the main source types on hillslopes in the headwater regions and along the main channel. These sources generally occur on steep slopes of 20–40°. An earthquake can devastate the vegetation (forest, shrub, and grass) on the original slopes and increase the slope surface runoff, which can increase the slope erosion. The surface runoff may deeply cut the slope surface and form a channel on the slope, transferring material from the upper slope to the toe of the slope. In addition, an earthquake may cause multiple cracks on the heads of hillslopes, which increases the potential for post-earthquake landslides. These types of slope failures increase the sediment connectivity from the slopes to the channels.
There are several types of channel materials. For example, deposits from coseismic landslides may accumulate in the channels and increase the roughness. Shallow slope deposits on both sides of the channels may partially block the channels and increase their curvature. Compared with natural landslides, individual deposits may be smaller in amount but occur in larger numbers. Shallow rills formed on the slopes also contribute materials to debris flows during rainstorms. These accumulations greatly raise the channel bed; for example, the field survey indicated that the main channel was uniformly raised by approximately 3 m after the debris flow in 2013. Accumulations also change the slope gradient and increase the impedance for debris flows, which decreases the sediment connectivity in the channels.
To quantify the amount of source materials, remote-sensing images were used to analyze the distribution and areas of the slope sources. Then, Eqs 2, 3 (Larsen et al., 2010; Li et al., 2014) were used to calculate the volumes of the loose solid materials on the slopes and in the channel, respectively.
In Eq. 2, V is volume of the landslide on the slope; A is area of the landslide; α is the intercept, and
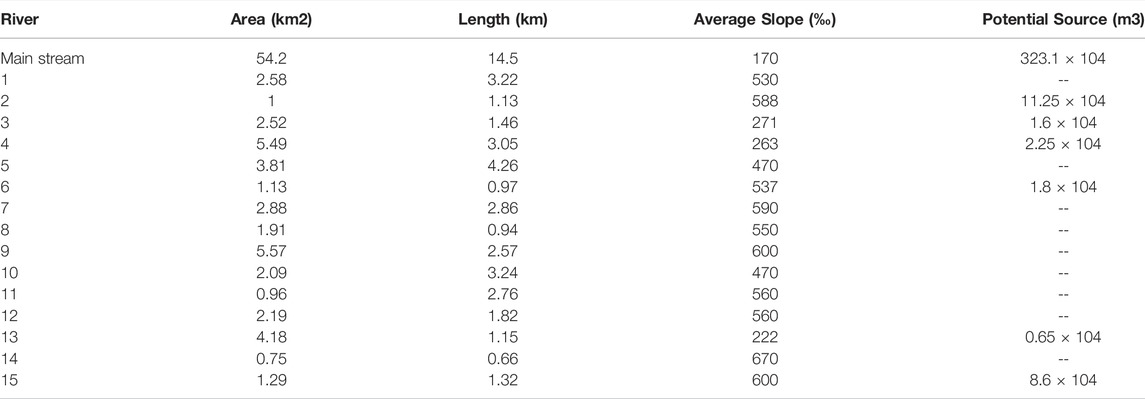
The calculated amounts of loose materials in the catchment are listed in Table 1. Shortly after the earthquake in 2008, the loose materials were primarily distributed in the tributaries in the middle part of the catchment; this may reflect the close proximity of this region to the active fault (Figure 1). The amounts of potential solid materials in tributaries 2, 3, and 4, all of which have areas of approximately 1 km2 on the right-hand side of the main channel, were found to be 11.25 × 10⁴ m3, 1.6 × 10⁴ m3, and 2.25 × 10⁴ m3, respectively. Tributary 15 contributed the largest amount of material sources on the left-hand side of the main channel and is also close to the fault. The total volume of material sources was found to be 8.6 × 10⁴ m3 (Table 1).
4.1.2 Temporal Variations in the Debris Flow Source Material Amounts
The loose materials resulting from the Wenchuan Earthquake were transferred in the years following the earthquake. Therefore, the variation in the potential sources is of great interest. Accordingly, the spatial distribution and amounts of loose solid materials in different periods need to be determined.
The total area of landslides and collapses was 1.4 × 10⁴ m2; the volume of 1.1 × 10⁴ m3 calculated in 2000 represents the conditions prior to the earthquake (Figure 5A). The sources were primarily landslides and collapses on the hillslopes in the middle of the catchment and downstream. This amount was not sufficient to form large-scale debris flows.
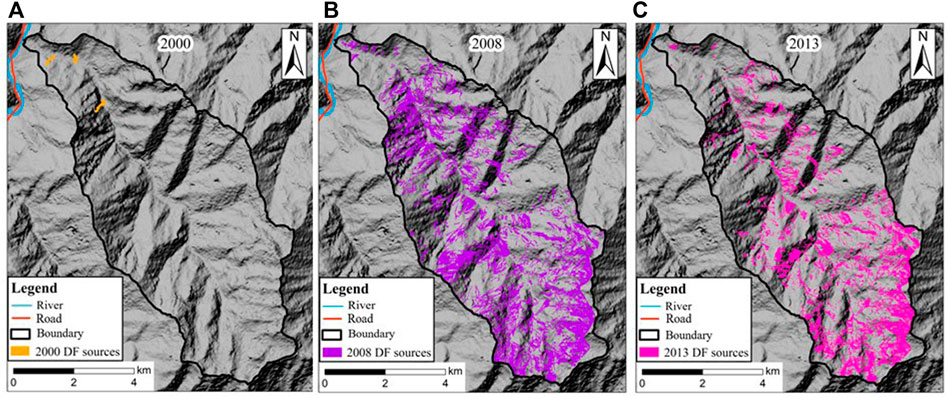
FIGURE 5. Distribution of loose source materials for debris flows. (A) Debris flow sources in 2000, prior to the 2008 Wenchuan Earthquake. (B) Debris flow sources in 2008, just after the earthquake. (C) Debris flow sources in 2013, after a catastrophic debris flow.
The 2008 Wenchuan Earthquake triggered multiple landslides on the hillslopes, which then subsequently accumulated in the channels. Therefore, the amount of source materials for debris flows increased significantly. Remote-image interpretation indicates that the earthquake triggered 983 coseismic landslides and a large amount of loose deposits in the catchment, with a total landslide area of 1307 × 104 m2, covering 24.3% of the catchment. The volumes of loose solid materials were 125.6 × 10⁶ m3 and 70.2 × 10⁶ m3 on the slopes and in the channels, respectively (Figure 5B).
The available source materials definitely increased the debris-flow frequency and scale. However, these materials were then transported out of the catchment in the form of debris flows and other fluvial mechanisms (e.g., hyper-concentration flows and debris floods). In addition, the natural vegetative recovery decreased the areas and the volumes of the landslides. In 2013, the landslide area was calculated to be 901.46 × 10⁴ m2, consisting of 603.36 × 10⁴ m2 on the hillslope and 298.1 × 10⁴ m2 in the main channel (Figure 5C). The volume of sources on the slope was 83.3 × 10⁶ m3, less than the volume in 2008, and the volume in the channel was 62.9 × 10⁶ m3, 10.4% less than the volume in 2008.
The variation in the normalized difference vegetation index (NDVI) reveals the variation in the vegetation and the landslide area in the catchment. Prior to the earthquake, areas with NDVI >0.4, representing high vegetative cover, dominated the catchment, accounting for 80% of the total area. Meanwhile, in 2008, this area decreased to 62.6% and areas with NDVI <0.2, which represents nearly bare land, accounted for 18.25% of the total area. In 2013, the area with NDVI >0.4 recovered to 72.8% and areas with NDVI <0.2 accounted for 2.3% of the total area (Figure 6).
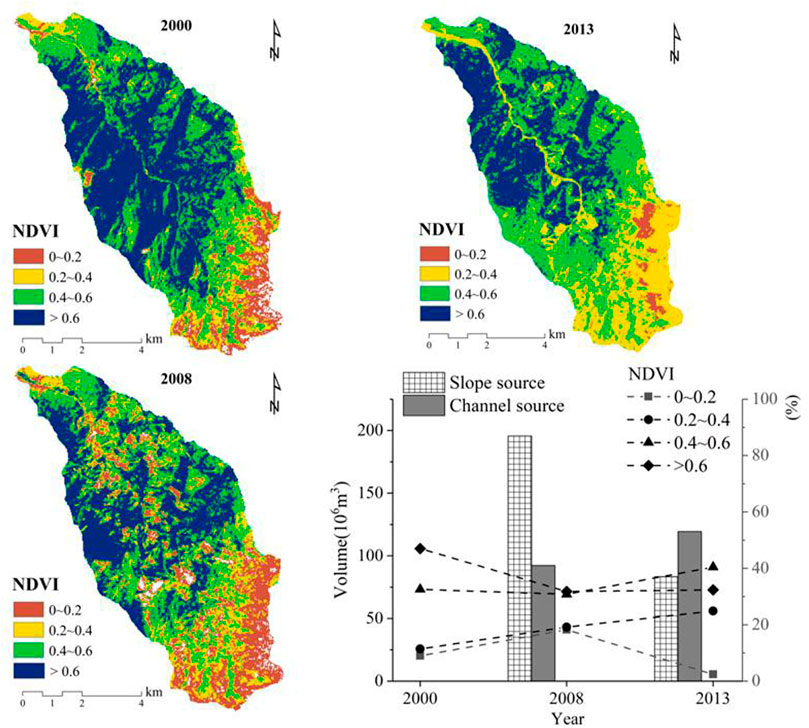
FIGURE 6. Spatio-temporal distribution of the normalized difference vegetation index (NDVI) in 2000, 2008, and 2013. Green represents areas with high vegetative cover, and red represents areas with low or no vegetative cover.
4.2 Topographic Variation in Response to the Earthquake
The local topography in the catchment also changed significantly as a result of the earthquake and the following sediment transformation activities.
As previously mentioned, debris flows in the tributaries have a significant influence on the main channel by not only suppling sediment accumulation to the main channel but also by changing the local terrain. The maximum slope in the catchment decreased from 77.2° in 2000 to 72.9° in 2010 and 69.6° in 2014. However, the area with slope >40° increased with time. The area was 139.4 × 10⁴ m2, accounting for 2.57% of the total area prior to 2000. The earthquake triggered landslides and mass movements on the slope, which caused the slope to steepen; the area with slope >40° increased to 142.3 × 10⁴ m2, accounting for 2.63% of the total area in 2008, shortly after the earthquake. This area increased further to 161.64 × 10⁴ m2, accounting for 3.0% of the total area in 2014. This can be attributed to repeated erosion events on the slopes caused by rainfall, increasing the local gradient of slope, as well as the failure of the slope toe triggered by the channel runoff, which induced additional landslide events and increased the slope gradient (Figures 7A–C).
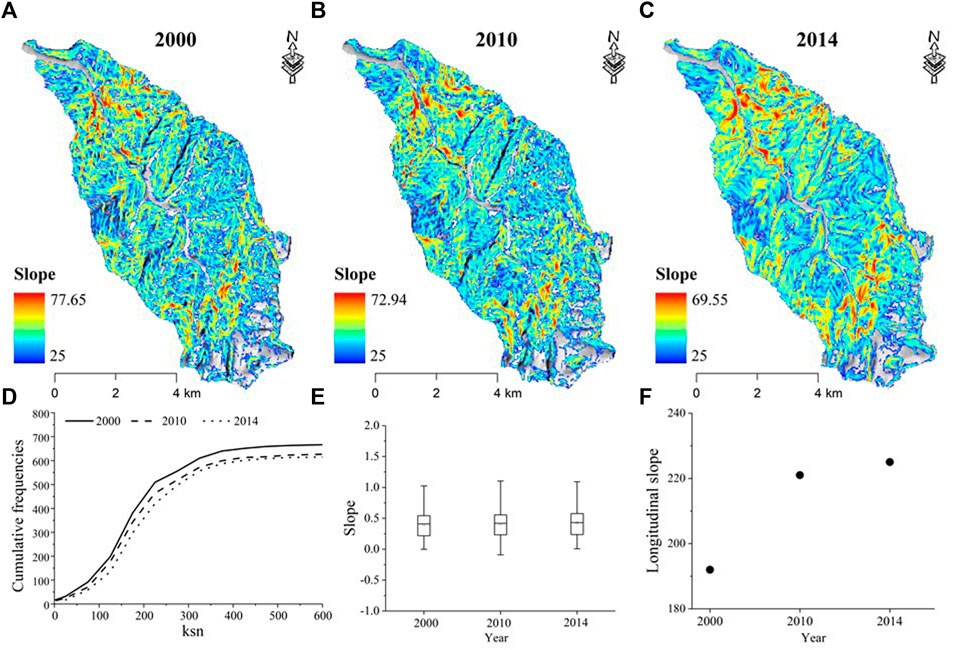
FIGURE 7. Topographic variation in response to the earthquake (A–C) Slope variation in 2000, 2008, and 2014, respectively. (D) Channel steepness index variation in the Qipangou catchment. (E) Average slope of the main channel in 2000, 2010, and 2014. (F) Main stream longitudinal slope gradient in 2000, 2010, and 2014.
The channel steepness index reflects the steepness of the entire channel profile (Trauerstein et al., 2013). Affected by the 2008 Wenchuan Earthquake, the high steepness of the main river decreased. Before and after the earthquake, the change was quick, while from 2008 to 2014, the rate of change slowed down (Figure 7D). The average slope of the main Qipangou River changed slowly (Figure 7E), and the longitudinal slope gradient of the main stream increased; this is an important factor affecting the hydrodynamic conditions in the river (Figure 7F). After the earthquake, large amounts of loose solid materials were deposited in the channel and the riverbeds that were steep prior to the earthquake were filled after the earthquake. The main river was therefore relatively gentle. However, the debris flows scrapped the channel after the earthquake, such that the average groove gradient then increased.
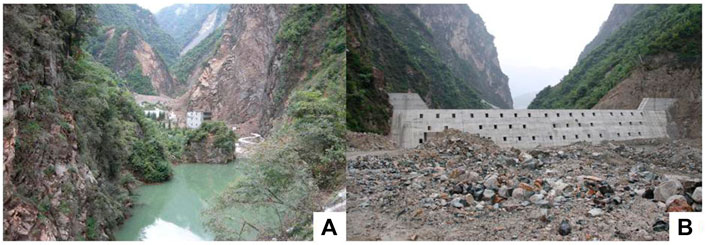
The local channel topography has also changed with time. First, the loose materials triggered by the earthquake accumulated in the channels causing the channel beds to raise. Second, the deposits of debris flows in tributary 2 blocked the main stream and generated a quake lake (Figure 8A), which suffered an outburst in 2009. In 2010, dams were built downstream, which intercepted the debris flow movements (Figure 8B). Initially, the dams decreased the smoothness of the channel, further decreasing the sediment connectivity. However, later, debris flows may fill up the dams and raise the main channel.
4.3 Spatio-Temporal Variation in the Sediment Connectivity of the Debris Flows
4.3.1 Temporal Variations in IC
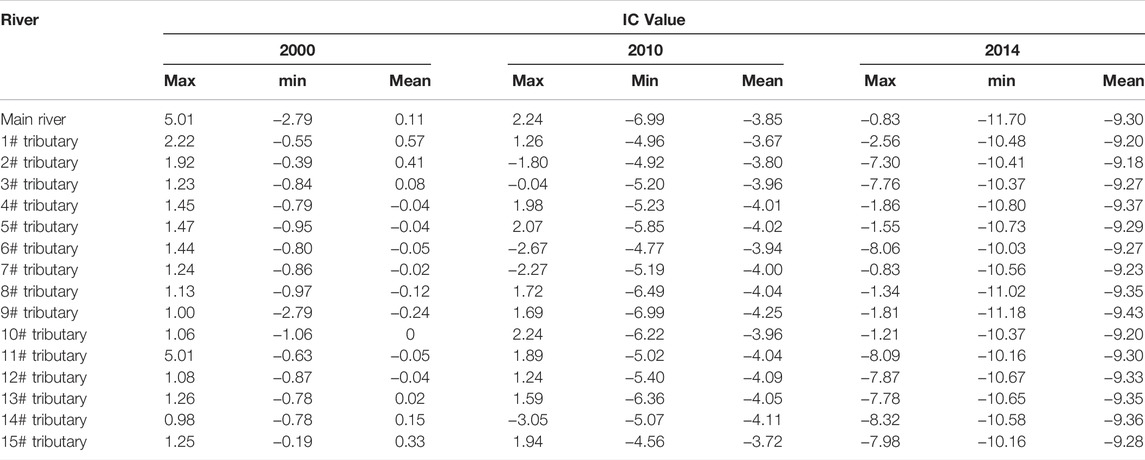
The material transformation process occurs from the slope to the channel and then to the outlet of the catchment. Therefore, topographic variations influence the sediment connectivity in this catchment. The IC values in the total catchment and in the 15 tributaries in 2000, 2010, and 2014 were calculated using Eq. 1. In each time period, the values in the 15 tributaries are found to fit a Gaussian distribution, which provides a method to obtain a mean value to represent the characteristics of the sediment connectivity of the catchment (Figure 9). The derived values are listed in Table 2.
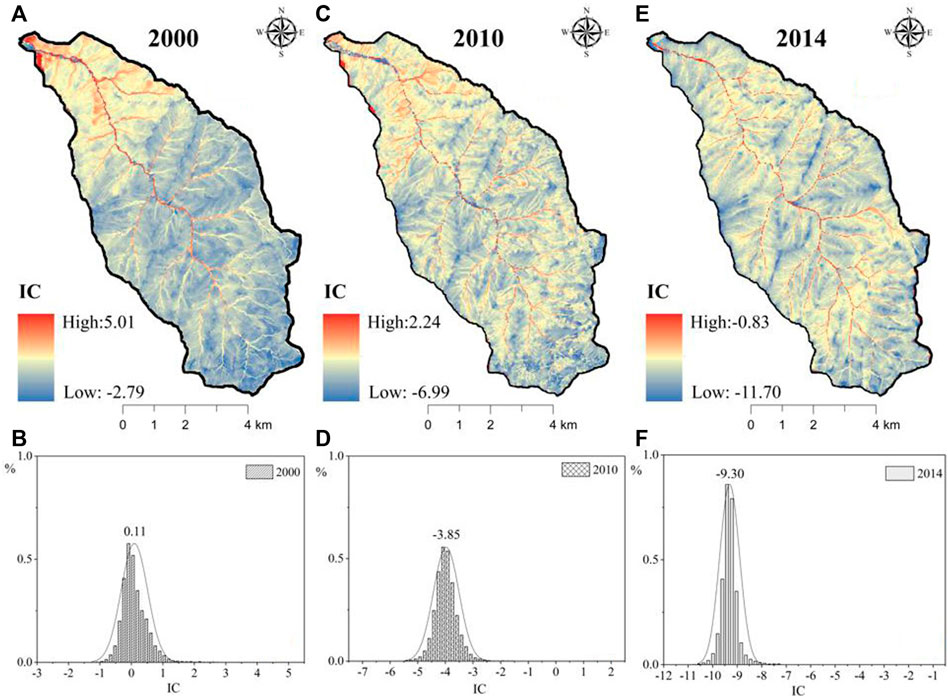
FIGURE 9. Distribution of the IC values. (A) Sediment connectivity in 2000, prior to the 2008 earthquake. (C) Sediment connectivity in 2010. (E) Sediment connectivity in 2014 (B,D,F) IC values with Gaussian distributions. The expectation values are used to describe the variation in the IC values.
The IC values ranged from −2.79 to 5.01, with a mean value of 1.11 in 2000 prior to the earthquake (Figure 9A). The high sediment connectivity regions were distributed in the downstream region of the catchment and along the runoff pathway in the channels; the mean IC value in the channel was 0.73, and that on the slope was 0.07.
In 2010, the IC values ranged from 2.24 to −6.99, with a mean value of −3.85. The mean IC values were −4.00 and −3.33 on the slopes and in the channels, respectively; both values were lower than those in 2000. This indicates that the sediment connectivity of the debris flows decreased. The IC value decreased on the hillslopes because landslides and collapses destroyed the ground cover, such that boulders were stored on the slope, increasing the impedance for sediment movement. In the channels, the IC value decreased because of the abundant materials accumulated from the landslides, collapses, and slope failures of other forms triggered by the earthquake and because the debris flow deposits from the tributaries partially blocked the main channel.
In 2014, the IC values ranged between −0.83 and −11.7, with a mean value of −9.30. The mean IC values on the slopes and in the channels were −9.31 and −9.16, respectively, both values being lower than those in 2010. On the slopes, the vegetative recovery increased the roughness, therefore decreasing the connectivity. In the channels, the decreasing values were primarily a result of the formation of debris flow dams, which significantly blocked the transportation of materials.
4.3.2 Spatial Distributions of IC
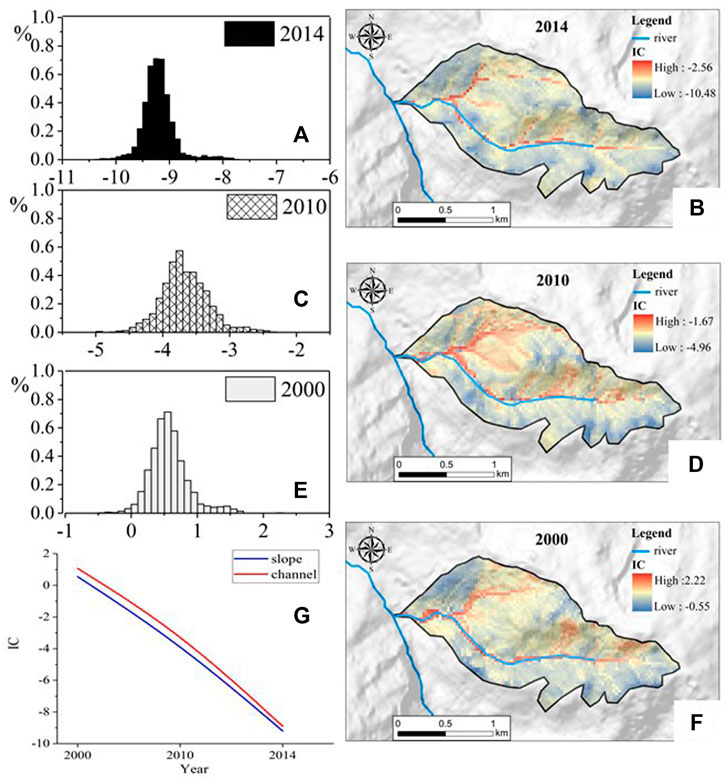
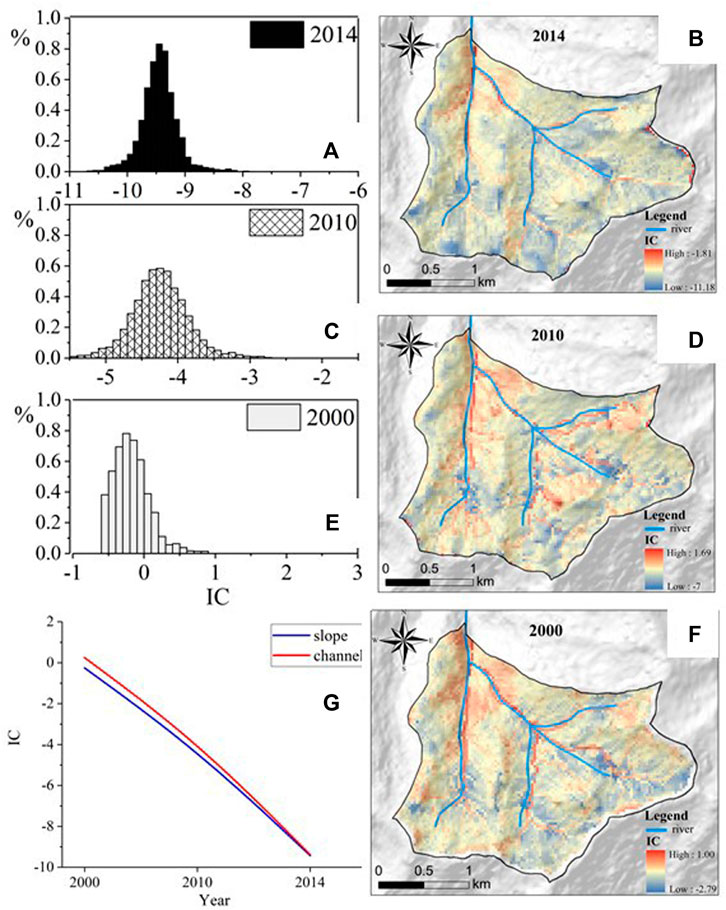
The IC value is not evenly distributed in the catchment, as shown in Figure 10. Prior to the earthquake, the IC values in the tributaries close to the catchment outlet (downstream) were higher than those in other tributaries; however, the earthquake caused the IC values to become more evenly distributed throughout the catchment. As Figure 9 shows, the standard deviation in the values in all 15 tributaries is decreasing and homogeneous after the earthquake.
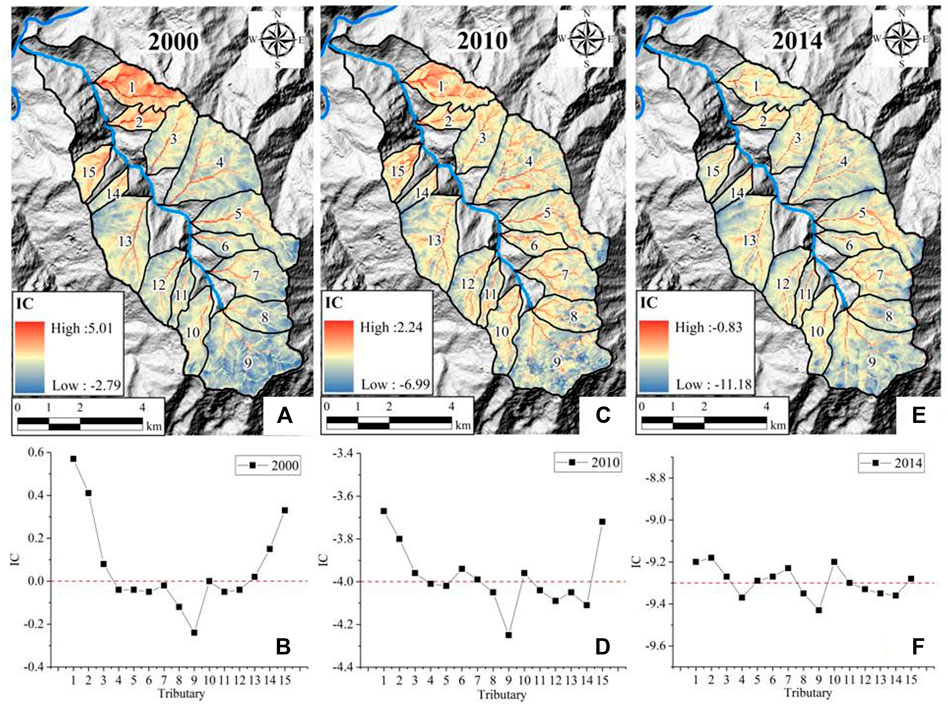
FIGURE 10. Distribution of the IC values in the 15 tributaries. (A) Sediment connectivity in 2000, prior to the 2008 Wenchuan Earthquake. (B) Mean IC values of the 15 tributaries in 2000. (C) Sediment connectivity in 2010. (D) Mean IC values of the 15 tributaries in 2010. (E) Sediment connectivity in 2014. (F) Mean IC values of the 15 tributaries in 2014.
Tributaries 1 and 9, which are located in the downstream and upper stream regions of the catchment, respectively, are taken as examples (Figures 11, 12). Prior to the earthquake, the mean IC value in tributary 1 was 0.57; this decreased to −3.67 and −9.20 in 2010 and 2014 (Figures 11A–F), respectively. In tributary 9, the mean value in 2000 was 0.57; this decreased to −4.25 and −9.43 in 2010 and 2014 (Figures 12A–F), respectively. The values decreased temporally in both tributaries after the earthquake, and the degree of the decrease in tributary 1 was much higher than that in tributary 9 (4.42 and 4.01, respectively) (Figures 11G, 12G). This indicates that the earthquake affected the connectivity unevenly throughout the catchment.
As shown in Table 3, the IC values in the main channel are constantly higher than those on the slopes, both before and after the earthquake, indicating that it is easier to transport sediment in the channels than on the slopes.
In each tributary, the IC values decreased both on the slope and in the channel. For example, the mean value decreased from 0.07 in 2000 to −4.00 in 2010 and to −9.31 in 2014 on the slopes, while in the channels, the IC value decreased from 0.73 to −3.33 and then to −9.16. This decrease reflects the effects of landslides and collapses on the slopes and the blocking effect of the abundant loose materials, which increased the roughness in the channels from 2000 to 2010. Meanwhile, in the following years, the deceases in the IC values occurred because of vegetative recovery on the slopes and the building of dams in the channels; similar processes occurred throughout the entire catchment. In some tributaries, such as tributary 9, even though there were no dams built, the IC value decreased in the channel because the mean gradient was smoother and sediment deposition occurred in the channel bed raising the main channel of the catchment.
The earthquake affected the connectivity in the channels more than that on the slopes. In tributary 1, the mean channel and slope IC values were 1.07 and 0.55, respectively, in 2000 prior to the earthquake, showing an evident difference; however, the mean IC values of the two regions were later much closer, −2.98 and −3.69, respectively, in 2010 and −8.90 and −9.20, respectively, in 2014. This indicates that the earthquake caused the connectivity to become more even in each tributary. Even though the overall IC decrease in tributary 9 is 9.19, which is lower than the value of 9.77 in tributary 1, the connectivity became more even during the same period (Figures 11, 12).
5 Discussion
The time scale over which an earthquake affects debris flows is an issue of great interest (Guo et al., 2016; Fan et al., 2019b). Previous studies examined the temporal variations in post-earthquake debris flow activity primarily by analyzing the variation in the material amounts and via actual monitoring (Fan et al., 2019a; Guo et al., 2021). In this study, we examined this issue from the perspective of the loose solid materials distribution and the sediment transfer conditions to explain the spatio-temporal variation in the debris flow activity in response to an earthquake. Despite the influences of the amount of movable materials, the triggering rainfall and/or runoff conditions, and the composition of the soil particles, the topographic conditions of the slopes and channels and the sediment connectivity also considerably influenced the debris flows.
Earthquakes change the local landscape and vegetation, which affect the sediment distribution and debris flow movement. However, it is also interesting to compare the distribution of the landslides and collapses with the distribution of the sediment connectivity in the catchment, even though no significant general similarities were observed in this study, that is, the areas with landslides and collapses do not necessarily correspond to the areas with high IC values. In most cases, conversely, the channels accumulating abundant loose solid materials have higher values and, with decreasing amounts of loose solid materials, the sediment connectivity decreases (Figure 13) as does the debris flow activity. The sediment connectivity also influences the frequency of the debris flows.
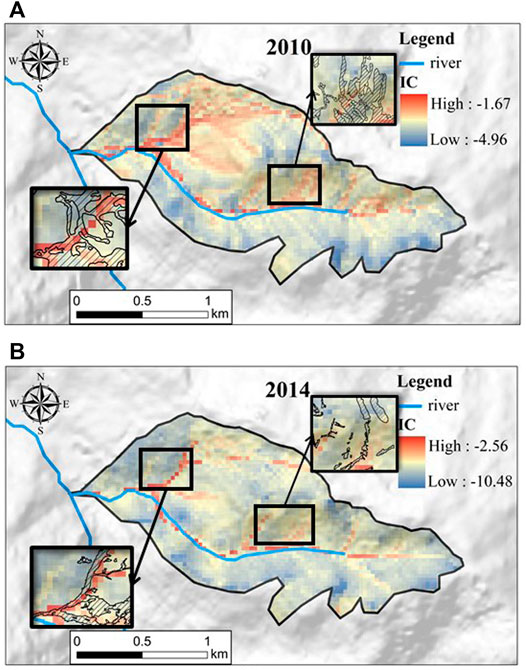
FIGURE 13. Comparing the distribution of landslides and collapses with the distribution of the sediment connectivity in tributary 1 in (A) 2010 and (B) 2014. In 2010, the distribution of landslides and collapses is consistent with distribution of high IC values. In 2014, the areas of landslide and collapses are decreasing, as are the areas with high IC values.
The loose solid materials and sediment connectivity are two main factors which influenced the debris flows activity. In this work, we consider the mount of sediment and its transfer pathway to represent debris flows activity affected by the earthquake, which gives a new method for debris flows activity in respond to an earthquake. This is simple and easy to compute. But, limiting by the data, some details are imperfect, they need to be improved in the future.
6 Conclusion
Debris flow activity is linked to the loose solid material conditions and sediment transfer capacity in a catchment. In this study, we used the IC to evaluate the sediment transfer capacity and, combining this with an analysis of the material amount variations, assessed the debris flow activity in a typical catchment affected by the 2008 Wenchuan Earthquake.
The earthquake triggered the significant generation of loose materials in the catchment. Prior to the earthquake, loose materials constituted an area of only 1.1 × 10⁴ m3 and were unevenly distributed throughout the catchment. However, this area increased to 195.8 × 10⁶ m3 in 2008 and then decreased to 146.2 × 10⁶ m3 in 2013, indicating a tendency of the amount of loose material to increase as a result of an earthquake and then gradually decrease.
The local topography, including the slope and channel gradient, varied as a result of the effect of the earthquake and the manual debris flow-control works. This resulted in variations in the sediment connectivity in the catchment. Prior to the earthquake in 2000, the mean value of the sediment connectivity was 1.11, which was favorable to sediment transfer. However, the 2008 Wenchuan Earthquake changed the terrain and the sediment connectivity in the Qipangou valley. After the earthquake, the sediment connectivity decreased. The mean values of the sediment connectivity were −3.85 in 2010 and −9.30 in 2014, both of which are lower than the mean value prior to the earthquake.
The debris flow activity is influenced by changes in sources volume and sediment connectivity. From 2008 to the present, the activity of debris flows in Qipangou valley was increasing firstly and then decreasing. At first, tremendous mounts of loose solid materials controlled the activity of debris flows mainly. Only very weak sediment connectivity was required, the debris flows were happened. Subsequently, the debris flows transferred lots of sources from upslopes and deposited in the channels. So that the sediment connectivity in the channel decreased more than that on the hillslopes and the values in the downstream regions had a higher variation than those in the upstream regions. Ultimately, the debris flow activity decreased because of the variations in the loose materials and the sediment connectivity. Accordingly, this study provides a new insight into evaluations of debris flow activity.
Data Availability Statement
The original contributions presented in the study are included in the article/Supplementary Material, further inquiries can be directed to the corresponding author.
Author Contributions
YL, write this paper KH, guildance XZ, programming LN, data analysis HL, data analysis, XH, guildance.
Funding
This study is supported by the Second Tibetan Plateau Scientific Expedition and Research Program (2019QZKK0902), the National Natural Science Foundation of China (41790434), and K.C. Wong Education Foundation.
Conflict of Interest
The authors declare that the research was conducted in the absence of any commercial or financial relationships that could be construed as a potential conflict of interest.
Publisher’s Note
All claims expressed in this article are solely those of the authors and do not necessarily represent those of their affiliated organizations, or those of the publisher, the editors and the reviewers. Any product that may be evaluated in this article, or claim that may be made by its manufacturer, is not guaranteed or endorsed by the publisher.
References
Abatti, B. H., Zanandrea, F., Rodolfo Paul, L., and Michel, G. P. (2021). Relationship between Sediment Connectivity and Debris Flow in a Mountain Catchment. Vienna, Austria: EGU.
Borselli, L., Cassi, P., and Torri, D. (2008). Prolegomena to Sediment and Flow Connectivity in the Landscape: A GIS and Field Numerical Assessment. Catena 75 (3), 268–277. doi:10.1016/j.catena.2008.07.006
Bracken, L. J., Turnbull, L., Wainwright, J., and Bogaart, P. (2015). Sediment Connectivity: a Framework for Understanding Sediment Transfer at Multiple Scales. Earth Surf. Process. Landforms 40 (2), 177–188. doi:10.1002/esp.3635
Cavalli, M., Trevisani, S., Comiti, F., and Marchi, L. (2013). Geomorphometric Assessment of Spatial Sediment Connectivity in Small Alpine Catchments. Geomorphology 188, 31–41. doi:10.1016/j.geomorph.2012.05.007
Cossart, É., and Fressard, M. (2017). Assessment of Structural Sediment Connectivity within Catchments: Insights from Graph Theory. Earth Surf. Dynam. 5 (2), 253–268. doi:10.5194/esurf-5-253-2017
Crema, S., and Cavalli, M. (2018). SedInConnect: a Stand-Alone, Free and Open Source Tool for the Assessment of Sediment Connectivity. Comput. Geosciences 111, 39–45. doi:10.1016/j.cageo.2017.10.009
Cui, P., Zhu, Y.-y., Han, Y.-s., Chen, X.-q., and Zhuang, J.-q. (2009). The 12 May Wenchuan Earthquake-Induced Landslide Lakes: Distribution and Preliminary Risk Evaluation. Landslides 6 (3), 209–223. doi:10.1007/s10346-009-0160-9
Dadson, S. J., Hovius, N., Chen, H., Dade, W. B., Lin, J.-C., Hsu, M.-L., et al. (2004). Earthquake-triggered Increase in Sediment Delivery from an Active Mountain Belt. Geol 32 (8), 733. doi:10.1130/g20639.1
Fan, X., Scaringi, G., Domènech, G., Yang, F., Guo, X., Dai, L., et al. (2019a). Two Multi-Temporal Datasets that Track the Enhanced Landsliding after the 2008 Wenchuan Earthquake. Earth Syst. Sci. Data 11 (1), 35–55. doi:10.5194/essd-11-35-2019
Fan, X., Scaringi, G., Korup, O., West, A. J., Westen, C. J., Tanyas, H., et al. (2019b). Earthquake‐Induced Chains of Geologic Hazards: Patterns, Mechanisms, and Impacts. Rev. Geophys. 57 (2), 421–503. doi:10.1029/2018rg000626
Foerster, S., Wilczok, C., Brosinsky, A., and Segl, K. (2014). Assessment of Sediment Connectivity from Vegetation Cover and Topography Using Remotely Sensed Data in a Dryland Catchment in the Spanish Pyrenees. J. Soils Sediments 14 (12), 1982–2000. doi:10.1007/s11368-014-0992-3
Guo, X., Cui, P., Chen, X., Li, Y., Zhang, J., and Sun, Y. (2021). Estimation of Discharges of Water Flows and Debris Floods in a Small Watershed. Earth Surf. Process. Landforms 46 (3), 642–658. doi:10.1002/esp.5053
Guo, X., Cui, P., Li, Y., Ma, L., Ge, Y., and Mahoney, W. B. (2016). Intensity-duration Threshold of Rainfall-Triggered Debris Flows in the Wenchuan Earthquake Affected Area, China. Geomorphology 253, 208–216. doi:10.1016/j.geomorph.2015.10.009
Guo, X., Cui, P., Li, Y., Zhang, J., Ma, L., and Mahoney, W. B. (2015). Spatial Features of Debris Flows and Their Rainfall Thresholds in the Wenchuan Earthquake-Affected Area. Landslides 13 (5), 1215–1229. doi:10.1007/s10346-015-0608-z
Heckmann, T., and Vericat, D. (2018). Computing Spatially Distributed Sediment Delivery Ratios: Inferring Functional Sediment Connectivity from Repeat High-Resolution Digital Elevation Models. Earth Surf. Process. Landforms 43 (7), 1547–1554. doi:10.1002/esp.4334
Hoffmann, T. (2015). Sediment Residence Time and Connectivity in Non-equilibrium and Transient Geomorphic Systems. Earth-Science Rev. 150, 609–627. doi:10.1016/j.earscirev.2015.07.008
Hu, X.-d., Hu, K.-h., Zhang, X.-p., Wei, L., and Tang, J.-b. (2019). Quantitative Assessment of the Impact of Earthquake-Induced Geohazards on Natural Landscapes in Jiuzhaigou Valley. J. Mt. Sci. 16 (2), 441–452. doi:10.1007/s11629-018-5240-7
Larsen, I. J., Montgomery, D. R., and Korup, O. (2010). Landslide Erosion Controlled by Hillslope Material. Nat. Geosci. 3 (4), 247–251. doi:10.1038/ngeo776
Li, G., West, A. J., Densmore, A. L., Jin, Z., Parker, R. N., and Hilton, R. G. (2014). Seismic Mountain Building: Landslides Associated with the 2008 Wenchuan Earthquake in the Context of a Generalized Model for Earthquake Volume Balance. Geochem. Geophys. Geosyst. 15 (4), 833–844. doi:10.1002/2013gc005067
Lisenby, P. E., and Fryirs, K. A. (2017). 'Out with the Old?' Why Coarse Spatial Datasets Are Still Useful for Catchment‐scale Investigations of Sediment (Dis)connectivity. Earth Surf. Process. Landforms 42 (10), 1588–1596. doi:10.1002/esp.4131
Michaelides, K., and Chappell, A. (2009). Connectivity as a Concept for Characterising Hydrological Behaviour. Hydrol. Process. 23 (3), 517–522. doi:10.1002/hyp.7214
Najafi, S., Dragovich, D., Heckmann, T., and Sadeghi, S. H. (2021). Sediment Connectivity Concepts and Approaches. Catena 196, 104880. doi:10.1016/j.catena.2020.104880
Parker, R. N., Densmore, A. L., Rosser, N. J., de Michele, M., Li, Y., Huang, R., et al. (2011). Mass Wasting Triggered by the 2008 Wenchuan Earthquake Is Greater Than Orogenic Growth. Nat. Geosci. 4 (7), 449–452. doi:10.1038/ngeo1154
Pearce, A. J., and Watson, A. (1983). Medium-term Effects of Two Landsliding Episodes on Channel Storage of Sediment. Earth Surf. Process. Landforms 8, 29–39. doi:10.1002/esp.3290080104
Pearce, A. J., and Watson, A. J. (1986). Effects of Earthquake-Induced Landslides on Sediment Budget and Transport over a 50-yr Period. Geology 14 (1), 52–55. doi:10.1130/0091-7613(1986)14<52:eoelos>2.0.co;2
Pearson, S. G., Prooijen, B. C., Elias, E. P. L., Vitousek, S., and Wang, Z. B. (2020). Sediment Connectivity: A Framework for Analyzing Coastal Sediment Transport Pathways. J. Geophys. Res. Earth Surf. 125 (10). doi:10.1029/2020jf005595
Sadeghi, S. H., Najafi, S., and Bakhtiari, A. R. (2017). Sediment Contribution from Different Geologic Formations and Land Uses in an Iranian Small Watershed, Case Study. Int. J. Sediment Res. 32 (2), 210–220. doi:10.1016/j.ijsrc.2017.02.002
Tang, C., Zhu, J., Li, W. L., and Liang, J. T. (2009). Rainfall-triggered Debris Flows Following the Wenchuan Earthquake. Bull. Eng. Geol. Environ. 68 (2), 187–194. doi:10.1007/s10064-009-0201-6
Trauerstein, M., Norton, K. P., Preusser, F., and Schlunegger, F. (2013). Climatic Imprint on Landscape Morphology in the Western Escarpment of the Andes. Geomorphology 194, 76–83. doi:10.1016/j.geomorph.2013.04.015
Wainwright, J., Turnbull, L., Ibrahim, T. G., Lexartza-Artza, I., Thornton, S. F., and Brazier, R. E. (2011). Linking Environmental Régimes, Space and Time: Interpretations of Structural and Functional Connectivity. Geomorphology 126 (3-4), 387–404. doi:10.1016/j.geomorph.2010.07.027
Zanandrea, F., Michel, G. P., Kobiyama, M., and Cardozo, G. L. (2019). Evaluation of Different DTMs in Sediment Connectivity Determination in the Mascarada River Watershed, Southern Brazil. Geomorphology 332, 80–87. doi:10.1016/j.geomorph.2019.02.005
Zanandrea, F., Michel, G. P., Kobiyama, M., Censi, G., and Abatti, B. H. (2021). Spatial-temporal Assessment of Water and Sediment Connectivity through a Modified Connectivity Index in a Subtropical Mountainous Catchment. Catena 204, 105380. doi:10.1016/j.catena.2021.105380
Keywords: debris-flow activity, sediment connectivity, material source, Wenchuan Earthquake, geomorphometry
Citation: Li Y, Hu K, Zhang X, Hu X, Ning L and Li H (2022) Assessment of Debris Flow Activity in Response to an Earthquake Using the Sediment Connectivity Index. Front. Earth Sci. 10:921706. doi: 10.3389/feart.2022.921706
Received: 16 April 2022; Accepted: 30 May 2022;
Published: 17 June 2022.
Edited by:
Wen Zhang, Jilin University, ChinaCopyright © 2022 Li, Hu, Zhang, Hu, Ning and Li. This is an open-access article distributed under the terms of the Creative Commons Attribution License (CC BY). The use, distribution or reproduction in other forums is permitted, provided the original author(s) and the copyright owner(s) are credited and that the original publication in this journal is cited, in accordance with accepted academic practice. No use, distribution or reproduction is permitted which does not comply with these terms.
*Correspondence: Kaiheng Hu, a2hodUBpbWRlLmFjLmNu
 Yanji Li
 Kaiheng Hu
 Xiaopeng Zhang1,2
 Xudong Hu