- 1State Key Laboratory of Cryospheric Science, Northwest Institute of Eco-Environment and Resources, Chinese Academy of Sciences, Lanzhou, China
- 2State Key Laboratory of Satellite Ocean Environment Dynamics, Second Institute of Oceanography, Ministry of Natural Resources, Southern Marine Science and Engineering Guangdong Laboratory (Zhuhai), Hangzhou, China
- 3College of Resources and Environment, University of Chinese Academy of Sciences, Beijing, China
- 4State Key Laboratory of Earth Surface Processes and Resource Ecology, Beijing Normal University, Beijing, China
Variations in annual accumulated snowfall over the Antarctic ice sheet have a significant and direct impact on mean sea-level change. The interannual variability of the precipitation over coastal Antarctica adjacent to the southern Indian Ocean (SIO) cannot be totally explained by the dominant mode of atmospheric variability in the Southern Hemisphere. This study explores the possible contributions from sea surface temperature (SST) anomalies in SIO on the precipitation over East Antarctica. The results suggest that the winter precipitation in the Lambert Glacier basin (LGB) is closely related to the autumn SST variability in SIO without the influence of El Niño–Southern Oscillation. It is shown that the positive autumn SIO dipole (SIOD) of SST anomalies is usually followed by reduced precipitation in the following winter over the LGB region and vice versa. The positive (negative) autumn SIOD can persist into the winter and excite cyclonic (anticyclonic) circulation and deepen (weaken) SIO low in high latitude, corresponding to an enhanced northward (southward) wind anomaly in LGB and central SIO. This mechanism prevents (promotes) the transportation of warm and moist marine air to the LGB region and hence decreases (increases) the precipitation during the following winter.
1 Introduction
Global sea levels are rising, mainly due to warmer water taking up more space and increased melting of glaciers and ice sheets. The mass balance of the ice sheet surface affects the global sea level directly and indirectly through its contribution to freshwater storage on the ice sheet surface and increased ice flow to the ocean. Changes in the mass balance of the Antarctic ice sheet, mainly caused by differences between snow accumulation rates and ice loss, are an important driver of climate change and sea-level rise. Due to the extremely low atmospheric moisture content and low local moisture flux from the ice sheet surface, the formation of precipitation over the Antarctic ice sheet mainly relies on water vapor transport from the surrounding oceans (Tietäväinen and Vihma, 2008) and the mid- to low-latitudes of the Southern Hemisphere. The water vapor falls to the surface of the ice sheet as solid precipitation due to low temperatures. Although some recent studies have found that rainfall occurs in the Antarctic Peninsula region (Han et al., 2018; Yang et al., 2021), precipitation type in the continental and coastal regions of East Antarctica remains in snowfall (Yang et al., 2021). Snowfall is the primary input to the Antarctic ice sheet, and its variability and change have an impact on the ice sheet mass balance and, therefore, have important implications for the sea level on both short- and long-term time scales (Wingham et al., 2006; Shepherd and Wingham, 2007; Medley and Thomas, 2019). Evidence from observing and modeling suggests that the Antarctic ice sheet surface mass balance increases in a warm climate due to increased precipitation as snowfall (Van Wessem et al., 2014; Frieler et al., 2015; Zwally et al., 2015; Lenaerts et al., 2016; Medley and Thomas, 2019). Proxy reconstructions further suggested that increases in snow accumulation rates since 1901 have slowed the 20th century sea-level rise by ∼10 mm (Medley and Thomas, 2019), with the increase in snowfall occurring mainly in the Antarctic Peninsula and the Princess Elizabeth Land region in East Antarctica since the mid-20th century (Ding et al., 2017; Yang and Xiao, 2018; Medley and Thomas, 2019).
The increase in snowfall on the Antarctic Peninsula was linked to atmospheric warming and Southern Annular Mode, associated with the location of the Amundsen Sea low, with rising temperatures increasing the moisture content of the atmosphere (Medley and Thomas, 2019; Ding et al., 2020). Krinner et al. (2014) suggested that while changes in atmospheric circulation have a large impact on Antarctic precipitation, thermodynamic processes associated with Southern Ocean warming will play a more important role in the projected increase in Antarctic precipitation. Wang et al. (2020) showed that the sea surface temperature (SST) changes around Antarctica influence the precipitation stem both from the thermodynamic impact on the source of moisture and from the dynamics of the different internal variability of its patterns. From the perspective of the teleconnection between the tropical and Antarctic, accumulated evidence has shown that the El Niño–Southern Oscillation (ENSO) events, SST anomalies in the southern Pacific Ocean, modulate the variability of seasonal precipitation (Zhang et al., 2021) and rain or snow days (Ding et al., 2020) in the high latitudes of the Southern Hemisphere by altering the surface-pressure distribution and moisture transport (Cullather et al., 1996; Sasgen et al., 2010) on the interannual time scales (Ding et al., 2020; Zhang et al., 2021).
The previous studies have focused on precipitation anomalies in the Antarctic Peninsula and West Antarctic ice sheet. However, precipitation changes in East Antarctica have received limited attention, and the mechanisms are not clear yet. Recent studies reported that the southern Indian Ocean (SIO) and South Atlantic play a dominant role in winter precipitation over East Antarctica (Wang et al., 2020). Zhang et al. (2021) showed that the interannual precipitation in the East Antarctic ice sheet was negatively correlated with ENSO events, which contradicts the views of Bromwich et al. (2000), and the latter showed an insignificant effect from ENSO on the precipitation in East Antarctica. Yu et al. (2018) also reported that the annual precipitation at the Progress Station showed no significant relationship with the Southern Annular Mode, ENSO, and zonal wave 3 indices. Little attention has been paid on the influences of SST variations in the Southern Ocean on the precipitation over the adjacent East Antarctic continent. Here, we investigate a possible dynamic linkage between the SST anomalies in the SIO and the changes in precipitation over coastal East Antarctica. The objective of this study is organized as follows: the datasets and methodology are described in Section 2. The relationship between the SST in SIO and precipitation in East Antarctica is discussed in Section 3. The circulation and moisture transport anomalies related to the anomalous SST are also presented to support in detail the physical mechanisms responsible for this relationship. Finally, the main conclusions are summarized and outstanding issues are presented in Section 4.
2 Data and methodology
2.1 Datasets
The data used in this study involved total precipitation, zonal and meridional wind, geopotential height, mean sea level pressure (MSLP), specific humidity, vertical velocity, and SST from 1979 to 2019. The monthly data of precipitation and atmospheric variables with a resolution of 0.25 × 0.25 were obtained from the European Centre for Medium-Range Weather Forecasts (ECMWF) reanalysis (ERA5; Hersbach et al., 2020: https://cds.climate.copernicus.eu/#!/search?text=ERA5&type=dataset). The monthly mean SST data were extracted from the NOAA Extended Reconstructed SST (ERSST) version 3b (ERSST v3b) dataset (Smith et al., 2008) gridded at 2.0 × 2.0 (https://psl.noaa.gov/data/gridded/data.noaa.ersst.v3.html). Four additional SST datasets derived from ERSST v4 (Huang et al., 2015), ERSST v5 (Huang et al., 2017), HadISST (Rayner et al., 2003), and COBE SST2 (Hirahara et al., 2014) were also used to verify the analysis. Even though the regional bias existed between the different datasets due to insufficient in situ measurements in the Southern Ocean (Huang et al., 2018), most of them showed good consistency (not shown). All datasets performed in high agreement with autumn, but ERSST v5 had a visible difference from the other datasets in winter. ERSST v3b was ultimately selected because it showed the most significant coupling of SST and precipitation in both seasons and had a high agreement with other datasets. The variability of the El Niño–Southern Oscillation (ENSO) is described by the Niño 3.4 index which is available at https://www.cpc.ncep.noaa.gov/data/indices/ersst5.nino.mth.91-20.ascii. To calculate anomalies, the climatology of 1979–2019 was removed from the original series. The autumn (March, April, and May) and winter (June, July, and August) refer to the austral seasons in this study.
2.2 Methods
We employed the singular value decomposition (SVD; Bretherton et al., 1992) analysis to identify covariability of spatial associations between SST anomaly (SSTA) patterns over the SIO (30°–80°S and 30°–120°E) and precipitation anomalies over adjacent Antarctica (60°–80°S and 50°–100°E) for the 41-year period from 1979 to 2019. This statistical technique can identify pairs of spatial patterns with the maximum temporal covariance between precipitation and SST. More details about the SVD method can be seen in Bretherton et al. (1992) and Wallace et al. (1992).
The correlation analysis methods were applied to explore the possible physical mechanism. Two-tailed Student’s t-test with the appropriate number of degrees of freedom (
where
To exclude the signal of the ENSO on the linkage between the SST in SIO and the precipitation over East Antarctica, the partial correlation is employed. For two variables
Before SVD and correlation analyses, we first removed the linear trend from 1979 to 2019 in all data to eliminate the impact of long-term trends and focus on the interannual variations.
3 Results
3.1 Coupled connection between the austral autumn sea surface temperature anomaly pattern in the southern Indian Ocean and winter precipitation in the Lambert Glacier basin
Figure 1 presents the loading vectors for the first leading mode of detrended autumn SSTA in the SIO and winter precipitation pattern in East Antarctica from 50°E∼100°E longitudes. It can explain 71.33% of the total covariance meaning that there is a clear covariability between the two fields on an interannual time scale. There is a positive SSTA in the mid-latitude of western SIO and a negative SSTA in the south-eastern SIO in the austral autumn, which is characterized by a dipole-like structure. In the following winter, the precipitation field displays a significant negative correlation with the SSTA pattern, which covers the Princess Elizabeth Land and Macrobertson Land around the Lambert Glacier basin and the adjacent ocean areas (hereafter referred to as the LGB region). This suggests a tight coupling between the austral autumn SSTA in SIO and following winter snowfall in the LGB region.
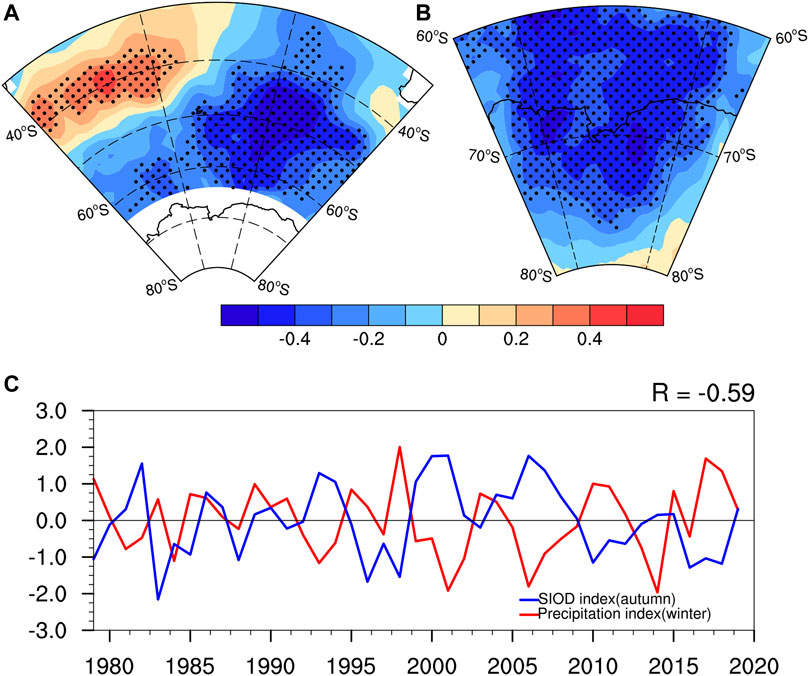
FIGURE 1. Spatial properties of the leading singular value decomposition (SVD) mode of the detrended sea surface temperature (SST) in the southern Indian Ocean (SIO) during austral autumn (March, April, and May) (A) and precipitation in the Lambert Glacier basin (LGB) during austral winter (June, July, and August) (B). The dotted areas show the correlation coefficients significant over the 90% confidence level. (C) Time series of the austral winter precipitation index in LGB (red line) and autumn southern Indian Ocean dipole (SIOD) index (blue line) from 1979 to 2019.
The leading mode time series obtained by the SVD analysis presents a strong interannual variability (Figure 1C). In this study, the first expansion coefficient of SSTA was normalized and defined as the autumn SIOD index (Figure 1C, blue line). The normalized average precipitation anomaly for the LGB region is defined as the winter precipitation index (Figure 1C, red line). Correlation analysis suggests that the winter precipitation index in LGB is significantly correlated with the autumn SIOD index (r= −0.59, over the 99% confidence level) (Figure 1C; Table 1). The tight coupling between the SIOD and precipitation implies that the austral autumn dipole-like SSTA pattern in the SIO may be a crucial factor influencing the following winter precipitation variability in the LGB region.

TABLE 1. Correlation coefficients between the detrended indices of winter precipitation in the LGB region and SIOD. Values in brackets indicate the partial correlation coefficient excluding the ENSO signal.
3.2 Mechanism of how autumn southern Indian Ocean dipole affects the winter precipitation in the Lambert Glacier basin
3.2.1 Persistence of the influence of the austral autumn southern Indian Ocean dipole
We further investigate the physical processes that might be responsible for the linkage between autumn SIOD and winter LGB precipitation. The results from SVD analysis between the winter SST and winter precipitation show a similar dipole-like pattern of SSTA over the western Indian Ocean and south-eastern SIO (Figure 2). The leading mode of SVD explains more than 51.07% of the total covariance. From autumn to winter, the warm center of SSTA over the western SIO extends northward and the cold center over the south-eastern SIO extends eastward (Figure 2A). Correspondingly, the precipitation in the LGB region still displays a significant negative correlation with this SSTA pattern, and the anomaly center extends from the coast to inland (Figure 2B). The correlation map between the winter SSTA and autumn SIOD index also shows a prominent dipole-like pattern with out-of-phase variations in the SSTA (Figure 3A). The first expansion coefficient of the SSTA field from winter SVD analysis is further normalized and defined as the winter SIOD index, which shows a close relationship with the autumn SIOD index (r = 0.43, over the 99% confidence level) and winter LGB precipitation index (r = −0.47, over the 99% confidence level) (Table 1). This is probably contributed by the “memory” characteristics of SST that persist the anomalous signal over a long period and impact the climate in the following season through the atmosphere–ocean interaction (Li 2016).
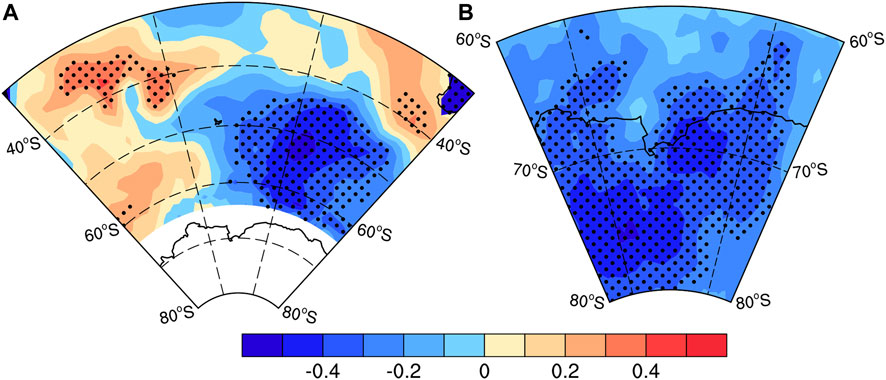
FIGURE 2. Spatial properties of the leading SVD mode of the detrended SST in SIO (A) and precipitation in LGB (B) during the winter season from 1979 to 2019.
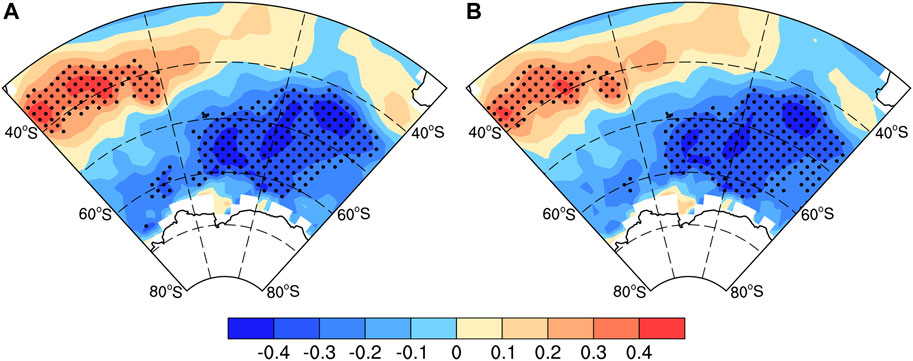
FIGURE 3. (A) Correlation map between the detrended autumn SIOD index and winter SSTA from 1979 to 2019. (B) Partial correlation map between the detrended autumn SIOD index and winter SSTA excluding the ENSO signal. The dotted areas show the correlation coefficients significant over the 90% confidence level.
Further analysis demonstrated that the correlation coefficient between the autumn SIOD index and winter LGB precipitation index reduced from −0.59 to −0.49 when the winter SST index signal was excluded by the partial correlation analysis. The correlation coefficient between the winter SIOD index and winter LGB precipitation index reduced from −0.47 (significant over the 99% confidence level) to −0.3 (significant at the 90% confidence level) when the autumn SIOD index signal was excluded. The results implied that the autumn SSTA signal is critical and can be prolonged into the following winter via the oceanic memory, and the winter SSTA is the “bridge” that links cross-seasonal propagation of the autumn SSTA signal.
Earlier studies indicated that ENSO has the potential to modulate the climate over East Antarctica (Li et al., 2015; Zhang et al., 2021). We further conducted the partial correlation analysis to investigate the individual effect of SSTA by eliminating the linear effect of the Niño 3.4 index during 1979–2019. The correlation patterns between the autumn SIOD index and winter SSTA (Figure 3B), and both season SIOD indices and winter precipitation (Figure 4) are still robust after removing the ENSO signal. This suggests that the autumn SSTA could greatly affect the variability of winter SST and LGB precipitation even in the year with the strong ENSO signal. It was verified by the significant correlation coefficients between the indices after removal of the ENSO signal (Table 1). The correlation coefficient between the time series of the SIOD index and precipitation index can still be up to −0.58 (over the 99% confidence level, Table 1). The aforementioned results confirm the stable contribution of SIOD in SIO and the weak modulation of ENSO in the linkage between SIOD and precipitation over the LGB region. Thus, it is inferred that the SSTA in SIO is a more important factor that influences the interannual changes in winter precipitation over LGB during 1979–2019. Therefore, the ENSO signal has been removed from the results suggested in the following sections.
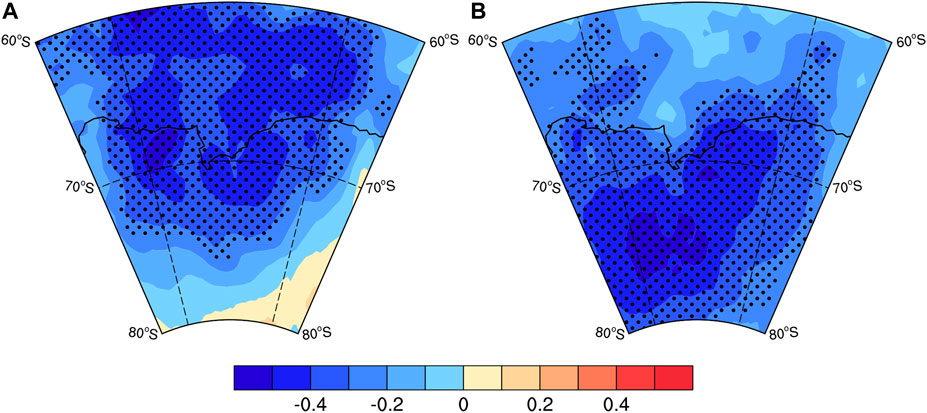
FIGURE 4. Partial correlation map between the detrended winter precipitation anomalies and autumn SIOD index (A) and winter SIOD index (B) excluding the ENSO signal during 1979–2019. The dotted areas show the correlation coefficients significant over the 90% confidence level.
3.2.2 Atmospheric response to the southern Indian Ocean dipole in austral winter
The glacial air mass over the Antarctic inland is very dry, and the marine air intrusions from the surrounding Southern Ocean into Antarctica play a key role in East Antarctic precipitation (Kurita et al., 2016). In this process, large-scale atmospheric circulation anomalies and the coastal cyclones are thought to directly affect the poleward moisture transport. Next, we investigate the physical process responsible for the influence of the winter SIOD on the winter precipitation in the LGB region.
As shown in Figures 2 and 3, the SIOD performs a meridional seesaw pattern, which can increase the meridional SST gradient, having the potential to modulate the local baroclinicity, stimulate the eddy activity, and regulate the westerlies jet and meridional circulation (Marshall and Connolley, 2006; Liu et al., 2015; Liu et al., 2020) in the high latitudes over the Southern Hemisphere. The response of the circulation to the extratropical thermal forcing associated with the SIOD can extend to Antarctic coastal and inland areas in terms of atmospheric rivers (Gorodetskaya et al., 2014).
Figure 5A reveals that the positive SIOD causes the strengthened westerlies throughout the troposphere and lower stratosphere between 40°–55°S, relating to the enhanced mid-latitude jet. Accompanying with the positive SIOD, anomalous air rising (sinking) in high (mid-) latitudes (Figure 5B) will increase local baroclinicity and enhance cyclogenesis (Marshall and Connolley, 2006). The 500 hPa geopotential height is characterized by positive anomalies in mid-latitudes and negative anomalies in high latitudes of SIO (Figure 6A). The MSLP anomalies show an almost identical spatial pattern, but the location of the negative center shifts eastward (Figure 6B) compared to 500 hPa anomalies. The negative MSLP anomaly across 55°–70°S and 90°–120°E was previously used to consider SIO low, a quasi-stationary climatological feature located to the north of Prydz Bay (Xiao et al., 2005; Yang et al., 2019). The SIO low is likely a part of the large zonal-wavenumber-three circulation pattern that affects the surface winds and meridional heat transport across the Southern Ocean (Raphael, 2004; Raphael, 2007; Eayrs et al., 2021). The aforementioned analysis suggests that the positive SIOD tends to enhance the cyclogenesis in high latitudes and deepen the SIO low.
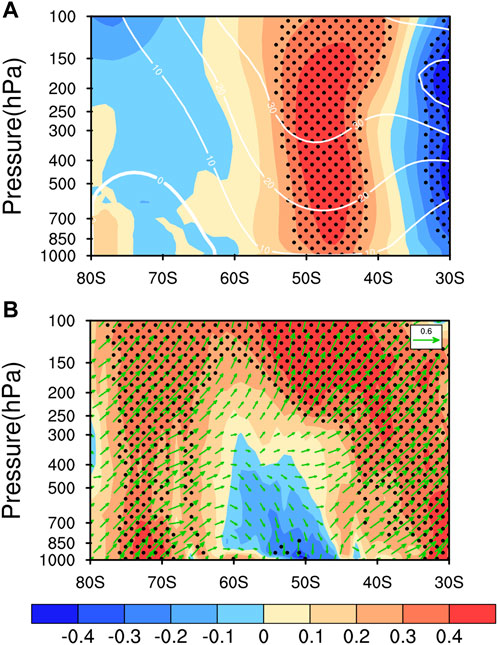
FIGURE 5. Partial correlation map between the detrended winter SIOD index and winter zonal wind (A), vertical velocity (shading), and vertical wind (vectors) (B) averaged over 30°–120°E without the ENSO signal from 1979 to 2019. The dotted areas show the correlation coefficients significant over the 90% confidence level. The white contours represent the climatology of wind in winter.
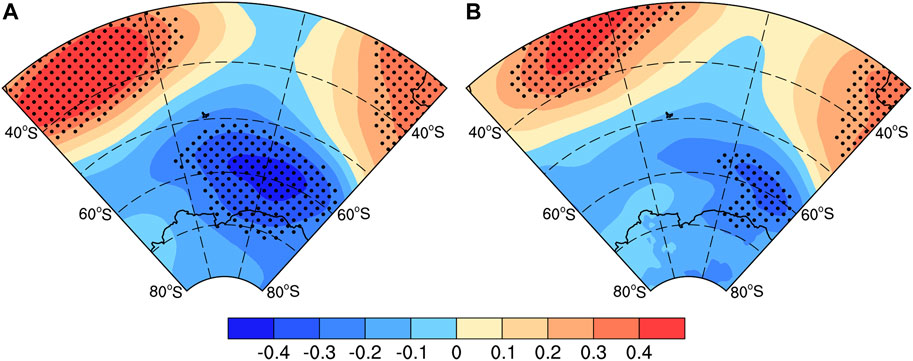
FIGURE 6. Partial correlation maps between the detrended winter SIOD index and winter geopotential height at 500 hPa (A) and mean sea-level pressure (B) without the ENSO signal from 1979 to 2019. The dotted areas show the correlation coefficients significant over the 90% confidence level.
Figure 7A confirms that the dipole pattern of the SSTA in SIO excites the generation of local eddy activity and creates a seesaw pattern in the circulation fields. In detail, a positive SIOD favors an anomalous anticyclonic circulation over mid-latitudes of SIO and an anomalous cyclonic circulation from 60°–120°E over the high latitudes of SIO. The cyclonic circulation associated with the strengthened SIO low induces an anomalous northward air flow on the western flank (50°–90°E) and southward air flow on the eastern flank (110°–120°E) of the SIO low. Generally, southward/northward winds associated with cyclonic circulation tend to transport/prevent marine moisture to Antarctica (Xiao et al., 2005; Kurita et al., 2016; Yu et al., 2018; Wang et al., 2020; Yang et al., 2021). Figure 7B further verifies that the positive (negative) phase of SIOD corresponds to the northward (southward) transport of the moisture flux in LGB. In this region, anomalous northward air flow could strengthen the local katabatic wind which favors more frequent dry and cold wind from the inland and prevents incursions of warm and wet air mass from the mid-latitudes of SIO to the coastal region. In contrast, the negative SIOD pattern prefers to transport warm and wet marine air to the LGB region. Therefore, the configuration of anomalous atmospheric circulation and moisture transport induced by the winter positive (negative) SIOD decreases (increases) winter snowfall in the LGB region.
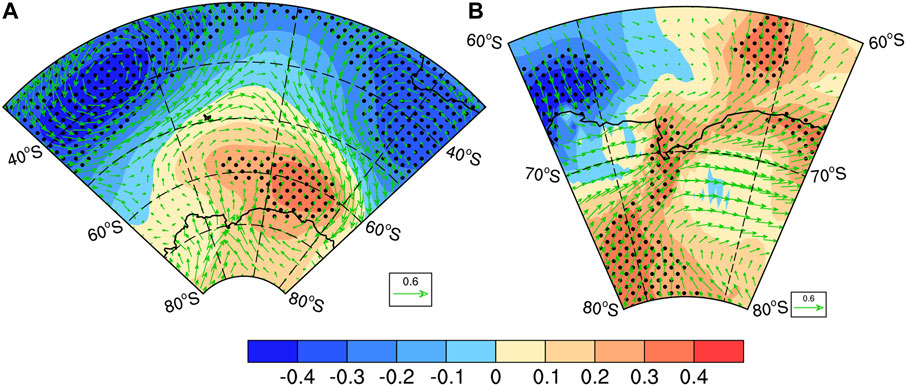
FIGURE 7. Partial correlation map between the detrended winter SIOD index and winter stream (shading) and horizontal wind (vectors) (A), meridional moisture flux (shading), and horizontal moisture transport (vectors) (B) at 850 hPa without the ENSO signal from 1979 to 2019. The dotted areas show the correlation coefficients significant over the 90% confidence level.
The results indicate that the winter SIOD could excite the atmospheric circulation anomalies to generate anomalous meridional wind over SIO and East Antarctica. The strengthened northerly (southerly) winds may conduce to suppress the moisture transport from open water to the East Antarctic continent, determining the winter snowfall amount in LGB.
4 Conclusion
In this work, we have investigated the influence of the austral autumn SST anomalies in SIO on the winter precipitation over the LGB region in East Antarctica. Positive (negative) SIOD in autumn is usually associated with decreased (increased) winter snowfall in the LGB region. The possible mechanism of the cross-seasonal impact can be explained by the “coupled oceanic–atmospheric bridge” process (Nan and Li 2005a; Nan and Li 2005b; Liu et al., 2015; Liu et al. 2016; Liu et al. 2018; Li et al., 2019; Liu et al., 2020; Liu et al., 2021) in the SIO. The results suggest that the SIOD serves as a “memorizer” to preserve the information of the autumn SSTA and prolong it into the winter season, a process that relies on the large thermal inertia of the ocean. Also, the positive (negative) winter SIOD can induce anomalous eddy activity and anomalous meridional wind in high latitude over SIO, which favors the development of cyclonic (anticyclonic) circulation and deepening (weakening) of SIO low in the high-latitude SIO. The anomalous northward (southward) air flow on the western flank of the SIO low tends to prevent (transport) marine moisture from mid-latitude SIO and eventually results in decreased (increased) snowfall in the LGB region in winter. Thus, the SIOD acts as an “ocean bridge,” and the responsive atmospheric circulation in the mid-high SIO acts as an “atmospheric bridge,” which allows the cross-seasonal propagation of autumn SIOD to influence the LGB precipitation during the following winter.
Such teleconnection and cross-seasonal influences of the ocean and atmosphere signals from the SIO provide an additional source of predictability for the East Antarctic climate, especially for the LGB region. This study suggests that the autumn SIOD provides a source of prediction for the forecast of winter precipitation in the LGB region. However, how to build a prediction model based on the autumn SIOD and improve the skill of the prediction of winter precipitation in East Antarctica are still a problem and therefore need further study. Few studies (Zhang et al., 2021) suggested that ENSO has a significant effect on surface mass balance in the East Antarctic ice sheet, but our results suggest that the effect of ENSO on winter snowfall in the LGB region is not significant which agrees with Bromwich et al. (2000) and Yu et al. (2018). This is probably due to the huge area and complex topography of the East Antarctic region. Future studies should therefore investigate the relative contributions of SIOD and ENSO to climate variability in different regions of the Antarctic continent through model simulations to provide more insights into Antarctic climate predictability.
Data availability statement
Publicly available datasets were analyzed in this study. These data can be found at: ERA5 reanalysis data can be downloaded from https://cds.climate.copernicus.eu/#!/search?text=ERA5&type=dataset. The NOAA Extended Reconstructed SST (ERSST) version 5 (ERSST v5) dataset can be downloaded from https://psl.noaa.gov/data/gridded/data.noaa.ersst.v5.html. The time series of the Niño 3.4 index can be found at https://www.cpc.ncep.noaa.gov/data/indices/ersst5.nino.mth.91-20.ascii.
Author contributions
JY and TL contributed to the conception of the study; JY performed the data analyses and wrote the manuscript; and TL, TD, and CX helped with the discussion and revision.
Funding
This study was funded by the Strategic Priority Research Program of the Chinese Academy of Sciences (Grant No. XDA19070103), the National Natural Science Foundation of China (42101142), the Scientific Research Fund of the Second Institute of Oceanography, MNR Resources (Grant No. QNYC2101), International Partnership Program of Chinese Academy of Sciences (Grant No. 121362KYSB20210024), the open fund of State Key Laboratory of Satellite Ocean Environment Dynamics, Second Institute of Oceanography, MNR (Grant No. QNHX2237), and the Innovation Group Project of Southern Marine Science and Engineering Guangdong Laboratory (Zhuhai) (Grant No. 311021001).
Conflict of interest
The authors declare that the research was conducted in the absence of any commercial or financial relationships that could be construed as a potential conflict of interest.
Publisher’s note
All claims expressed in this article are solely those of the authors and do not necessarily represent those of their affiliated organizations, or those of the publisher, the editors, and the reviewers. Any product that may be evaluated in this article, or claim that may be made by its manufacturer, is not guaranteed or endorsed by the publisher.
References
Bretherton, C. S., Smith, C., and Wallace, J. M. (1992). An intercomparison of methods for finding coupled patterns in climate data. J. Clim. 5 (6), 541–560. doi:10.1175/1520-0442(1992)005<0541:aiomff>2.0.co;2
Bromwich, D. H., Rogers, A. N., Kållberg, P., Cullather, R. I., White, J. W., and Kreutz, K. J. (2000). ECMWF analyses and reanalyses depiction of ENSO signal in Antarctic precipitation. J. Clim. 13 (8), 1406–1420. doi:10.1175/1520-0442(2000)013<1406:eaardo>2.0.co;2
Cullather, R. I., Bromwich, D. H., and Van Woert, M. L. (1996). Interannual variations in antarctic precipitation related to El niño‐southern oscillation. J. Geophys. Res. 101 (D14), 19109–19118. doi:10.1029/96jd01769
Ding, M., Han, W., Zhang, T., Yue, X., Fyke, J., Liu, G., et al. (2020). Towards more snow days in summer since 2001 at the great wall station, antarctic peninsula: the role of the amundsen sea low. Adv. Atmos. Sci. 37 (5), 494–504. doi:10.1007/s00376-019-9196-5
Ding, M., Xiao, W., Xiao, C., Yang, J., Zhang, D., Li, R., et al. (2017). The snowfall history of Lambert glacier basin during the past 300 years inferred from an ice core at LGB69, East Antarctica. Quat. Sci. 37 (5), 1111–1118. [in Chinese]. doi:10.11928/j.issn.1001-7410.2017.05.18
Eayrs, C., Li, X., Raphael, M. N., and Holland, D. M. (2021). Rapid decline in Antarctic sea ice in recent years hints at future change. Nat. Geosci. 14 (7), 460–464. doi:10.1038/s41561-021-00768-3
Frieler, K., Clark, P. U., He, F., Buizert, C., Reese, R., Ligtenberg, S. R., et al. (2015). Consistent evidence of increasing Antarctic accumulation with warming. Nat. Clim. Chang. 5 (4), 348–352. doi:10.1038/nclimate2574
Gorodetskaya, I. V., Tsukernik, M., Claes, K., Ralph, M. F., Neff, W. D., and Van Lipzig, N. P. M. (2014). The role of atmospheric rivers in anomalous snow accumulation in East Antarctica. Geophys. Res. Lett. 41 (1), 6199–6206. doi:10.1002/2014GL060881
Han, W., Xiao, C., Dou, T., and Ding, M. (2018). Arctic has been going through a transition from solid precipitation to liquid precipitation in spring. Chin. Sci. Bull. 63 (12), 1154–1162. [in Chinese]. doi:10.1360/n972018-00088
Hersbach, H., Bell, B., Berrisford, P., Hirahara, S., Horányi, A., Muñoz-Sabater, J., et al. (2020). The ERA5 global reanalysis. J. Royal Meteorol. Soc. 146 (730), 1999–2049.
Hirahara, S., Ishii, M., and Fukuda, Y. (2014). Centennial-scale sea surface temperature analysis and its uncertainty. J. Clim. 27 (1), 57–75. doi:10.1175/jcli-d-12-00837.1
Huang, B., Banzon, V. F., Freeman, E., Lawrimore, J., Liu, W., Peterson, T. C., et al. (2015). Extended reconstructed sea surface temperature version 4 (ERSST. v4). Part I: Upgrades and intercomparisons. J. Clim. 28 (3), 911–930. doi:10.1175/jcli-d-16-0836.1
Huang, B., Thorne, P. W., Banzon, V. F., Boyer, T., Chepurin, G., Lawrimore, J. H., et al. (2017). Extended reconstructed sea surface temperature, version 5 (ERSSTv5): upgrades, validations, and intercomparisons. J. Clim. 30 (20), 8179–8205.
Huang, B., Angel, W., Boyer, T., Cheng, L., Chepurin, G., Freeman, E., et al. (2018). Evaluating SST analyses with independent ocean profile observations. J. Climate 31 (13), 5015–5030.
Krinner, G., Largeron, C., Ménégoz, M., Agosta, C., and Brutel-Vuilmet, C. (2014). Oceanic forcing of antarctic climate change: A study using a stretched-grid atmospheric general circulation model. J. Clim. 27 (15), 5786–5800. doi:10.1175/jcli-d-13-00367.1
Kurita, N., Hirasawa, N., Koga, S., Matsushita, J., Steen-Larsen, H. C., Masson-Delmotte, V., et al. (2016). Influence of large‐scale atmospheric circulation on marine air intrusion toward the East Antarctic coast. Geophys. Res. Lett. 43 (17), 9298–9305. doi:10.1002/2016gl070246
Lenaerts, J., Vizcaino, M., Fyke, J., Van Kampenhout, L., and van den Broeke, M. R. (2016). Present-day and future Antarctic ice sheet climate and surface mass balance in the Community Earth System Model. Clim. Dyn. 47 (5), 1367–1381. doi:10.1007/s00382-015-2907-4
Li, C., Ren, J., Xiao, C., Hou, S., Ding, M., and Qin, D. (2015). A 2680-year record of sea ice extent in the Ross Sea and the associated atmospheric circulation derived from the DT401 East Antarctic ice core. Sci. China Earth Sci. 58 (11), 2090–2102. doi:10.1007/s11430-015-5125-3
Li, J. P. (2016). “Impacts of annular modes on extreme climate events over the East Asian monsoon region,” in Dynamics and predictability of large-scale, high-impact weather and climate events (Cambridge: Cambridge University Press).
Li, J., Sun, C., and Jin, F. F. (2013). NAO implicated as a predictor of Northern Hemisphere mean temperature multidecadal variability. Geophys. Res. Lett. 40 (20), 5497–5502. doi:10.1002/2013gl057877
Li, J., Zheng, F., Sun, C., Feng, J., and Wang, J. (2019). Pathways of influence of the northern Hemisphere mid-high latitudes on east asian climate: A review. Adv. Atmos. Sci. 36 (9), 902–921. doi:10.1007/s00376-019-8236-5
Liu, T., Li, J. P., Feng, J., Wang, X. F., and Li, Y. (2016). Cross-seasonal relationship between the boreal autumn SAM and winter precipitation in the northern Hemisphere in CMIP5. J. Clim. 29, 6617–6636. doi:10.1175/jcli-d-15-0708.1
Liu, T., Li, J. P., Li, Y. J., Zhao, S., Zheng, F., Zheng, J. Y., et al. (2018). Influence of the may southern annular mode on the south China sea summer monsoon. Clim. Dyn. 51, 4095–4107. doi:10.1007/s00382-017-3753-3
Liu, T., Li, J. P., Sun, C., Lian, T., and Zhang, Y. Z. (2021). Impact of the april–may SAM on central Pacific Ocean sea temperature over the following three seasons. Clim. Dyn. 57, 775–786. doi:10.1007/s00382-021-05738-4
Liu, T., Li, J. P., Wang, Q. Y., and Zhao, S. (2020). Influence of the autumn SST in the southern Pacific Ocean on winter precipitation in the north American monsoon regionfic Ocean on winter precipitation in the north American monsoon region. Atmosphere 11, 844. doi:10.3390/atmos11080844
Liu, T., Li, J. P., and Zheng, F. (2015). Influence of the boreal autumn southern annular mode on winter precipitation over land in the northern Hemisphere. J. Clim. 28, 8825–8839. doi:10.1175/jcli-d-14-00704.1
Marshall, G. J., and Connolley, W. M. (2006). Effect of changing Southern Hemisphere winter sea surface temperatures on Southern Annular Mode strength. Geophys. Res. Lett. 33 (17), L17717. doi:10.1029/2006gl026627
Medley, B., and Thomas, E. R. (2019). Increased snowfall over the Antarctic Ice Sheet mitigated twentieth-century sea-level rise. Nat. Clim. Chang. 9 (1), 34–39. doi:10.1038/s41558-018-0356-x
Nan, S. L., and Li, J. P. (2005a). The relationship between the summer precipitation in the yangtze river valley and the boreal spring southern Hemisphere annual mode: I basic facts. Acta. Meteor. Sin. 63, 837–846. [in Chinese]. doi:10.11676/qxxb2005.080
Nan, S. L., and Li, J. P. (2005b). The relationship between the summer precipitation in the yangtze river valley and the boreal spring southern Hemisphere annual mode: II the role of the Indian ocean and southern China sea as an "oceanic bridge. Acta. Meteor. Sin. 63, 847–856. [in Chinese].
Raphael, M. N. (2004). A zonal wave 3 index for the Southern Hemisphere. Geophys. Res. Lett. 31 (23). doi:10.1029/2004gl020365
Raphael, M. N. (2007). The influence of atmospheric zonal wave three on Antarctic sea ice variability. J. Geophys. Res. 112 (D12), D12112. doi:10.1029/2006jd007852
Rayner, N. A. A., Parker, D. E., Horton, E. B., Folland, C. K., Alexander, L. V., Rowell, D. P., et al. (2003). Global analyses of sea surface temperature, sea ice, and night marine air temperature since the late nineteenth century. J. Geophys. Res. 108 (D14), 4407. doi:10.1029/2002jd002670
Sasgen, I., Dobslaw, H., Martinec, Z., and Thomas, M. (2010). Satellite gravimetry observation of Antarctic snow accumulation related to ENSO. Earth Planet. Sci. Lett. 299 (3–4), 352–358. doi:10.1016/j.epsl.2010.09.015
Shepherd, A., and Wingham, D. (2007). Recent sea-level contributions of the Antarctic and Greenland ice sheets. Science 315 (5818), 1529–1532. doi:10.1126/science.1136776
Smith, T. M., Reynolds, R. W., Peterson, T. C., and Lawrimore, J. (2008). Improvements to NOAA’s historical merged land–ocean surface temperature analysis (1880–2006). J. Clim. 21 (10), 2283–2296. doi:10.1175/2007jcli2100.1
Sun, C., Li, J. P., and Jin, F. F. (2015). A delayed oscillator model for the quasi-periodic multidecadal variability of the NAO. Clim. Dyn. 45, 2083–2099. doi:10.1007/s00382-014-2459-z
Tietäväinen, H., and Vihma, T. (2008). Atmospheric moisture budget over Antarctica and the Southern Ocean based on the ERA-40 reanalysis. Int. J. Climatol. 28, 1977–1995. doi:10.1002/joc.1684
Van Wessem, J. M., Reijmer, C. H., Morlighem, M., Mouginot, J., Rignot, E., Medley, B., et al. (2014). Improved representation of East Antarctic surface mass balance in a regional atmospheric climate model. J. Glaciol. 60 (222), 761–770. doi:10.3189/2014jog14j051
Wallace, J. M., Smith, C., and Bretherton, C. S. (1992). Singular value decomposition of wintertime sea surface temperature and 500-mb height anomalies. J. Clim. 5 (6), 561–576. doi:10.1175/1520-0442(1992)005<0561:svdows>2.0.co;2
Wang, H., Fyke, J. G., Lenaerts, J., Nusbaumer, J. M., Singh, H., Noone, D., et al. (2020). Influence of sea-ice anomalies on Antarctic precipitation using source attribution in the Community Earth System Model. Cryosphere 14 (2), 429–444. doi:10.5194/tc-14-429-2020
Wingham, D. J., Shepherd, A., Muir, A., and Marshall, G. J. (2006). Mass balance of the Antarctic ice sheet. Phil. Trans. R. Soc. A 364 (1844), 1627–1635. doi:10.1098/rsta.2006.1792
Xiao, C., Qin, D., Bian, L., Zhou, X., Allison, I., and Yan, M. (2005). A precise monitoring of snow surface height in the region of Lambert Glacier basin-Amery Ice Shelf, East Antarctica. Sci. China Ser. D-Earth. Sci. 48 (1), 100–111. doi:10.1360/03yd0127
Yang, D., Ding, M., Dou, T., Han, W., Liu, W., Zhang, J., et al. (2021). On the differences in precipitation type between the arctic, Antarctica and Tibetan plateau. Front. Earth Sci. 9, 607487. doi:10.3389/feart.2021.607487
Yang, J., Du, Z., and Xiao, C. (2019). Sea salt sodium record in a shallow ice core from east Antarctica as a potential proxy of the Antarctic sea ice extent in Southern Indian Ocean. J. Ocean. Univ. China 18 (6), 1351–1359. doi:10.1007/s11802-019-4084-2
Yang, J., and Xiao, C. (2018). The evolution and volcanic forcing of the southern annular mode during the past 300 years. Int. J. Climatol. 38 (4), 1706–1717. doi:10.1002/joc.5290
Yang, J., Xiao, C., Liu, J., Li, S., and Qin, D. (2021). Variability of Antarctic sea ice extent over the past 200 years. Sci. Bulletin 66 (23), 2394–2404. doi:10.1016/j.scib.2021.07.028
Yu, L., Yang, Q., Vihma, T., Jagovkina, S., Liu, J., Sun, Q., et al. (2018). Features of extreme precipitation at progress station, Antarctica. J. Clim. 31 (22), 9087–9105. doi:10.1175/jcli-d-18-0128.1
Zhang, B., Yao, Y., Liu, L., and Yang, Y. (2021). Interannual ice mass variations over the Antarctic ice sheet from 2003 to 2017 were linked to El Niño-Southern Oscillation. Earth Planet. Sci. Lett. 560, 116796. doi:10.1016/j.epsl.2021.116796
Keywords: southern Indian Ocean, East Antarctica, sea surface temperature, precipitation, dipole pattern
Citation: Yang J, Liu T, Dou T and Xiao C (2022) Interannual variability of winter precipitation over the Lambert Glacier basin linked to the dipole pattern of sea surface temperature in the southern Indian Ocean. Front. Earth Sci. 10:920245. doi: 10.3389/feart.2022.920245
Received: 14 April 2022; Accepted: 19 August 2022;
Published: 09 September 2022.
Edited by:
Minghu Ding, Chinese Academy of Meteorological Sciences, ChinaReviewed by:
Ting Wei, China Meteorological Administration, ChinaMirong Song, Institute of Atmospheric Physics (CAS), China
Copyright © 2022 Yang, Liu, Dou and Xiao. This is an open-access article distributed under the terms of the Creative Commons Attribution License (CC BY). The use, distribution or reproduction in other forums is permitted, provided the original author(s) and the copyright owner(s) are credited and that the original publication in this journal is cited, in accordance with accepted academic practice. No use, distribution or reproduction is permitted which does not comply with these terms.
*Correspondence: Ting Liu, bGl1dEBzaW8ub3JnLmNu
 Jiao Yang
 Ting Liu
 Tingfeng Dou
 Cunde Xiao