 Jiawen Chang
 Ninglian Wang
 Zhijie Li1,2
95% of researchers rate our articles as excellent or good
Learn more about the work of our research integrity team to safeguard the quality of each article we publish.
Find out more
ORIGINAL RESEARCH article
Front. Earth Sci. , 13 June 2022
Sec. Cryospheric Sciences
Volume 10 - 2022 | https://doi.org/10.3389/feart.2022.919051
This article is part of the Research Topic Cryosphere and Climate Change in the Arctic, the Antarctic and the Tibetan Plateau View all 24 articles
Mountain glaciers are an important component of the global hydrological cycle. Existing research about glacier changes in the Altai focused on limited regions. Study about recent glacier changes in the entire Altai Mountains is still lacking. We presented a consistent method for identifying glacier margins. The two new glacier inventories in 2000 and 2020 were derived from Landsat satellite imagery. Glacier surface elevation change and mass balance were obtained by comparing the 2000 Shuttle Radar Topography Mission (SRTM) and 2020 Digital Elevation Models (DEMs) generated from Advanced Spaceborne Thermal Emission and Reflection Radiometer (ASTER) images. The spatial pattern of glacier changes was discussed in conjunction with climate trends. We mapped a total area of 1,096.06 ± 53.32 km2 around 2020, which amounts to 1,927 glaciers in the Altai Mountains. That was 12.02 ± 3.01% (or 0.60 ± 0.15%·a−1) less than the 1,245.75 ± 58.52 km2 around 2000. The geodetic mass balance of the monitoring glaciers in the Aktru basin for the period 2000–2011 was used to validate the geodetic survey. The average geodetic mass balance of -0.32 ± 0.09 m w. e.·a−1 on monitoring glaciers was slightly exaggerated than the observed mass balance of -0.26 m w. e.·a−1, but it was proved that the geodetic mass balance could reflect glacier changes in the Altai Mountains. An average mass loss of 14.55 ± 1.32 m w. e. (or 0.74 ± 0.07 m w. e.·a−1) was found during 2000–2020 in the Altai Mountains. Although the glacier area changes and mass balance were characterized by spatial heterogeneity, the glaciers in the Altai had experienced an accelerated shrinkage from 2000 to 2020 compared to the 20th century. The rising temperature is the foremost reason for glacier area shrinkage and mass loss according to the Climatic Research Unit (CRU) reanalysis data.
As an important freshwater resource and a sensitive indicator of climate change, mountain glaciers play a pivotal role in regional hydrological cycles and ecological environment (Kaser et al., 2010; Gardner et al., 2013). Glaciers collect solid precipitation in the accumulation season and release it as meltwater in the ablation season. Meltwater from glaciers provides water resources for rivers and downstream populations, especially during the dry seasons. In recent decades, nearly worldwide glacier shrinkage and mass loss have been observed (Gardner et al., 2013; Hugonnet et al., 2021). Glacier changes can induce glacier hazards such as landslides, glacier lake outburst floods, and debris flows, which affect the security of the downstream areas (Benn et al., 2012; Rankl et al., 2014; Brun et al., 2017; Yao et al., 2019). In the context of climate fluctuation, mountain glaciers have received extensive attention, and timely investigation and study of glacier changes are necessary.
For the high mountain areas which are difficult to reach, the studies on glacier areas with the help of satellite imagery have been extensively experimented and achieved good results. Glacier area change can be obtained by comparing the areas in glacier inventories of two periods. The ongoing glacier changes require the frequent update of glacier inventories to provide accurate information about glaciers. The frequent update of glacier inventories are also critical to outline environmental policies for glacier protection and monitoring programs, as well as for developing mitigation and adaptation strategies in response to the impact of climate changes on future glacier development (Pfeffer et al., 2014; Huss et al., 2017).
The Altai Mountains are one of the concentrated glacier areas in North Asia. Meltwater from glaciers in Altai supplies some rivers in North Asia, and it accounts for approximately 11% of the freshwater in Mongolia (Kamp and Pan, 2015). Many types of research, based on satellite imagery or aerial photographs, have shown glacier shrinkage in Altai over the last 50 years or longer period. According to the RCP4.5 (the Representative Concentration Pathway) and RCP8.5, by the end of this century, the shrinkage rate of glacier area in the Altai Mountains will reach 26 ± 10% and 60 ± 15%, respectively (Zhang et al., 2016). Despite the dramatic glacier changes and great interest in them, research on glacier changes focused on limited regions, leaving a gap in the systematic study on glacier changes in the entire Altai Mountains. Part of the research studied glacier changes in the Altai Mountains by country (Shi et al., 2010; Wang et al., 2013; Kamp and Pan, 2015), and some articles reported glacier changes by region (Wang et al., 2011a; Lv et al., 2012). The majority of existing research focused on glaciers in Katun (Narozhniy and Zemtsov, 2011; Kotlyakov et al., 2014), Turgen (Lehmkuhl, 1999; Tsutomu and Gombo, 2007; Lehmkuhl, 2012; Kamp et al., 2013), Tavan Bogd (Revyakin, 1986; Krumwiede et al., 2014; Ganyushkin et al., 2018), North Chuya (Narozhniy and Zemtsov, 2011; Kotlyakov et al., 2014), and Mongolia Altai (Kamp and Pan, 2015). The published research about glacier changes in the Altai Mountains can be seen in Supplementary Table S1 and Supplementary Table S2. Different methods in the overlapped regions have resulted in discrepancies in glacier changes. Glacier changes in the entire Altai Mountains cannot be analyzed due to the different times and different methods of sub-regions research.
The Randolph Glacier Inventory 6.0 (RGI 6.0) provided a glacier inventory for the entire Altai Mountains, with source data from 2006 to 2011. But the quality of RGI is variable. One of the poorest quality regions is North Asia, where explicit glacier outlines are missing in many areas (Earl and Gardner, 2016). To promote more comprehensive knowledge of the ongoing glacier changes, a complete and methodology-consistent glacier inventory is essential. Therefore, we worked on the entire Altai Mountains by 1) completing the new glacier inventory 2000 and glacier inventory 2020 with a consistent method; 2) estimating glacier area change and mass balance during 2000–2020.
The Altai Mountains (85°E-94°E, 46°N-52°N) span Russia, China, Mongolia, and Kazakhstan and are a mountain range in North Asia. It extends more than 2000 km and is usually divided into North Altai and South Altai due to its long span of latitude. The Katun massif, North Chuya massif, South Chuya massif, and Tavan Bogd massif are the concentrated areas of glaciers, and amounts of small glaciers have developed in Ikh Turgen massif, Turgen massif, Kharkhiraa massif, Tsambagarav massif, and Munkh Khairkhan massif. The glacier elevation ranges from 2000 to 4500 m. According to glacier meltwater runoff, the glaciers in the Altai Mountains are divided into three major drainage basins, namely, the Irtysh River, the Ob’ River, and the Inland River (Figure 1).
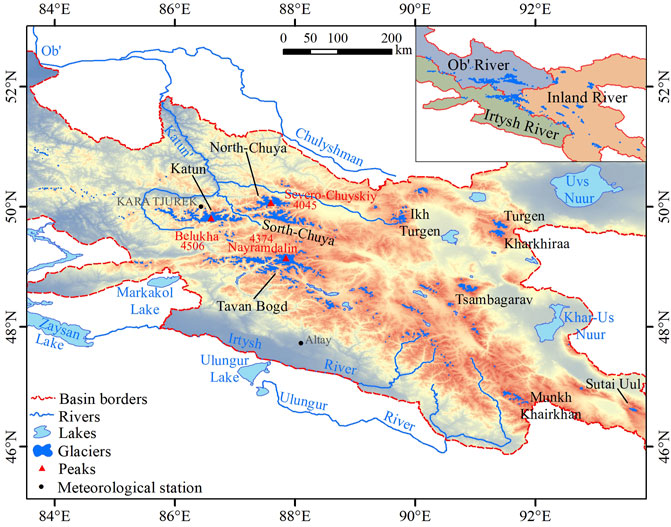
FIGURE 1. Location of glaciers in the Altai Mountains.
The weather pattern in the Altai Mountains is dominated by westerly in summer and polar air mass in winter. The westerly brings abundant precipitation from the west toward the east, and the polar air mass penetrated the Altai Mountains along the Irtysh River valley, which contributes to low temperature and snowfall. About 70% of the precipitation occurs in summer from June to August (Tsutomu and Gombo, 2007), and winter generally lasts for 5–6 months in the Altai Mountains (Shi et al., 2010). The average annual temperature ranges from -8 to 4.1°C; the annual precipitation amounts to 75–700 mm in the Altai Mountains (Tsutomu and Gombo, 2007; Yao et al., 2012). The maximum elevation of the Katun massif, North Chuya massif, and Tavan Bogd massif in the Central Altai ranges from 4045 to 4506 m, and the elevation decreases in the southeast part. The favorable conditions of topography, temperature, and precipitation in the Altai Mountains make it the glacier center in North Asia. The subcontinent glaciers in the Altai Mountains are characterized by accumulating in the cold season, ablating in the warm season, high ice temperature, and fast movement speed (Shi, 2008).
Landsat-7 Enhanced Thematic Mapper Plus (ETM+) images and Landsat-8 Operational Land Imager (OLI) images have a spatial resolution of 30 m. Landsat series images with limited snow and cloud cover at the end of the ablation season were employed to manually delineate glacier margins. All employed Landsat images were listed in Table 1. All Landsat images are downloaded from the United States Geological Survey website1 and undergone USGS radiation correction and ground control point correction.

TABLE 1. Landsat images and ASTER images.
SRTM (Shuttle Radar Topography Mission) was jointly measured by NASA (National Aeronautics and Space Administration) and NIMA (the National Survey and Mapping Agency of the Department of Defense) in February 2000 using the synthetic aperture radar repeated orbit differential interferometry method, with the horizontal accuracy of ±20 m and the vertical accuracy of ±16 m. We used a 30 m SRTM 1 Arc-Second Global elevation data to derive the geomorphometric parameters (elevation, slope, aspect, etc.), which are necessary for glacier mapping and detecting glacier surface elevation changes.
The 3N and 3B bands in the ASTER L1A images could generate DEMs by the stereo-pair method with an accuracy of 7–20 m (Iwasaki, 2011). Since the heavy clouds in ASTER images or inappropriate acquisition time, we choose 7 ASTER images with few clouds and snow in the glacierized area to generate DEMs. Comparison between geodetic mass balance and observed mass balance was performed on monitoring glaciers in the Aktru River basin using the DEM generated from an ASTER L1A image acquired in 2011. The other six ASTER images acquired around 2020 with minimal cloud and snow in the glacierized areas cover approximately 67.06% of the glacierized area and main mountain ranges in the Altai Mountains. All ASTER images were downloaded from the Earthdata website2.
The RGI6.0 (Randolph Glacier Inventory version 6.0), released by the RGI Consortium in July 2017, is a globally complete inventory of glacier outlines except for the Greenland and Antarctic ice sheets (Rgi and Nosenko, 2017). Glacier data in Altai in RGI6.0 are mainly acquired around 2006 and 2011. The RGI6.0 is freely available from GLIMS3. The SCGI (Second Chinese Glacier Inventory) includes glacier outlines in China’s Altai around 2010. It was downloaded from the Cold and Arid Regions Scientific Data Center4. GGI 18 (Global Glacier Inventory) fixes the problems that existed in GGI 15, and it was downloaded from the PANGAEA (Sakai, 2019). All the glacier inventories are used to validate glacier margins.
The World Glacier Monitoring Service (WGMS) conducts field monitoring of worldwide glaciers and reports glacier mass balance changes annually. The observed mass balances derived from WGMS were used to validate the geodetic survey. The observed mass balance of monitoring glaciers (September to August) in the Aktru basin was downloaded from the WGMS website5.
CRUv4.05 meteorological data, covering all land with a resolution of 0.5° latitude * 0.5° longitude, is a monthly data of climate elements by interpolation. CRUv4.05 meteorological data of 1981–2020 was used to analyze the climate background due to the meteorological stations are rare and far from glacierized areas in the Altai Mountains, and it was downloaded from the NOAA Physical Science Laboratory6. We compared the anomaly of average summer temperature and annual precipitation in CRU and Altai meteorological station (47.73°N, 88.08°E) to verify the availability of CRU. As shown in Figure 2, the difference in the anomaly of average summer temperature ranges from -0.83 to 1.16°C, and the difference in annual precipitation amounts from −77.84 mm to 125.83mm, indicating that the CRU can express the change tendency of temperature and precipitation accurately. The meteorological station data were downloaded from the National Centers for Environmental Information7.
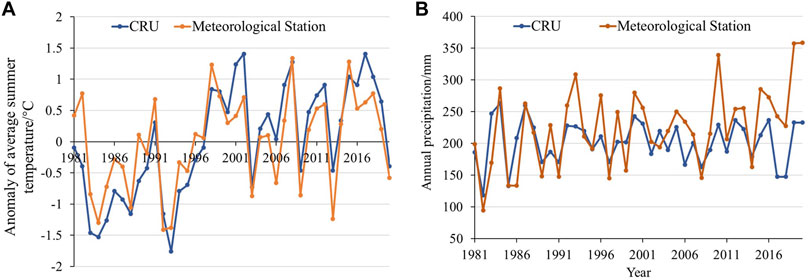
FIGURE 2. (A) Anomaly of average summer temperature in CRU and Altai meteorological station for 1981–2020. (B) Annual precipitation of CRU and Altai meteorological station for 1981–2020.
In this study, glacier margins in 2000 and 2020 were delineated manually with the criteria and approach reported by Nuimura (Nuimura et al., 2015) and Sakai (Sakai, 2019). To map glacier margins, a series of preprocessing needs to be prepared. First, we used the Gram-Schmidt spectral sharpening method in ENVI 5.1 to fuse the multispectral and panchromatic bands into the 15 m resolution images. Also, then true-color composite images (bands 3, 2, 1 as RGB for ETM+/OLI) were used to preliminarily confirm glacierized areas, and false-color composite images (bands 7, 2, 3 as RGB for ETM+/OLI) were used to delineate glacier margins. We used the same criteria and method when mapping glacier margins. We only revised and changed parts to complete 2020 glacier margins after delineating 2000 glacier margins. 'As can be seen in Figures 3A,B, the clean ice areas were easily delineated with pixel-level accuracy due to the obvious color, texture, and hue differences between the clean glacier and non-glacierized areas (Nuimura et al., 2015; Sakai, 2019). Several glaciers are covered with debris in the Altai Mountains. For debris-covered glaciers, we identified glacier margins with features such as exposed ice cliffs, small ponds, and stream outlets (Molg et al., 2018). As shown in Figures 3C,D, the high-resolution historical images in Google Earth helped to determine debris-covered glacier margins (Tielidze et al., 2020). Adjacent glaciers are divided by ridgelines. Glaciers with areas less than 0.01 km2, the recommended minimum of the WGI, are removed (Pfeffer et al., 2014). The glacier margins were defined as the Albers’ equal area projection before calculating the area.
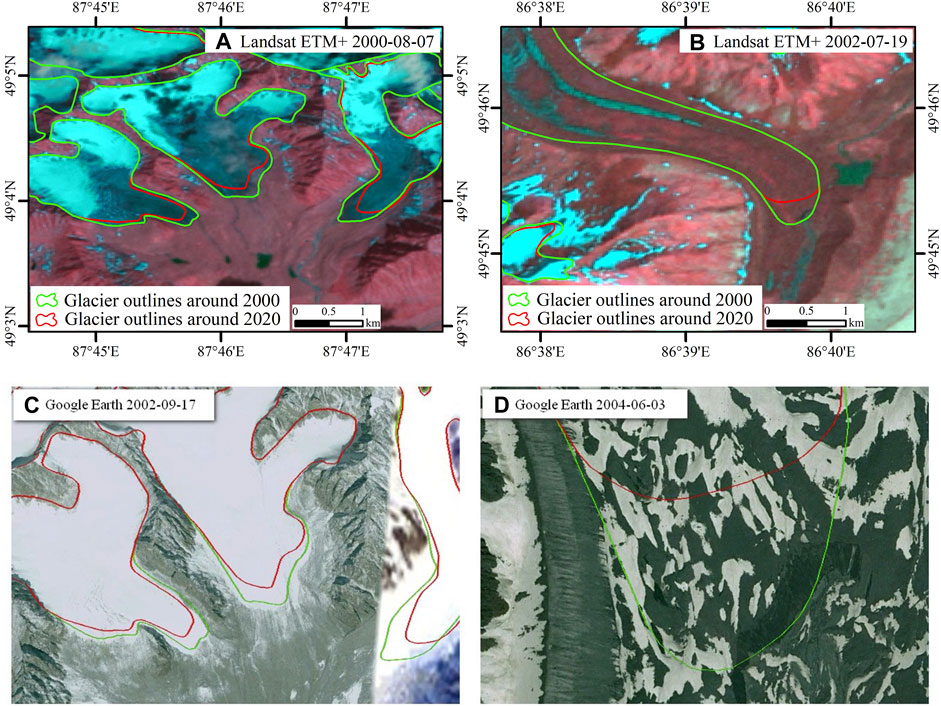
FIGURE 3. Manual delineation of glacier outlines. (A) Manual delineation of clear ice areas using false-color composite Landsat image. (B) Manual delineation of debris-covered glacier outlines using false-color composite Landsat image. (C) Google Earth image of clear ice areas. (D) Google Earth image of debris-covered glaciers.
The uncertainty of manual-delineated glacier margins is related to various factors such as the resolution of images, snow cover, clouds, and shadows (Bolch et al., 2010). The delineation uncertainty (EA) can be evaluated by counting the number of pixels passed by the glacier margins:
where N is the number of pixels passed by the glacier margins (excluding the ridgelines used to divide adjacent glaciers); λ is the resolution of images (15 m). The delineation uncertainties of Altai glaciers in 2000 and 2020 were ±58.52 km2 and ±53.32 km2, respectively, accounting for 4.70% and 4.86% of glacierized areas in 2000 and 2020, respectively.
The uncertainty of the changed glacier area for 2000–2020 (EB) is calculated as follows (Zhang et al., 2018):
where E2000 and E2020 are uncertainties in glacier areas of 2000 and 2020, respectively. We just considered the changed parts of glacier margins in the calculation due to the unchanged parts do not affect the glacier area change.
ASTER Level 1A stereoscopic images with minimal cloud and snow cover in the glacierized areas were used to generate DEMs. ENVI 5.1 provides the “DEM Extraction” tool for generating the 30 m DEMs. In the generating process, at least 80 tie points (TPs) in each sub-region were identified. The tie points distributed evenly and the density increased in the glacierized areas to improve accuracy. All DEMs were georeferenced into the co-ordinate system of WGS84/EGM96.
The elevation difference between SRTM DEM and ASTER DEMs is approximately equal to the change of glacier surface elevation during the study period, which is vital for estimating surface elevation change and mass balance. The SRTM DEM was selected as the reference DEM to assess the accuracy of ASTER DEMs. Glacier margins in 2000 were chosen to distinguish the terrain of non-glacierized areas since glacier areas have shrunk in 2020. The terrain in non-glacierized regions is basically unchanged, which is used to test the error of adjusted multi-source DEMs.
Horizontal biases caused by different spatial resolutions between multi-DEMs can be adjusted using the statistical relationship between maximum curvature and elevation differences. The vertical bias can be removed using the relationship among elevation difference, slope, and aspect in the non-glacierized areas (Nuth and Kaab, 2011). Studies have shown that the SRTM C-band penetrates ice and snow to a depth of 0–10 m (Gardelle et al., 2012; Pieczonka et al., 2013), and the penetration depth should be deeper in low temperature and thick snow (Shi, 2008). The SRTM X-Band was used to correct the penetration depth of the SRTM C-Band since both were acquired simultaneously, and the penetration depth of the SRTM X-Band was smaller. This work adopted the calculated penetration depth of 7.2 m in the Altai Mountains (Wei et al., 2015).
The errors of elevation difference in multi-source DEMs (σ) were estimated as follows:
where STDVnonglacier is the standard deviation of the elevation difference in the non-glacierized areas; N is the number of included pixels; this study choose a de-correlation length of 600 m for 30 m spatial resolution in this study (Bolch et al., 2011); SE is the standard error; and MED is the mean elevation difference in non-glacierized areas. The errors of multi-source DEMs are listed in Table 2.
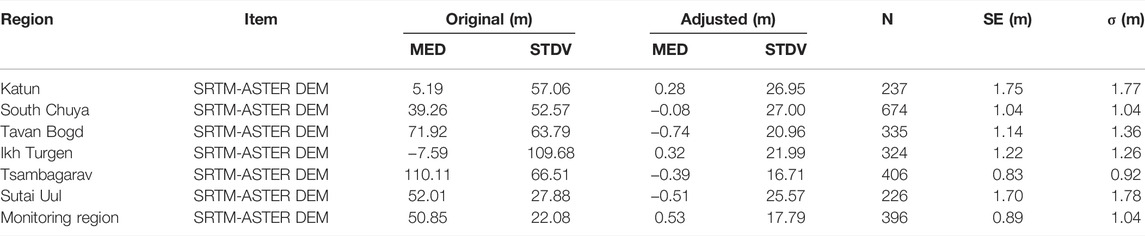
TABLE 2. Original and adjusted errors between SRTM DEM and ASTER DEMs.
Glacier mass balance (M) was estimated as follows:
where ρ is the transition density from glacier volume to mass balance; this study used the 850 kg/m−3 proposed by Huss (Huss, 2013); S is the glacier area; n is the number of pixels in glacierized areas; ∆hi is the elevation difference of a single pixel; and Si is the area of a single pixel.
The uncertainty of glacier mass balance (E) during the study period was calculated as follows:
where ∆h is the average elevation difference in glacierized areas; t is the study period; ∆ρ is the uncertainty of ice density (60 kg m−3); ρw is the water density (1000 kg m−3); and ρ1 is the conversion density (850 kg m−3).
The geodetic mass balance derived from this study is validated against the observed mass balance on Leviy Aktru (87°42′E, 50°04′N, 5.71 ± 0.15 km2), Maliy Aktru (87°45′E, 50°03′N, 2.78 ± 0.09 km2), and Vodopadniy Aktru (87°47′E, 50°03′N, 0.82 ± 0.02 km2), which are located at the north slope of North Chuya (Aktru basin). This allows evaluation of the availability and accuracy of the geodetic survey. After co-registration between multi-DEMs, the horizontal offsets of -11.0 m on the X-axis and +10.1 m on the Y-axis indicate an extremely subtle offset in the monitoring region. As can be seen in Figure 4A, the elevation difference between multi-DEMs is mainly derived from vertical residuals. In Figure 4B, the abnormal values after removing vertical bias are caused by the quality of ASTER DEMs, which cannot be eliminated. The adjusted mean elevation difference was 0.53 m in the non-glacierized area, indicating the errors in multi-DEMs were removed. The Vodopadniy Aktru has a minimum area of 0.82 ± 0.02 km2. The abnormal values account for a large proportion, which makes a large deviation against the observed mass balance. The large glacier has better co-registration and its geodetic mass balance is in good agreement with the observed mass balance.
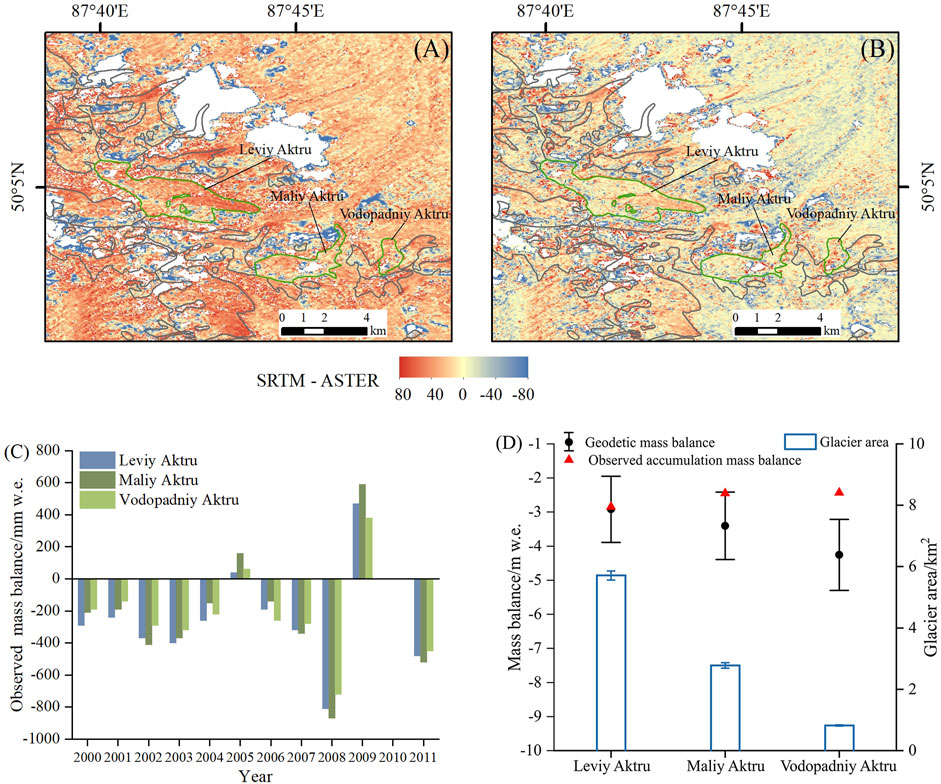
FIGURE 4. (A) Original elevation difference of monitoring region from 2000 to 2011. (B) Adjusted elevation difference of monitoring region from 2000 to 2011. The white part (null value) is over high elevation differences caused by clouds, which were removed by threshold. (C) Observed mass balance of monitoring glaciers during 2000–2011. (D) Observed accumulation mass balance and geodetic mass balance of monitoring glaciers during 2000–2011.
The observed mass balance and geodetic mass balance can be seen in Figures 4C, D. The geodetic mass balances of Leviy Aktru, Maliy Aktru, and Vodopadniy Aktru were -2.92 ± 0.97 m w. e., -3.40 ± 0.99 m w. e., and -4.26 ± 1.04 m w. e. during 2000–2011, respectively; the observed accumulation mass balances were -2.85 m w. e., -2.45 m w. e., and -2.43 m w. e. for 2000–2011, respectively. The average geodetic mass loss was 0.32 ± 0.09 m w. e.·a−1, and the average observed mass loss was 0.26 m w. e.·a−1, which indicates a slight exaggeration in geodetic mass balance. The difference in mass balances is related to observed monitoring time and method, multi-DEMs accuracy, and estimation method. Geodetic mass balances are close to observed accumulation mass balances in monitoring glaciers, especially on large glaciers. In general, the geodetic mass balance was proved that it could represent the mass change in the Altai Mountains.
Over the entire Altai Mountains, we mapped a total glacier area of 1,096.06 ± 53.32 km2 (1927 glaciers) in 2020. From this, 197.52 ± 10.37 km2 (18.02 ± 0.95%) of glacier area was mapped in the Irtysh River, 516.12 ± 25.50 km2 (47.09 ± 2.33%) in the Ob River, and 382.41 ± 17.45 km2 (34.89 ± 1.59%) in the Inland River (Supplementary Table S3).
Based on the glacier area in 2000, glaciers in 2020 were divided into eight grades (≤0.1 km2, 0.1–0.5 km2, 0.5–1 km2, 1–2 km2, 2–5 km2, 5–10 km2, 10–20 km2, and 20–50 km2). The largest number of glaciers with 0.1–0.5 km2 (815 glaciers) accounts for 42.29% of the total number of glaciers. The glaciers smaller than 0.1 km2 (645 glaciers) account for 33.47% of the total glacier number. Glaciers with a size class of 2–5 km2 (240.15 ± 7.36 km2) accounted for the largest share of total glacier area (21.91 ± 0.67%). Only 8 glaciers (146.29 ± 2.82 km2) were larger than 10 km2, accounting for 13.35 ± 0.26% of the total glacier area. About 67.94% of the glacier area was distributed within 3,000–3,800 m, and the largest percentage of glacier area (21.55%) was between 3,000–3,200, which was consistent with the height of the snow line (Xie and Liu, 2010). Most glacier numbers (1473) and glacier area (769.77 ± 39.01 km2) belong to the northeast slope (N, NE, and E). While glacier number (91) and glacier area (70.75 ± 3.24 km2) of S- and WS- orientation were much small (Figure 5).

FIGURE 5. (A) Glacier areas of different size classes in 2000 and 2020. (B) Glacier areas and the number of different aspects in 2000 and 2020. (C) Glacier areas within different altitude zones in 2000 and 2020.
From 2000 to 2020, the total glacier area in the Altai Mountains decreased from 1,245.75 ± 58.52 km2 to 1,096.06 ± 53.32 km2, with a reduced area of 149.70 ± 37.45 km2 (-12.02 ± 3.01% or -0.60 ± 0.15%·a−1). The largest reduction of glacier area occurred in the Inland River, with a reduction of 76.84 ± 17.20 km2 (-16.73 ± 3.75% or -0.84 ± 0.19%·a−1). The shrinkage rate in the Irtysh River (-0.58 ± 0.17%·a−1) was close to that of total glaciers. Glacier area changes for all drainage basins are shown in Supplementary Table S3.
Glaciers smaller than 0.1 km2 have the largest shrinkage rate (-30.99 ± 8.99% or -1.55 ± 0.45%·a−1). The shrinkage rates decreased as glacier size increased. The number of glaciers smaller than 0.1 km2 has increased by 50 from 2000 to 2020, nevertheless, the number of larger glaciers has decreased. The reduced area of 114.23 ± 28.35 km2 on the northeast slope (N, NE, and E) accounted for 76.31 ± 18.94% of the total reduced area. A small reduced area was found on S-, WS-, and W-orientation (15.36 ± 3.59 km2), with a shrinkage rate of 10.72 ± 2.51%. Glaciers below 2400 m had the largest shrinkage rate (-20.58%) due to their low elevation and sensitivity to climate change. The shrinkage rates decreased as altitude increased (Figure 5).
The grid with 0.5° latitude * 0.5° longitude was mapped with glacier margins in 2000 to visualize the spatial pattern of glacier area change. In Figure 6A, large shrinkage areas were found in Tavan Bogd, Katun, North Chuya, South Chuya, and Tsambagarav, which have large glacier areas. Also, small glaciers in the west and southeast parts had a small shrinkage area. However, in Figure 6B, the regions with large shrinkage areas have small shrinkage rates, but large shrinkage rates occurred in the regions where small glaciers clustered. The largest glacier area was near the Tavan Bogd. The glacier area decreased the most (44.42 ± 12.16 km2) while the shrinkage rate (16.93 ± 5.28%) was low. Glacier areas in Ikh Turgen and Sutai Uul in 2000 were 33.62 ± 1.89 km2 and 13.85 ± 0.42 km2, respectively, but the area shrinkage rates amount to 21.26 ± 5.33% and 26.78 ± 3.79%, respectively. Large glaciers have a larger shrinkage area but a smaller shrinkage rate, which is consistent with the law of the glacier change.
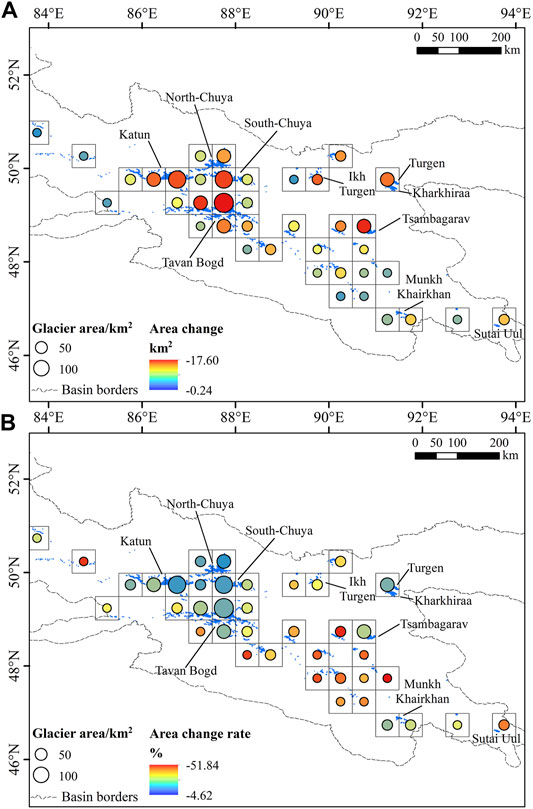
FIGURE 6. Glacier area changes for 2000–2020 in the Altai Mountains. (A) Glacier area change. (B) Glacier area change rate. The glacier area in the map represents the glacier area in 2000; we set a threshold (glacier areas in grid > 1 km2) to establish the grid.
Studies have shown that the continental glaciers in the Altai Mountains continue to melt under the background of global climate change (Kamp and Pan, 2015; Pan et al., 2018). The average mass balance for regional glaciers from 2000 to 2020 is shown in Figure 7A. We calculated a mean mass loss of 14.55 ± 1.32 m w. e. (or -0.74 ± 0.07 m w. e.·a−1) for DEMs-covered glaciers during 2000–2020. Due to the widely distributed glaciers and different local climates, the rates of mass changes differ in sub-regions. Mass loss was the highest in the southeast part and much lower in the northwest part. Mass loss in Sutai Uul was the highest with -0.99 ± 0.07 m w. e.·a−1 from 2000 to 2020, but it was the lowest with -0.44 ± 0.05 m w. e.·a−1 in Katun massif. Glacier mass loss was relatively high in Central Altai with 0.75–0.91 m w. e. a−1.
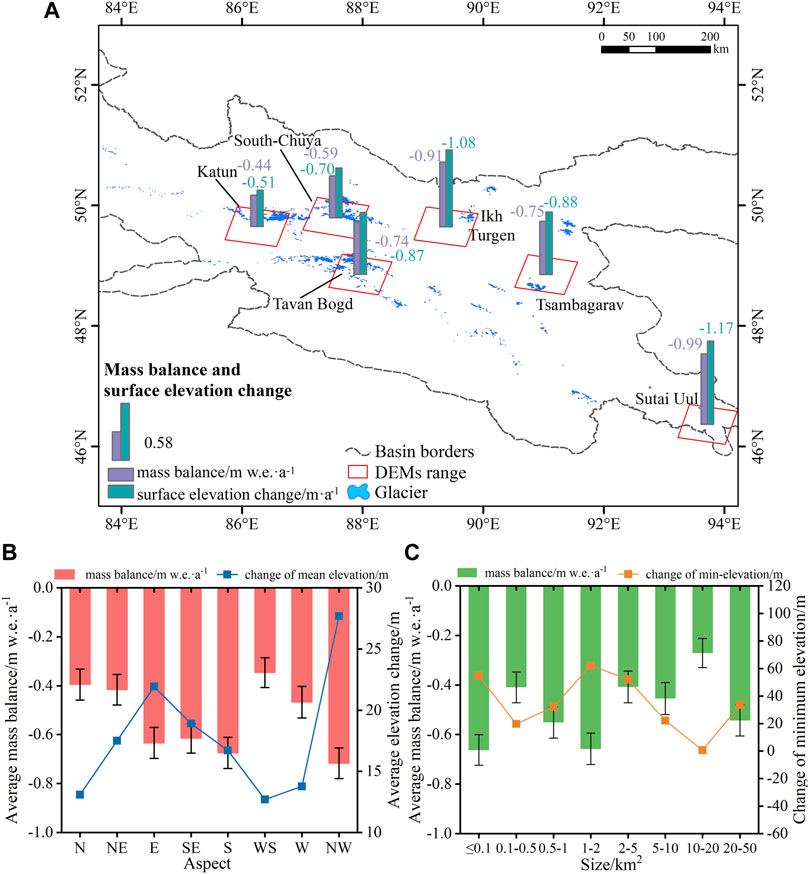
FIGURE 7. Mass balance from 2000 to 2020 in the Altai Mountains. (A) Spatial distribution of mass balances and surface elevation changes for DEMs-covered glaciers. (B) Glacier mass balances and mean elevation changes of different aspects. (C) Glacier mass balances and minimum elevation changes of different size classes.
The mass balances vary in different aspects (Figure 7B). Glaciers in NW-orientation have the largest mean mass loss with 14.35 ± 1.24 m w. e. (0.72 ± 0.06 m w. e.·a−1). Mean mass loss in E- and SE-orientation were similar with ∼ 12 ± 1.25 m w. e., which was slightly smaller than that in S-orientation (13.50 ± 1.27 m w. e.). Glaciers in other aspects had a relatively low mass loss with 0.35–0.47 m w. e. ·a−1. Figure 7B also showed the relationship between mass loss and mean elevation. Glaciers with high mass loss had a large increase in mean elevation and low mass loss with a slight increase. Mean mass loss and changes in the minimum elevation of different size classes of glaciers during 2000–2020 are shown in Figure 7C. Glaciers smaller than 0.1 km2 experienced the largest mass loss (0.66 ± 0.06 m w. e. a−1), which was extremely close to that of glaciers with 1–2 km2 (0.65 ± 0.06 m w. e. a−1). Glaciers with the size class of 10–20 km2 had the lowest mass loss (0.27 ± 0.05 m w. e. a−1). The minimum elevation had a large increase when the high mass loss occurred. Though the average mass loss of smaller than 0.1 km2 glaciers and 1–2 km2 glaciers were close, the minimum elevation of glaciers with 1–2 km2 had increased by 62.22 m, while it was 54.82 m for glaciers smaller than 0.1 km2.
We compared the 2000 inventory and 2020 inventory derived from this study with other glacier inventories in the Altai Mountains (Table 3). We choose 2000 inventory as the reference inventory. Glacier area in 2000 inventory is 9.97% higher, but the glacier number is 4.44% lower than RGI 6.0, which used images acquired around 2013. As mentioned earlier, explicit glaciers are missing in many areas in RGI6.0. Glacier area in 2000 inventory is 3.29% slightly higher, but the glacier number is 34.21% lower than GGI 18, in which acquisition time of employed-images was close to that in 2000 inventory. The difference in glacier area of less than 5% is an acceptable range. The delineation method of glacier margins, different acquisition dates, and glacier change contribute to the difference in glacier area. Glacier margins derived from automatic delineation used by RGI 6.0 were characterized by sawtooth, which affects glacier area calculation. The difference in glacier number is concerned with divisions for large ice masses and glacier change.
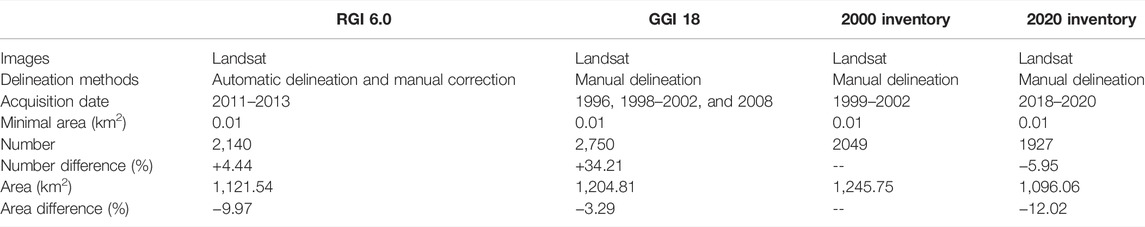
TABLE 3. Comparison with other glacier inventories.
The mean elevation for glaciers larger than 0.5 km2 ranged from 2,432 to 4,055 m with a mean value of 3,234 m in 2000, and it was 2,564 m–4,093 m with a mean value of 3,265 m in 2020. As shown in Figure 8A, the mean elevation for glaciers larger than 0.5 km2 obviously rose from northwest to southeast. The mean elevation of glaciers is largely driven by the local climate. The southeastern part of the Altai Mountains is deep inside the continent and has a more arid climate (Figure 11), which determines the glaciers developing at higher altitudes. A plot of glacier size vs. min-elevation and max-elevation (Figure 9A) showed that the elevation ranges enlarged as glacier size increased. For glaciers smaller than 10 km2, the max-elevations were ∼ 4200 m and the elevation ranges were within 2000 m; the glaciers with size classes of 10–30 km2 have the largest elevation ranges (∼2500 m), and the max-elevation reached 4500 m. The mean elevations of glaciers with an aspect of 100–300° were obviously higher than glaciers in other aspects (Figure 9C). For the majority of glaciers in 0–100° and 300–360°, the mean elevations were within 3,000–3,400 m. The color-coded dots in Figure 9C also revealed that the mean elevation of glaciers differs in sub-regions. The mean elevations of glaciers in Katun were the lowest and they were highest in Sutai Uul, which is consistent with the spatial distribution of mean elevation (Figure 8A).
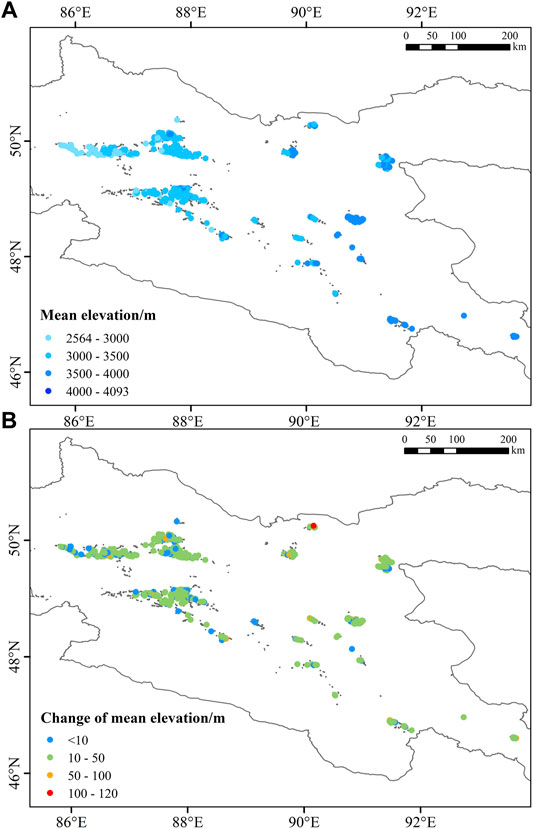
FIGURE 8. (A) Spatial distribution of mean elevation for glaciers larger than 0.5 km2 in 2020. (B) Change of mean elevation for glaciers larger than 0.5 km2 during 2000–2020.
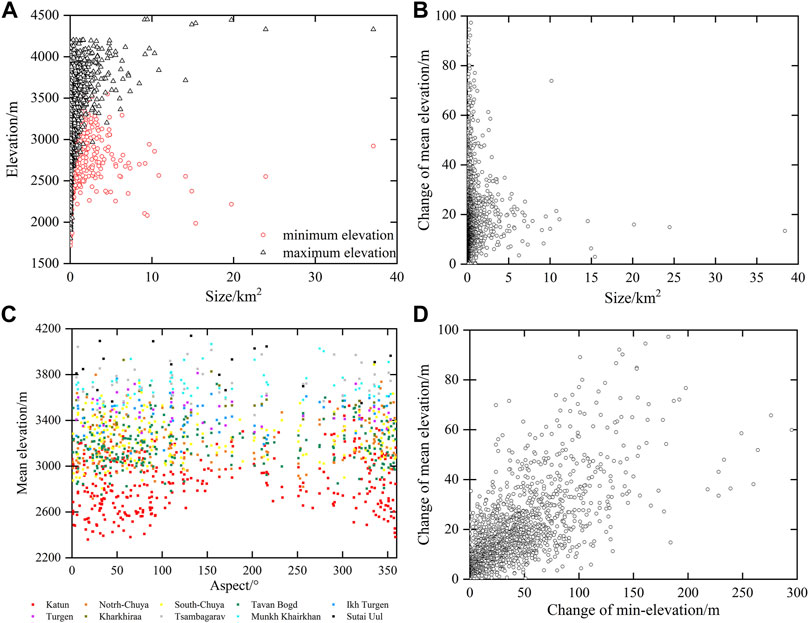
FIGURE 9. (A) Glacier size vs. min-elevation and max-elevation in 2020. (B) Glacier size vs. changes of mean elevation for 2000–2020. (C) Aspect vs. mean elevation over glaciers in the main mountain ranges in 2020. (D) Change of minimum elevation vs. change of mean elevation for 2000–2020.
We mapped the spatial distribution of the mean elevation change for glaciers larger than 0.5 km2 (Figure 8B). Most glaciers have a rising mean elevation within 50 m, but it was higher than 50 m or more in Central Altai and the southeast part. A scatter plot of glacier size vs. change of mean elevation (Figure 9B) showed that the rising mean elevation diminished as glacier size increased. High rising of mean elevation occurred on small-scale glaciers (smaller than 5 km2), which account for approximately 98% of glacier total number. The mean elevations of the eight glaciers larger than 10 km2 have risen by ∼20 m. In the context of glacier shrinkage, the changes in min-elevation and mean elevation of glaciers are not equal. The rising minimum elevation was larger than that of the mean elevation for each glacier (Figure 9D).
We compared glacier change rates derived from this study with the results in Altai from published references, whose study periods span from the mid to late 20th century. For glaciers in the main mountain ranges (Katun massif, North Chuya, South Chuya, and Tavan Bogd) in Altai, glacier area shrinkage rates during the period of 2000–2020 were higher than the results from published research. We concluded that the glaciers in the Altai Mountains during 2000–2020 have experienced an accelerated shrinkage. Large accelerated shrinkages were found in the Katun massif and South Chuya. For glaciers in the Katun massif, the area shrinkage rates during 2000–2020, 1850–2003, and 1952–2008 were 0.37 ± 0.12%·a−1, 0.12%·a−1, and 0.16%·a−1, respectively. The glaciers in South Chuya have experienced the shrinkage of 0.45 ± 0.10%·a−1, 0.15%·a−1, and 0.17%·a−1 in 2000–2020, 1850–2003, and 1952–2008. Shrinkage rates of glacier area of sub-regions in the Altai can be seen in Supplementary Table S4).
We also compared glacier area changes in other mountain ranges around the world, whose study periods are generally consistent with the present study period. Glaciers in the Altai Mountains with a shrinkage rate of 0.60 ± 0.15%·a−1 is the medium level compared to that in other mountains around the world. High shrinkage rates were found in the Alps (2003–2016) and Greater Caucasus (2000–2020) with -1.2%·a−1 (Paul et al., 2020) and -1.16%·a−1 (Tielidze et al., 2022b), respectively. The area shrinkage rate in West Kulun Mountain (2005–2016) and Qilian Mountain (2001–2018) were -0.75%·a−1 (Zhang et al., 2016) and 0.87%·a−1 (Wang et al., 2020), which were close to that in the Altai. Glaciers in Pamir (2000–2017) and Southern Tianshan (2000–2020) have experienced the minimum shrinkage rates of -0.07%·a−1 (Li Z. et al., 2022) and -0.26%·a−1 (Wang et al., 2021). The area shrinkage rates of different mountains in the world are shown in Supplementary Figure S1.
The glacier mass balances in different altitude zones show that glacier thinning became weaker as elevation increased (Figure 10A). The sudden decrease of mass balance in 3,600–4,000 m was due to the steep topography, which leads to glacier collapse. Glacier mass gain above 4,000 m was due to the glacier accumulation. The geodetic mass loss in Tavan Bogd was 0.43 ± 0.03 m w. e.·a−1 from 1959 to 2008 (Wei et al., 2015), and it is smaller than that of 0.74 ± 0.07 m w. e.·a−1 during 2000–2020 in this study. The surface elevation decreased by 0.44 m·a−1 in Friendship Peak during 1959–2008 (Wang et al., 2015), which is smaller than the mean surface elevation changes of -0.87 ± 0.07 m·a−1 during 2000–2020 in this study. From 1910 to 2010, the glacier surface elevation in Turgen decreased by 70 m (Kamp et al., 2013), and the average rate of 0.7 m·a−1 is smaller than that of 1.08 ± 0.06 m·a−1 in this study. The mass loss was 0.69 m w. e.·a−1 in the entire Altai Mountains for 1990–2011 by the temperature index-based glacier mass balance model (Zhang J et al., 2017), which is slightly smaller than the average mass loss of 0.74 ± 0.07 m w. e.·a−1 for 2000–2020 in this study. The mass change rates of existing research in the Altai were smaller than those in this study, indicating an accelerated mass loss in Altai.
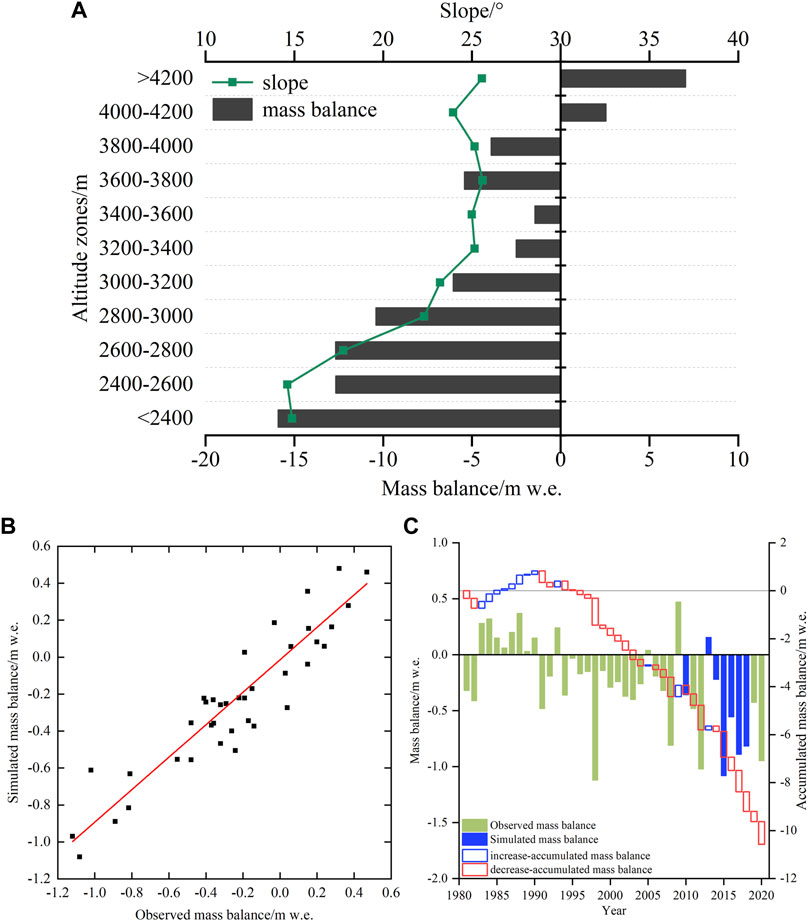
FIGURE 10. (A) Glacier mass balance from 2000–2020 and average slope with different altitude zones. (B) Fitting of observed mass balances and simulated mass balances for 1981–2012. (C) Observed mass balances and simulated mass balances of Leviy Aktru from 1981–2020.
We used the observed mass balance of Leviy Aktru to further demonstrate glacier mass loss. Since the observed mass balances of Leviy Aktru reported by WGMS were missing in 2010 and 2013–2018, we employed the multiple regression analysis with the average temperature in summer (June to August), annual precipitation (September to August), and existing-observed mass balances to model the missing mass balances. The average summer temperature and annual precipitation were derived from the KARA TJUREK weather station (RSM00036442, 86.42°E, 50°N, 2601 m), which is 110 km far from the Leviy Aktru. The average summer temperature and annual precipitation were used as independent variables, and the existing mass balances were used as the dependent variable, and the regression equation was determined by multiple regression analysis. The missed mass balances were simulated by a multiple regression equation and we compared the observed mass balances and simulated mass balances. As shown in Figure 10B, the fit of observed mass balances and simulated mass balances showed linearity, indicating that the multiple regression equation can simulate the missed mass balances well. As shown in Figure 10C, the accumulated mass balance derived from observed mass balances and simulated mass balances was -8.72 m w. e. from 2000 to 2018, which was close to the geodetic mass balance of -10.67 ± 1.18 m w. e. in this study from 2000 to 2018. The accumulated mass balance of -1.86 m w. e. for 1981–2000 was much smaller than that for 2001–2018, demonstrating that the glaciers in this region experienced accelerated mass loss from 1981 to 2020.
Glacier mass balance in other mountains around the world, whose study periods are generally consistent with the present study period, was compared with that in Altai. Glaciers in the Altai Mountains with a mass loss of 0.74 ± 0.07 m w. e.·a−1 is the most dramatic compared to that in other mountains around the world. Large mass loss was found in the Caucasus (2000–2019), Eastern Tianshan (2011–2017), and Qilian Mountain (1990–2016) with 0.53 m w. e.·a−1 (Tielidze et al., 2022a), 0.62 m w. e.·a−1 (Li H. et al., 2022), and 0.60 m w. e.·a−1 (Zhang et al., 2021), respectively. The mass loss in Svalbard (2000–2019) and Western Himalaya (2010–2018) was similar with 0.36 m w. e.·a−1 (Schuler et al., 2020) and 0.39 m w. e.·a−1 (Zhu et al., 2021). Glaciers in the Pamir (2000–2017) have the slightest mass loss of 0.05 m w. e.·a−1 (Li Z. et al., 2022). Mass balance changes of different mountains in the world are shown in Supplementary Figure S2.
In this article, we did not analyze the area change and mass balance of debris-covered glaciers separately for several reasons: 1) Almost all glaciers in the Altai Mountains are clear ice, and only several glaciers have trace debris in glacier tongue. 2) It may be more accurate to study the changes of debris-covered glaciers over a longer period, while the study period in this article is short (20 years).
Climate is the most important factor affecting the development and evolution of glaciers (Xie and Liu, 2010). The mean temperature in summer (June-August) increased at a rate of 0.5°C/10a in the Altai Mountains based on CRUv4.05 meteorological data, which is greater than the rising temperature of 0.34°C/10a in Tianshan, and it is consistent with the phenomenon that smaller rising temperature in the south but larger in the north in Xinjiang (Su et al., 2003). The annual precipitation increased by 1.8 mm/10a on average in the Altai Mountains, which is smaller than that in the Tianshan (Wang et al., 2011b). The change in precipitation is in accordance with the phenomenon that larger increasing precipitation in the south but smaller in the north in Xinjiang (Shi et al., 2002; Liu et al., 2010). The change tendency of mean temperature in summer and annual precipitation showed that the climate in the Altai Mountains changed from warm and dry to warm and humid, which agreed with the climate change tendency in northwest China (Shi et al., 2002).
However, the change of mean temperature in summer and annual precipitation were characterized by spatial homogeneity. We mapped the spatial change patterns of mean temperature in summer and annual precipitation with a spatial resolution of 0.5° latitude * 0.5° longitude based on CRU meteorological data. As shown in Figure 11A, the mean temperature in summer increased in the entire Altai, which was higher in the southeastern Altai and lighter toward the northwestern part. In Figure 11B, the annual precipitation decreased in most areas, although the annual precipitation increased slightly overall. The annual precipitation decreased in the southeastern Altai and Central Altai but increased slightly in the northwestern part. Existing studies (Raper et al., 2000; Oerlemans, 2005) show that solid precipitation needs to increase by 25% or 35% to maintain the mass balance of glaciers for a 1°C rise in temperature, and even more than 40% in high Asian regions (Kang, 1996). The mean temperature in summer increased by 0.7°C/10a and annual precipitation decreased by 4mm/10a in Sutai Uul, which explains the dramatic mass loss and glacier area shrinkage. The warmer temperature is the reason for glacier area shrinkage and mass loss in the Altai Mountains.
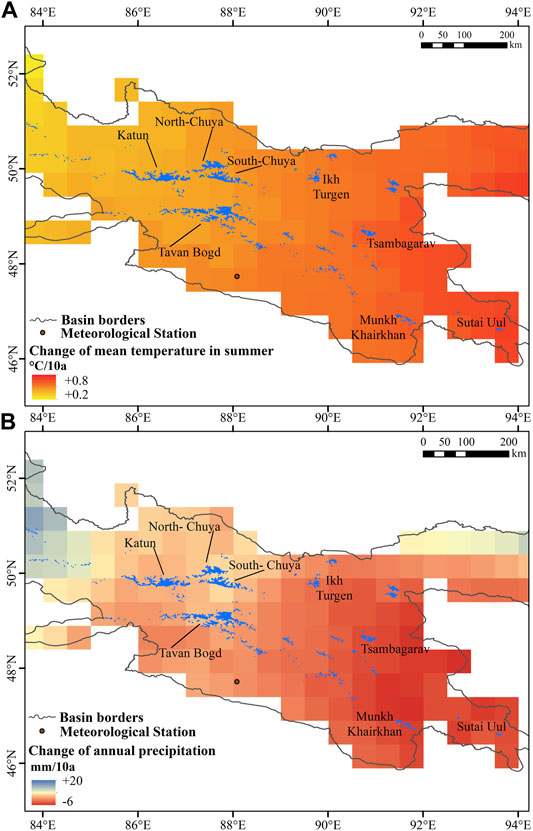
FIGURE 11. (A) Change of mean temperature in summer, and (B) change of annual precipitation.
This study presents two new glacier inventories for the Altai Mountains using Landsat ETM+/OLI images acquired around 2000 and 2020. The mass balance during 2000–2020 was estimated by comparing 2000 SRTM DEM and 2020 DEMs generated from ASTER images. In total, 1,927 glaciers covering an area of 1,096.06 ± 53.32 km2 around 2020 were mapped. A reduction of 149.70 ± 37.45 km2 was found from 2000 to 2020, with a shrinkage rate of 12.02 ± 3.01% (or 0.60 ± 0.15%·a−1). The regions with large glacier areas have larger shrinkage areas but smaller shrinkage rates. An average mass loss of 0.74 ± 0.07 m w. e.·a−1 was found from 2000 to 2020 by geodetic survey, and the glacier surface elevation was decreased by 0.87 ± 0.07 m·a−1. Glaciers experienced the worst mass loss in the Southeast Altai, and the mass loss was mitigated from the southeast toward the northwest part. The warmer temperature was the primary reason for glacier area shrinking and mass loss in the Altai Mountains.
The raw data supporting the conclusions of this article will be made available by the authors, without undue reservation.
JC performed the reprocess of images, mapped glacier outlines, calculated glacier area change, generated DEMs from ASTER images, estimated mass balance, and wrote the full text; NW was responsible for guiding the writing and technical guidance; and ZL was responsible for guiding the calculation process and correction of calculation results. DY was responsible for language correction.
This work was supported by the National Natural Science Foundation of China (Grant No.42130516), the Strategic Priority Research Program of the Chinese Academy of Sciences (Grant No.XDA19070302), Strategic Priority Research Program of the Chinese Academy of Sciences (Grant No.XDA20060201).
The authors declare that the research was conducted in the absence of any commercial or financial relationships that could be construed as a potential conflict of interest.
All claims expressed in this article are solely those of the authors and do not necessarily represent those of their affiliated organizations, or those of the publisher, the editors, and the reviewers. Any product that may be evaluated in this article, or claim that may be made by its manufacturer, is not guaranteed or endorsed by the publisher.
We thank the USGS for providing access to the Landsat images and SRTM DEM. We gratitude the contributors of the RGI 6.0, GGI 18. We acknowledge the contribution of WGMS for providing observed mass balance. We thank the National Centers for Environmental Information for CRU data. We also acknowledge the NASA for providing access to ASTER images. In addition, thanks to all authors for their guidance on this study.
The Supplementary Material for this article can be found online at: https://www.frontiersin.org/articles/10.3389/feart.2022.919051/full#supplementary-material
2https://search.earthdata.nasa.gov/.
6https://psl.noaa.gov/data/gridded/data.UDel_AirT_Precip.html/.
Benn, D. I., Bolch, T., Hands, K., Gulley, J., Luckman, A., Nicholson, L. I., et al. (2012). Response of Debris-Covered Glaciers in the Mount Everest Region to Recent Warming, and Implications for Outburst Flood Hazards. Earth-Science Rev. 114, 156–174. doi:10.1016/j.earscirev.2012.03.008
Bolch, T., Menounos, B., and Wheate, R. (2010). Landsat-based Inventory of Glaciers in Western Canada, 1985-2005. Remote Sens. Environ. 114, 127–137. doi:10.1016/j.rse.2009.08.015
Bolch, T., Pieczonka, T., and Benn, D. I. (2011). Multi-decadal Mass Loss of Glaciers in the Everest Area (Nepal Himalaya) Derived from Stereo Imagery. Cryosphere 5, 349–358. doi:10.5194/tc-5-349-2011
Brun, F., Berthier, E., Wagnon, P., Kääb, A., and Treichler, D. (2017). A Spatially Resolved Estimate of High Mountain Asia Glacier Mass Balances from 2000 to 2016. Nat. Geosci. 10, 668–673. doi:10.1038/ngeo2999
Ganyushkin, D. A., Chistyakov, K. V., Volkov, I. V., Bantcev, D. V., Kunaeva, E. P., Andreeva, T. A., et al. (2018). Present Glaciers of Tavan Bogd Massif in the Altai Mountains, Central Asia, and Their Changes since the Little Ice Age. Geosciences 8, 414. doi:10.3390/geosciences8110414
Gardelle, J., Berthier, E., and Arnaud, Y. J. J. O. G. (2012). Impact of Resolution and Radar Penetration on Glacier Elevation Changes Computed from DEM Differencing.
Gardner, A. S., Moholdt, G., Cogley, J. G., Wouters, B., Arendt, A. A., Wahr, J., et al. (2013). A Reconciled Estimate of Glacier Contributions to Sea Level Rise: 2003 to 2009. Science 340, 852–857. doi:10.1126/science.1234532
Hugonnet, R., Mcnabb, R., Berthier, E., Menounos, B., Nuth, C., Girod, L., et al. (2021). Accelerated Global Glacier Mass Loss in the Early Twenty-First Century. Nature 592, 726–731. doi:10.1038/s41586-021-03436-z
Huss, M. (2013). Density Assumptions for Converting Geodetic Glacier Volume Change to Mass Change. Cryosphere 7, 877–887. doi:10.5194/tc-7-877-2013
Huss, M., Bookhagen, B., Huggel, C., Jacobsen, D., Bradley, R. S., Clague, J. J., et al. (2017). Toward Mountains without Permanent Snow and Ice. Earth's Future 5, 418–435. doi:10.1002/2016ef000514
Iwasaki, A. (2011). Detection and Estimation Satellite Attitude Jitter Using Remote Sensing Imagery. Adv. Spacecr. Technol. 1, 1. doi:10.5772/14402
Kamp, U., Mcmanigal, K. G., Dashtseren, A., and Walther, M. (2013). Documenting Glacial Changes between 1910, 1970, 1992 and 2010 in the Turgen Mountains, Mongolian Altai, Using Repeat Photographs, Topographic Maps, and Satellite Imagery. Geogr. J. 179, 248–263. doi:10.1111/j.1475-4959.2012.00486.x
Kamp, U., and Pan, C. G. (2015). Inventory of Glaciers in Mongolia, Derived from Landsat Imagery from 1989 to 2011. Geogr. Ann. Ser. A, Phys. Geogr. 97, 653–669. doi:10.1111/geoa.12105
Kang, E. (1996). Characteristics of Energy Blance and Computation on the Mass Balance Change of the High-Asia Cryosphere. J. Glaciol. Geocryol. 18, 12.
Kaser, G., Grosshauser, M., and Marzeion, B. (2010). Contribution Potential of Glaciers to Water Availability in Different Climate Regimes. Proc. Natl. Acad. Sci. U.S.A. 107, 20223–20227. doi:10.1073/pnas.1008162107
Kotlyakov, V., M., Chernova, L., P., and Zverkova, N., M. (2014). The One-And-A-Half-Century Reduction of Altai Glaciers in Russia and Kazakhstan. Dokl. Earth Sci. 458 (2), 1307–1311. doi:10.1134/S1028334X14100286
Krumwiede, B. S., Kamp, U., Leonard, G. J., Kargel, J. S., and Walther, M. J. S. B. H. (2014). Recent Glacier Changes in the Mongolian Altai Mountains: Case Studies from Munkh Khairkhan and Tavan Bogd.
Lehmkuhl, F. (2012). Holocene Glaciers in the Mongolian Altai: An Example from the Turgen-Kharkhiraa Mountains. J. Asian Earth Sci. 52, 12–20. doi:10.1016/j.jseaes.2011.11.027
Lehmkuhl, F. (1999). Rezente und jungpleistozäne Formungs- und Prozeßregionen im Turgen-Kharkhiraa, Mongolischer Altai [Modern and Pleistocene geomorphic regions in the Turgen-Kharkhira Mountains. Mongolian Altay.
Li, H., Wang, P., Li, Z., Jin, S., Xu, C., Liu, S., et al. (2022a). An Application of Three Different Field Methods to Monitor Changes in Urumqi Glacier No. 1, Chinese Tien Shan, during 2012-18. J. Glaciol. 68, 41–53. doi:10.1017/jog.2021.71
Li, Z., Wang, N., Chen, A. a., Liang, Q., and Yang, D. (2022b). Slight Change of Glaciers in the Pamir over the Period 2000-2017. Arct. Antarct. Alp. Res. 54, 13–24. doi:10.1080/15230430.2022.2028475
Liu, L., Cheng, N., and Tian, L. (2010). The Climate Change and its Influences on Ecosystem Environment for the Last 37 Years in Heavenly Pond in Tianshan of Xinjiang. J. Arid Land Resour. Environ. 24, 87–91.
Lv, H., Yang, T., and Tian, H. (2012). Glacier Changes in the Northern Altay Mountains from 1980 to 2010. J. Arid Land Resour. Environ. 26, 69–76.
Mölg, N., Bolch, T., Rastner, P., Strozzi, T., and Paul, F. (2018). A Consistent Glacier Inventory for Karakoram and Pamir Derived from Landsat Data: Distribution of Debris Cover and Mapping Challenges. Earth Syst. Sci. Data 10, 1807–1827. doi:10.5194/essd-10-1807-2018
Narozhniy, Y., and Zemtsov, V. (2011). Current State of the Altai Glaciers (Russia) and Trends over the Period of Instrumental Observations 1952-2008. Ambio 40, 575–588. doi:10.1007/s13280-011-0166-0
Nuimura, T., Sakai, A., Taniguchi, K., Nagai, H., Lamsal, D., Tsutaki, S., et al. (2015). The GAMDAM Glacier Inventory: a Quality-Controlled Inventory of Asian Glaciers. Cryosphere 9, 849–864. doi:10.5194/tc-9-849-2015
Nuth, C., and Kääb, A. (2011). Co-registration and Bias Corrections of Satellite Elevation Data Sets for Quantifying Glacier Thickness Change. Cryosphere 5, 271–290. doi:10.5194/tc-5-271-2011
Oerlemans, J. (2005). Extracting a Climate Signal from 169 Glacier Records. Science 308, 675–677. doi:10.1126/science.1107046
Pan, C. G., Pope, A., Kamp, U., Dashtseren, A., Walther, M., and Syromyatina, M. V. (2018). Glacier Recession in the Altai Mountains of Mongolia in 1990-2016. Geogr. Ann. Ser. A, Phys. Geogr. 100, 185–203. doi:10.1080/04353676.2017.1407560
Paul, F., Rastner, P., Azzoni, R. S., Diolaiuti, G., Fugazza, D., LE Bris, R., et al. (2020). Glacier Shrinkage in the Alps Continues Unabated as Revealed by a New Glacier Inventory from Sentinel-2. Earth Syst. Sci. Data 12, 1805–1821. doi:10.5194/essd-12-1805-2020
Pfeffer, W. T., Arendt, A. A., Bliss, A., Bolch, T., Cogley, J. G., Gardner, A. S., et al. (2014). The Randolph Glacier Inventory: a Globally Complete Inventory of Glaciers. J. Glaciol. 60, 537–552. doi:10.3189/2014jog13j176
Pieczonka, T., Bolch, T., Junfeng, W., and Shiyin, L. (2013). Heterogeneous Mass Loss of Glaciers in the Aksu-Tarim Catchment (Central Tien Shan) Revealed by 1976 KH-9 Hexagon and 2009 SPOT-5 Stereo Imagery (EI).
Rankl, M., Kienholz, C., and Braun, M. (2014). Glacier Changes in the Karakoram Region Mapped by Multimission Satellite Imagery. Cryosphere 8, 977–989. doi:10.5194/tc-8-977-2014
Raper, S. C. B., Brown, O., and Braithwaite, R. J. (2000). A Geometric Glacier Model for Sea-Level Change Calculations. J. Glaciol. 46, 357–368. doi:10.3189/172756500781833034
Revyakin, V. S. M. (1986). Dynamics of the Glaciers of Altai-Sayan Mountain System over the Last 150 Years. Data Glaciol. 57.
Rgi, C., and Nosenko, G. (2017). Randolph Glacier Inventory(RGI)-A Dataset of Global Glacier Outlines:Version6.0. Technical Report,Global Land Ice Measurements from Space.
Sakai, A. (2019). Brief Communication: Updated GAMDAM Glacier Inventory over High-Mountain Asia. Cryosphere 13, 2043–2049. doi:10.5194/tc-13-2043-2019
Schuler, T. V., Kohler, J., Elagina, N., Hagen, J. O. M., Hodson, A. J., Jania, J. A., et al. (2020). Reconciling Svalbard Glacier Mass Balance. Front. Earth Sci. 8, 1. doi:10.3389/feart.2020.00156
Shi, Y., Shen, Y., and Hu, R. (2002). Preliminary Study on Signal, Impact and Foreground of Climatic Shift from Warm-Dry to Warm-Humid in Northwest China. J. Glaciol. Geocryol. 24, 219–226.
Su, H., Wei, W., and Han, P. (2003). Changes in Air Temperature and Evaporation in Xinjiang during Recent 50 Years. J. Glaciol. Geocryol. 25, 174–178.
Tielidze, L. G., Bolch, T., Wheate, R. D., Kutuzov, S. S., Lavrentiev, , and Zemp, M. (2020). Supra-glacial Debris Cover Changes in the Greater Caucasus from 1986 to 2014. Cryosphere 14, 585–598. doi:10.5194/tc-14-585-2020
Tielidze, L. G., Jomelli, V., and Nosenko, G. A. (2022a). Analysis of Regional Changes in Geodetic Mass Balance for All Caucasus Glaciers over the Past Two Decades. Atmosphere 13, 1. doi:10.3390/atmos13020256
Tielidze, L. G., Nosenko, G. A., Khromova, T. E., and Paul, F. (2022b). Strong Acceleration of Glacier Area Loss in the Greater Caucasus between 2000 and 2020. Cryosphere 16, 489–504. doi:10.5194/tc-16-489-2022
Tsutomu, K., and Gombo, D. (2007). Recent Glacier Variations in Mongolia. Ann. Glaciol. 46, 185–188. doi:10.3189/172756407782871675
Wang, Y., Li, J., Wu, L., Guo, L., and Li, J. (2020). Using Remote Sensing Images to Monitor the Glacier Changes in Qilian Mountains during 1987 - 2018 and Analyzing the Impact Factors. J. Glaciol. Geocryol. 42, 344–356. doi:10.7522/j.issn.1000-0240.2019.0080
Wang, L. C., Yu, K., Chang, L., Zhang, J., Tang, T., Yin, L. H., et al. (2021). Response of Glacier Area Variation to Climate Change in the Kaidu-Kongque River Basin, Southern Tianshan Mountains during the Last 20 Years. China Geol. 4, 389–401. doi:10.31035/cg2021055
Wang, P., Li, Z., Luo, S., Bai, J., Huai, B., Wang, F., et al. (2015). Five Decades of Changes in the Glaciers on the Friendship Peak in the Altai Mountains, China: Changes in Area and Ice Surface Elevation. Cold Regions Sci. Technol. 116, 24–31. doi:10.1016/j.coldregions.2015.04.002
Wang, S., Xie, Z., Dai, Y., Liu, S., and Wang, X. (2011a). Structure, Change and its Tendency of Glacier Systems in Altay Mountains. Arid. Land Geogr. 34, 115–123.
Wang, S., Zhang, M., Li, Z., Wang, F., Li, H., Li, Y., et al. (2011b). Response of Glacier Area Variation to Climate Change in Chinese Tianshan Mountains in the Past 50 Years. Acta Geogr. Sin. 66, 38–46.
Wang, X., Yang, T., Tian, H., and Jiang, S. (2013). Response of Glacier Variation in the Southern Altai Mountains to Climate Change during the Last 40 Years. J. Arid Land Resour. Environ. 27, 77–82.
Wei, J. F., Liu, S. Y., Xu, J. L., Guo, W. Q., Bao, W. J., Shangguan, D. H., et al. (2015). Mass Loss from Glaciers in the Chinese Altai Mountains between 1959 and 2008 Revealed Based on Historical Maps, SRTM, and ASTER Images.
Yao, T., Wu, G., Xu, B., Wang, W., Gao, J., and An, B. (2019). Asian Water Tower Change and its Impacts. Bull. Chin. Acad. Sci. 34, 1203–1209.
Yao, X., Liu, S., Guo, W., Huai, B., Sun, M., and Xu, J. (2012). Glacier Change of Altay Mountain in China from 1960 to 2009 Based on the Second Glacier Inventory of China. J. Nat. Resour. 27, 1734–1745.
Zhang, H., Li, Z. Q., and Zhou, P. (2021). Mass Balance Reconstruction for Shiyi Glacier in the Qilian Mountains, Northeastern Tibetan Plateau, and its Climatic Drivers. Clim. Dyn. 56, 969–984. doi:10.1007/s00382-020-05514-w
Zhang, J., Fu, B. H., Wang, L. M., Maimaiti, A., Ma, Y. X., and Yan, F. (2017). Glacier Changes in the West Kunlun Mountains Revealed by Landsat Data from 1994 to 2016. 3rd International Symposium on Earth Observation for Arid and Semi-arid Environments (ISEO), Sep 19-21 2016a Acad Sci Republ Tajikistan. Dushanbe, TAJIKISTAN.
Zhang Y, Y., Enomoto, H., Ohata, T., Kitabata, H., Kadota, T., and Hirabayashi, Y. (2017). Glacier Mass Balance and its Potential Impacts in the Altai Mountains over the Period 1990-2011. J. Hydrology 553, 662–677. doi:10.1016/j.jhydrol.2017.08.026
Zhang, Y., Enomoto, H., Ohata, T., Kitabata, H., Kadota, T., and Hirabayashi, Y. (2016). Projections of Glacier Change in the Altai Mountains under Twenty-First Century Climate Scenarios. Clim. Dyn. 47, 2935–2953. doi:10.1007/s00382-016-3006-x
Zhang, Z., Liu, S., Zhang, Y., Wei, J., and Kunpeng, W. U. J. J. O. G. (2018). Glacier Variations at Aru Co in Western Tibet from 1971 to 2016 Derived from Remote-Sensing Data. J. Glaciol. 64, 1–10. doi:10.1017/jog.2018.34
Keywords: glacier inventory, mass balance, Altai Mountains, manual delineation, accelerated shrinkage
Citation: Chang J, Wang N, Li Z and Yang D (2022) Accelerated Shrinkage of Glaciers in the Altai Mountains From 2000 to 2020. Front. Earth Sci. 10:919051. doi: 10.3389/feart.2022.919051
Received: 13 April 2022; Accepted: 29 April 2022;
Published: 13 June 2022.
Edited by:
Minghu Ding, Chinese Academy of Meteorological Sciences, ChinaReviewed by:
Levan Tielidze, Victoria University of Wellington, New ZealandCopyright © 2022 Chang, Wang, Li and Yang. This is an open-access article distributed under the terms of the Creative Commons Attribution License (CC BY). The use, distribution or reproduction in other forums is permitted, provided the original author(s) and the copyright owner(s) are credited and that the original publication in this journal is cited, in accordance with accepted academic practice. No use, distribution or reproduction is permitted which does not comply with these terms.
*Correspondence: Ninglian Wang, bmx3YW5nQG53dS5lZHUuY24=
Disclaimer: All claims expressed in this article are solely those of the authors and do not necessarily represent those of their affiliated organizations, or those of the publisher, the editors and the reviewers. Any product that may be evaluated in this article or claim that may be made by its manufacturer is not guaranteed or endorsed by the publisher.
Research integrity at Frontiers
Learn more about the work of our research integrity team to safeguard the quality of each article we publish.