- 1SAR Laboratory, School of Engineering Science, Simon Fraser University, Burnaby, BC, Canada
- 2BGC Engineering, Vancouver, BC, Canada
- 3Department of Geography and Environmental Studies, Stellenbosch University, Stellenbosch, South Africa
- 4Department of Earth Sciences, Simon Fraser University, Burnaby, BC, Canada
- 5Dipartimento di Ingegneria Civile, Chimica, Ambientale e dei Materiali, Alma Mater Studiorum−Università di Bologna, Bologna, Italy
- 6Department of Pure and Applied Sciences, University of Urbino Carlo Bo, Urbino, Italy
We analyze the sensitivity of a large (area extent ∼3 km2), deep-seated gravitational slope deformation (Fels slide, Alaska Range) to three specific drivers: (i) liquid surface water input from ERA-5 reanalysis snow melt and rainfall; (ii) locally projected seismic activity of Alaskan earthquakes; and (iii) lowering of Fels Glacier at the slide toe estimated from topographic data. A surface displacement map-series is derived from 1991 to 2016 spaceborne multi-sensor InSAR data (ERS, RADARSAT-1/2, ALOS, TerraSAR-X) using adaptive demodulation to unwrap interferograms of variable spatial resolution and quality. On this series we use independent component analysis (ICA) to uncover five displacement patterns that map to independently moving domains of the slide and then correlate the corresponding temporal pattern intensities with the suspected drivers. We find significant sub-annual correlation between displacement pattern intensities and seasonal water input variations. The correlation can be optimized, for each ICA pattern, by choosing appropriate values of temporal smoothing and lag to create depth-propagated versions of the water input driver. Lag time results ranging from one to 3 weeks relate to shallower and deeper propagations of water input, driving the different deformation patterns. For two of the deformation patterns, seasonal sensitivity to water input was strongly amplified by the 2002 Mw7.9 Denali earthquake. Sensitivity of these patterns remained high for 4 years until abruptly dropping to below pre-earthquake values, which suggests a highly non-linear modulation by the seismic driver. Other deformation patterns show a steady intensity increase that appears linked to the deglaciation driver. Despite these observations, the inter-annual variations in ICA pattern intensities show no clear predictability by individual drivers or driver combinations. This suggests that the mechanical and hydraulic evolution of the slide, especially after damaging events such as earthquakes or heavy rainfall, is a crucial factor not adequately modeled in our approach. Despite this limitation, our analysis provides the first direct evidence that the Fels slide comprises several independently moving domains that respond differently to the suspected drivers as is suggestive of a complex slope deformation.
1 Introduction
Deep-seated gravitational slope deformation (DSGSD) is the slow downslope movement of large internally deforming rock masses (Zischinsky, 1969). Movement rates are typically slow (<1 mm a−1 to >1 m a−1), although the volumes of rock displaced are large (105–109 m3) (Dramis and Sorriso-Valvo, 1994; Bisci et al., 1996; Cruden and Varnes, 1996). DSGSD are commonly found in deglaciated valleys and seismically active mountainous regions where their occurrence is linked to (1) unloading of over-steepened slopes due to glacier retreat or fluvial incision, (2) the presence of discontinuities of tectonic origin (faults, fractures), and (3) seismic activity (Soldati, 2013). DSGSD typically involve subsidence and spreading of the upper part of a rock slope and outward movement or bulging at the base of the slope (Varnes et al., 1990). Deformation can extend to depths of tens or hundreds of meters (Radbruch-Hall, 1978; Dramis and Sorriso-Valvo, 1994; Agliardi et al., 2001). Unlike most landslide types, DSGSDs may lack sharply defined rear and lateral margins, and there may be no single basal surface along which movement occurs (Dramis and Sorriso-Valvo, 1994), which leads to deformation in a step-like fashion due to continuous creep (Bisci et al., 1996). Since DSGSD evolve very slowly, they are not typically considered immediately hazardous phenomena. However, despite the slow deformation rates, DSGSD can cause damage to surface and underground infrastructure, including roads, pipelines, and tunnels (Ambrosi and Crosta, 2006). Furthermore, some DSGSD have been known to evolve into faster mass movements. Although these accelerated movements are commonly small to moderate in size, DSGSDs have also been known to trigger large catastrophic rockslides, rock avalanches or debris flows (Evans and Clague., 1994; Soldati, 2013).
DSGSDs occur due to the presence of zones at depth where the rock mass is affected by micro-fractures, joints faults shear zones and other structural features (Ambrosi and Crosta, 2006). Movements generally take two forms. Sliding occurs along well-defined internal surfaces, whereas slow “creep” movements are a continuous process operating along poorly defined diffuse boundaries (Soldati, 2013). The onset of accelerated movements, including secondary failures such as rockfalls and debris flows, is triggered by a variety of factors, including hydrological and climate drivers or intermittent events like earthquakes. The chronological relationship between DSGSD and earthquakes and their resultant morphological expression have been explored to determine the recurrence intervals of earthquakes for seismic hazard assessments (Soldati, 2013). However, some DSGSD do not exhibit a strong relationship to seismic events, and in these cases, reactivation commonly has been ascribed to long-lasting and intense rainfall events (Bisci et al., 1996).
DSGSD size, form and activity are affected by 1) geological, structural, and geomorphological features such as lithology, geological structures (e.g., faults, folds, joints), and relief, 2) hydrology, notably groundwater fluctuations, 3) seasonal snow melt and precipitation, and 4) earthquakes (Bisci et al., 1996; Crosta et al., 2013; Soldati, 2013; Longoni et al., 2016). The interplay between these factors leads to complex spatial and temporal patterns of deformation. For example, Crosta et al. (2013) recognized two distinct deformation mechanisms at the Mont de La Saxe rockslide in Italy: 1) snow melt and water table fluctuations, and 2) long-term creep. They subdivided the DSGSD into discrete zones with different spatio-temporal deformation patterns that have different sensitivities to triggering mechanisms.
The complex and often hazardous nature of DSGSD and related movements makes long-term monitoring and risk assessment challenging (Crosta et al., 2013). Detailed geological and geomorphological investigations, together with geomechanical analysis of rock masses, are needed to derive kinematic models for specific slopes. However, although global geomechanical models may provide estimates of long-term movements over large areas, the models frequently fail to produce accurate estimates of short-term localized deformations (Longoni et al., 2016). Consequently, accurate observations and long-term monitoring are required (Crosta et al., 2013; Soldati, 2013). New methods for the detection and monitoring of DSGSD, including high-precision topographic surveys by means of GPS or light detection and ranging (LiDAR), and Interferometric Synthetic Aperture Radar (InSAR) analysis, have been found helpful in developing an understanding of the kinematics of the observed slope movements and the potential evolution of deformation features (Soldati, 2013).
In this paper, we focus on Fels slide, the largest of several deep-seated gravitational slope deformations in the eastern Alaska Range. The landslide is situated within a few kilometres of the Alaska pipeline corridor near where it crosses the Denali fault (Section 2; Figure 2). Fels slide exhibits abundant geomorphic evidence of DSGSD movement (Figure 1) as well as large secondary slumps, debris slides and rockfalls (Newman, 2013). Preliminary studies after the large Mw7.9 Denali earthquake on 3 November 2002 led to questions about pre-vs. post-earthquake slide dynamics, as well as the sensitivity of the DSGSD to hydrological and meteorological drivers (Rabus et al., 2017).
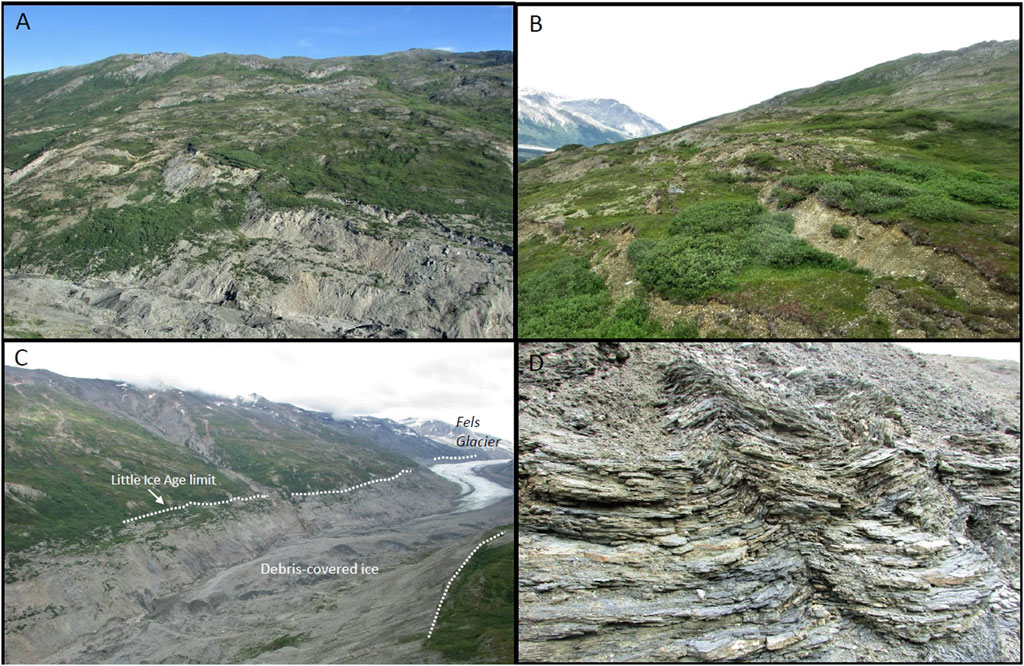
FIGURE 1. Photographs from study area. (A) view of Fels slide toward the north, showing slumping near the toe of Fels Glacier. The glacier toe is located at the extreme bottom-left corner of the photo. (B). Close-up view of slump blocks in Fels slide. (C). Fels Glacier from near its toe; view toward the east. Lateral moraines that mark the upper limit of the glacier in the mid-1800s are marked by dotted white lines. (D). Sericite schist, which is typical of the bedrock in Fels valley. Foliation in the schist dips to the south, more-or-less parallel to the Fels slide slope.
Our investigation builds on a geological characterization of the slope (Newman, 2013) and a recent remote sensing-based characterization (Donati et al., 2021) by using state-of-the-art satellite remote sensing methods to characterize movement of this very large DSGSD over a 24-year period between 1993 and 2017. We test the ability of an independent component analysis (ICA) algorithm on a long time series of InSAR data to determine if discrete, independently moving displacement domains can be identified within a slope deformation complex using the Fels slide as test case. Our aims are to: (i) document the complex and spatial- and time-variant movements of Fels slide; (ii) differentiate surficial seasonal deformation from deeper longer-term deformation; (iii) derive the effective seasonal hydrological drivers involved in slope deformation; and (iv) document how the sensitivity of the slope to the hydrological drivers has evolved over time in relation to the 2002 Denali earthquake and debuttressing due to retreat of Fels Glacier. Section 2 describes the study area and its geological setting and introduces the InSAR and geophysical data available for the study. Section 3 documents the data processing and analysis process for the InSAR data and three primary geophysical driver time series: surface water input, seismic activity, and glacial debuttressing. Section 4 presents the results of the independent component analysis (ICA) of the displacement map series and the subsequent correlation and sensitivity analysis of the identified Independent Deformation Patterns with respect to the geophysical drivers. Section 5 provides a discussion of the ICA deformation patterns in the context of their likely deformation mechanisms and interpretation of the sensitivities of pattern temporal strengths to the investigated drivers; as well it discusses the representativeness of the observed independent deformation patterns due to geometrical and coherence restrictions of the InSAR dataset used in our analysis. Finally, Section 6 presents the conclusions drawn from the study.
2 Study area and datasets
The study area comprises the east-west aligned alpine valley of Fels Glacier, which includes Fels slide (Figure 2) with an area extent of roughly 3 km2 on the valley’s north slope above the ablation area of the glacier. The valley is about 15 km long and meets the valley of the Delta River at an elevation of 850 m asl (above sea level). The Fels slide has an average gradient of about 30°, increasing to 40°–50° in the lower part, due to glacial erosion and oversteepening. The study area is in the discontinuous permafrost zone of Alaska (Ferrians, O.J., 1965); however no indication of permafrost has been observed by us in the field, which is consistent with the elevation range and all south-facing aspect of Fels slide. The glacier has decreased in size considerably since the end of the Little Ice Age in the late 1800s. It has retreated 3–4 km in the past 150 years, accompanied by down-wasting of its terminal area by up to 140 m. Comparison of repeat aerial and satellite optical images shows that the glacier retreated about 750 m between 1973 and 2004, which is thought to have played an important role in the landslide evolution.
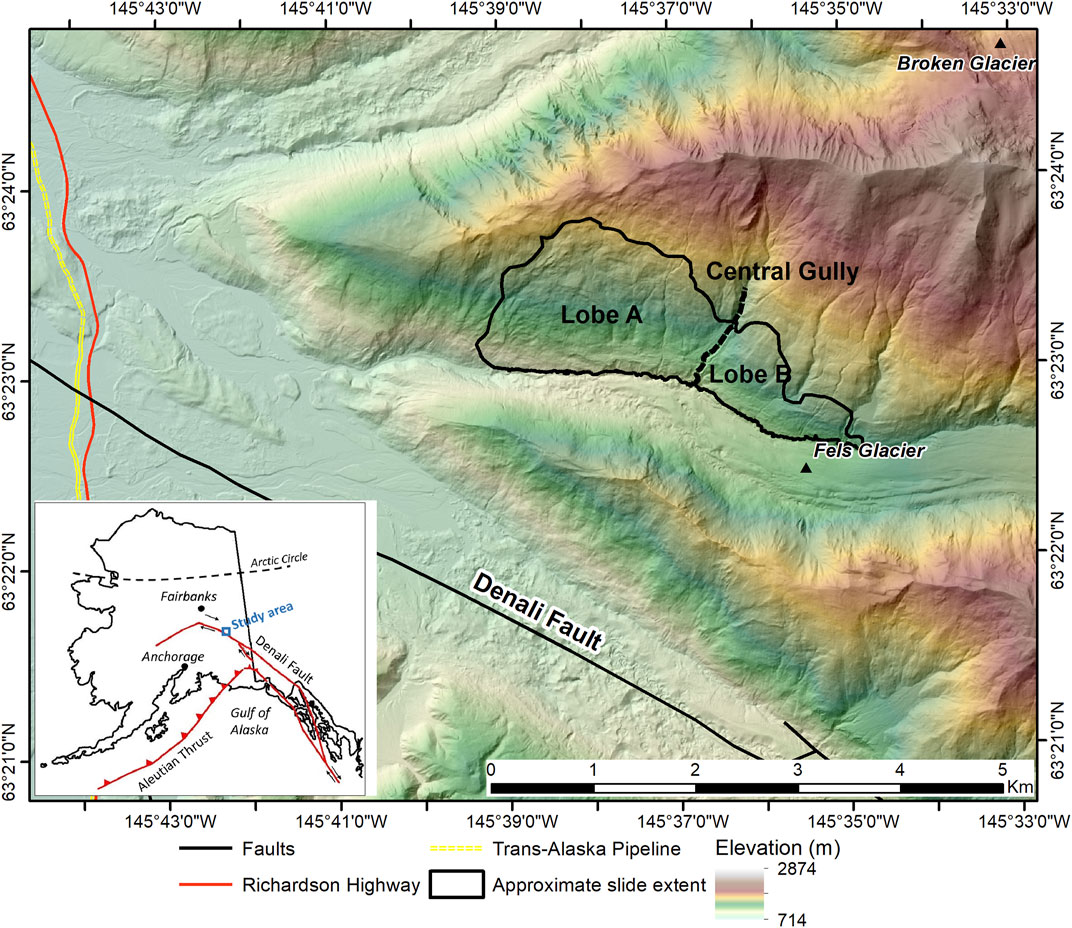
FIGURE 2. The study area. Fels slide is situated above Fels Glacier within about 3 km of the Denali Fault. The slide comprises two lobes A and B, separated by a central gully. Inset map shows the study area location in Alaska.
The bedrock in the affected slope is predominantly quartz-mica schist and quartzite with, to a lesser extent, chlorite-muscovite schist, calc-shist, and marble. This fine-grained agglomerate of metasedimentary rocks is part of the Devonian-age Jarvis Creek Glacier subterrane (Nokleberg et al., 2015). The rock mass is characterized by a pervasive foliation that dips 20°–30° to the south, sub-parallel to the slope surface. Two discontinuity sets are orthogonal to the foliation and to each other. The investigated slope is largely blanketed by a colluvial deposit with local surface instability phenomena (slumps). In the lower part of the slope, a series of nineteenth-century lateral moraines are present on the valley sides, high above the glacier; portions of these moraines have been destroyed or displaced downslope by the DSGSD (Newman, 2013).
The surface of Fels slide exhibits geomorphic evidence typical of DSGSDs, which includes lineaments, antislope scarps, benches, rotational half-grabens, anomalous depressions, and mid-slope ponds. These features, particularly the lineaments, display three principal trends (Donati et al., 2021), suggesting a significant control of geological structures on their development and evolution. The spatial relationship between slope benches and lineaments indicates that the entire slope can be divided into large domains (102 to 103 m across) that deform differentially relative to one another. The movements in the rock mass exploit dipping foliation planes within the metasedimentary bedrock (Donati et al., 2021). The western part of the slope has a prominent gravitational bulge near the base. Stream courses are disturbed locally, and groundwater emerges from the slope in many places. Large secondary debris slides, slumps and rockfalls occur locally within the DSGSD mass (Newman, 2013).
Following the geological work of Newman (2013), Donati et al. (2021) conducted detailed remote sensing investigations and geophysical modeling of Fels slide; using, as model inputs, synthetic aperture radar (SAR) speckle tracking data derived over a 10-year period between 2010 and 2020, together with structural lineament maps and elevation profiles extracted from LiDAR data. Geophysical modelling using the results as input suggested that the slide mass is about 100 m thick, sliding on a multi-planar, foliation-controlled rupture surface within the central and upper slopes (Donati et al., 2021). Rock mass yielding and damage accumulation in the lower slope may allow daylighting of the rupture surface near the toe (Donati et al., 2021). Here, a wedge-shaped block bounded by steep scarps is displacing through a pseudo-roto-translational mechanism and forms the most active part of the landslide (Donati et al., 2021).
Numerous active faults capable of producing strong ground shaking are present near the study area (Plafker et al., 1994; Koehler et al., 2012). The largest of these is the Denali fault, which has generated many strong earthquakes during the late Holocene, most recently on 3 November 2002 when an Mw7.9 earthquake ruptured the ground surface along a 340 km fault segment that intersects the southern margin of the study area. Up to 5.8 m of dextral slip-slip offset was measured where the fault crosses the Alyeska Pipeline about 4 km west of the terminus of Fels Glacier (Carver et al., 2004; Metz, 2004; Plafker et al., 2006). The Denali fault earthquake also caused many rockfalls, rockslides and rock avalanches, and triggered or reactivated DSGSDs in the east-central Alaska Range within 30 km of the study area (Harp et al., 2003; Jibson et al., 2004, 2006).
The climate of the area is continental subarctic with short mild summers and cold winters. At Trims Camp1 5 km NW of the site in the Delta River valley, average mean temperature in July is 11.9°C. The coldest month is January with an average mean temperature of -17.1°C. Average annual precipitation is 930 mm, most of which falls as snow in autumn, winter, and spring. Snow is usually present on the ground from October to May. Roughly, a quarter of the annual precipitation occurs as rainfall, exclusively in late spring and summer.
Our study of the temporal and spatial dynamics of Fels slide uses InSAR data from multiple sensors for different time periods: 1)) European Remote Sensing Satellite (ERS) constellation data specifically ERS-1 and -2 from 1993 to 1997; 2) RADARSAT-1 from 2003 to 2009; 3) The Advanced Land Observing Satellite (ALOS) Phased Array L-band Synthetic Aperture Radar (PALSAR) from 2006 to 2010; 4) RADARSAT-2 from 2010 to 2015; and 5) TerraSAR-X captured from 2015 to 2017. A summary of the SAR sensor parameters and acquisition geometries is provided in Table 1. Because snow fall or melt mostly decorrelates the InSAR signal, almost all interferograms span periods from spring to early autumn.
No local weather records exist within a radius of >100 km of Fels slide, forcing us to resort to ERA5 reanalysis data to generate the meteorological (surface water input) driver series for the period covered by our displacement map series. We combine ERA5 snow melt and liquid precipitation (rain) to construct the surface water input driver series. The seismicity driver series is derived earthquake locations and magnitudes from the United States Geological Survey Earthquake Catalog. For each seismic event, we estimate a local magnitude at the center of Fels slide using a simple attenuation law (Doser, 2009). We consider only events with local moment magnitudes (after attenuation) above Mw 1.0. We chose this magnitude as a plausible, but somewhat arbitrary minimum threshold value for local seismic activity, below which damage to the slope is assumed to be negligible.
For the period of record, we use the ERA5 reanalysis data, earthquake catalogue data, geologic information, and a Digital Surface Model (DSM) to derive suspected landslide driver time series of, respectively, surface water input, projected seismic energy, and progressive glacial debuttressing. Figure 3 shows an overview of these data, including dates of image acquisition, the meteorological inputs, and seismic intensities.
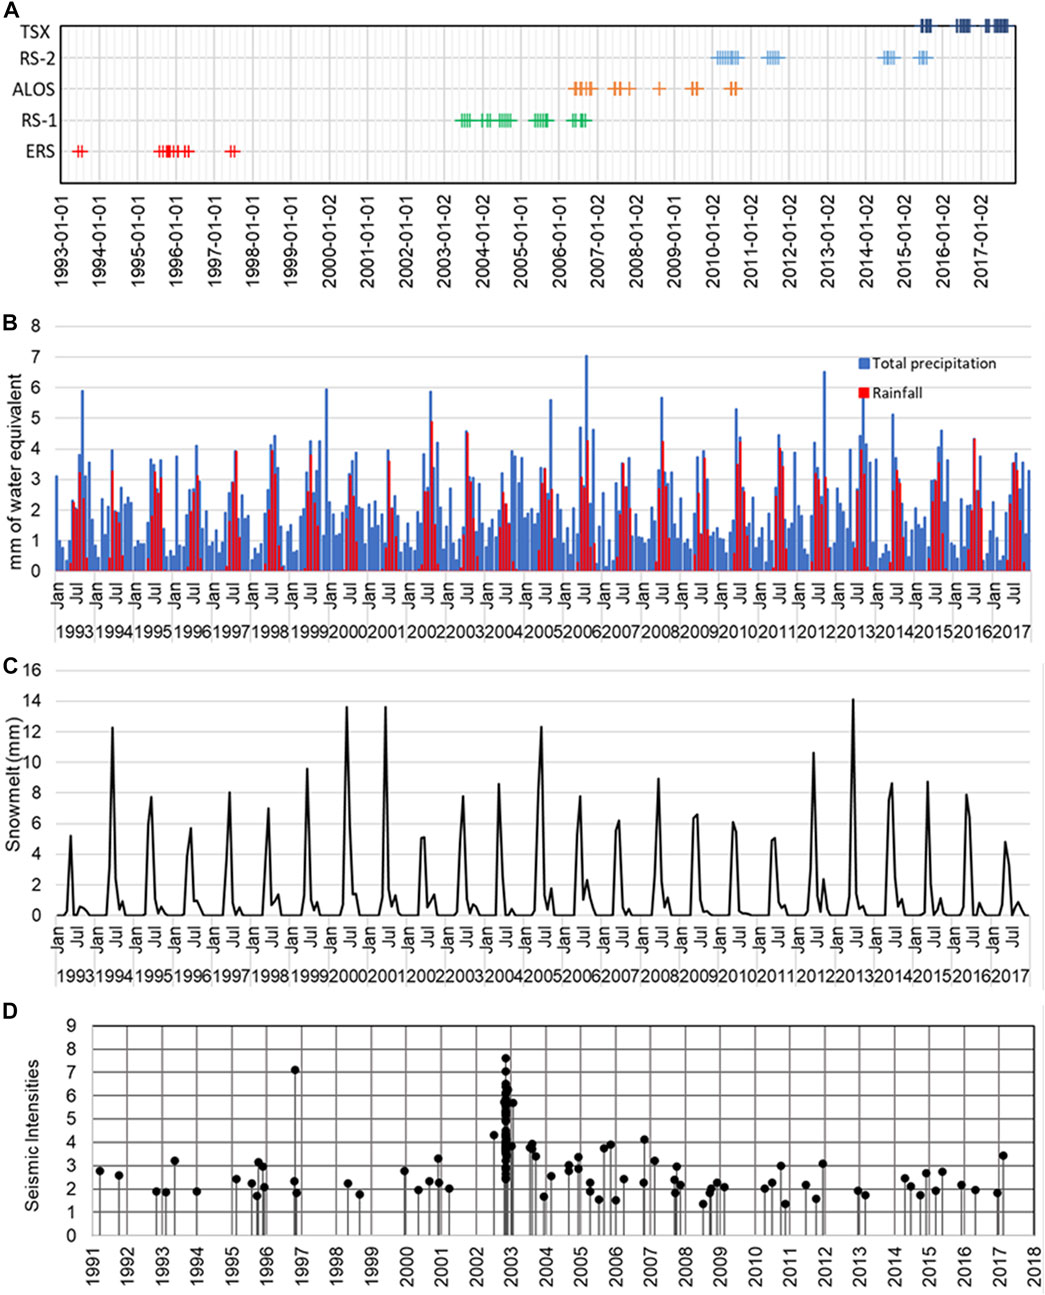
FIGURE 3. Overview of datasets, with (A) satellite data acquisition dates, (B) monthly average precipitation and the rainfall partition (mm of water equivalence (WE)), (C) monthly average snowmelt (mm of WE) and (D) local seismic intensities.
3 Data processing and analysis methods
Figure 4 provides a high-level flowchart of our methodology, as a guide to the following sections describing our data processing and analysis methods.
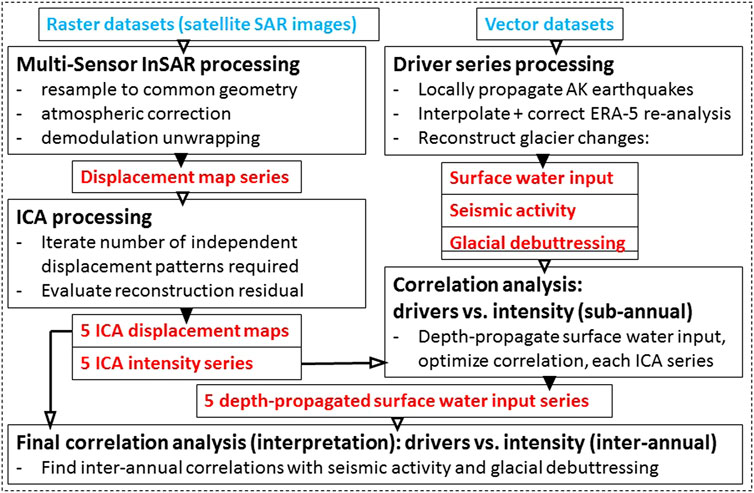
FIGURE 4. Methodology flowchart. Solid and hollow arrowheads indicate outputs and inputs; blue and red print indicate primary input and intermediate products, respectively.
3.1 InSAR data processing
We applied conventional two-pass InSAR processing algorithms to the entire stack of SAR datasets using Gamma RS software within a Python environment to derive InSAR deformation maps with minimal remnants of other phase contributions. The topographic phase component was removed using a 2010 airborne IFSAR DEM2 for the area of interest. The dynamic tropospheric water vapor phase component was eliminated by modeling a plane from three control points outside the landslide that we were confident were stable over the entire time series. Two of these points are located on the same slope as Fels slide, but to the east and west of the landslide, whereas a third point is located on the opposite slope across Fels valley. The static tropospheric water vapor component was modelled as proportional to the reference DEM (Hosseini et al., 2018).
We unwrapped the corrected interferograms using a phase demodulation technique that is optimized for complex, multi-lobed landslides, potentially experiencing local spatial decorrelation and phase aliasing across active faults (Rabus and Pichierri, 2018). The process of phase demodulation involves selecting highly coherent reference interferograms, for which accurate phase unwrapping is possible. Two such reference interferograms were selected. The TerraSAR-X interferogram, derived for the period between 2015/08/03 and 2015/08/14, was used to demodulate the RADARSAT-2 and TerraSAR-X data. The earlier ALOS PALSAR, ERS-1/2 and RADARSAT-1 scenes were demodulated using the 2006/08/04–2006/09/19 ALOS PALSAR interferogram as a reference. The reference TerraSAR-X interferogram is shown in Figure 5A, and an example of a RADARSAT-2 wrapped interferogram used for demodulation is shown in Figure 5B. The unwrapped reference interferogram is used to construct a representative phase surface over which low-coherence areas, such as waterbodies and glaciers, are masked out. We then identified patches straddling strong spatial gradients and phase discontinuities in the reference interferogram. The patches, displayed as black points in Figure 5A, are used to find the optimal local scaling factors for each interferogram that minimize residual phase gradients across discontinuities after demodulation. A continuous 2D surface, called the match factor surface, is then fitted to the local scaling factors using a thin-plate spline. An example of the match factor surface derived for the RADARSAT-2 2014/07/17-2014/08/10 interferogram is displayed in Figure 5C. The reference phase surface is then scaled using the match factor surface and is subtracted from the wrapped interferogram, resulting in a residual phase surface that can easily be unwrapped after low-pass filtering (Figure 5D). The final unwrapped interferogram is produced by unwrapping the residual phase and adding it to the scaled reference phase (Figure 5E).
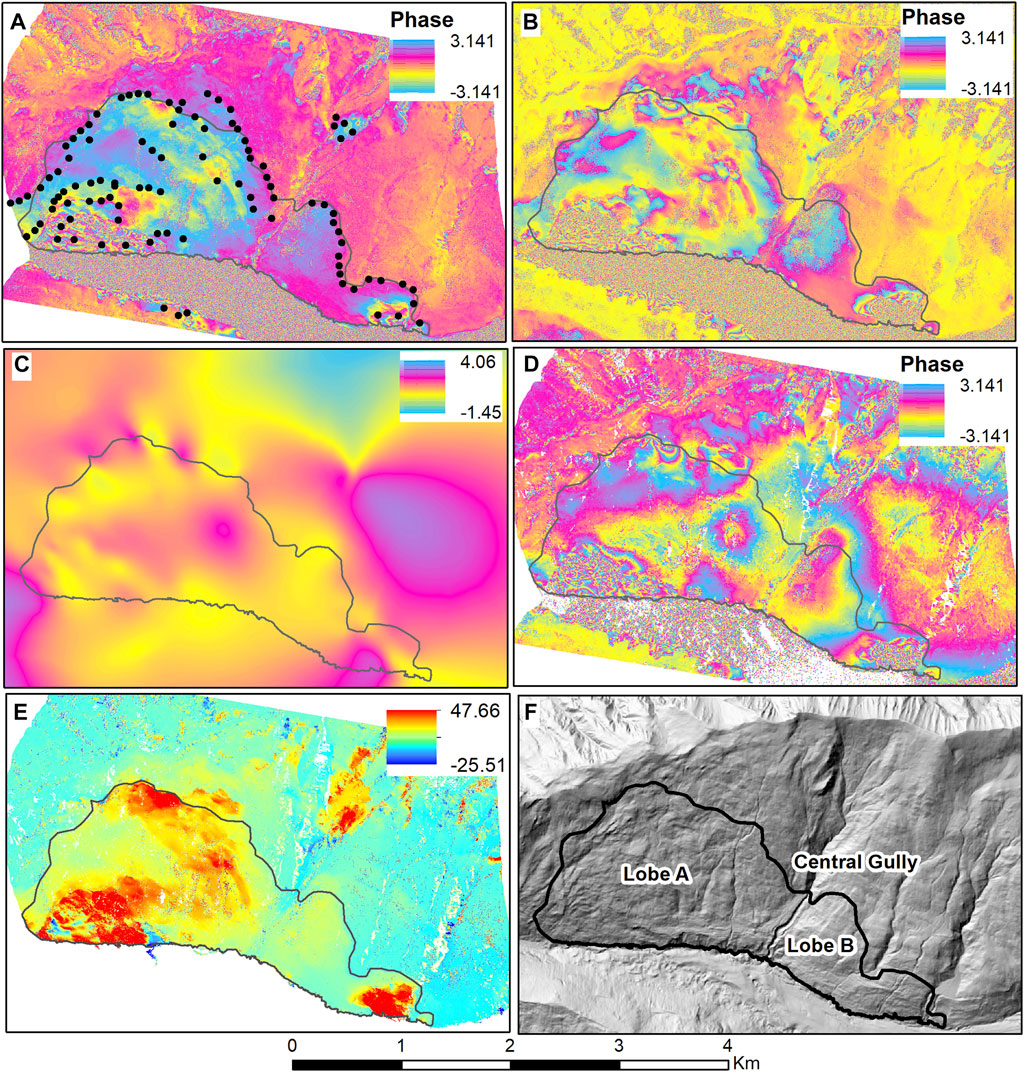
FIGURE 5. The process of phase demodulation (black outline encloses the main active area of the complex composite DSGSD of Fels slide). (A) Reference interferogram and the grid of patches (black points) straddling phase discontinuities and strong phase gradients. (B) RADARSAT-2 interferogram to be unwrapped using the phase demodulation approach. (C) Match factor surface derived from the RADARSAT-2 interferogram to be used to minimize phase gradients. (D) Reference phase scaled using the phase match factor, resulting in a smooth residual phase surface that can be unwrapped. (E) Unwrapped residual phase added to the unwrapped reference phase to produce the final unwrapped phase. (F) Hillshaded DEM showing outline of the active landslide with main lobes indicated.
It is important to note that the purpose of the black outline in Figure 5 is solely to show the main active area of Fels slide. Showing this line does not indicate that we treat the slide as a homogeneously moving unit in our InSAR processing. Fels slide is a complex, composite DSGSD consisting of various, independently moving nested lobes, and our demodulation approach accommodates accurately the independent displacements of these lobes between target interferograms (i.e., those that are the subject of demodulation) and the template. The only assumption we make is that the set of discontinuities (faults) separating the lobes does match between template and target interferograms. Even if this assumption is violated, our approach is robust if faults are active (i.e., separating lobes with differential motion) in the template, but become inactive in the target interferogram. In the opposite case, where new active faults are present in the target interferogram and not the template, the approach will only fail if differential displacement across these new faults is aliased (where the line-of-sight projection of differential displacement between template and target interferogram exceeds half the sensor wavelength). However, we maximize the likelihood that the corresponding sets of faults are preserved between template and interferograms by working with several templates that are close in time to a group of target interferograms that are being demodulated.
Using the TerraSAR-X and ALOS-PALSAR templates, we unambiguously unwrapped the residual interferograms of all datasets and reconstituted them into a single time series of unwrapped interferograms. The unwrapped interferograms also were re-projected to a standardized look direction that we matched to the TerraSAR-X sensor geometry (center incidence angle 44.3°, track angle -169°, according to Table 1). The re-projection assumed displacement to be aligned with the local fall-line direction, as evaluated over a scale of 200 m from the above-mentioned 2010 IFSAR DEM used for the topographic phase removal. Although fall-line parallel displacement is a generally good assumption for gravitational mass movements, it is not exactly true. Nevertheless, as Table 1 shows that, except for ERS, track and incidence angles for individual sensors only range within, respectively, +/-2 and +/-7° from the TerraSAR-X reference geometry. As a result, the error sensitivity of the re-projection to out-of-fall-line displacement components should be exceedingly small almost everywhere. The corresponding raster maps of the re-projection factors that we calculated for the individual sensors corroborate this, as values for the factors are close to one.
A further important point in the case of Fels slide is that a one-dimensional time series constructed from descending orbit geometries is the best that can be done when using only InSAR methods; even so the descending line-of-sight geometry can capture only a fraction of the full displacement (see Section 5). The reason is that the other, ascending line-of-sight, geometry is almost completely insensitive to the main motion direction of the slide and therefore can add very little additional information. As we saw, the differences in the incidence angles for simultaneously available sensors are also very small, which means that there is little value in analyzing their InSAR time series separately. Consequently, two- or three-dimensional InSAR displacement analysis using a combination of ascending and descending orbits is not feasible for this slide. However, a robust inversion of three-dimensional displacement on considerably longer temporal and coarser spatial scales is possible for Fels slide by using speckle tracking methods to determine both line-of-sight (range) and track parallel (azimuth) displacements from ascending and descending geometries (as discussed in Section 5).
The time series of multi-sensor descending geometry interferograms and corresponding results of the demodulation unwrapping are provided as Supplementary Appendix SA. While no independent ground truth is available for cross-checking, each interferogram used in the subsequent analysis has been thoroughly validated manually to rule out contamination of the displacement map time series through errors in our InSAR processing method. The potential bias due to only observing 1D displacements (descending look direction) is discussed later (Section 5; Figure 15).
3.2 Driver data processing
The movement of Fels slide and similar DSGSDs may result from several drivers. Likely the most important driver is surface water input into the slope. Surface water input results in an increase in pore water pressure, which reduces effective stresses and shear strength (i.e., the frictional resistance) along the rupture surface. Rainfall infiltration may also increase weathering, leading to a loss of cohesion. Additional drivers are local and distant earthquakes and glacial debuttressing, both of which might enhance the entry of water into the slope (through dilation of fractures) or create stresses that are relieved by downslope movement. The combined effect of driving forces on slope deformation and damage accumulation (as a fatigue process) directly affects slope stability and depends on the inter-play among the different loading forces.
We distinguish “primary” drivers that are causes of slope deformation but are independent of slide-internal parameters, from “effective” drivers that do involve the effects of internal parameters. For example, rock damage as an internal parameter can increase driving forces (reduced resisting forces), which modulates the resulting slope deformation due to a primary driver such as surface water input. An effective surface water input driver series can be constructed for a particular rock mass domain that implicitly contains the effects of the internal damage. In practice, effective driver series can be generated from primary series using non-linear, lag-inducing kernel filters that model the evolution of the net effect of slide-internal parameters (e.g., hydrological drainage of the slope or failure of rock bridges along and between slip horizons). By introducing effective driver series, we can provide a better approximation of a direct (multi-)linear correlation between drivers and observed surface displacements. However, the effective driver series are specific to individual slide domains and thus we can generate them only after we decompose surface displacements into deformation patterns of parts of the landslide moving semi-independently of one another. The method we use to decompose the surface displacement field into its components is described in Section 3.3, with results presented in Section 4.
In this section, we show the primary driver series. For the seismic driver only, we show additionally a block-filtered version of the primary driver as a crude qualitative example of how an effective seismic driver series for an individual domain of the slide might look. For the hydrological driver (surface water input), corresponding effective driver series reflecting internal parameters, such as drainage characteristics of each identified landslide domain (Section 3.3), are generated in Section 4. The primary debuttressing driver is too sparsely sampled to speculate about its effective driver series, either here or after the decomposition of the surface displacement field.
3.2.1 Surface water input
ERA-5 reanalysis data (Figure 3) were used to generate a hydrological (liquid surface water input) driver series over the observation period. The ERA-5 data product covers Earth on a 30-km grid and resolves the atmosphere using 137 levels from its surface to an altitude of 80 km, which provides vertical (elevation) resolution of better than 600 m. We interpolated the corresponding hydrological driver time series for a single location (latitude 63.42°, longitude 145.62°) near Fels slide. We used a temporal block smoothing kernel of 24 h (1 day) to create the time series. We can assume that finer-scale spatial fluctuations of the data can be neglected within the margins of uncertainty of the ERA-5 data product. However, we discovered an unrealistic excess of snow in summer and a crosscheck of the snowpack evolution at the site, obtained by cumulating snowfall minus snowmelt, also resulted in net snow accumulation, indicating that meteorological conditions are somewhat too cold for the slope of Fels slide. We established approximate linear correlations between the ERA-5 skin temperature and snowmelt variable as well as between skin temperature and the ratio of rainfall (calculated as total precipitation minus snowfall) and snowfall of 0.04 mK–1 and 0.083 K-1. Using these we found that a skin temperature increase of 0.125 K corrects the ERA-5 snowfall, rainfall, and snowmelt series to make seasonal and inter-annual snowpack evolution match the one we observed during field visits and by inference from the InSAR coherence time series. The hydrological time series was extracted by calculating the sum of the accumulated rainfall and snowmelt (temperature adjusted as described). The corresponding monthly average liquid water input over the time series is presented in Figure 6A. To illustrate the seasonal fluctuations observed over a typical annual cycle, we present the average bi-weekly water input in Figure 6B.
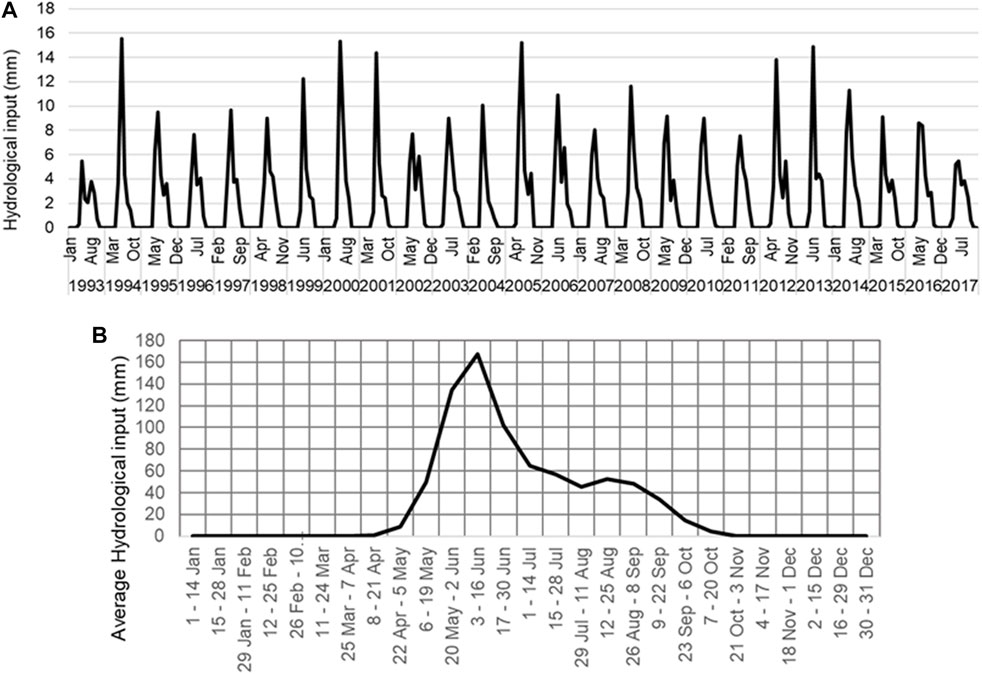
FIGURE 6. (A) Monthly average liquid water input (snowmelt plus rain) extracted from the primary hydrological driver time series. (B) Average bi-weekly water input over a typical annual cycle.
Surface water input is a primary driver series that we later transform into effective driver series for the identified independent surface deformation patterns (landslide domains) as is described in Section 4.
3.2.2 Seismic activity
Seismic activity can have significant impacts on both the short- and long-term stability of landslides. In the short term, earthquakes induce a loading force on the landslide body, temporarily decreasing the factor of safety of the slope (Jibson, 2011). A decrease in the shear strength along the rupture surface can also occur due to increased pore water pressure due to seismic dynamic loading. In the long term, ground shaking due to subsequent earthquakes can produce cumulative fracturing and rock mass damage within the slope, which is therefore progressively weakened (Gischig et al., 2015). This process is commonly referred to as “seismic fatigue” and causes the stability of the slope to decrease over time. The progressive accumulation of seismic-induced damage may result in i) the occurrence of slope failures even during earthquakes with magnitudes lower than previously recorded events, and ii) an increased seismic amplification due to topography, tension cracking and material contrast near the slope surface (Gischig et al., 2015). Additionally, the decreased factor of safety can promote the occurrence of landslides triggered by other factors, such as rainfall (Gischig et al., 2016). Increased rock mass fracturing as result of earthquake events can also produce a change in sensitivity to the surface water input driver (Bontemps et al., 2019, 2020).
In this research, we constructed a primary driver that is representative of local seismic energy generated by earthquakes at different distances from Fels slide. We accumulated local seismic activity above the filtering threshold of Mw 1.0 (as described in Section 2) for each day to form a sparse time series (most days have zero values). Finally, from this primary driver of local seismicity, we produce a qualitative effective seismic driver that implicitly models some of the internal damage of Fels slide. Observing higher-than-usual displacements of Fels slide following the November 2002 Denali earthquake until and including the summer 2006, we simply smoothed the sparse seismicity series with a backward-looking block filter of 4 years length. Both the primary driver of local daily seismicity and this effective seismicity driver series are displayed in Figure 7.
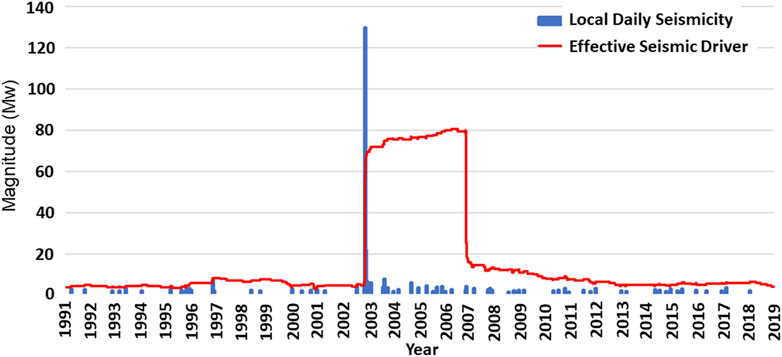
FIGURE 7. Seismic activity resulting from local and distant earthquakes projected to the center of Fels slide. Blue bars mark the daily seismic energy at the location of Fels slide. The red curve is the resulting effective seismic driver constructed using a 4-year block filter to reflect the evolution of the slide mechanics. Energy release by the 2002 Denali earthquake and its aftershocks dominates the seismic driver.
3.2.3 Glacial debuttressing
Construction of a glacial debuttressing driver for Fels slide must rely on a crude interpolation of sparse records. Therefore, we expect a much larger error for this time series compared to those of the meteorological and seismic drivers. Although more difficult to quantify, the glacial debuttressing driver is expected to be of equal importance to other drivers, particularly for understanding the longer-term behavior of Fels slide.
An increase in the spatial distribution of deep-seated slope deformations since the end of the Little Ice Age (LIA) has been linked to the progressive thinning and retreat of alpine glaciers (Evans and Clague, 1994; Holm et al., 2004). The factors influencing slope stability in glaciated landscapes include ice mass distribution, hydrological conditions, glacial erosion, seismicity, and vegetation dynamics (McColl, 2012). Removal of lateral ice support can induce stress release and the formation of exfoliation joints that dip downslope towards the receding glacier, thus promoting the detachment and displacement of the weakened rock mass (Leith et al., 2014). The influence of changing water pressure during glacier loading cycles on the stress field of rock slopes have also been demonstrated to result in slope displacement during glacier retreat (Grämiger et al., 2020). The resulting damages also fluctuate with seasonal groundwater fluctuations (Grämiger et al., 2020; Hugentobler et al., 2022) highlighting the importance of including groundwater changes when considering rock slope damage. Further, glacial debuttressing can significantly affect the stability of valley slopes by allowing structural features, such as bedding planes, foliation, faults, and structural discontinuities to daylight (i.e., intersect the ground surface), enhancing kinematic freedom for incipient landslides and promoting further slope deformation (Kos et al., 2016). While the slope support from valley glaciers have been shown to have little influence on rockslide stability, viscous ice deformation has been shown to have a mediating influence on the displacement velocities of landslides (Storni et al., 2020).
Since the end of the LIA in the late 1800s, Fels Glacier has retreated more than 2 km, freeing the lower part of the valley of ice. Howley (2008) dated the stabilization age of the outermost LIA moraine of nearby Castner Glacier to 1840. We assume that the corresponding outer LIA lateral moraines in Fels valley have the same age (Figure 8A). The LIA maximum extent of Fels Glacier is marked by lateral and terminal moraines. Within the area of Fels slide, the glacier surface has lowered 100–200 m (average = 150 m; Figure 8B). The earliest topographic map of the area, published by the United States Geological Survey in 1954, was produced from aerial photographs flown in 1949. After that time, aerial photographs, airborne IFSAR (2010) and two detailed LiDAR surveys (2014 and 2016) have provided a more detailed picture of the continuing recession and thinning of the glacier.
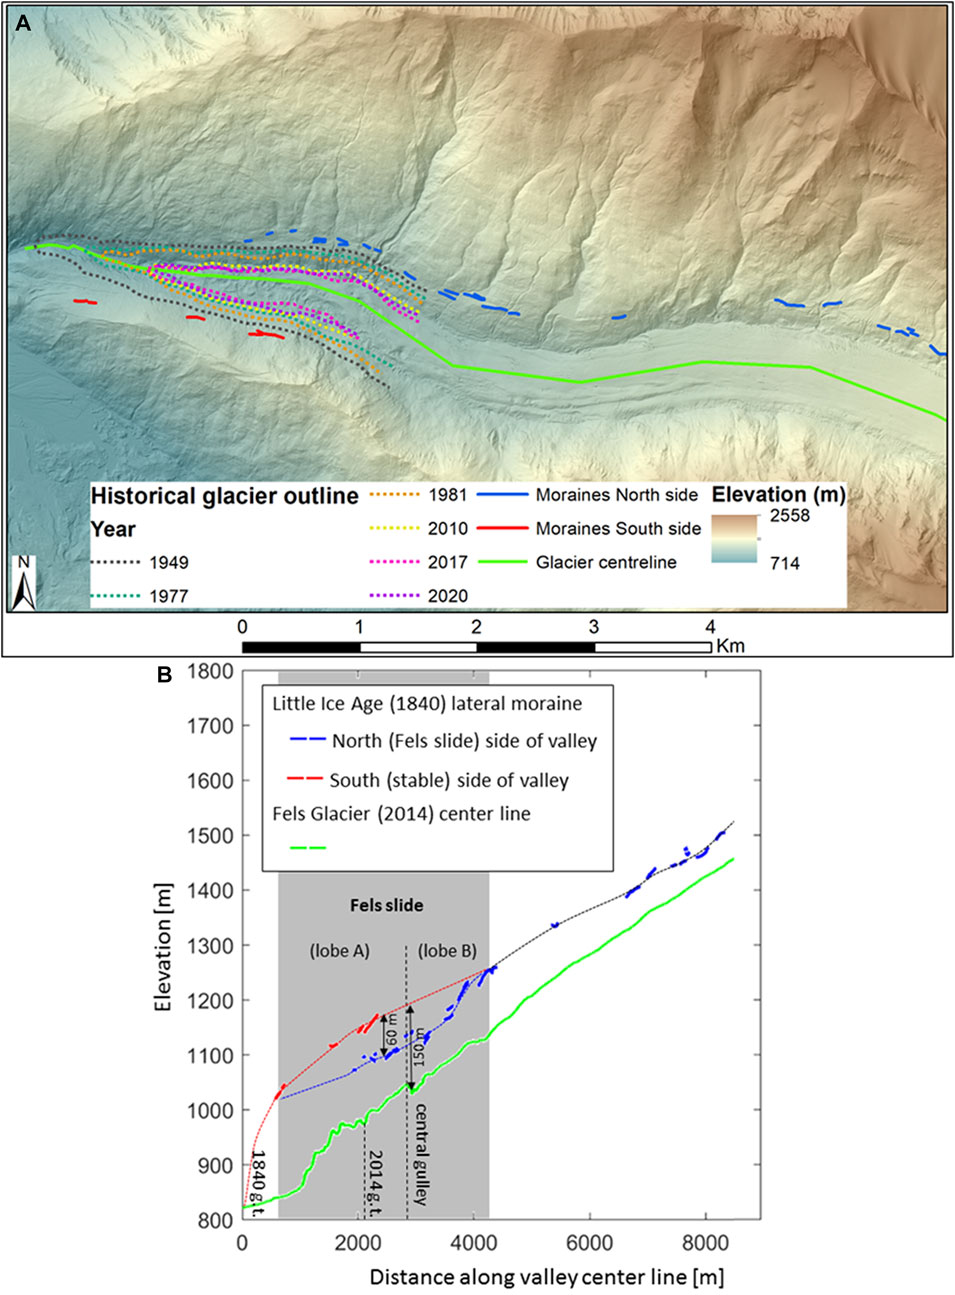
FIGURE 8. Long-term recession and downwasting of lower Fels Glacier inferred from Little Ice Age (LIA) moraines that stabilized around 1840. (A) Remnants of LIA maximum moraines in Fels valley (red and blue line segments) superimposed on a LiDAR-derived topographic map. The outlines of the glacier terminus, derived from aerial photography, are shown for different years. (B) Elevation of the Fels valley center line (green line, extracted from the 2014 Lidar DEM) and elevations of the remnant LIA lateral moraines on the north (blue) and south (red) valley walls, registered perpendicularly to the valley center line. Note that the moraine segments that remain on the north valley wall within the area of Fels slide are lower than those on the south valley wall. This difference is due to downslope movement and destruction of the north-side moraines by the slide since about 1840. The relative positions of the glacier terminus (g.t.) in 1840 and 2014 are also indicated.
LIA moraines on the north side of Fels valley (blue lines in Figure 8) have been destroyed by downslope movements within the fastest moving part of the landslide. Where they still exist, the north-side moraines are about 60 m lower compared to their opposing south-side counterparts (red lines), which is due to downslope movement and deformation within Fels slide since about 1840. Based on the elevation of the (stable) south-side moraines and the time passed since the moraines were built, we calculate an average ice-surface lowering rate of 150 m/174 years ≈0.9 m/yr since 1840. A further constraint is provided by comparing 1949 air photographs with our 2014 LiDAR-based DEM. This comparison indicates an average rate of ice-surface lowering of 1.25 m/yr over the period 1949–2014.
Donati et al. (2021) provide a preliminary analysis of recent retreat of Fels Glacier and surface deformation (lineation density and length) of Fels slide. They tracked retreat of the glacier toe over time in six air photographs (1949, 1977, 1981, 2010, 2017, and 2020). The toe of the glacier retreated about 1 km between 1949 and 2017; no significant change in the rate of retreat of the glacier was found within this time window. We assume the same to be true for the corresponding rate of thinning of the ice surface adjacent to Fels slide (assuming a temporally constant surface slope of the ice). While the rate of glacier thinning has varied little since 1950, the same air-photograph time series suggests a disproportionate increase in the rate of surface cracking of the slide mass around 1980 (Figure 9). This finding suggests that: i) the lateral load exerted by the glacier became insufficient to prevent slope deformation; ii) the basal sliding surface of the landslide daylighted, at least partly, in the lower slope; or iii) the seismic driver was activated during an earthquake prior to 1980 (our seismic activity series described in Section 3.2.2 begins only in 1990). A combination of the three processes is also possible.
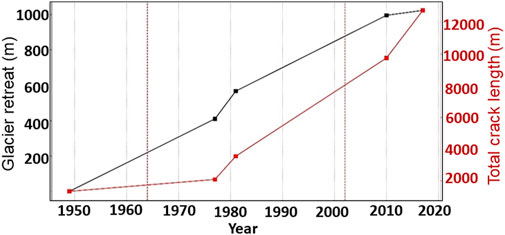
FIGURE 9. Retreat of Fels Glacier terminus and surface cracking at Fels slide obtained from air-photograph analysis. The terminus position (black curve) is shown relative to the 1949 position. Retreat is near-linear over the entire period, while the rate of surface cracking (red curve) increases around 1980. The vertical red dashed lines indicate the dates of the 1964 Good Friday and 2002 Denali earthquakes, respectively. The position of the glacier terminus scaled with the tangent of the glacier surface slope of 5° produces the corresponding ice thinning time series at the toe of Fels slide (glacial debuttressing driver–proportional to black curve).
Figure 9 suggests that a suspected delayed (non-linear) response of the slope to ongoing deglaciation initiated around 1980, and since then there have been near-constant rates of surface cracking and glacier retreat. The slope of the glacier surface at the location of Fels slide is about 5° based on the elevation profile in Figure 8B. Using this value, we convert the observed average terminus retreat rate of 15 m/yr (1,020 m/68 years) to an average ice surface lowering of about 1.3 m/yr (15 m/yr x tan 5°), which is generally consistent with the value derived from the 1949 air photographs. Consequently, we simply scale the terminus retreat time series (black line in Figure 9) with the tangent of the ice surface slope to construct our final glacial debuttressing driver.
3.3 Independent component analysis
We expect that multiple deformation processes contribute to the overall displacement of Fels slide over time. Hydrological conditions, seismic events and glacial debuttressing will affect the movement of the slope to different degrees over time. When deformation signals are temporally correlated (i.e., spatially overlapping domains moving at different rates during the same time intervals), their effects will be superimposed in the interferograms, making it difficult to isolate one from another.
To overcome this problem, the Independent Component Analysis (ICA) approach has been proposed to objectively separate signals in InSAR datasets. ICA enables automatic detection of different deformation-induced signals in an InSAR time series (Ebmeier, 2016; Gaddes et al., 2018). The ICA approach assumes that the component source signals have non-Gaussian probability density functions and that the sum of these constituent probability distributions tends towards a Gaussian distribution. The assumption of statistical independence makes it possible to find a unique solution to the decomposition of a mixed signal. This approach has been used in exploratory analyses of InSAR data. When combined with a cluster analysis strategy to isolate geomechanical processes, ICA can be used to test if multiple displacement patterns behave independently over time (Ebmeier, 2016).
To isolate characteristic, temporally independent, surface deformation patterns, we subjected the complete InSAR displacement map series at Fels slide to ICA implemented in the Fast ICA algorithm (Varoquauax et al., 2012). We chose dimensional decomposition of the ICA as the spatial domain, meaning that the ICA results are statistically independent eigen-maps of displacement patterns that are superimposed with different relative strength (eigen-time series) due to both seasonal and long-term evolution of the landslide as it responds to the geophysical drivers. We interpret the eigen-maps as the surface expressions of displacements of potentially independent areas, or deformation domains, along the basal failure surface at depth. The deformation domains have different, temporally independent sensitivities to the dynamic drivers.
4 Results
Our experimentation with ICA for the time series of unwrapped interferograms suggests that the variance in the data can be explained by five independent deformation patterns (IDPs) that are shown in Figure 10, together with their relative intensities in the time series. The five IDPs are interpreted as reflecting the independent deformation of the landslide domains composing the slide. The landslide domains corresponding to the IDPs are believed to be parts of the landslide that are differently affected by the investigated drivers due to lithological, structural, and geomorphic characteristics, as well as the depth and orientation of the underlying failure surface. However, the presence of internal, active shear zones affecting the extension of the IDPs cannot be ruled out based on the available data. Different landslide domains (with local failure mechanisms) can have different sensitivities to the primary driver series. We further assume that the sensitivity to the hydrological driver will be constant over a single summer season but may change over periods of two or more years due to the long-term effects of all three primary drivers on the internal characteristics of the Fels slide.
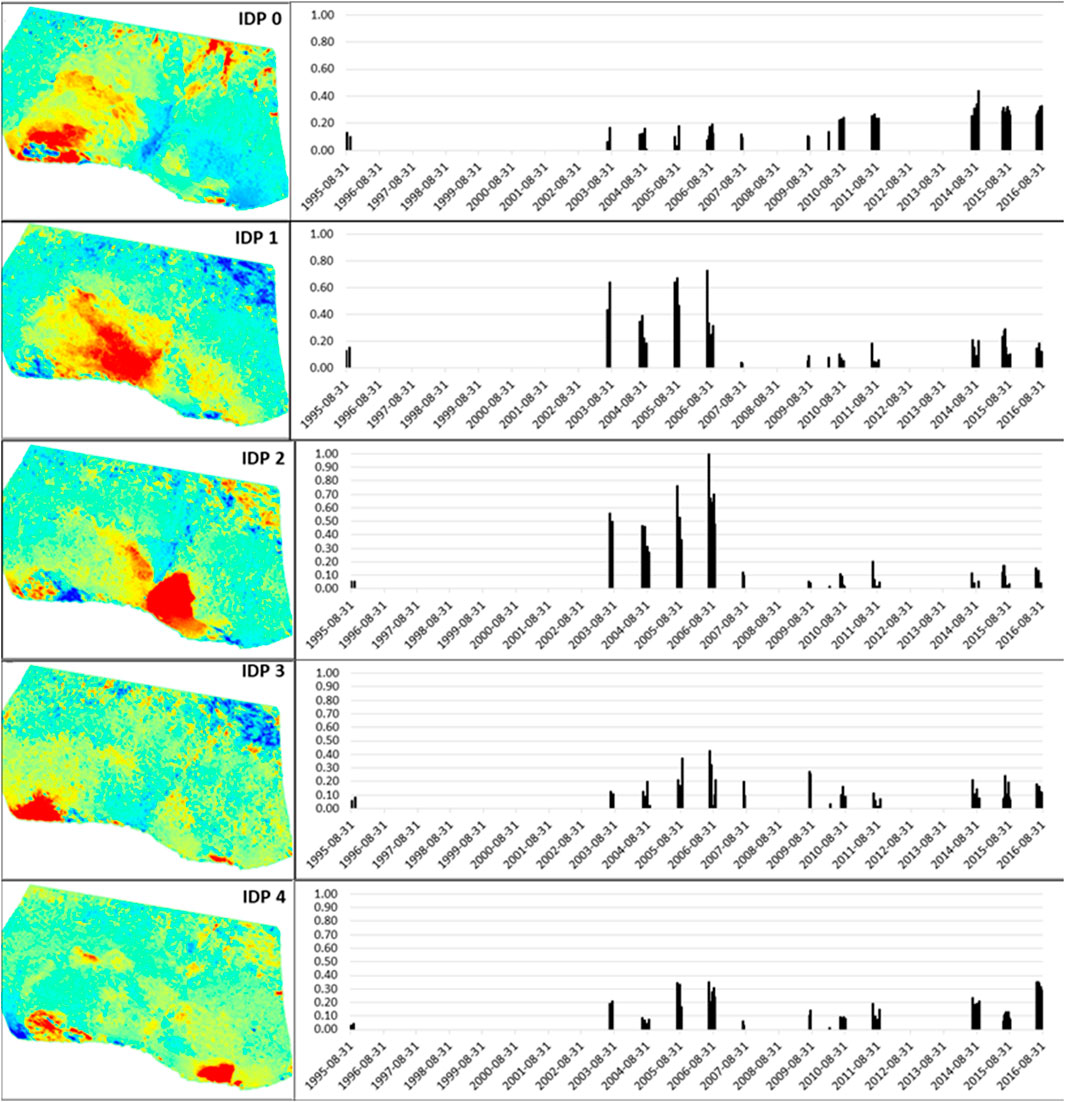
FIGURE 10. Five independent deformation patterns (IDP) identified by the Independent Component Analysis (ICA) and their relative intensities over time.
The identified IDPs shown in Figure 10 define areas within the slope that are particularly affected by the primary drivers. These areas appear to be outlined by linear features that accord with the major trends of lineaments identified in Donati et al. (2021) (Figure 11). Therefore, it can be assumed that the structural geology of the slope controls not only the boundary of the landslide but also domains that have different deformation behaviors relative to a specific primary driver.
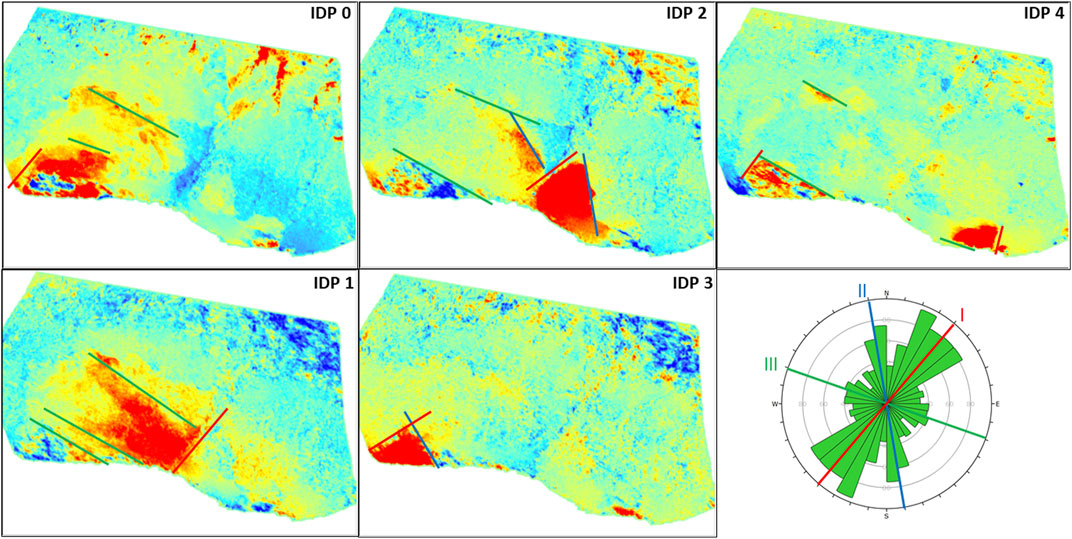
FIGURE 11. Prominent lineaments overlain on the IDP maps and colour-coded on the basis of orientation. Note the similarity between the IDPs and the major lineament trends. The rosette plot displays the trends of the mapped lineaments as identified by Donati et al. (2021).
The time required for surface water to infiltrate the slope and decrease effective stresses along basal and internal shear zones is governed by many factors (e.g., porosity, permeability, rock mass fractures, tension cracks, and possible indirect gravitational loading by frozen water/snow) is unknown. Consequently, the corresponding shape of the non-linear filter required to construct effective hydrological driver series for the IDPs from the primary surface water input series is also unknown. However, as we are superposing many individual statistical processes, we should be able to model the sum process as net Gaussian described by two parameters: a window (standard deviation of Gaussian) and a time lag, both measured in days. Our method for fitting these two parameters involves identifying all years with more than five component intensity datasets. We then carry out a combined seasonal correlation of annually normalized component intensities with the propagated hydrological driver series calculated over a reasonable parameter space (lags from 0 to 50 days, standard deviation from 0 to 25 days). For each of the IDPs, we identify the optimum lag and smoothing width at which the seasonal correlation (expressed as the average of the sub-annual correlation coefficients for years with >5 data points) is a maximum. We represent this as a global maximum in a 2D correlation coefficient contour plot, with vertical and horizontal axes corresponding, respectively, to Gaussian standard deviation and time lag. The optimum Gaussian parameters produce maximum seasonal correlations between the effective (smoothed and time-propagated) hydrological driver and the IDP intensities. Maximizing the average sub-annual linear correlation between the effective hydrological driver and the IDP intensities, in turn, allows us to estimate a mean annual activity factor series for each IDP. Figures 12A,B illustrate our method for the sub-period of the 4 years after the Denali earthquake for the representative examples of IDP 2 whose intensity reacted strongly to the earthquake, and IDP 4, which only reacted weakly (according to Figure 10). The component intensities of both IDPs show short-term temporal correlation with their respective effective hydrological driver series.
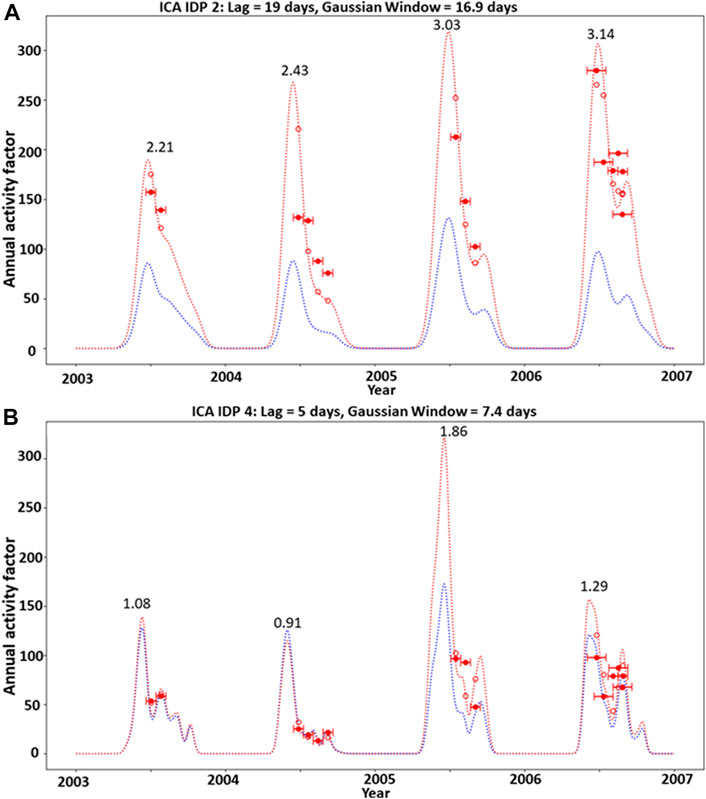
FIGURE 12. Short-term temporal correlation of displacement pattern intensity and effective driver series for the examples of (A) IDP 2 and (B) IDP 4. Shown are the IDP intensities (red dots), the effective (filtered and propagated) hydrological driver (blue dashed line), and the seasonally linear fitted effective driver (red dashed line) for the period 2003–2007. Numbers are the multiplicative factors required to turn the blue curve into the red curve (annual activity).
A limitation of this approach is the temporal sparseness of the ICA dataset, which can bias parameter inversion. For the ICA analysis, we could only use a subset of 52 of the 78 interferograms that have adequate coherence over the entire slide footprint. To study the robustness of our parameter inversion method with respect to dataset size and distribution, we created an additional intensity time series by documenting the magnitude of a displacement gradient along a small strip-shaped area leading from the slide toe toward the center of lobe B (outlined in red in Figure 13A). This mostly bare rock area has generally high coherence, and we can construct a corresponding mean annual activity factor time series using all 78 interferograms (Figure 13B). We then applied our method of finding optimum Gaussian parameters for the hydrological driver to this displacement gradient series; either using all interferograms or just those of the ICA subset (Figures 13C,D , respectively). Comparing the two results suggests that, in this case, applying our fit method to the reduced dataset of interferograms used by the ICA only moderately changes the Gaussian window parameter, while the lag appears somewhat less well constrained. In summary we conclude that our method should be applicable for the ICA component intensities that are only available for the reduced dataset. The derived lags and Gaussian windows for the individual IDPs, as well as the active lobe gradients used for the sensitivity test, are summarized in the first two columns of Table 2. This table further compares the seasonal correlation of the displacement intensity with the primary hydrological driver (third column) with that of the effective driver propagated with the optimum Gaussian parameters (fourth column).
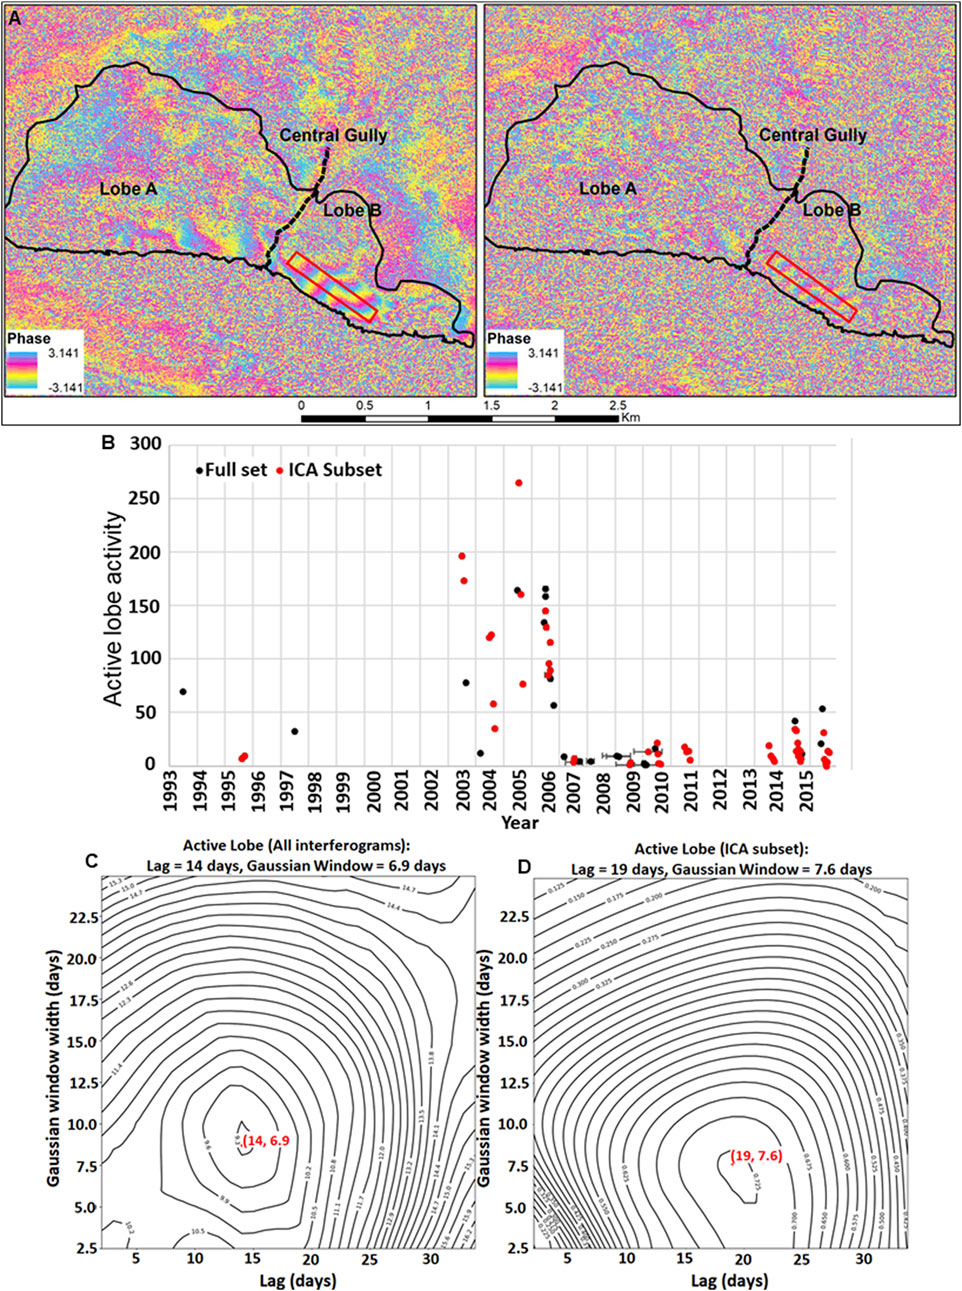
FIGURE 13. Results of our investigation of robustness of Gaussian parameter inversion for propagation of the hydrological driver to depth. (A) Example of interferograms with low temporal correlation, showing the area (outlined in red) that maintains coherence. (B) Displacement gradient time series for the full InSAR dataset (black dots) and the subset used for ICA (red dots). (C) 2D correlation contour plot of average sub-annual correlation coefficient between gradient magnitude of the full InSAR dataset and the propagated driver; best-fit parameter results (lag, standard deviation) indicated in red. (D) Equivalent to plot C but with displacement gradient magnitudes derived only from the ICA InSAR subset.
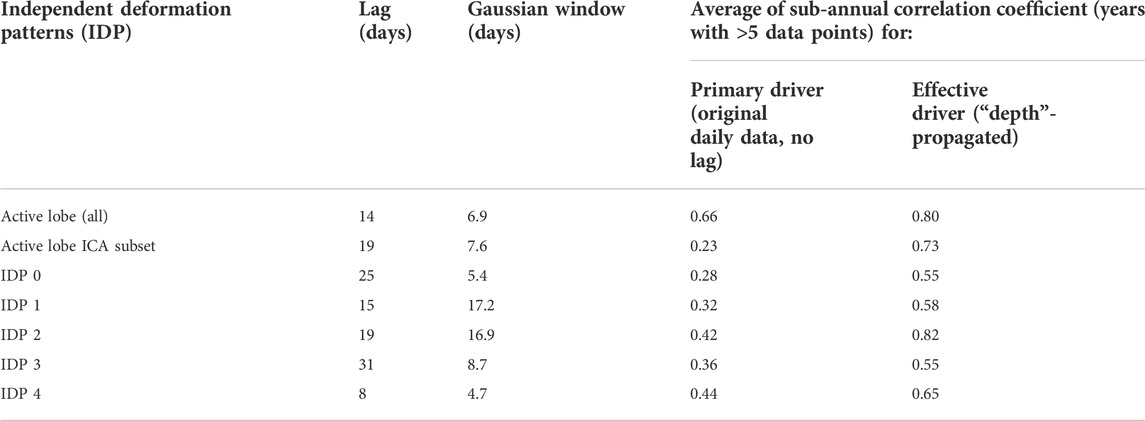
TABLE 2. Gaussian parameters for “active lobe” displacement gradient and IDP intensities for the effective (propagated).
We compare individual IDP intensities to individual effective driver series to study their relationship. IDP intensities and the respective seismic, hydrological and deglaciation drivers are displayed in Figure 14 for IDPs 0, 1, 2, 3, 4 (labeled IDP0 to IDP4, respectively).
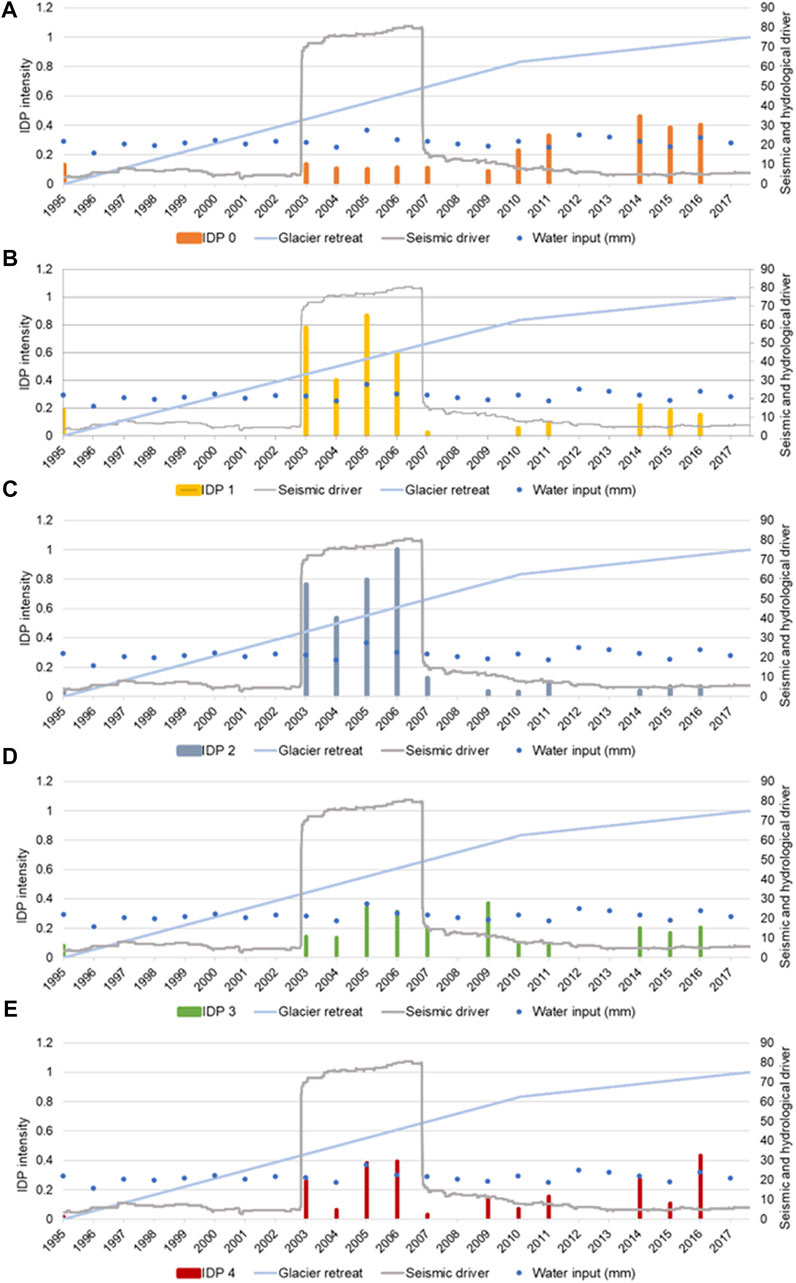
FIGURE 14. Independent deformation pattern intensities and their respective driver series for IDP0 to IDP4 [(A–E) respectively].
5 Interpretation and discussion
Our spatial segmentation of surface displacement into independent deformation patterns (IDPs) suggests that we can identify the independent domains and their response to the drivers affecting the Fels slide. We observe a short-term (seasonal) correlation between the intensities of the IDPs and effective hydrological driver series (for example as seen in Figure 12A,B). However, we cannot yet identify a significant long-term (multi-annual) multi-variate relationship between slip intensity and the combined hydrological, deglaciation and seismic drivers (Figure 14), aside from the obvious increase in intensity of IDP1 and IDP2 that occurred immediately after the Denali earthquake and lasted for about 4 years. The absence of a discernable long-term relationship between the modeled drivers and slip intensities is likely due to the inability of our approach to account for geomechanical processes involving the progressive accumulation of damage within the slope, such as rock mass fatigue and creep. These processes are an additional, very important driver of landslide behavior.
The combined effects of driving forces on slope deformation and fatigue processes are discussed by Gischig et al. (2016) and depend on the interplay between different loading forces. The effects of progressive fatigue on resisting forces imply that rock mass strength is not a static property; rather, it changes due to progressive degradation of the slope. Gischig et al. (2016) also highlight the different effects of seismic and hydromechanical fatigue on slope stability. In our investigation, hydromechanical fatigue, driven by surface water input and freeze-thaw activity, can be considered progressive, involving a long sequence of annual cycles. However, this fatigue might be limited to the upper parts of the rock mass. In contrast, rock mass fatigue induced by earthquakes occurs infrequently, but can cause greater damage by forming and propagating fractures both near the surface and at depth within the slope, particularly near the head of the slide. This damage is typically spatially more extensive than that caused by hydrologic drivers (Gischig et al., 2016). However, seismic amplification due to material contrast is exacerbated by the accumulation of fractures at the slope surface, regardless of the process that creates them. In other words, damage driven by hydromechanical processes, freeze-thaw cycles, as well as glacial retreat and debuttressing (Evans and Clague, 1994; Holm et al., 2004; Grämiger et al., 2017) can collectively increase seismic ground motions. At the Fels slide, the progressive increase, over the past decades, in surface damage with glacier retreat likely has made the slope more susceptible to seismic amplification and, in turn, to co-seismic and post-seismic activity, even if no rapid movement occurred during the 2002 Denali earthquake.
The progressive degradation of rock mass strength due to debuttressing of oversteepened slopes as glaciers retreat has been described by several researchers. The effects are manifested as deep-seated slope movements and active rockslides near LIA trimlines (Holm et al., 2004). Slope deformation and landslides can occur when a glacier retreats, leaving over-steepened slopes and an unsupported volume of rock. Displacements may occur along discontinuity planes that daylight in the exposed glacially steepened slope. Retreat of Fels Glacier may have increased rock mass damage in the toe area and contributed to the development of the multi-planar rupture surface inferred by Donati et al. (2021).
In this study, we explored the seasonal and episodic behaviour of Fels slide and extracted the dominant driving mechanisms using a long series of InSAR acquisitions. Based on our identification of different IDPs (Section 3.3; Figure 10), we systematically compared the different IDP intensities with seismic, hydrological and glacial driving forces (Section 4; Figure 14) to infer the interplay among drivers and their effects on different parts of the landslide.
We interpret the independent deformation pattern 0 (IDP0) as being primarily driven by glacier retreat due to its proximity to the glacier terminus at the toe of the landslide. We observe a progressive increase in the amplitude of the deformation in IDP0 over time, especially after 2010 (Figure 14A), coinciding with an increase in the rate of surface cracking (Section 3.2.3; Figure 9). The relatively consistent rate of the deformation after the 2002 earthquake, however, suggests that this IDP was not affected by the earthquake. However, progressive degradation of rock strength due to deglaciation and debuttressing may have made IDP0 more susceptible to the hydrological driver. The apparent correlation between toe deformation and glacier retreat is in accord with observations in other alpine areas (Kos et al., 2016), where slope failures induced by glacier retreat initiate at the toe of the slope and retrogress to the crown of the slope.
IDP1 and IDP 2 (Figures 14B,C) are interpreted to be predominantly related to the seismic driver due to the high activity of these areas following the Denali earthquake in 2002. These IDPs are characterized by larger amplitudes than other IDPs, especially in the first 3 years following the earthquake, and are spatially more extensive than the other signals. Both the large amplitudes and the larger spatial extent of the damage are characteristic of earthquake-induced displacements (Gischig et al., 2016). Three years after the earthquake, the intensities decreased, indicating that the slope movements had decelerated, and an equilibrium reached. The lower intensity movements observed for IDP1 and IDP2 from 2007 to the end of the study period suggest that hydrologic cycles are causing some slope movement, possibly promoted, and enhanced by seismically induced damage.
The InSAR time series before the 2002 earthquake is sparse, but the intensity time series for IDP3 and IDP4 (Figures 14D,E) suggest that movements were relatively low before the earthquake and higher in the years following it. These two IDPs are likely driven by hydromechanical processes that vary on an annual cycle in response snow melt, precipitation and possibly freeze-thaw cycles as observed in the correlation between the IDP intensities against the hydrological driver series (Figure 12B for IDP 4 for example). Although the observed changes in movement are not linearly related to the hydrological inputs, they may be affected by complex interactions between cyclic groundwater inputs, fatigue induced by glacial debuttressing and progressive damage accumulation related to slope deformation. In this investigation, we did not consider thermo-mechanical processes, freeze-thaw cycles or chemical weathering as processes that potentially could drive slope deformation; therefore, we would not expect a linear relationship between water input and slope activity.
Important further points of discussion emerge from constraints imposed on our temporal and spatial displacement analyses by the InSAR datasets. There are two important constraints. First, the documented spatio-temporal behavior of Fels slide refers to deformation occurring in a single 1D projection of the 3D displacement vector, corresponding to the line-of-sight geometry of the descending SAR data. Second, the interferometric measurements are limited to the summer season and thus do not reveal the full annual dynamics of Fels slide. These two restrictions lead to questions about the amount of the slide’s temporal and spatial displacement activity that we can capture.
To investigate questions of spatial and temporal representativeness, we compared our observations with the displacement maps derived for Fels slide using SAR speckle tracking techniques (Donati et al., 2021). We combined RADARSAT-2 data captured in descending geometry with additional data captured in ascending geometry and covering the time period between July 2015 and August 2020. Inversion of four, coarse spatial resolution, speckle tracking maps reveals the full 3D surface displacement vectors of Fels slide averaged over this 5-year period. Figure 15 shows the 3D displacement vectors, the 1D projection of 3D vectors along the descending line-of-sight, and the vertical displacement component projected to the InSAR line-of-sight. It is evident that, although lobe A is the core active region of Fels slide (Figure 15A), lobes A and B in the InSAR projection (Figure 15B) appear to be of similar strength because the movement direction of less-active lobe B aligns more favorably with the descending geometry line-of-sight. This analysis thus shows that InSAR results for lobe A are not as representative as those for lobe B. It is possible that additional, unrecognized IDPs exist in lobe A. These patterns might not be evidenced, or could be significantly subdued, in the ICA decomposition.
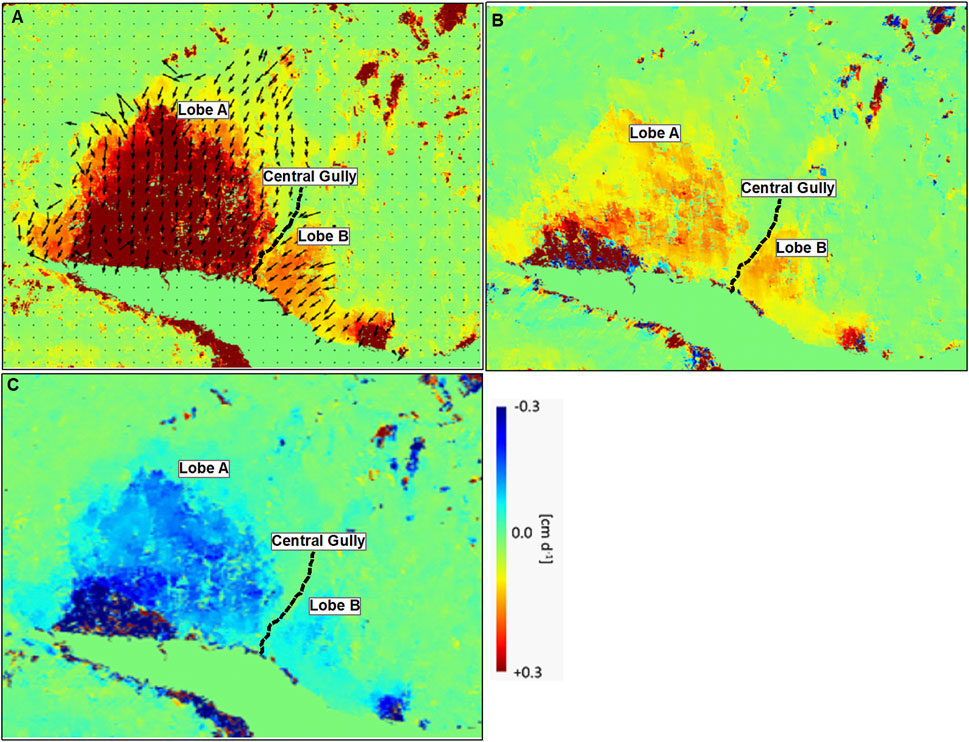
FIGURE 15. Three-dimensional displacements (ascending and descending orbit geometry SAR speckle tracking) versus one-dimensional displacements (only descending orbit geometry) over a 5-year period (2015-07-13 to 2020-08-03). (A) 3D velocity vectors indicating displacement magnitude (colour scale), map direction (arrow aspect), and plunge (arrow length). (B) InSAR 1D projection of 3D vectors along the descending line-of-sight. (C) Vertical component of 3D velocity vectors.
The SAR speckle tracking results (Figure 15), together with long-term (century-scale) slope deformation inferred from the displacement of lateral moraines (Figure 8), can also be used to assess the temporal representativeness of our analysis, considering inter-annual and seasonal gaps in the SAR scenes available for analysis. At a location down-glacier of the boundary between lobes A and B, the LIA lateral moraine has been lowered approximately 60 m since about AD 1840. The mean annual total displacement (Figure 15A) and mean annual 1D (descending line-of-sight geometry) displacement (Figure 15C) at the same location yield daily averages rates of, respectively, 0.35 cm/day and -0.12 cm/day. In contrast, the average displacement rate measured for all InSAR measurements between 2015 and 2016 is -0.064 cm/day. This two-year summer season average is only about half the annual average for the 2015-2020 period measured by speckle tracking. This difference may mean that the measured InSAR displacements are not only missing winter movements, which are expected to be slower than in the summer season, but potentially also a faster period, likely in the early spring when melting snow precludes InSAR measurements due to incoherence. However, as the two periods are not the same (2015–2016 and 2015–2020), significantly accelerated slide motion during 2017–2020, which is not measured by InSAR, cannot be ruled out as an alternate, albeit less likely, explanation. Independent corroboration for the period of coherent interferograms missing an early spring fast period is obtained by comparing, at the same location, the displacements captured by ALOS-PALSAR interferograms spanning an annual period (12 August 2009 to 15 August 2010, 368 days) and a summer period (30 June 2010 to 15 August 2010, 46 days). The ratio of summer and annual displacements is 8.8, which is larger than the ratio of the two time periods (368/46=8); indicating that the summer period motion of Fels slide in 2010 was slower (about ten percent in this case) than the corresponding annual average.
Using the vertical component of the 2015-2020 3D displacement vector (Figure 15C) at the boundary between lobes A and B, where there has been 60 m of surface lowering since 1840, we obtain modern average vertical displacements of -0.10 cm/day or -0.365 m/yr. Extrapolating this value back to 1840 yields an estimated surface lowering of 63.9 m, which closely matches the measured value of 60 m and precludes the possibility of a significant net increase in the displacement rate over time, at least at this location.
Despite the limitations induced by the discontinuous temporal coverage of the InSAR data, our ICA analysis provides evidence that the Fels landslide domains are affected differently by the investigated drivers (rainfall, glacier retreat and seismicity). The boundaries of these domains appear to be controlled by lineaments, as mapped by Donati et al. (2021). However, domain boundaries do not correlate with any prominent or obvious geomorphic feature, potentially indicating a subdivision of the landslide body into discrete blocks. Possible reasons may include i) the recent activation of the slope-scale instability, resulting in an incipient separation of landslide blocks that is not yet reflected in the formation of surface features, or ii) a spatially different deformation response to different drivers, reflecting a “slope deformation complex”, without the presence of kinematically constrained blocks that move fully independently of one another (see also Jones et al., 2021).
6 Conclusion
This study has shown both the potential and limitations of using multi-sensor InSAR time series to assess different drivers of a complex deep-seated gravitational mass movement (Fels slide). Using sophisticated InSAR processing methods, we have largely overcome the problems of different sensor resolutions and spatially inhomogeneous coherence conditions to derive an accurate InSAR displacement map time series. Using ICA, we decomposed this series into a small number of independent deformation patterns (IDPs). For each IDP, we successfully constructed effective driver series from the primary meteorological driver (surface water input), which optimally correlate with the IDPs on a seasonal time scale. The different temporal lags and smoothing widths used to construct the effective driver series are consistent with interpretation of IDPs as being caused by landslide domains with underlying deep and shallow slip surfaces.
A limitation of our method for reconstructing complex displacement histories of DSGSD like Fels slide is spatial constraints imposed by the only partially favorable InSAR geometries with respect to the principal movement direction of the slide. Furthermore, due to the inability of InSAR to observe the full annual cycle of the movement, we are likely missing an important seasonal period of fast motion in early spring when interferograms are still incoherent due to snow cover and melt.
We also were unable to differentiate the long-term spatial and temporal patterns and effects of each of the investigated driver series, except that we found a clear increase in movements in two IDPs in the first 4 years following the large Denali earthquake in 2002. We attribute our inability to identify the effects of the analyzed driver series in the long-term trends of the IDP intensity series to progressive rock mass fatigue, which plays an important role in slope deformation, but is not modelled by our approach. A clear, linear relationship between IDP intensities and the investigated primary driver series is not possible. Instead, the patterns of acceleration are likely dependent on the progressive fatigue produced by different processes operating together, but at different rates, and also on the rock mass damage, which changes over time. All of these effects would have to be captured to generate effective driver series for individual IDPs from the primary seismic and glacial debuttressing drivers. Our observations support previous findings of non-linear impacts of glacier, climate and earthquake drivers on slope deformation.
The Fels slope appears to deform and move as a “slope deformation complex”. It has a multi-planar, active-passive block configuration and involves a complex three-dimensional failure mechanism with multiple domains affected differently by geological and environmental drivers. The role of glacier retreat includes removal of the kinematic restraint to the lower slope, promoting the movement of the structurally controlled fast-moving slope toe, in addition to the effects of glacially induced rock mass damage. With glacier retreat, the slope failure would have increased in size both perpendicular to the valley (retrogression) and along the valley (lateral migration). Our analysis clearly shows the influence of different geomechanical drivers on the ongoing slope failure and, in particular, the complex nature of Fels slide. The results further highlight the importance of recognizing the complex three-dimensional nature of the Fels slide, which may involve different failure mechanisms within different parts of the landslide body, such as translational sliding along foliation, wedge-related sliding and superficial slumping of newly exposed glacial deposits or heavily damaged rock. The lateral growth of the Fels slope failure as the glacier retreats also implies that different zones of movement within the landslide will probably be at different stages of equilibrium, with mature landslides in the up-valley area and recent or incipient landslides near the current position of the glacier terminus.
Detailed geomechanical modeling of rock mass damage will be required to improve predictions of the future evolution of Fels slope. To this end, a better understanding of the inferred subsurface configuration of the landslide, particularly the depth of the basal failure surface and the potential subdivision of the slide mass into independent blocks is critical. The depth and morphology of the failure surface represents a key input to any 3D geomechanical simulation and should be determined through subsurface and geophysical field investigations or, potentially, from the analysis of surface deformation (e.g., Booth et al., 2013). The complexity of the analysis progressively increases as one progresses from a “single-block” model to a “multi-block” model and finally a “slope deformation complex” model. Table 3 summarizes the challenges, advantages and limitations of each approach.
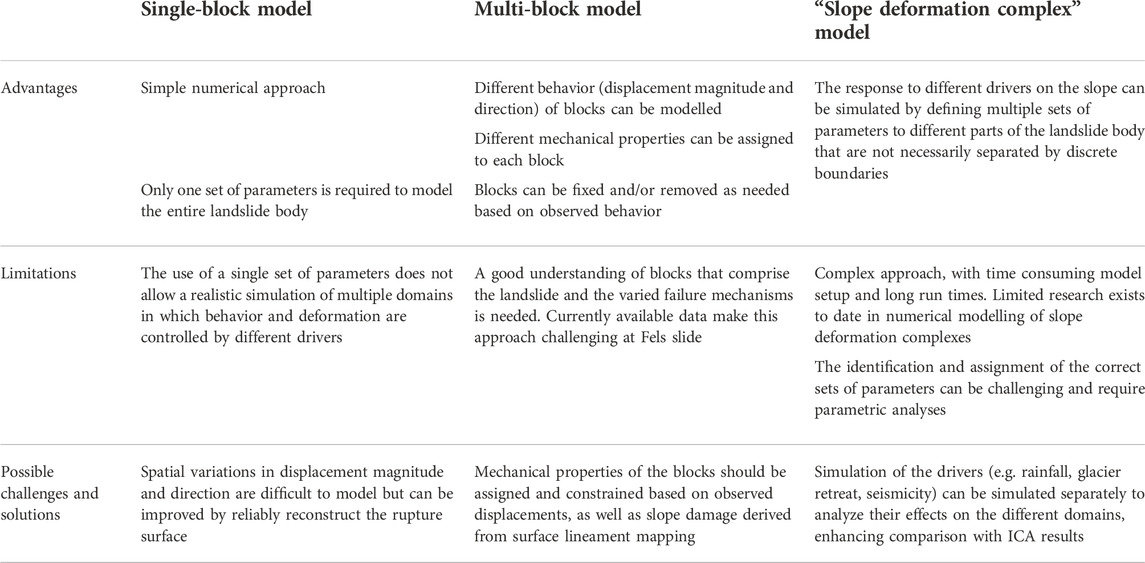
TABLE 3. Overview of the advantages, limitations, challenges, and potential solutions for the numerical modelling of the Fels slide.
The next steps in the analysis and interpretation of the Fels slide should involve a more detailed characterization of the subsurface configuration of the landslide, including the depth of basal failure surface and a detailed monitoring campaign, aimed at identification of landslide domains, their behavior, and their role in the overall evolution of the landslide. Nevertheless, the approach presented in this paper contributes to the interpretation of the long-term behavior of slow-moving landslides, particularly those located in remote areas where the lack or scarcity of surface and subsurface monitoring data presents a major challenge.
Data availability statement
The data analyzed in this study is subject to the following licenses/restrictions: Satellite data used in this study are governed by space agencies's EULAs and are not freely shareable. Requests to access these datasets should be directed to YnRyYWJ1c0BzZnUuY2E=.
Author contributions
BR conceived the study and carried out the bulk of the multi-sensor InSAR data analysis; he wrote most of the data processing and analysis section and made major contributions to the other sections. JE carried out the ICA analysis and created most of the figures; she also spearheaded the discussion section and made major contributions to the other sections of the paper. JC prepared most of the introduction, providing needed geological context. He also initiated the lateral moraine analysis. DD contributed to the glacial debuttressing driver analysis and provided important geomechanical context to the drivers and discussion sections. DS lent his expertise on landslide evolution and made significant contributions to the drivers and discussion sections. MF provided context with earlier modeling work on Fels slide and contributed to the drivers and discussion sections.
Funding
This research was carried out at SFU SARlab with funding through the NSERC-MDA-CSA Industrial Research Chair in Synthetic Aperture Radar Technologies, Methods, and Applications [SFU grant numbers R569273 (NSERC) and R519057 (CSA)].
Acknowledgments
We thank Farnoush Hosseini for helping prepare moraine location data, and MDA, ASF, DLR, and JAXA for providing the SAR image data used in this study. Further we are grateful thank Frank Wuttig (Alyeska Pipelines) who kindly provided two sets of Lidar DEM data that were used in the study.
Conflict of interest
Author JE is employed by BGC Engineering.
The remaining authors declare that the research was conducted in the absence of any commercial or financial relationships that could be construed as a potential conflict of interest.
Publisher’s note
All claims expressed in this article are solely those of the authors and do not necessarily represent those of their affiliated organizations, or those of the publisher, the editors and the reviewers. Any product that may be evaluated in this article, or claim that may be made by its manufacturer, is not guaranteed or endorsed by the publisher.
Supplementary material
The Supplementary Material for this article can be found online at: https://www.frontiersin.org/articles/10.3389/feart.2022.918901/full#supplementary-material
Footnotes
2Interferometric Synthetic Aperture Radar (IFSAR) Alaska Digital Object Identifier (DOI) number: 10.5066/P9C064CO.
References
Agliardi, F., Crosta, G., and Zanchi, A. (2001). Structural constraints on deep-seated slope deformation kinematics. Eng. Geol. 59, 83–102. doi:10.1016/s0013-7952(00)00066-1
Ambrosi, C., and Crosta, G. B. (2006). Large sackung along major tectonic features in the Central Italian Alps. Eng. Geol. 83, 183–200. doi:10.1016/j.enggeo.2005.06.031
Bisci, C., Burattini, F., Dramis, F., Leoperdi, S., Pontoni, Fabrizio., and Pontoni, F. (1996). The Sant’Agata feltria landslide (marche region, central Italy): A case of recurrent earthflow evolving from a deep-seated gravitational slope deformation. Geomorphology 15, 351–361. doi:10.1016/0169-555x(95)00080-o
Bontemps, N., Lacroix, P., Larose, E., Jara, J., and Taipe, E. (2020). Rain and small earthquakes maintain a slow-moving landslide in a persistent critical state. Nat. Commun. 11, 780. doi:10.1038/s41467-020-14445-3
Bontemps, N., Larose, E., Lacroix, P., Jara, J., and Taipe, E. (2019). Combined effect of precipitations and earthquakes on slow moving landslide kinematic, a case study with in-situ measurements in the Colca Valley, Peru, 21. Vienna, Austria: EGU General Assembly.
Booth, A. M., Lamb, M. P., Avouac, J. P., and Delacourt, C. (2013). Landslide velocity, thickness, and rheology from remote sensing: La Clapiére landslide, France. Geophys. Res. Lett 40, 4299–4304.
Carver, G., Plafker, G., Metz, M., Cluff, L., Slemmons, B., Johnson, E., et al. (2004). Surface rupture on the Denali fault interpreted from tree damage during the 1912 Delta River Mw 7.2-7.4 earthquake: Implications for the 2002 Denali fault earthquake slip distribution. Bull. Seismol. Soc. Am. 94, S58–S71. doi:10.1785/0120040625
Crosta, G. B., di Prisco, C., Frattini, P., Frigerio, G., Castellanza, R., and Agliardi, F. (2013). Chasing a complete understanding of the triggering mechanisms of a large rapidly evolving rockslide. Landslides 11, 747–764. doi:10.1007/s10346-013-0433-1
Cruden, D., and Varnes, D. (1996). “Landslide types and processes,” in Landslides: Investigation and mitigation. Editors K. Turner, and R. Schuster (Washington, DC: National Academy Press), 36–75.
Donati, D., Rabus, B., Engelbrecht, J., Stead, D., Clague, J., and Francioni, M. (2021). A robust sar speckle tracking workflow for measuring and interpreting the 3d surface displacement of landslides. Remote Sens. (Basel). 13, 3048. doi:10.3390/rs13153048
Doser, D. I. (2009). Estimating magnitude and location of Alaskan earthquakes using intensity data. Bull. Seismol. Soc. Am. 99, 3430–3453. doi:10.1785/0120090045
Dramis, F., and Sorriso-Valvo, M. (1994). Deep-seated gravitational slope deformations, related landslides and tectonics. Eng. Geol. 38, 231–243. doi:10.1016/0013-7952(94)90040-x
Ebmeier, S. K. (2016). Application of independent component analysis to multitemporal InSAR data with volcanic case studies. J. Geophys. Res. Solid Earth 121, 8970–8986. doi:10.1002/2016JB013765
Evans, S. G., and Clague, J. J. (1994). Recent climatic change and catastrophic geomorphic processes in mountain environments. Geomorphology 10, 107–128. doi:10.1016/0169-555x(94)90011-6
Ferrians, O. J., J. (1965). Permafrost map of Alaska. U.S. Geol. Surv. Misc. Geol. Investig. Map 445, 1 sheet 500. scale 1:2000.
Gaddes, M. E., Hooper, A., Bagnardi, M., Inman, H., and Albino, F. (2018). Blind signal separation methods for InSAR: The potential to automatically detect and monitor signals of volcanic deformation. J. Geophys. Res. Solid Earth 123 (10), 10,226–10,251. doi:10.1029/2018JB016210
Gischig, V., Preisig, G., and Eberhardt, E. (2016). Numerical investigation of seismically induced rock mass fatigue as a mechanism contributing to the progressive failure of deep-seated landslides. Rock Mech. Rock Eng. 49, 2457–2478. doi:10.1007/s00603-015-0821-z
Gischig, V. S., Eberhardt, E., Moore, J. R., and Hungr, O. (2015). On the seismic response of deep-seated rock slope instabilities — insights from numerical modeling. Eng. Geol. 193, 1–18. doi:10.1016/j.enggeo.2015.04.003
Grämiger, L. M., Moore, J. R., Gischig, V. S., Ivy-Ochs, S., and Loew, S. (2017). Beyond debuttressing: Mechanics of paraglacial rock slope damage during repeat glacial cycles. J. Geophys. Res. Earth Surf. 122, 1004–1036. doi:10.1002/2016JF003967
Grämiger, L. M., Moore, J. R., Gischig, V. S., Loew, S., Funk, M., and Limpach, P. (2020). Hydromechanical rock slope damage during late pleistocene and Holocene glacial cycles in an alpine valley. J. Geophys. Res. Earth Surf. 125. doi:10.1029/2019JF005494
Harp, E. L., Jibson, R. W., Kayen, R. E., Keefer, D. K., Sherrod, B. L., Carver, G. A., et al. (2003). Landslides and liquefaction triggered by the M 7.9 Denali fault earthquake of 3 november 2002. GSA Today 13, 4–10. doi:10.1130/1052-5173(2003)013<0004:laltbt>2.0.co;2
Holm, K., Bovis, M., and Jakob, M. (2004). The landslide response of alpine basins to post-Little Ice Age glacial thinning and retreat in southwestern British Columbia. Geomorphology 57, 201–216. doi:10.1016/S0169-555X(03)00103-X
Hosseini, F., Pichierri, M., Eppler, J., and Rabus, B. (2018). Staring spotlight TerraSAR-X SAR interferometry for identification and monitoring of small-scale landslide deformation. Remote Sens. (Basel). 10, 1–18. doi:10.3390/rs10060844
Howley, M. W. (2008). A late glacial and holocene chronology of the Castner Glacier, Delta River Valley, Alaska. University of New Hampshire, Durham Master's Theses and Capstones 421.
Hugentobler, M., Aaron, J., Loew, S., and Roques, C. (2022). Hydro-mechanical interactions of a rock slope with a retreating temperate valley glacier. JGR. Earth Surf. 127. doi:10.1029/2021JF006484
Jibson, R. W., Harp, E. L., Schulz, W., and Keefer, D. K. (2004). Landslides triggered by the 2002 Denali fault, Alaska, earthquake and the inferred nature of the strong shaking. Earthq. Spectra 20, 669–691. doi:10.1193/1.1778173
Jibson, R. W., Harp, E. L., Schulz, W., and Keefer, D. K. (2006). Large rock avalanches triggered by the M 7.9 Denali Fault, Alaska, earthquake of 3 November 2002. Eng. Geol. 83, 144–160. doi:10.1016/j.enggeo.2005.06.029
Jibson, R. W. (2011). Methods for assessing the stability of slopes during earthquakes—a retrospective. Eng. Geol. 122, 43–50. doi:10.1016/j.enggeo.2010.09.017
Jones, N., Manconi, A., and Strom, A. (2021). Active landslides in the Rogun Catchment, Tajikistan, and their river damming hazard potential. Landslides 18, 3599–3613.
Koehler, R. D., Farrell, R., Burns, P. A. C., and Combellick, R. A. (2012). “Quaternary faults and folds in Alaska: A digital database,” in Alaska division of geological and geophysical surveys (Fairbanks, Alaska: Miscellaneous Publication), 141.
Kos, A., Amann, F., Strozzi, T., Delaloye, R., von Ruette, J., and Springman, S. (2016). Contemporary glacier retreat triggers a rapid landslide response, Great Aletsch Glacier, Switzerland. Geophys. Res. Lett. 43, 12,466–12,474. doi:10.1002/2016GL071708
Leith, K., Moore, J. R., Amann, F., and Loew, S. (2014). Subglacial extensional fracture development and implications for Alpine Valley evolution. J. Geophys. Res. Earth Surf. 119, 62–81. doi:10.1002/2012JF002691
Longoni, L., Papini, M., Brambilla, D., Arosio, D., and Zanzi, L. (2016). The role of the spatial scale and data accuracy on deep-seated gravitational slope deformation modeling: The Ronco landslide, Italy. Geomorphology 253, 74–82. doi:10.1016/j.geomorph.2015.09.030
McColl, S. T. (2012). Paraglacial rock-slope stability. Geomorphology 153–154, 1–16. doi:10.1016/j.geomorph.2012.02.015
Metz, M. (2004). “Denali fault displacement and deformation near the Trans- Alaska Pipeline,” in Report of the Alyeska fault evaluation team 2003. Editors C. G. M. M. G. Cluff LS Plafker, S. DB, and A. K. Anchorage.
Newman, S. D. (2013). Deep-seated gravitational slope deformations near the trans-Alaska pipeline, east-central Alaska range. Burnaby, BC: Simon Fraser University, 243. MSc thesis.
Nokleberg, W. J., Aleinikoff, J. N., Bond, G. C., Ferrians, O. J., Herzon, P. L., Lange, I. M., et al. (2015). Geologic maps of the eastern Alaska Range, Alaska (44 quadrangles, 1:63,360 scale), with descriptions and interpretations of map units: Alaska Division of Geological & Geophysical Surveys Report of Investigation. doi:10.14509/29444
Plafker, G., Carver, G., Cluff, L., and Metz, M. (2006). Historic and paleo-seismic evidence for noncharacteristic earthquakes and the seismic cycle at the Delta River crossing of the Denali Fault, Alaska, 38. Geological Society of America Abstracts with Programs, 96.
Plafker, G., Gilpin, L. M., and Lahr, J. C. (1994). “Neotectonic map of Alaska: Scale 1: 2 500 000,” in The geology of north America. Editors G. Plafker, and H. C. Berg (Boulder, CO: Geological Society of America).
Rabus, B., Eppler, J., and Pichierri, M. (2017). “Comprehensive geophysical model and criticality prediction for a large deep-seated gravitational slope deformation, Fels Glacier slide, Alaska,” in Proceedings of ESA fringe (Helsinki, Finland.
Rabus, B., and Pichierri, M. (2018). A new InSAR phase demodulation technique developed for a typical example of a complex, multi-lobed landslide displacement field, Fels Glacier Slide, Alaska. Remote Sens. (Basel). 10, 995. doi:10.3390/rs10070995
Radbruch-Hall, D. (1978). “Gravitational creep of rock masses on slopes,” in Rockslides and avalanches, natural phenomena. Editor B. Voight (Amsterdam: Elsevier), 607–657.
Soldati, M. (2013). “Deep-seated gravitational slope deformation,” in Encyclopedia of natural hazards. Editor P. T. Bobrowsky (Dordrecht: Springer Netherlands), 151–155. doi:10.1007/978-1-4020-4399-4_86
Storni, E., Hugentobler, M., Manconi, A., and Loew, S. (2020). Monitoring and analysis of active rockslide-glacier interactions (Moosfluh, Switzerland). Geomorphology 371, 107414. doi:10.1016/j.geomorph.2020.107414
Varnes, D. J., Radbruch-Hall, D. H., Varnes, K. L., Smith, W. K., and Wz, S. (1990). Measurement of ridge-spreading movements (sackungen) at bald eagle mountain, lake county, Colorado, 1975 - 1989. US Geological Survey Open-File. Report 90-543.
Varoquauax, G., Lafaye de Micheaux, P., and van der Walt, S. (2012). Python implementation of the fast ICA algorithms.
Keywords: deep-seated gravitational slope deformation, remote sensing, interferometric synthetic aperture radar, geophysical time series analysis, Alaska
Citation: Rabus B, Engelbrecht J, Clague JJ, Donati D, Stead D and Francioni M (2022) Response of a large deep-seated gravitational slope deformation to meteorological, seismic, and deglaciation drivers as measured by InSAR. Front. Earth Sci. 10:918901. doi: 10.3389/feart.2022.918901
Received: 12 April 2022; Accepted: 31 October 2022;
Published: 23 November 2022.
Edited by:
Juergen Pilz, University of Klagenfurt, AustriaReviewed by:
Milad Janalipour, Aerospace Research Institute, IranJan Beutel, University of Innsbruck, Austria
Copyright © 2022 Rabus, Engelbrecht, Clague, Donati, Stead and Francioni. This is an open-access article distributed under the terms of the Creative Commons Attribution License (CC BY). The use, distribution or reproduction in other forums is permitted, provided the original author(s) and the copyright owner(s) are credited and that the original publication in this journal is cited, in accordance with accepted academic practice. No use, distribution or reproduction is permitted which does not comply with these terms.
*Correspondence: Bernhard Rabus, YnRyYWJ1c0BzZnUuY2E=
 Bernhard Rabus
 Jeanine Engelbrecht2,3
 Davide Donati
 Mirko Francioni