 Mingqiang Sheng
 Jianqi Zhou1
95% of researchers rate our articles as excellent or good
Learn more about the work of our research integrity team to safeguard the quality of each article we publish.
Find out more
ORIGINAL RESEARCH article
Front. Earth Sci. , 31 May 2022
Sec. Geohazards and Georisks
Volume 10 - 2022 | https://doi.org/10.3389/feart.2022.918386
This article is part of the Research Topic Landslide Hazards in Alpine Region: Mechanics and Mitigation View all 23 articles
This paper aims to propose an efficient landslide susceptibility prediction (LSP) model based on the frequency ratio method and C5.0 Decision Tree (C5.0 DT) model. Taking Ruijin City as the study area, local landslide inventory and 12 environmental factors are collected. Then the nonlinear correlations between landslide inventory and environmental factors are established by frequency ratio (FR) method. Thirdly, the FR values of these environmental factors are taken as the input variables of the C5.0 DT/SVM models; landslide samples and non-landslide samples are set as the output variables with values of 1 and 0, respectively. The mathematical relationship between input variables and output variables is established by C5.0 DT/SVM models. Finally, the performance of LSP of both models is evaluated by the Area Under Receiver Operation Characteristic Curve (AUC). Results show that: 1) The landslide susceptibility mapping (LSM) of the C5.0 DT and the SVM models are similar on the whole, high and very high susceptibility levels are mainly distributed in the north and in the edge of the study area. 2) The AUC values of C5.0 DT and SVM are 0.886 and 0.819, respectively. Both models have good LSP accuracy, however, the overall LSP accuracy of the C5.0 DT model is better than that of SVM. 3) It is significant and reliable to carry out LSP based on frequency ratio method and C5.0 DT model.
China’s geological environment is fragile and geological disasters occur frequently. Especially in the southwest and south area of China, landslides are densely distributed, causing serious casualties and heavy economic losses (Fu et al., 2017; Zheng et al., 2019b; Yang et al., 2020a). Therefore, landslide susceptibility prediction (LSP) is very important, which can provide a scientific and effective basis for the prevention and control of landslide geological hazards, road planning, and the formulation of appropriate risk mitigation strategies in the southwestern and southern areas of China (Akgun et al., 2012; Bai et al., 2015; Jiang et al., 2017; Lin et al., 2021; Huang et al., 2022a).
The study of LSP is to estimate the spatial probability of landslide occurrence in a certain area so as to effectively provide early warning to high landslide-prone area and reduce the occurrence of related safety accidents (Bui et al., 2020). LSP models are generally classified into deterministic, heuristic and machine learning models (Huang et al., 2017b; Huang et al., 2020b). At present, there are many LSP methods, including Remote Sensing (RS) research on surface deformation area to predict the occurrence of landslides (Chang et al., 2020; Dai et al., 2021; Zhu et al., 2022), and to establish a LSP model coupled with multiple connection methods. Among them, the connection method of landslide inventory and environmental factors, and the determination of LSP models play an important role in the LSP modelling (Huang et al., 2020a). The LSP modelling mainly includes three processes: one is landslide inventory and division of prediction units; the second is the core process including selecting appropriate basic environmental factors and establishing models, and the final step is the LSP results testing (Dou et al., 2019).
At present, the LSP models coupled with various connection methods mainly include analytic hierarchy process (AHP) model (Ma et al., 2021), information value (IV) model (Zhao B. et al., 2021), mathematical statistics (Kouhartsiouk and Perdikou 2021) and machine learning models, where the machine learning models applied to LSP usually refer to C5.0 Decision Tree (C5.0 DT) (Mao et al., 2017), logistic regression (Shahabi et al., 2015), artificial neural network (Huang et al., 2019), extreme learning machine (Huang et al., 2017a), support vector machine (SVM) (Marjanović et al., 2011), gray correlation degree (Yu et al., 2021), random forest (Sun et al., 2020), clustering algorithm (Guo Z. et al., 2021), semi-supervised multilayer perceptron model (Huang et al., 2020b), etc. In general, the machine learning models are considered to have higher LSP performance than those of the heuristic models and conventional statistical models, due to their efficient nonlinear prediction abilities of machine learning models (Xiao et al., 2021; Wang et al., 2022). The most suitable model for LSP is inconclusive. Among many models, C5.0 DT and SVM models have widely-recognized nonlinear prediction performance (Chang et al., 2020; Li W. et al., 2021; Su et al., 2021). Both models have achieved ideal LSP results.
For the above-mentioned machine learning such as C5.0 DT and SVM, it is necessary to connect the landslide susceptibility index and environmental factors. There is a complex nonlinear correlation between environmental factors (Zhu et al., 2022). According to many studies (Chang et al., 2020; Huang et al., 2021a; Li W. et al., 2021; Guo Z. et al., 2021), the accuracy of the LSP model without considering the nonlinear connection is slightly lower than that of the coupled model considering the connection. The connection methods include the weight of evidence (Wu R. et al., 2020), IV model (Zhao B. et al., 2021) and the frequency ratio (FR) method (Nanda et al., 2020). FR method is used to characterize the spatial relationship between landslide distribution and condition factors. Machine learning model based on FR method is commonly used in LSP(Li et al., 2020; Huang et al., 2021b; Zhu et al., 2022). Therefore, this study intends to use the FR method to establish the nonlinear relationship between landslides and environmental factors. For the LSP modelling by the FR-C5.0 DT/SVM models, firstly, the FR values of the environmental factors are set as the input variables of the C5.0 DT and SVM models, then the C5.0 DT and SVM models for LSP are further established through training and testing the input-output variables.
In this study, Ruijin City in China is taken as the research area. A total of 12 basic environmental factors are obtained by remote sensing and ArcGIS 10.3 software. The C5.0 DT/SVM models are then used for LSP in Ruijin City. Then, the area under receiver operating characteristic curve (AUC) is used to assess the accuracy of LSP results of the C5.0 DT/SVM models (Panchal and Shrivastava 2021).
In this study, the FR method is used to connect the C5.0 DT/SVM models with the environmental factors of landslide inventory to perform the LSP and analyze their results. The main contents (Figure 1) include:
1) Based on the landslide inventory Information and geological environment, a total of 12 basic environmental factors are acquired (Jiang et al., 2018b; Xiao et al., 2021).
2) The nonlinear correlation between each environmental factors and the relative density of landslides is established by FR method, and the importance of various environmental factors are quantified (Huang et al., 2022b).
3) The FR values of these environmental factors are taken as the input variables of the C5.0 DT/SVM models, the output variables are landslide and non-landslide (marked as 1 and 0, respectively). The mathematical relationship between input variables and output variables is established (Liu et al., 2021).
4) The input-output variables are randomly divided by 70 and 30% as training dataset and test dataset, respectively. Training dataset is used for model training and building, test dataset is used to evaluate the generalization capability of the final model (Sun et al., 2020).
5) The performance of LSP of the two models is evaluated based on various indicators such as ROC (Xiao et al., 2020).

FIGURE 1. The flow chart of research framework.
The FR method can reflect the response relationship between landslides and basic environmental factors, and characterize the relative influence degree of each attribute interval of environmental factors on the occurrence of landslides (Zhang Y.-x. et al., 2020). If FR values are greater than 1, it indicates that the corresponding environmental factors are conducive to promoting the occurrence of landslides. If FR values are close to 1, it indicates that the relationship between the environmental factors and the occurrence of landslides in the corresponding interval is weak. If FR values are less than 1, it indicates that landslides are not likely to occur in this attribute interval. Based on the FR method and the natural break method, the environmental factors are divided into eight attribute interval levels, and the discrete lithology factors are classified according to the actual state as the interval classification basis. The formula for calculating the FR values of each environmental factor is:
where Ai is the number of landslide grids in the interval for each type of environmental factor, A is the total number of landslide grids in the area, Bi is the total number of grids for each type of environmental factor in the corresponding interval, and B is the total number of grids in the study area, and FR represents the FR values of environmental factors.
The decision tree (DT) model is a concise prediction model, and it is also a very powerful and comprehensive machine learning algorithm (Gkioulekas and Papageorgiou 2021). It has been widely used in practical applications such as radar signal identification and classification, medical diagnosis, etc. The DT model is used to analyze and establish the most suitable label value of each pixel eigenvalue node, and then classify the data set according to the label value. The size of the data set has no influence on the size of the DT model, and a large number of data can be used to centrally construct decision trees. This study intends to use the C5.0 algorithm to construct a classification model, which is to conduct classification and regularization of a large number of data sets and then convey knowledge. Compared with other algorithms, it is more suitable for processing large data sets.
When the model is engaged in classification, each classifier is assigned a leaf and it is assigned to the class with the largest number. After the regression tree processing in the algorithm, the missing data is pruned and the classification tree reclassifies the data to generate the optimal binary tree. Then, the optimal segmentation value of the node is selected by citing the Gini coefficient of the economics category. The formula is:
where n is the number of branches, and ai is the number of leaves when the branch is i.
The SVM model increases the dimension of the independent variable on the basis of the kernel function. And it finds the optimal hyperplane with the largest category distance, then the support vector is used on the hyperplane to construct the model (Huang et al., 2020c). The input variables are linearly separable by transforming the nonlinear data into an n-dimensional hyperplane space based on a kernel function. Based on a set of linearly separable data, including 12 basic environmental factors and their corresponding output quantities
For linear inseparable data, the slack variable
where ||λ||2 is the norm of the normal hyperplane, and L is the Lagrange multiplier. In addition, the Radial basis kernel function is used as kernel function of SVM model.
The ROC curve is widely used in the overall accuracy evaluation of binary classification in the LSP modelling due to its satisfactory performance (Vakhshoori and Zare 2018). ROC curve is threshold independent curve. Its main advantage is that it is independent of the number and spacing of thresholds used for calculation (Fawcett 2006). Assuming n classes of the landslide susceptibility indexes, n+1 thresholds can be defined, where the first threshold value (i = 1) is lower than the minimum susceptibility index observed in the most stable category, and the last threshold value (i = n+1) is higher than the maximum susceptibility index in the most sensitive category. Each threshold forms a confusion matrix in which four types of pixels are defined: true positive (TP), false positive (FP), true negative (TN), and false negative (FN) pixels. According to the number of pixels in each threshold, two statistics can be calculated, namely TPR (true positive rate) and FPR (false positive rate), as shown as:
TPR and FPR are plotted on the Y-axis and X-axis of the ROC curve, respectively. Then the AUC is calculated as:
The success rate of the model can be displayed through the participation of AUC values in the training data set, meanwhile, the prediction rate of the test data set can be displayed (Vakhshoori and Zare 2018).
Ruijin is a city under the jurisdiction of Jiangxi Province (Figure 2). It is located on the west side of the southern end of the Wuyi Mountains. Ruijin City has a humid subtropical monsoon climate with concentrated rainfall in summer. Ruijin City is dominated by low mountains and hills, with an area of 1,967.85 km2, which is 80.35% of the whole area. The main landform types include dissolved karst area, eroded moderate and low mountainous area, eroded and denuded hilly area, and river valley accumulation terraces. The rock in the study area is severely weathered, fault folds are developed, the territory is mountainous and rainy, and landslides are densely distributed, causing serious casualties and economic losses (Jiang and Huang 2016; Huang et al., 2020c).
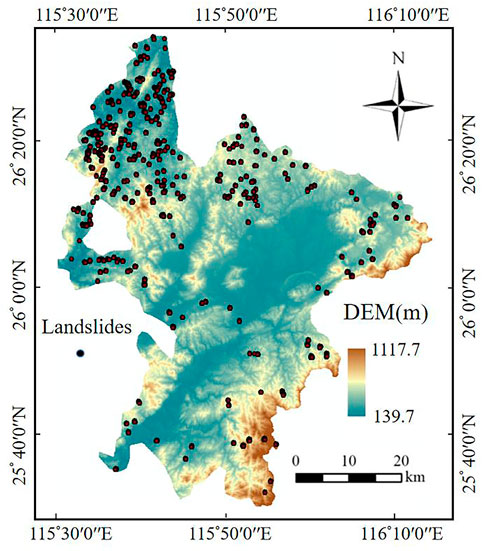
FIGURE 2. The DEM and landslide catalog in Ruijin City.
According to the statistics of Disasters Prevention Departments, the cumulative number of landslides reached 370 by the end of 2014. The distribution area of these landslides and potential landslides are converted into 5515 landslide unit grids based on ArcGIS 10.3 software (Zhao Z. et al., 2021). Landslides mainly occur in the north and west of the study area, while landslides in the south and the central plain are sparse. The occurrence of landslides is characterized by the dense gullies and is concentrated in moderate terrain relief.
The relevant basic data sources in the study area are: 1) historical landslide inventory map of Ruijin City and relevant data recorded in the field. 2) The Digital Elevation Model data (DEM) is freely downloaded by the Earth Observation Center of the Chinese Academy of Sciences. Then, the DEM is processed through ArcGIS 10.3 software to obtain topographic factors such as slope, aspect, plane curvature, profile curvature, and terrain relief. 3) The lithology factor in the study area is obtained from China Hydrogeological map with 1:100,000 scale. 4) The Landsat-8 remote sensing images are freely downloaded by the Earth Observation Center of the Chinese Academy of Sciences. They are used to obtain surface coverage factors such as NDVI, NDBI, and MNDWI.
In addition, since the overall terrain relief in Ruijin City is moderate, and the territory is mostly hills, the 30 m resolution grid can well reflect the distribution of hills and plains (Ismail et al., 2016). Therefore, the landslide inventory selects a grid with 30 m resolution as the LSP unit. Since the data of the 366 landslides are not enough used as the input variables of the model (Huang et al., 2022c). Therefore, the “surface to raster” tool in ArcGIS 10.3 is further used to convert the 366 landslide areas into 5,515 landslide units. At the same time, the whole study area is divided into 2,750,691 units.
Finally, the grid units of the whole study area are classified into data layers representing environmental factors: 1) topographic and landform factors, including elevation, slope, aspect, plane curvature, profile curvature, terrain relief and gully density; 2) hydrology environmental factors, including terrain wetness index and MNDWI; 3) land cover factors, including NDVI and NDBI; 4) basic geotechnical factors, such as lithology.
The interaction of various environmental factors leads to landslide occurrence (Wang et al., 2014; Huang et al., 2016; Zheng et al., 2020). By studying the evolution characterization of the landslide plane in Ruijin City, 12 representative environmental factors, such as elevation, slope, terrain relief, NDVI, NDBI, are selected as the input variables of the C5.0 DT and SVM models. According to the natural break method, each environmental factor is divided into eight attribute interval levels, and the discrete lithology factor is classified according to the actual state. Thus, the FR values of the attribute intervals divided by FR method for each environmental factor are obtained, as shown in Table 1.
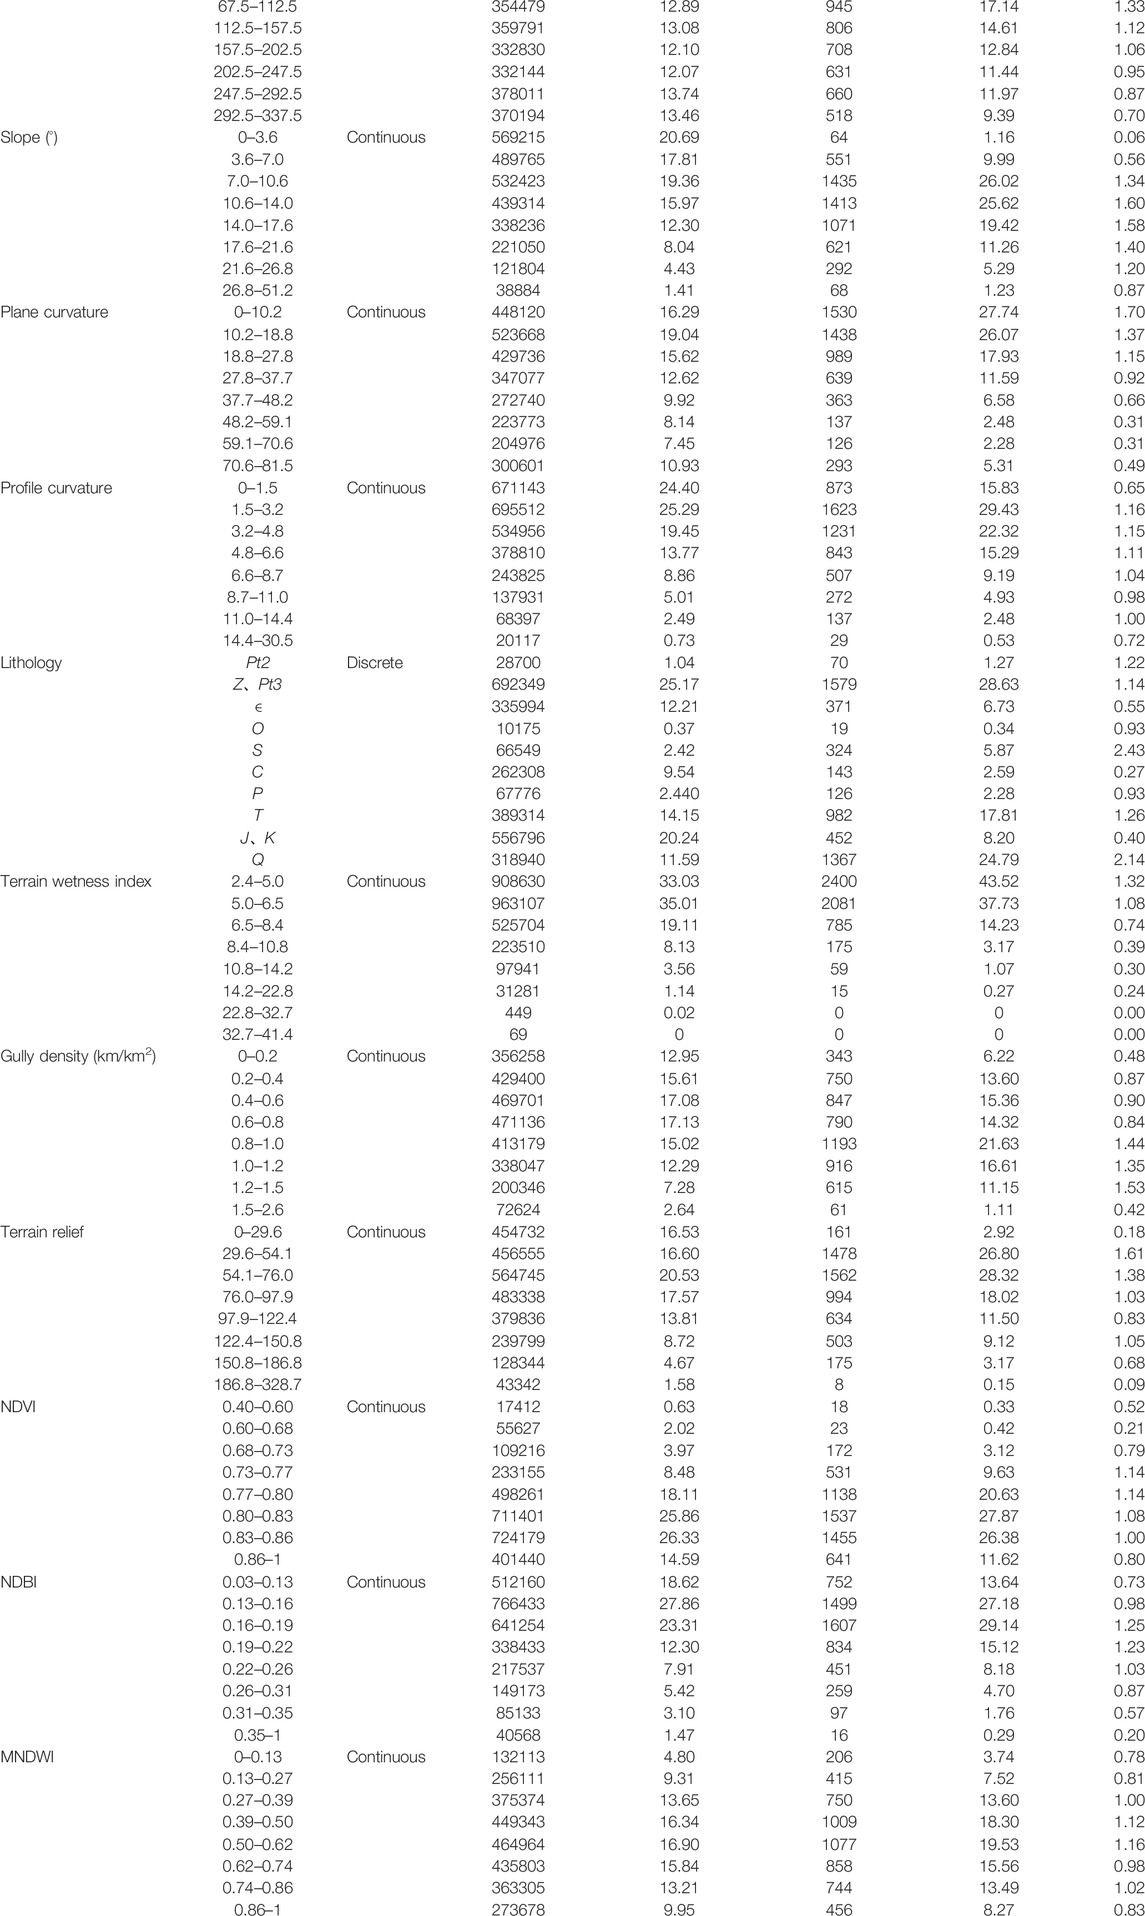
TABLE 1. FR values of each environmental factors.
As shown in Table 1 and Figure 3A, when the elevation is between 139.7 and 308.4 m, the FR values are greater than 1, which indicates that the area is favorable for landslides occurrence. On the contrary, when the elevation is between 308.4 and 1117.8 m, the FR values are less than 1 or close to 1. This shows that the relationship between the attribute intervals of this environmental factor and the occurrence of landslides is weak. The areas with elevations between 308.5 and 1117.8 m are not contributed to landslide occurrence.
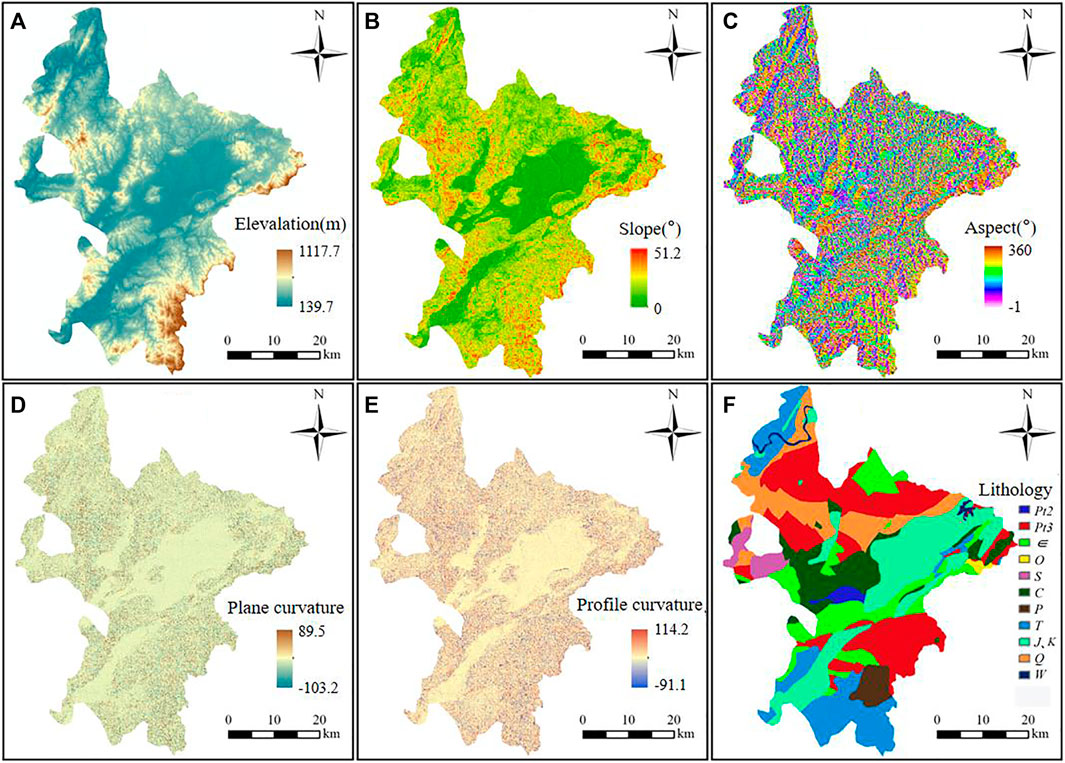
FIGURE 3. Environmental Factors: (A) Elevation, (B) Slope, (C) Aspect, (D) Plan curvature, (E) Profile curvature, (F) Lithology.
Both aspect and slope are also extracted from DEM data. Slope can effectively reflect the physical relationship between landslides and basic topographic elements (Huang et al., 2021a). As shown in Table 1, when the aspect is smaller than 202.5° or the slope is higher than 7.0°, landslides occurrence is more likely to happen. The plane curvature can reflect all the ridge lines and valley lines on the surface in the horizontal direction, and the profile curvature can describe the slope in the vertical direction, both of which are generally considered as important factors affecting landslides (Hong et al., 2019). As shown in Table 1, when the plane curvature is smaller than 27.8° and the profile curvature is in the range of 1.5°–8.7°, landslides are more likely to occur in this area.
Characteristic parameters such as gully density and terrain relief are also extracted from DEM, as shown in Figures 4B,C. The gully density expresses the degree of ground cutting and fragmentation, and local landforms play an important role in determining the susceptibility of landslides (Conforti and Ietto 2019). As shown in Table 1, when the gully density is between 0.8 and 1.6, it is more likely for landslides occurrence. Terrain relief is also one of the important factors that trigger landslides. It describes the undulation of the terrain surface (Qiu et al., 2017), which is prone to landslides at 29.6–150.8.
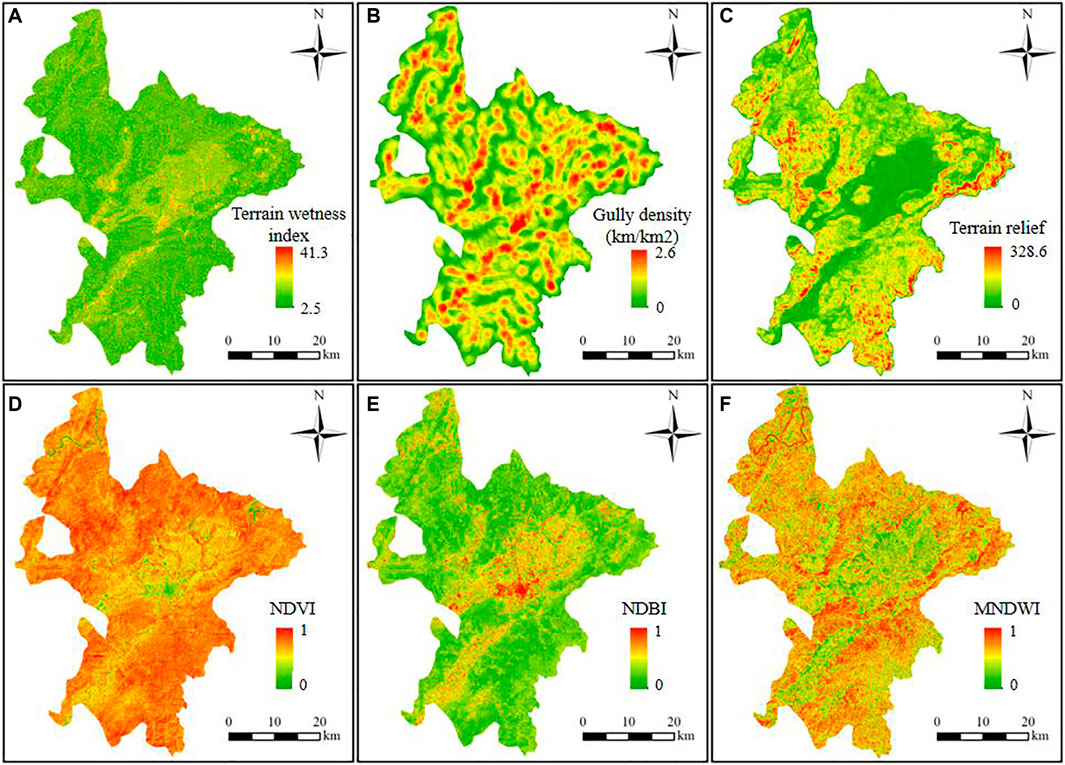
FIGURE 4. Environmental factors: (A) Terrain wetness index, (B) Gully density, (C) Terrain relief, (D) NDVI, (E) NDBI, (F) MNDWI.
Some studies have pointed out that lithology also plays an important role in affecting the occurrence of landslides (Conforti and Ietto 2019; Zhou et al., 2022). The evolution degree of cracks in soil layers of different lithology groups is quite different, and cracks have a great influence on the progressive failure process of soil landslides (Zheng et al., 2019a; Yang et al., 2020b; Jiang et al., 2020). This study adopts the latest geotechnical evaluation method, and analyzes the Mesoproterozoic Erathem (Pt2), Neoproterozoic Erathem (Pt3), Cambrian (∈), Ordovician (O), Silurian (S), Carboniferous (C), Permian (P), Triassic (T), Jurassic and Cretaceous (J、K), Quaternary (Q) and Waters (W) to improve the accuracy of LSP. As shown in Table 1, FR values are greater than 1 in the Pt2, Pt3, S, T, and Q lithology. Therefore, Pt2, Pt3, S, T, and Q lithology are prone to landslides.
The hydrological environment and the surface cover factors affect the shear strength of the soil. The decrease of the shear strength of the soil slope is also an important reason for the occurrence of landslides (Guo et al., 2019; Yang et al., 2019; Fu et al., 2020). The MNDWI and the terrain wetness index reflect the characterization of the surface moisture distribution in the study area, which can effectively indicate the influence of hydrological environmental factors on landslide susceptibility (Li Z.-L. et al., 2021). The FR values of MNDWI in nearly 90% of the units are positively correlated with the MNDWI, indicating that the water body has a great influence on the occurrence of landslides. As shown in Table 1, when the terrain wetness index is between 2.4 and 6.6, FR values are greater than 1, and the FR values are negatively correlated with the terrain wetness index.
NDVI usually reflects the coverage of local vegetation (Zhang H. et al., 2020), indicating that the occurrence of landslides is affected by vegetation coverage. Studies have shown that the spatial distributions of landslides and other geological hazards are highly correlated with human engineering activities such as road excavation and slope cutting (Zheng et al., 2018; Guo C. et al., 2021). NDBI is used to characterize the surface building density (Ridwan et al., 2021), which reflects the influence of human activities on landslide occurrence. As shown in Table 1, when NDVI is within 0.73–0.87 and NDBI is within 0.06–0.28, the FR values are greater than 1, and landslides are more likely to occur.
Based on the 30 m resolution, the environmental factors in the study area are divided into 2,750,691 grids. The unit also ranks the main 10 basic environmental factors according to their contribution. The landslide interface will change continuously with the increase of the safety factor, meanwhile, its shear outlet will be directly or indirectly constrained. For complex landslides, directly intercepting the non-landslide area without considering the distribution of potential landslides does not meet the safety regulations for landslide control. Therefore, 366 landslide surfaces and potential landslide area that have occurred are taken and converted into 5,515 grid units.
Further, the susceptibility of the grid units extracted from the landslide area are assigned to 1, which is unstable areas. Meanwhile the same number of non-landslide grid units are randomly selected in the whole study area. The non-landslide grid units are assigned to 0, which are stable area. The assigned landslide and non-landslide susceptibility values are taken as the output variables of the LSP model, and then those landslide-non-landslide grid units are divided at a proportion of 7:3 in SPSS software, 70% of which are trained by SVM and C5.0 DT models, 30% are tested on SVM and C5.0 DT models.
Finally, the trained and tested SVM/C5.0 DT models are applied to the 12 environmental factors. Then, the LSM of the whole Ruijin City can be predicted. In ArcGIS 10.3 software, combined with the relationship between each environmental factor and the landslides, the predicted landslide susceptibility indexes are divided into five levels from low to high by using the natural break method (Kaur et al., 2018; Guo Z. et al., 2021).
The LSM based on the C5.0 DT model is shown in Figure 5A and Table 2. The predicted area proportions of the very low, low, moderate, high and very high landslide-prone area are respectively 54.75, 14.69, 3.34, 18.38, 8.82%. The FR values of very low, low, moderate, high and very high susceptible levels predicted by the C5.0 DT model are 0.07, 0.47, 0.92, 2.35, 4.88, respectively. The very high and high landslide-prone areas only accounted for 27.21% of the whole study area, but their corresponding FR values are contained for 86.29% of the total FR values.
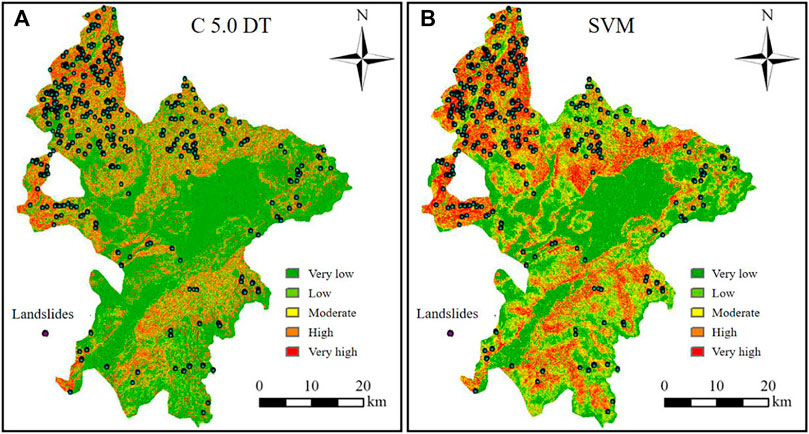
FIGURE 5. LSM: (A) C5.0 DT, (B) SVM.
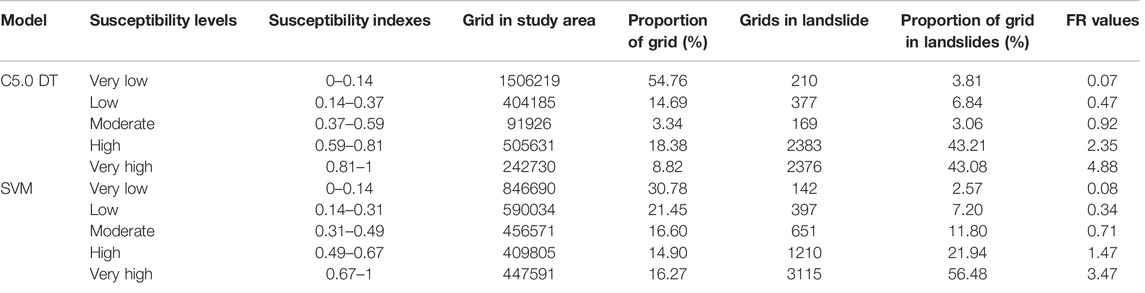
TABLE 2. FR values of LSP grades in C5.0 DT and SVM models.
The LSM predicted by the SVM model is shown in Figure 5B and Table 2, and the predicted area proportions of the very low, low, moderate, high and very high landslide-prone areas are 30.78, 21.45, 16.59, 14.89 and 16.27%, respectively. The FR values of the predicted landslide susceptibility from very low to very high landslide-prone areas are 0.08, 0.34, 0.71, 1.47, and 3.47, respectively. While the very high and high landslide-prone areas only account for 31.17% of the whole study area, their corresponding FR values account for 78.42% of the total FR values.
Comparing the two models, the FR values increase along with the increase of the landslide susceptibility level. However, the proportion of FR values in high and very high susceptibility levels of C5.0 DT model are greater than that of SVM model. It shows that the LSP accuracy of the C5.0 DT model is higher than that of the SVM model, and that the landslide susceptibility indexes predicted by the C5.0 DT model are more consistent with the basic environmental factors of the study area.
As shown in Figure 5 and Table 2, most of Ruijin City is in the low and very low landslide-prone areas. The high and very high landslide-prone areas predicted by the two models are generally similar. But the high and very high landslide-prone areas predicted by the SVM model are significantly larger than C5.0 DT model, as a result, C5.0 DT model is better refined. And the high and very high landslide-prone areas are mainly concentrated in the north of the study area, while the high and very high landslide-prone areas in the south are sparse. The main reason distribution of landslides is that the terrain of Ruijin City is dominated by basins, surrounded by dense hills. The hills on the northern part of the city are the most dense, and the terrain is complex and the river network is concentrated. The weak surface slides down as a whole, which is conducive to the occurrence of landslides.
This study discusses the LSP accuracy of the C5.0 DT and SVM models, the analysis of the basic environmental factors, and the application prospects of the LSP models.
The prediction results of 70% of the training samples and 30% of the test samples of the C5.0 DT and SVM models are arranged from small to large, and are further used as the threshold for precision analysis in turn. The sample points greater than or equal to this threshold are defined as landslide points. The proportion of the correct landslide prediction points to the total number of landslide points is the model’s sensitivity which reflects the model’s ability to detect landslides; the proportion of the wrong landslide prediction points to the total number of non-landslide points is the model’s specificity which is reflects the model’s ability to correctly identify landslides (Paryani et al., 2021).
FPR is the value of 1-specificity; TPR is the value of sensitivity. The ROC curve mainly uses 1-specificity and sensitivity as the abscissa and ordinate, and its LSP accuracy results are shown in Figure 6. The AUC value of C5.0 DT is 0.886, while the AUC value of SVM is 0.819. The larger the AUC value, the better the overall prediction performance of the LSP model (Jiang et al., 2018a; Huang et al., 2021b; Paryani et al., 2021). Both C5.0 DT and SVM models have good LSP accuracy, however, the overall LSP accuracy of the C5.0 DT model is better than that of SVM.
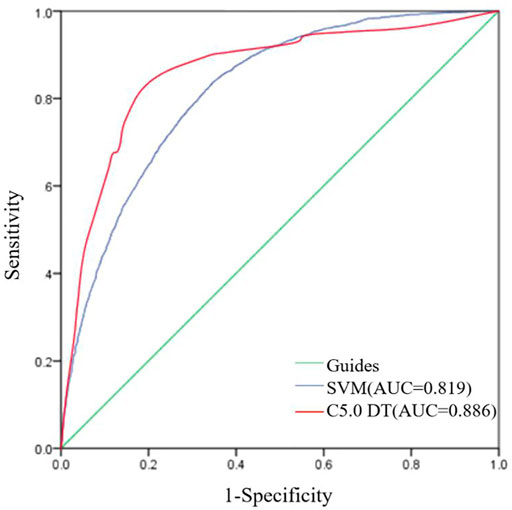
FIGURE 6. ROC curves for LSP of C5.0 DT and SVM models.
As shown in Figures 3, 4 and Table 1, for the basic environmental factors affecting the landslide susceptibility in Ruijin City. It is conducive to the occurrence of landslides, when the environmental factors are in these ranges where, the elevation is 139.7–308.5 m, the slope aspect is smaller than 202.5°, and the slope is high At 7.0°, the terrain wetness index is 2.5–6.6, the MNDWI is 0.39–0.62 or 0.74–0.86, the NDVI is 0.73–0.86, the NDBI is 0.16–0.27, and the lithology are Mesoproterozoic Pt2 (1), Late Paleoproterozoic (Z), Pt3, Silurian S, Triassic T, Quaternary Q. The influence degree of environmental factors on landslide susceptibility can more intuitively reflect the main environmental factors considered by different models and provide a theoretical reference for the LSP (Wu Y. et al., 2020; Chang et al., 2020; Zhao et al., 2020; Pan et al., 2021).
In this study, SPSS Modeler and R Studio software are used to analyze the main 10 environmental factors in the C5.0 DT and SVM models, and the importance of each factor is ranked. As shown in Figure 7, the environmental factors with higher importance in the SVM model are slope, lithology, elevation, gully density, terrain relief, etc. The environmental factors with a higher contribution degree considered by the C5.0 DT model are terrain relief, lithology, gully density, slope, etc. The top five environmental factors are the same for the C5.0 DT and SVM models, but the slope is more important in the SVM model, and the terrain relief is more important in the C5.0 DT model. This also leads to the difference in the LSP between C5.0 DT and SVM models. Comprehensive analysis shows that the LSP accuracy of the C5.0 DT model is greater than the results of the SVM model.
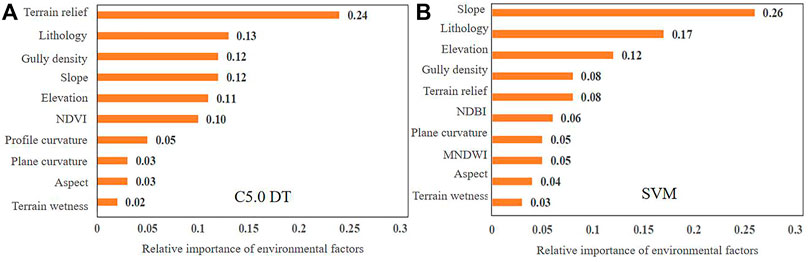
FIGURE 7. Relative importance of environmental factors, (A) C5.0 DT, (B) SVM.
Based on the analysis of the LSM and ROC curve in Ruijin City, the 366 landslides are concentrated in the high and very high susceptibility areas. Furthermore, the high and very high landslide areas are concentrated in the north and west of the study area. There are more landslides in the north and less in the south, more landslides in the edge and less in the middle. In the concentrated area of landslides, the altitude is low, the lithology formation is young, and the slope is relatively high. The obtained 12 types of basic environmental factors are representative. At the same time, the LSP of FR method based SVM and C5.0 DT is accurate, which have strong operability.
The reliability and LSP accuracy of the C5.0 DT model are higher than those of the SVM. The LSP result of C5.0 DT model can effectively give early warning to high landslide-prone area and reduce the occurrence of related safety accidents. Therefore, this study considers the C5.0 DT model to be an accurate and reliable LSP model. With the rapid development of big data platform, cloud computing, GIS and other technologies, machine learning have bright and broad application prospects in landslide susceptibility prediction (Dou et al., 2019; Merghadi et al., 2020). At the same time, C5.0 DT model is simple and clear, and has the advantages of easy learning, good reliability and high LSP accuracy (Abraham et al., 2021; Huang et al., 2021b).
This study explores the LSP results based on the FR method and C5.0 DT/SVM models in Ruijin City, and draws the following conclusions:
1) Both C5.0 DT and SVM models have high LSP accuracy, and the predicted landslide susceptibility maps are similar to each other on the whole. In addition, the landslides are mainly distributed in ravines and valleys. Especially, the landslides are likely to occur in the areas of moderate slope and large terrain relief.
2) The top contributing environmental factors calculated by the C5.0 DT/SVM models are terrain relief, lithology, gully density, slope and elevation. Factors that have minor effects on landslide susceptibility are the aspect, terrain wetness index, etc.
3) The C5.0 DT is an accurate and reliable LSP model. The LSP accuracy of C5.0 DT model is higher than that of the SVM model in LSP. It is concluded that we can predict accurate landslide susceptibility through combining the FR values and the C5.0 DT model.
The original contributions presented in the study are included in the article/supplementary material, further inquiries can be directed to the corresponding author.
MS, AH, and JZ contributed to conception and design of the study. JZ, XC, and YT collected Ruijin City local landslide inventory. GL performed the statistical analysis. MS and AH wrote the first draft of the manuscript. MS, AH, JZ, and YT wrote sections of the manuscript. All authors contributed to manuscript revision, and approved the submitted version.
This research is funded by the Natural Science Foundation of China (No.52069013 and 52109089).
The authors declare that the research was conducted in the absence of any commercial or financial relationships that could be construed as a potential conflict of interest.
All claims expressed in this article are solely those of the authors and do not necessarily represent those of their affiliated organizations, or those of the publisher, the editors and the reviewers. Any product that may be evaluated in this article, or claim that may be made by its manufacturer, is not guaranteed or endorsed by the publisher.
Abraham, M. T., Satyam, N., Jain, P., Pradhan, B., and Alamri, A. (2021). Effect of Spatial Resolution and Data Splitting on Landslide Susceptibility Mapping Using Different Machine Learning Algorithms. Geomatics, Nat. Hazards Risk 12, 3381–3408. doi:10.1080/19475705.2021.2011791
Akgun, A., Sezer, E. A., Nefeslioglu, H. A., Gokceoglu, C., and Pradhan, B. (2012). An Easy-To-Use MATLAB Program (MamLand) for the Assessment of Landslide Susceptibility Using a Mamdani Fuzzy Algorithm. Comput. Geosciences 38, 23–34. doi:10.1016/j.cageo.2011.04.012
Bai, S.-b., Lu, P., and Wang, J. (2015). Landslide Susceptibility Assessment of the Youfang Catchment Using Logistic Regression. J. Mt. Sci. 12, 816–827. doi:10.1007/s11629-014-3171-5
Bui, D. T., Tsangaratos, P., Nguyen, V.-T., Liem, N. V., and Trinh, P. T. (2020). Comparing the Prediction Performance of a Deep Learning Neural Network Model with Conventional Machine Learning Models in Landslide Susceptibility Assessment. CATENA 188, 104426. doi:10.1016/j.catena.2019.104426
Chang, Z., Du, Z., Zhang, F., Huang, F., Chen, J., Li, W., et al. (2020). Landslide Susceptibility Prediction Based on Remote Sensing Images and GIS: Comparisons of Supervised and Unsupervised Machine Learning Models. Remote Sens. 12, 502. doi:10.3390/rs12030502
Conforti, M., and Ietto, F. (2019). Influence of Tectonics and Morphometric Features on the Landslide Distribution: A Case Study from the Mesima Basin (Calabria, South Italy). J. Earth Sci. 31, 393–409. doi:10.1007/s12583-019-1231-z
Dai, C., Li, W., Wang, D., Lu, H., Xu, Q., and Jian, J. (2021). Active Landslide Detection Based on Sentinel-1 Data and InSAR Technology in Zhouqu County, Gansu Province, Northwest China. J. Earth Sci. 32, 1092–1103. doi:10.1007/s12583-020-1380-0
Dou, J., Yunus, A. P., Tien Bui, D., Merghadi, A., Sahana, M., Zhu, Z., et al. (2019). Assessment of Advanced Random Forest and Decision Tree Algorithms for Modeling Rainfall-Induced Landslide Susceptibility in the Izu-Oshima Volcanic Island, Japan. Sci. Total Environ. 662, 332–346. doi:10.1016/j.scitotenv.2019.01.221
Fawcett, T. (2006). An Introduction to ROC Analysis. Pattern Recognit. Lett. 27, 861–874. doi:10.1016/j.patrec.2005.10.010
Fu, X., Sheng, Q., Li, G., Zhang, Z., Zhou, Y., and Du, Y. (2020). Analysis of Landslide Stability under Seismic Action and Subsequent Rainfall: a Case Study on the Ganjiazhai Giant Landslide along the Zhaotong-Qiaojia Road during the 2014 Ludian Earthquake, Yunnan, China. Bull. Eng. Geol. Environ. 79, 5229–5248. doi:10.1007/s10064-020-01890-z
Fu, X., Sheng, Q., Zhang, Y., Chen, J., Zhang, S., and Zhang, Z. (2017). Computation of the Safety Factor for Slope Stability Using Discontinuous Deformation Analysis and the Vector Sum Method. Comput. Geotechnics 92, 68–76. doi:10.1016/j.compgeo.2017.07.026
Gkioulekas, I., and Papageorgiou, L. G. (2021). Tree Regression Models Using Statistical Testing and Mixed Integer Programming. Comput. Industrial Eng. 153, 107059. doi:10.1016/j.cie.2020.107059
Guo, C., Xu, Q., Dong, X., Li, W., Zhao, K., Lu, H., et al. (2021a). Geohazard Recognition and Inventory Mapping Using Airborne LiDAR Data in Complex Mountainous Areas. J. Earth Sci. 32, 1079–1091. doi:10.1007/s12583-021-1467-2
Guo, Z., Shi, Y., Huang, F., Fan, X., and Huang, J. (2021b). Landslide Susceptibility Zonation Method Based on C5.0 Decision Tree and K-Means Cluster Algorithms to Improve the Efficiency of Risk Management. Geosci. Front. 12, 101249. doi:10.1016/j.gsf.2021.101249
Guo, Z., Yin, K., Gui, L., Liu, Q., Huang, F., and Wang, T. (2019). Regional Rainfall Warning System for Landslides with Creep Deformation in Three Gorges Using a Statistical Black Box Model. Sci. Rep. 9, 8962. doi:10.1038/s41598-019-45403-9
Hong, H., Liu, J., and Zhu, A.-X. (2019). Landslide Susceptibility Evaluating Using Artificial Intelligence Method in the Youfang District (China). Environ. Earth Sci. 78, 8415. doi:10.1007/s12665-019-8415-9
Huang, F., Cao, Z., Guo, J., Jiang, S.-H., Li, S., and Guo, Z. (2020a). Comparisons of Heuristic, General Statistical and Machine Learning Models for Landslide Susceptibility Prediction and Mapping. Catena 191, 104580. doi:10.1016/j.catena.2020.104580
Huang, F., Cao, Z., Jiang, S.-H., Zhou, C., Huang, J., and Guo, Z. (2020b). Landslide Susceptibility Prediction Based on a Semi-supervised Multiple-Layer Perceptron Model. Landslides 17, 2919–2930. doi:10.1007/s10346-020-01473-9
Huang, F., Chen, J., Du, Z., Yao, C., Huang, J., Jiang, Q., et al. (2020c). Landslide Susceptibility Prediction Considering Regional Soil Erosion Based on Machine-Learning Models. Int. J. Geo-Info 9, 377. doi:10.3390/ijgi9060377
Huang, F., Chen, J., Liu, W., Huang, J., Hong, H., and Chen, W. (2022a). Regional Rainfall-Induced Landslide Hazard Warning Based on Landslide Susceptibility Mapping and a Critical Rainfall Threshold. Geomorphology 408, 108236. doi:10.1016/j.geomorph.2022.108236
Huang, F., Huang, J., Jiang, S., and Zhou, C. (2017a). Landslide Displacement Prediction Based on Multivariate Chaotic Model and Extreme Learning Machine. Eng. Geol. 218, 173–186. doi:10.1016/j.enggeo.2017.01.016
Huang, F. M., Wu, P., and Ziggah, Y. Y. (2016). GPS Monitoring Landslide Deformation Signal Processing Using Time-Series Model. Ijsip 9, 321–332. doi:10.14257/ijsip.2016.9.3.28
Huang, F., Pan, L., Fan, X., Jiang, S.-H., Huang, J., and Zhou, C. (2022b). The Uncertainty of Landslide Susceptibility Prediction Modeling: Suitability of Linear Conditioning Factors. Bull. Eng. Geol. Environ. 81, 182. doi:10.1007/s10064-022-02672-5
Huang, F., Tao, S., Chang, Z., Huang, J., Fan, X., Jiang, S.-H., et al. (2021a). Efficient and Automatic Extraction of Slope Units Based on Multi-Scale Segmentation Method for Landslide Assessments. Landslides 18, 3715–3731. doi:10.1007/s10346-021-01756-9
Huang, F., Yan, J., Fan, X., Yao, C., Huang, J., Chen, W., et al. (2022c). Uncertainty Pattern in Landslide Susceptibility Prediction Modelling: Effects of Different Landslide Boundaries and Spatial Shape Expressions. Geosci. Front. 13, 101317. doi:10.1016/j.gsf.2021.101317
Huang, F., Ye, Z., Jiang, S.-H., Huang, J., Chang, Z., and Chen, J. (2021b). Uncertainty Study of Landslide Susceptibility Prediction Considering the Different Attribute Interval Numbers of Environmental Factors and Different Data-Based Models. Catena 202, 105250. doi:10.1016/j.catena.2021.105250
Huang, F., Yin, K., Huang, J., Gui, L., and Wang, P. (2017b). Landslide Susceptibility Mapping Based on Self-Organizing-Map Network and Extreme Learning Machine. Eng. Geol. 223, 11–22. doi:10.1016/j.enggeo.2017.04.013
Huang, F., Zhang, J., Zhou, C., Wang, Y., Huang, J., and Zhu, L. (2019). A Deep Learning Algorithm Using a Fully Connected Sparse Autoencoder Neural Network for Landslide Susceptibility Prediction. Landslides 17, 217–229. doi:10.1007/s10346-019-01274-9
Ismail, E. H., Rogers, J. D., Ahmed, M. F., and Bakar, M. Z. A. (2016). Subsurface Profile Interpretation of Landslides, Examples from Bashilo River Watershed, Ethiopia. Environ. Earth Sci. 75, 5964. doi:10.1007/s12665-016-5964-z
Jiang, S.-H., and Huang, J.-S. (2016). Efficient Slope Reliability Analysis at Low-Probability Levels in Spatially Variable Soils. Comput. Geotechnics 75, 18–27. doi:10.1016/j.compgeo.2016.01.016
Jiang, S.-H., Huang, J., Huang, F., Yang, J., Yao, C., and Zhou, C.-B. (2018a). Modelling of Spatial Variability of Soil Undrained Shear Strength by Conditional Random Fields for Slope Reliability Analysis. Appl. Math. Model. 63, 374–389. doi:10.1016/j.apm.2018.06.030
Jiang, S.-H., Huang, J., Qi, X.-H., and Zhou, C.-B. (2020). Efficient Probabilistic Back Analysis of Spatially Varying Soil Parameters for Slope Reliability Assessment. Eng. Geol. 271, 105597. doi:10.1016/j.enggeo.2020.105597
Jiang, S.-H., Huang, J., Yao, C., and Yang, J. (2017). Quantitative Risk Assessment of Slope Failure in 2-D Spatially Variable Soils by Limit Equilibrium Method. Appl. Math. Model. 47, 710–725. doi:10.1016/j.apm.2017.03.048
Jiang, S.-H., Papaioannou, I., and Straub, D. (2018b). Bayesian Updating of Slope Reliability in Spatially Variable Soils with In-Situ Measurements. Eng. Geol. 239, 310–320. doi:10.1016/j.enggeo.2018.03.021
Kaur, H., Gupta, S., Parkash, S., and Thapa, R. (2018). Application of Geospatial Technologies for Multi-Hazard Mapping and Characterization of Associated Risk at Local Scale. Ann. GIS 24, 33–46. doi:10.1080/19475683.2018.1424739
Kouhartsiouk, D., and Perdikou, S. (2021). The Application of DInSAR and Bayesian Statistics for the Assessment of Landslide Susceptibility. Nat. Hazards 105, 2957–2985. doi:10.1007/s11069-020-04433-7
Li, W., Fan, X., Huang, F., Chen, W., Hong, H., Huang, J., et al. (2020). Uncertainties Analysis of Collapse Susceptibility Prediction Based on Remote Sensing and GIS: Influences of Different Data-Based Models and Connections between Collapses and Environmental Factors. Remote Sens. 12, 4134. doi:10.3390/rs12244134
Li, W., Shi, Y., Huang, F., Hong, H., and Song, G. (2021a). Uncertainties of Collapse Susceptibility Prediction Based on Remote Sensing and GIS: Effects of Different Machine Learning Models. Front. Earth Sci. 9, 731058. doi:10.3389/feart.2021.731058
Li, Z.-L., Leng, P., Zhou, C., Chen, K.-S., Zhou, F.-C., and Shang, G.-F. (2021b). Soil Moisture Retrieval from Remote Sensing Measurements: Current Knowledge and Directions for the Future. Earth-Science Rev. 218, 103673. doi:10.1016/j.earscirev.2021.103673
Lin, Q., Lima, P., Steger, S., Glade, T., Jiang, T., Zhang, J., et al. (2021). National-scale Data-Driven Rainfall Induced Landslide Susceptibility Mapping for China by Accounting for Incomplete Landslide Data. Geosci. Front. 12, 101248. doi:10.1016/j.gsf.2021.101248
Liu, L.-L., Yang, C., Huang, F.-M., and Wang, X.-M. (2021). Landslide Susceptibility Mapping by Attentional Factorization Machines Considering Feature Interactions. Geomatics, Nat. Hazards Risk 12, 1837–1861. doi:10.1080/19475705.2021.1950217
Ma, C., Yan, Z., Huang, P., and Gao, L. (2021). Evaluation of Landslide Susceptibility Based on the Occurrence Mechanism of Landslide: a Case Study in Yuan' an County, China. Environ. Earth Sci. 80, 9381. doi:10.1007/s12665-021-09381-4
Mao, Y., Zhang, M., Sun, P., and Wang, G. (2017). Landslide Susceptibility Assessment Using Uncertain Decision Tree Model in Loess Areas. Environ. Earth Sci. 76, 7096. doi:10.1007/s12665-017-7095-6
Marjanović, M., Kovačević, M., Bajat, B., and Voženílek, V. (2011). Landslide Susceptibility Assessment Using SVM Machine Learning Algorithm. Eng. Geol. 123, 225
Merghadi, A., Yunus, A. P., Dou, J., Whiteley, J., ThaiPham, B., Bui, D. T., et al. (2020). Machine Learning Methods for Landslide Susceptibility Studies: A Comparative Overview of Algorithm Performance. Earth-Science Rev. 207, 103225. doi:10.1016/j.earscirev.2020.103225
Nanda, A. M., Hassan, Z. u., Ahmed, P., and Kanth, T. A. (2020). Landslide Susceptibility Assessment of National Highway 1D from Sonamarg to Kargil, Jammu and Kashmir, India Using Frequency Ratio Method. GeoJournal 86, 2945–2956. doi:10.1007/s10708-020-10235-y
Pan, W., Pan, W., Luo, J., Fan, L., Li, S., and Erdenebileg, U. (2021). Slope Stability of Increasing Height and Expanding Capacity of South Dumping Site of Hesgoula Coal Mine: a Case Study. Int. J. Coal Sci. Technol. 8, 427–440. doi:10.1007/s40789-020-00335-y
Panchal, S., and Shrivastava, A. K. (2021). A Comparative Study of Frequency Ratio, Shannon's Entropy and Analytic Hierarchy Process (AHP) Models for Landslide Susceptibility Assessment. Int. J. Geo-Inf. 10, 603. doi:10.3390/ijgi10090603
Paryani, S., Neshat, A., and Pradhan, B. (2021). Spatial Landslide Susceptibility Mapping Using Integrating an Adaptive Neuro-Fuzzy Inference System (ANFIS) with Two Multi-Criteria Decision-Making Approaches. Theor. Appl. Climatol. 146, 489–509. doi:10.1007/s00704-021-03695-w
Qiu, H., Cui, P., Regmi, A. D., Hu, S., Zhang, Y., and He, Y. (2017). Landslide Distribution and Size versus Relative Relief (Shaanxi Province, China). Bull. Eng. Geol. Environ. 77, 1331–1342. doi:10.1007/s10064-017-1121-5
Ridwan, , Rasyidi, E. S., SyafriRahman, R., Rahman, R., Jumadil, N., and Ma’rief, A. A. (2021). Assessment of the Relationship between Building Density and Urban Heat Island Using Landsat Images in Makassar City. IOP Conf. Ser. Earth Environ. Sci. 802, 012042. doi:10.1088/1755-1315/802/1/012042
Shahabi, H., Hashim, M., and Ahmad, B. B. (2015). Remote Sensing and GIS-Based Landslide Susceptibility Mapping Using Frequency Ratio, Logistic Regression, and Fuzzy Logic Methods at the Central Zab Basin, Iran. Environ. Earth Sci. 73, 8647–8668. doi:10.1007/s12665-015-4028-0
Su, Q., Tao, W., Mei, S., Zhang, X., Li, K., Su, X., et al. (2021). Landslide Susceptibility Zoning Using C5.0 Decision Tree, Random Forest, Support Vector Machine and Comparison of Their Performance in a Coal Mine Area. Front. Earth Sci. 9, 7814272. doi:10.3389/feart.2021.781472
Sun, D., Xu, J., Wen, H., and Wang, Y. (2020). An Optimized Random Forest Model and its Generalization Ability in Landslide Susceptibility Mapping: Application in Two Areas of Three Gorges Reservoir, China. J. Earth Sci. 31, 1068–1086. doi:10.1007/s12583-020-1072-9
Vakhshoori, V., and Zare, M. (2018). Is the ROC Curve a Reliable Tool to Compare the Validity of Landslide Susceptibility Maps? Geomatics, Nat. Hazards Risk 9, 249–266. doi:10.1080/19475705.2018.1424043
Wang, M., Liu, M., Yang, S., and Shi, P. (2014). Incorporating Triggering and Environmental Factors in the Analysis of Earthquake-Induced Landslide Hazards. Int. J. Disaster Risk Sci. 5, 125–135. doi:10.1007/s13753-014-0020-7
Wang, Y., Tang, H., Huang, J., Wen, T., Ma, J., and Zhang, J. (2022). A Comparative Study of Different Machine Learning Methods for Reservoir Landslide Displacement Prediction. Eng. Geol. 298, 106544. doi:10.1016/j.enggeo.2022.106544
Wu, R., Zhang, Y., Guo, C., Yang, Z., Tang, J., and Su, F. (2020a). Landslide Susceptibility Assessment in Mountainous Area: a Case Study of Sichuan-Tibet Railway, China. Environ. Earth Sci. 79, 8878. doi:10.1007/s12665-020-8878-8
Wu, Y., Ke, Y., Chen, Z., Liang, S., Zhao, H., and Hong, H. (2020b). Application of Alternating Decision Tree with AdaBoost and Bagging Ensembles for Landslide Susceptibility Mapping. CATENA 187, 104396. doi:10.1016/j.catena.2019.104396
Xiao, T., Segoni, S., Chen, L., Yin, K., and Casagli, N. (2020). A Step beyond Landslide Susceptibility Maps: a Simple Method to Investigate and Explain the Different Outcomes Obtained by Different Approaches. Landslides 17, 627–640. doi:10.1007/s10346-019-01299-0
Xiao, T., Yu, L., Tian, W., Zhou, C., and Wang, L. (2021). Reducing Local Correlations Among Causal Factor Classifications as a Strategy to Improve Landslide Susceptibility Mapping. Front. Earth Sci. 9, 781674. doi:10.3389/feart.2021.781674
Yang, Y., Sun, G., Zheng, H., and Qi, Y. (2019). Investigation of the Sequential Excavation of a Soil-Rock-Mixture Slope Using the Numerical Manifold Method. Eng. Geol. 256, 93–109. doi:10.1016/j.enggeo.2019.05.005
Yang, Y., Sun, G., Zheng, H., and Yan, C. (2020a). An Improved Numerical Manifold Method with Multiple Layers of Mathematical Cover Systems for the Stability Analysis of Soil-Rock-Mixture Slopes. Eng. Geol. 264, 105373. doi:10.1016/j.enggeo.2019.105373
Yang, Y., Xu, D., Liu, F., and Zheng, H. (2020b). Modeling the Entire Progressive Failure Process of Rock Slopes Using a Strength-Based Criterion. Comput. Geotechnics 126, 103726. doi:10.1016/j.compgeo.2020.103726
Yu, D., Lv, L., Meng, F., Gao, F., He, J., Zhang, L., et al. (2021). Landslide Risk Assessment Based on Combination Weighting-Improved TOPSIS. IOP Conf. Ser. Earth Environ. Sci. 769, 032022. doi:10.1088/1755-1315/769/3/032022
Zhang, H., Ma, J., Chen, C., and Tian, X. (2020a). NDVI-net: A Fusion Network for Generating High-Resolution Normalized Difference Vegetation Index in Remote Sensing. ISPRS J. Photogrammetry Remote Sens. 168, 182–196. doi:10.1016/j.isprsjprs.2020.08.010
Zhang, Y.-X., Lan, H.-X., Li, L.-P., Wu, Y.-M., Chen, J.-H., and Tian, N.-M. (2020b). Optimizing the Frequency Ratio Method for Landslide Susceptibility Assessment: A Case Study of the Caiyuan Basin in the Southeast Mountainous Area of China. J. Mt. Sci. 17, 340–357. doi:10.1007/s11629-019-5702-6
Zhao, B., Ge, Y., and Chen, H. (2021a). Landslide Susceptibility Assessment for a Transmission Line in Gansu Province, China by Using a Hybrid Approach of Fractal Theory, Information Value, and Random Forest Models. Environ. Earth Sci. 80, 9737. doi:10.1007/s12665-021-09737-w
Zhao, H., Tian, Y., Guo, Q., Li, M., and Wu, J. (2020). The Slope Creep Law for a Soft Rock in an Open-Pit Mine in the Gobi Region of Xinjiang, China. Int. J. Coal Sci. Technol. 7, 371–379. doi:10.1007/s40789-020-00305-4
Zhao, Z., Liu, Z. y., and Xu, C. (2021b). Slope Unit-Based Landslide Susceptibility Mapping Using Certainty Factor, Support Vector Machine, Random Forest, CF-SVM and CF-RF Models. Front. Earth Sci. 9, 589630. doi:10.3389/feart.2021.589630
Zheng, Y., Chen, C., Liu, T., Song, D., and Meng, F. (2019a). Stability Analysis of Anti-dip Bedding Rock Slopes Locally Reinforced by Rock Bolts. Eng. Geol. 251, 228–240. doi:10.1016/j.enggeo.2019.02.002
Zheng, Y., Chen, C., Liu, T., Zhang, H., and Sun, C. (2019b). Theoretical and Numerical Study on the Block-Flexure Toppling Failure of Rock Slopes. Eng. Geol. 263, 105309. doi:10.1016/j.enggeo.2019.105309
Zheng, Y., Chen, C., Liu, T., Zhang, H., Xia, K., and Liu, F. (2018). Study on the Mechanisms of Flexural Toppling Failure in Anti-inclined Rock Slopes Using Numerical and Limit Equilibrium Models. Eng. Geol. 237, 116–128. doi:10.1016/j.enggeo.2018.02.006
Zheng, Y., Chen, C., Meng, F., Liu, T., and Xia, K. (2020). Assessing the Stability of Rock Slopes with Respect to Flexural Toppling Failure Using a Limit Equilibrium Model and Genetic Algorithm. Comput. Geotechnics 124, 103619. doi:10.1016/j.compgeo.2020.103619
Zhou, Y., Sheng, Q., Li, N., and Fu, X. (2022). The Dynamic Mechanical Properties of a Hard Rock under True Triaxial Damage-Controlled Dynamic Cyclic Loading with Different Loading Rates: A Case Study. Rock Mech. Rock Eng. 55, 2471–2492. doi:10.1007/s00603-021-02756-w
Keywords: landslide susceptibility prediction, C5.0 decision tree, support vector machine, frequency ratio, LSP accuracy
Citation: Sheng M, Zhou J, Chen X, Teng Y, Hong A and Liu G (2022) Landslide Susceptibility Prediction Based on Frequency Ratio Method and C5.0 Decision Tree Model. Front. Earth Sci. 10:918386. doi: 10.3389/feart.2022.918386
Received: 12 April 2022; Accepted: 09 May 2022;
Published: 31 May 2022.
Edited by:
Yongtao Yang, Institute of Rock and Soil Mechanics (CAS), ChinaReviewed by:
Ting Xiao, Beijing Institute of Technology, ChinaCopyright © 2022 Sheng, Zhou, Chen, Teng, Hong and Liu. This is an open-access article distributed under the terms of the Creative Commons Attribution License (CC BY). The use, distribution or reproduction in other forums is permitted, provided the original author(s) and the copyright owner(s) are credited and that the original publication in this journal is cited, in accordance with accepted academic practice. No use, distribution or reproduction is permitted which does not comply with these terms.
*Correspondence: Anyu Hong, aG9uZ2FueXVAbmN1LmVkdS5jbg==
Disclaimer: All claims expressed in this article are solely those of the authors and do not necessarily represent those of their affiliated organizations, or those of the publisher, the editors and the reviewers. Any product that may be evaluated in this article or claim that may be made by its manufacturer is not guaranteed or endorsed by the publisher.
Research integrity at Frontiers
Learn more about the work of our research integrity team to safeguard the quality of each article we publish.