 Weikai Liu1*
 Yanbin Zhao
 Ziming Feng
95% of researchers rate our articles as excellent or good
Learn more about the work of our research integrity team to safeguard the quality of each article we publish.
Find out more
ORIGINAL RESEARCH article
Front. Earth Sci. , 07 July 2022
Sec. Environmental Informatics and Remote Sensing
Volume 10 - 2022 | https://doi.org/10.3389/feart.2022.918384
This article is part of the Research Topic Applications of Artificial Intelligence in the Oil and Gas Industry View all 9 articles
Based on research on the response mechanism of formation and reservoir response to logging curves, 12 logging curves were selected in combination with formation depth characteristics, and 4 algorithms were used to identify the formation and reservoir: logistic regression (LR), support vector machine (SVM), random forest (RF), and XGBoost. In the study block, 57 wells out of 60 wells were selected for training and learning, and the remaining three wells were used as prediction samples. The recognition of formation thickness and reservoirs is performed by each of these four machine learning algorithms, and predictive knowledge is obtained separately. It was found that the accuracy of the four algorithms for formation thickness and reservoir layer identification reached over 90%, but the XGBoost algorithm was found to be the best in terms of the four scoring criteria of F1-score, precision, recall, and accuracy. The accuracy of formation thickness identification could reach over 95%, and the correlation analysis between the logging curve and formation thickness could be performed on this basis. The results show that RMN, RLLD, and RLLS have the most obvious response to the sandstone layer, off-surface reservoir, and effective thickness layer, while CAL has the least effect on formation and reservoir identification, which can provide an effective reference for the selection and downscaling of subsequent logging curves.
At present, methods of logging lithology identification mainly include conventional logging identification methods, conventional logging rendezvous map identification methods, imaging logging identification methods, principal component analysis methods, neural network methods, and transverse wave information rendezvous identification methods. In recent years, the use of machine learning algorithms to predict formation thickness and reservoir layer methods has also gradually diversified, among which He and Guo-Feng, (2002) proposed using the fuzzy ISODATA algorithm to optimize the prediction of formation thickness. Song et al. (2016) used the nonlinear prediction feature of the random forest algorithm to predict reservoir layers. Wang et al. (2010) used a support vector machine to eliminate multiple correlations between variables to study rock layer identification. Liu K. et al. (2020) used a mixed density network to establish a theoretical model to achieve effective prediction of sand thickness. Shan et al. (2015) used a BP neural network to identify gas reservoir layers with complex rock layers. Lei Huang et al. (Du, 2018) used a deep learning approach for formation thickness identification and correlation analysis.
In addition to the use of machine learning algorithms to establish a mathematical model, the reasonable choice of logging curves and features will also have a large impact on the accuracy of rock layer identification (Zhang et al., 2020). For example, Mou et al. (2015) used five logging curves of deep lateral, acoustic time difference, compensated neutron, density, and natural gamma to identify basal rocks in the Liaohe Basin. Wang et al. (2015) used five curves of resistivity, acoustic time difference, natural gamma, density, and acoustic impedance to identify basal rocks in the Liaohe Basin. Logging curves were used to identify the four major rock phases in the Jungar Basin; Zhu and Shi, (2013) used 15 logging curves, such as acoustic time difference, bulk density, photoelectric absorption cross-sectional index, natural gamma, compensated neutron, deep lateral, and shallow lateral, as multidimensional geological characterization parameters to identify the coal seams; Guo (2020) used five logging curves, such as lateral resistivity, density, natural gamma, sound speed, and natural potential, to identify the coal seams. The positioning was interpreted qualitatively; Yu et al. (2005) used four logging curves of acoustic time difference, density, natural potential, and natural gamma to select appropriate nuclear functions to predict the three major types of formation thickness of siltstone, mudstone, and conglomerate in an oil field.
However, all of the aforementioned articles have some problems, such as the high model complexity, inability to obtain the trained and mature model quickly, formation identification results are easily affected by the noise of the raw data, and the clarity of the formation data obtained from the logging curve is not high enough to support higher formation identification efficiency (Han et al., 2018). Based on the aforementioned problems, this article classifies the formation into sandstone layer, off-surface reservoir, and effective thickness layer from the perspective of reservoir evaluation and tries to identify the rock layer in this block by XGBoost, random forest, support vector machine, and logistic regression. By comparing the four algorithms, the XGBoost algorithm can effectively solve the problem of accurate identification of rock layers and reservoirs, which proves the generality of the method.
According to the field logging data and actual conditions, the working wells in this study block are basically shallow wells with depths ranging from 1,260 to 1,314 m. The logging data obtained from the field have well depths ranging from 1,035 to 1,300 m. The well section in this study block passes through the Sa Zero, Sa One, Sa Two, and Sa Three formations, which contain three to four large interbedded distribution formations, all of which are at depths below 1,200 m.
According to the logging data of 60 wells in an oil field block in Daqing and related literature, the development area has poor oil content, physical properties, and reservoir lithology, the stratigraphic sensitivity is serious, and the mobilization of crude oil reserves is low. From the perspective of the geological structure, the Songliao Basin is divided into three developmental stages: early, middle, and late stages. The study area experienced tectonic movement in the Songliao Basin in the early stage, which was mainly fault subsidence. The middle stage experienced subsidence of the land mass, and the late stage lifted the land mass again (Deng et al., 2020). The average content of clay minerals is 27.3%; kaolinite, montmorillonite, and illite constitute the majority of clay minerals, and the cementation type of rock is mainly pore cementation, with contact cementation accounting for a smaller proportion (Zhao, 2018). The reservoir physical characteristics of the study block can be obtained from an analysis of the field logging curves (Table 1). From the porosity distribution characteristics in Table 1, the block can be classified into medium- and low-porosity reservoirs.
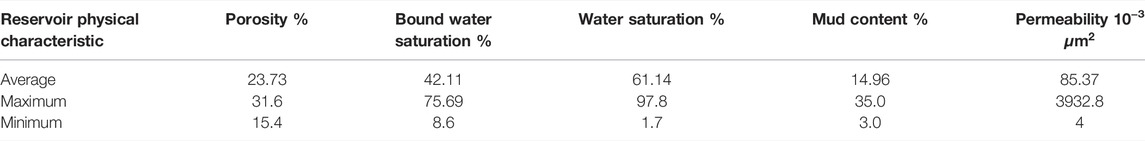
TABLE 1. Reservoir physical properties in the study area.
There are certain relationships between the reservoir physical properties of the study block. For example, there is a clear correlation between porosity and permeability (Figure 1). It can be seen from the figure that with increasing permeability, the porosity of a rock layer also increases. At the same time, it can be seen that the porosity of the vast majority of the stratigraphy measured is greater than 18%, which proves that the block belongs to medium- and low-porosity reservoirs.
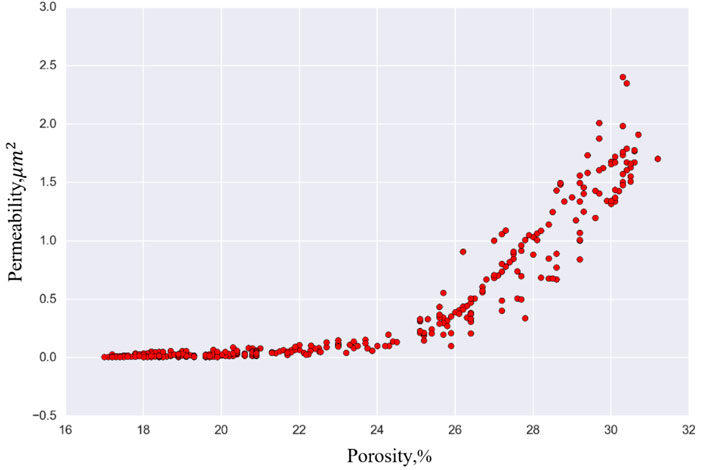
FIGURE 1. Relationship between porosity and permeability in the study area.
When identifying formations and reservoirs, it is important to select the correct and reasonable parameters. It is not the case that a larger number of input features are better; when too many logging curves are selected, a certain degree of negative feedback can occur, leading to a decrease in identification accuracy. In order to select more suitable logging curves, the response characteristics of sandstone formations and reservoirs are studied in this article.
Mudstone and sandstone, which are electrically distinct and easily identified, dominated the sandstone layers of this formation. For the mudstone, the corresponding characteristic curves are RLLD and RLLS below 5 Ω m, GR and DEN high, and SP at the baseline position. For sandstone, the corresponding characteristic curves are SP negative anomaly amplitudes greater than 2 mV and RLLD greater than 5.5 Ω m. The sandstone layer also contains some nonmudstone units, and the large set of sand bodies contains a small amount of mud interlayer constituting nonmudstone units. The corresponding characteristic curves are high resistance, high return rate, low GR and DEN, and large SP negative anomaly amplitude.
Off-surface reservoirs are reservoirs that still have oil-bearing characteristics under the physical criteria of effective thickness reservoirs, and thus far, there are no unified physical criteria for off-surface reservoirs. The off-surface reservoir is the transition zone and variation zone of the effective thickness reservoir, which interacts with the effective thickness layer in the longitudinal direction and bridges with the effective thickness layer in the lateral direction. The physical, electrical, oil-bearing, and lithological properties of off-surface reservoirs are consistent with each other. Performance is regarded as the reservoir with good sorting, and coarse lithology has greater porosity and permeability and higher oil-bearing grade, which is expressed in the logging curve as a higher apparent resistivity value, smaller DEN, larger BHC, and larger SP anomaly.
R25, RXO, RMN, and RMG belong to microelectrode logging; for microelectrode logging to identify the sandstone layer, the main observation is the amplitude difference between the micropotential curve and microgradient curve. When the microelectrode amplitude difference is greater than 0.1 Ω m, it can be used as a secondary discriminatory auxiliary standard to divide the sandstone layer. According to the different standards of sandstone layer division in each region, the degree of micropotential return in different depth strata ranges from greater than 14% to greater than 18%.
For sandstone formation identification, the commonly used sonic logging curve is the high-resolution sonic curve HAC. Generally, the sandstone profile shows low time difference and high sound velocity characteristics; the sound velocity is generally 55.5 μs/ft (182 μs/m). Some abnormal changes in sonic time difference will occur at the demarcation of sand mudstone; when in some formations with weaker mechanical strength, due to the possible abrupt change in the well diameter, it will cause some pseudo-abnormal changes in the sonic time difference curve, which requires the field staff to combine their professional knowledge to make the corresponding determination. CAL can usually reflect the influence of the formation on the well diameter and has an auxiliary judgment role for formation identification.
Based on the aforementioned analysis, combined with the petrophysical logging response mechanism (Tong, 2018), this article selected the logging depth and 12 logging curves with sensitive response to the rock layer, namely, micronormal curve RMN, microinverse RMG, high-resolution deep lateral resistivity devices curve RLLD, high-resolution shallow sensor curve RLLS, the resistivity of the flushed zone RXO, high-resolution acoustic curve HAC, 2.5 m resistivity R25, caliper curve CAL, gamma-ray curve GR, density curve DEN, borehole-compensated curve BHC, and self-potential curve SP, as multidimensional geological and characterization parameters for intelligent identification of sandstone layers, off-surface reservoir layers, and effective thickness layers (Table 2).
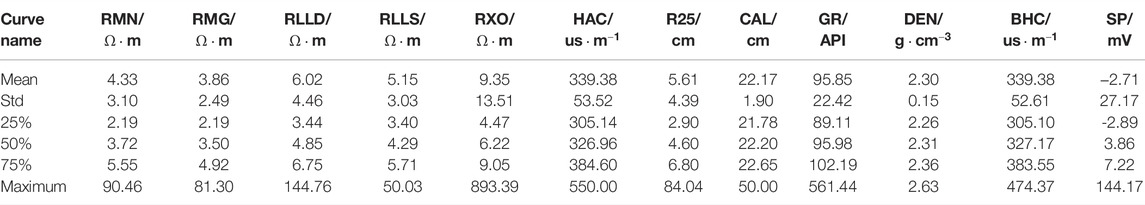
TABLE 2. Statistical summary of 12 logging curves.
In order to investigate the implied relationships between the 12 logging curves in Table 2, relationship curves can be obtained by correlating the potential, gradient, and resistivity data (Figure 2) to understand that there is a certain trend in the relationship between the logging curves in this test area. It can be seen from the figure that there is an obvious linear and regular relationship between RMN, RMG, RLLD, and RLLS, indicating that these four parameters are closely related to each other. According to the principle of machine learning algorithm, it is known that when multiple kinds of highly correlated data appear in the dataset features, machine learning can be enhanced to increase the weight of this part of logging data, so that a model can be trained that is closer to the actual working environment in the field. Machine learning can be used to accurately identify the implied relationships between the log curve data and establish the corresponding algorithmic parameter equations.
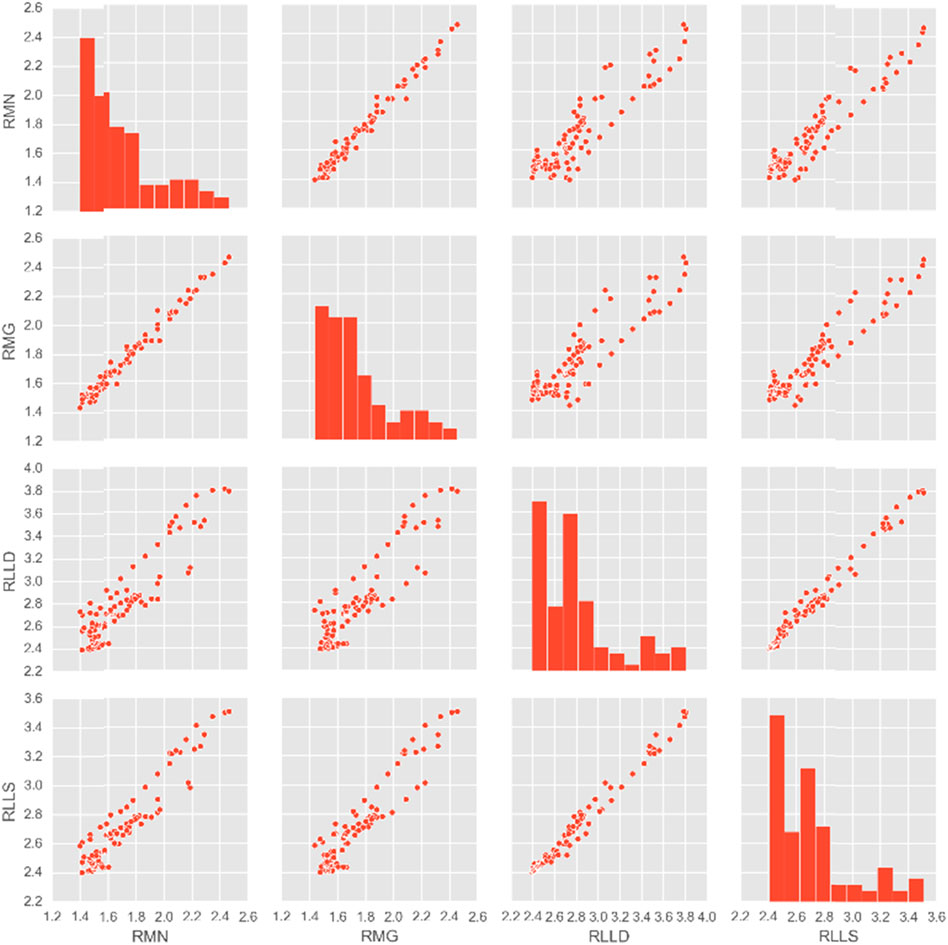
FIGURE 2. Scatter plot of the correlation among RMN, RMG, RLLD, and RLLS.
This article attempts to use the following four algorithms: logistic regression (LR), support vector machine (SVM), random forest (RF), and XGBoost. XGBoost is selected when the parameters overlap and the input values are the same.
Logistic regression is a simple classification algorithm commonly used in machine learning to find the optimal partition boundaries by iterating over the data (Hobza T 2020), completing the classification of the data with the following assumption functions:
where
The support vector machine is a linear classifier defined to have the largest spacing in the feature space (Hobza et al., 2008). The SVM also contains different kernel functions, which makes the SVM both a linear and a nonlinear classifier. The maximum feature space spacing is solved by the pairwise optimization equation. The optimization function for solving the maximum feature space interval is as follows:
where
Random forest is an ensemble learning algorithm based on decision trees. Random forest uses CART decision trees as a weak learner, using a method that randomly selects a small number of features, and the number of selected features defaults to the square root of the total number of features (Burges, 1998). Assuming that the given dataset is
XGBoost is an optimally distributed decision gradient boosting model with low computational complexity, flexibility, high accuracy, and portability, which is 10 times faster than the existing popular solutions on a single machine (Liu X. et al., 2020). To reduce the complexity of the model and prevent overfitting, a regularization term is added. The overall function of the model is:
where ensemble learning
Data from a total of 60 wells were obtained from the study block, and as much data as possible were used in the model learning process. Therefore, 57 of them were randomly selected for training and learning, and three of them (N1-10, N1-20, and N1-31) were used as a validation set to verify the actual effect of each algorithm. Observing the distribution of the training data by aggregating all the training data, it can be seen that the sandstone layer, off-surface reservoir, and effective thickness layers account for a tiny percentage of the total formation data; that is, there is a certain class of samples in the dataset that is much more or much less than the other classes. Thus, at this point, the problem is transformed into an imbalance problem (Figure 3). In this case, depending on the characteristics of each algorithm, traditional machine learning methods would not be able to solve this problem, leading to a reduction in the accuracy of formation thickness identification. Therefore, the SMOTETomek algorithm is used for sampling to produce new data sufficient to ensure the rationality of the decision space in a few classes, balancing the data classes on the premise of ensuring the original distribution (Figure 4).
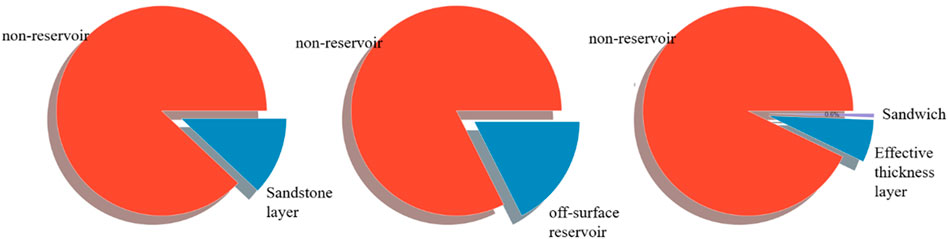
FIGURE 3. Distribution ratio of the sandstone and reservoir in original data.
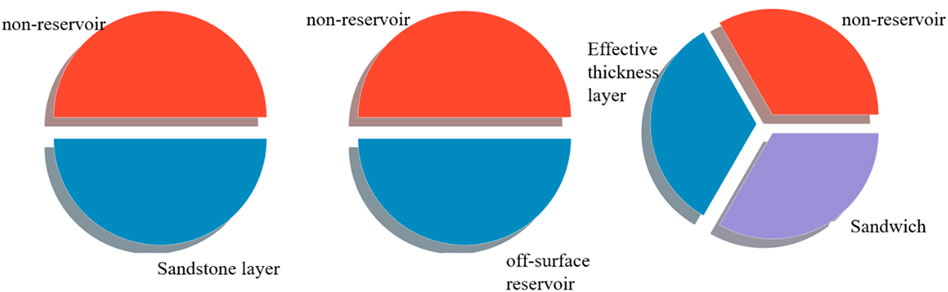
FIGURE 4. Distribution ratio of the sandstone and reservoir after SMOTETomek sampling.
Usually, instead of simply copying the samples during oversampling, some methods are used to generate new samples. For example, the SMOTETomek algorithm selects a random sample y from its K nearest neighbors for each sample x of a small number of classes of samples and then selects a random point on the x, y line as the newly synthesized sample. This oversampling method of synthesizing new samples can reduce the risk of overfitting. Then, the samples are divided into noise samples, hazard samples, and safety samples according to certain rules, and then the noise samples are directly deleted, the hazard samples are processed by the approximate division method, and the safety samples are oversampled by SMOTETomek. Based on this sampling principle, it can be inferred that the method maximally conforms to the distribution trend of the original data, and although the data are resampled, the benefits brought by this algorithm are greater than the distress caused by the imbalance problem.
The equilibrium dataset obtained after sampling by the SMOTETomek algorithm was standardized to obtain training data with a normal data distribution, and the test well section data were fitted according to the distribution of the training well section to obtain test well section data conforming to the training sample. The final valid input data consisted of 246,051 training data and 13,972 test data with a normal distribution of well depth and 12 logging curves.
In this article, the functions used to measure the effect of rock layer and reservoir identification are F1-score, precision, recall, and accuracy (Li et al., 2020). The F1-score is a measure of the classification problem; it is the harmonic average of precision and recall; the maximum is 1, and the minimum is 0. Precision refers to the proportion of positive samples among the positive cases judged by the classifier (Tharwat et al., 2017); recall refers to the proportion of positive cases among the total positive cases predicted by the classifier; accuracy represents the proportion of the correct judgment of the whole sample by the classifier; the formulas are as follows:
where TP is the correctly predicted answer, FP is the incorrect prediction of other classes as this class, FN is the prediction of this class label as another class label, and TN is the incorrectly predicted answer.
Four algorithms were used to perform the formation and reservoir identification processes based on the study block logging data (Figure 5). The RMN, RMG, RLLD, RLLS, RXO, HAC, R25, CAL, GR, DEN, BHC, and SP data obtained in the field were randomly divided into the formation recognition training set and the test set in a ratio of 7:3. The formation recognition dataset first underwent SMOTE resampling, and the processed formation data were input into the LR algorithm, SVM algorithm, RF algorithm, and XGBoost algorithm, respectively, after the standardization process again. The test set data are input into the pre-training model again, the output is the result of formation identification, and Then the optimal formation recognition model is selected by screening the results.
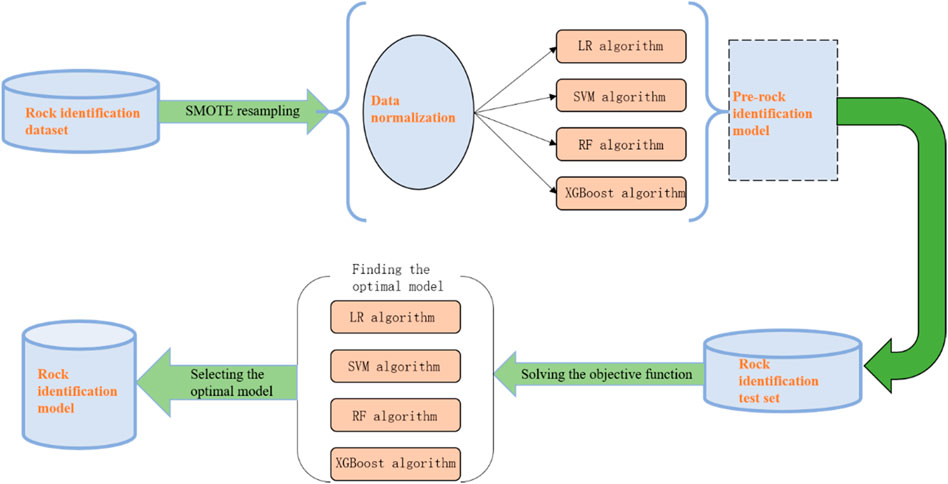
FIGURE 5. Identification process of strata and reservoirs.
Valid data after data preprocessing were entered into the LR, SVM, RF, and XGBoost algorithms. Due to the unbalanced logging data in this classification, there are limited valid data for the rock and reservoir layers, so recall and accuracy should be considered in the results.
The configuration used by the article in training the model is as follows: AMD Ryzen 5 CPU, NVIDIA GeForce GTX 1660 GPU, and 16G running memory (Tang, J. et al., 2019). For the sandstone layer, XGBoost has 86% recall with 96% accuracy; for the off-surface reservoir layer, XGBoost has 85% recall with 94% accuracy; for the effective thickness reservoir layer, XGBoost has 81% recall with accuracy remaining above 95%, while the LR, SVM, and RF algorithms also have an accuracy of over 90%. It can be seen in the overall F1-score that these three algorithms are not as effective as XGBoost for integrated rock layer identification; in the process of effective thickness layer identification, due to the distribution ratio of the three types of interlayers in the stratum and the characteristics of the algorithms of LR and SVM (Gong et al., 2019), the two algorithms cannot converge, so they are not discussed here.
From the time point of view, the training time of the XGBoost algorithm for logging curve data is also the least among the four algorithms, which takes only 3 s, indicating that the XGBoost algorithm is more popular in the field of formation thickness and reservoir identification. (Table 3). On this basis (Figure 6), correlation analysis of logging curve characteristics, the logging curve with the highest sensitivity to the effect of formation thickness and reservoir identification was calculated by the analysis (Ryu et al., 2021). Since XGBoost is a class of tree-integrated algorithms, the algorithm itself is configured to analyze the influence of features on the relevance of the results, and deriving this influence factor yields importance ratios of 0.42, 0.28, and 0.17 for RMN, RLLD, and RLLS, respectively. The results showed that the response of the RMN, RLLD, and RLLS is the most obvious for the sandstone layer, off-surface reservoir layer, and effective thickness layer, and the well diameter curve has the least effect on the rock and reservoir layer identification. These results can provide an effective reference for the selection and dimensionality reduction of subsequent logging curves.
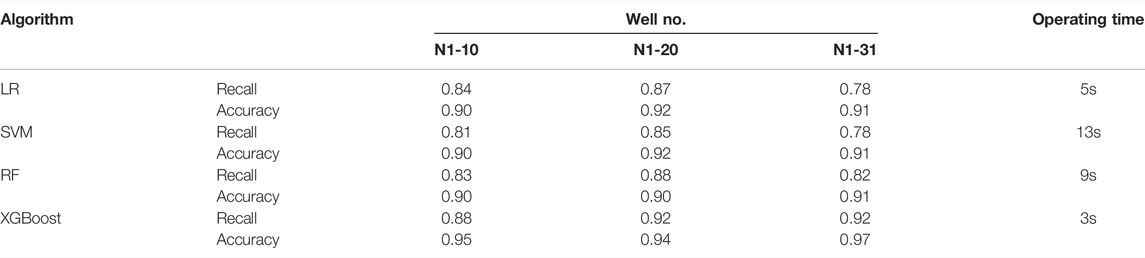
TABLE 3. Comparison of LR, SVM, RF, and XGBoost algorithms.
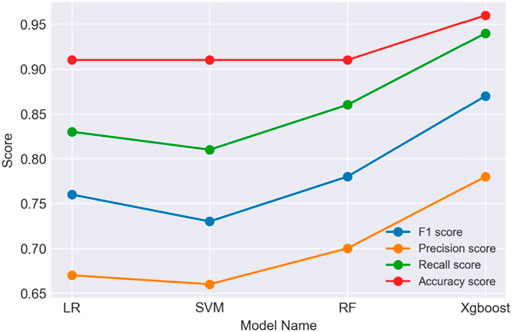
FIGURE 6. Comparison of average scores of four models.
The sandstones in the study block of this article mostly develop trough-like interlacing laminations but also block formations, deformation formations, drainage formations, oblique laminations, and horizontal laminations (Candefjord et al., 2021). The mudstone is a rock dominated by clay minerals. According to the silt content, there are two types: siltstone and mudstone. Siltstone is a type of mudstone with 10–50% silt content, and mudstone is a type of mudstone with <10% silt content. Therefore, the research method proposed in this article can be well applied to strata with the aforementioned characteristics (Li et al., 2021).
The innovation of this article lies in proposing four of the most popular and effective machine learning models, which are compared with the same logging data to select the optimal solution for downhole rock stratification identification, especially for the downhole rock stratification identification problem, where few people have used the XGBoost model for rock stratification through logging curves, and also confirming at the theoretical level and data level that the XGBoost model’s operation is a good fit to the logging curve.
The intelligent method proposed in this article is a pioneering experiment in this field because few researchers have studied the problem of rock stratification and others have performed so on the basis of experiments.
Another innovation of this article is that the SMOTETomek algorithm is proposed and used to resample the logging curve data, transform the imbalance problem into a balance problem, which largely solves the problem of too large a gap in the data ratio between positive and negative samples, and improve the accuracy of downhole rock stratification identification.
The specific interpretation results for the three wells are shown in Figure 7.
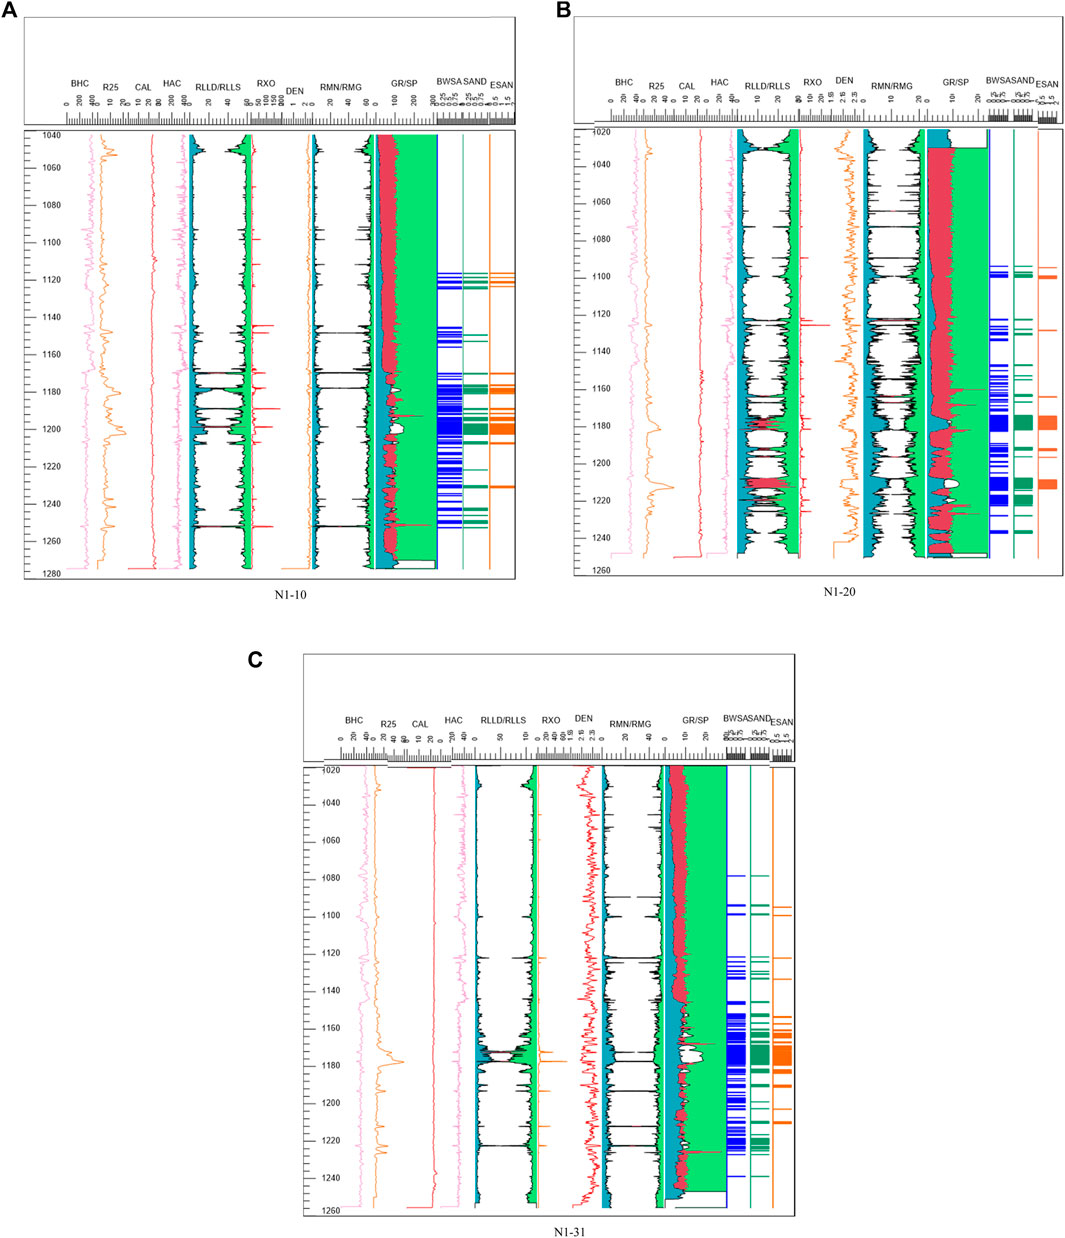
FIGURE 7. Interpretation results of three wells. (A) N1-10. (B) N1-20. (C) N1-31.
1) In the identification of formation thickness and reservoirs, a total of 12 response features selected from field logging data, RMN, RMG, RLLD, RLLS, RXO, HAC, R25, CAL, GR, DEN, BHC, and SP, can effectively identify reactive rock and reservoir layers intelligently by their location in the ground.
2) The study selected four machine learning algorithms, LR, SVM, RF, and XGBoost, and compared the F1-scores, precision, recall, accuracy, and computation time of the four algorithms. Through a comprehensive comparison of the five discriminatory methods, the study shows that the XGBoost algorithm is the most effective for rock and reservoir layer identification, with an average accuracy of more than 95%.
3) When faced with an uneven distribution of logging data, such as the three types of interlayer interference and nonreservoir interference, the SMOTETomek algorithm is selected to interpolate the interlayer and reservoir layers, which can effectively balance the data and improve the accuracy of formation and reservoir identification.
The original contributions presented in the study are included in the article/Supplementary Material; further inquiries can be directed to the corresponding authors.
All authors listed have made a substantial, direct, and intellectual contribution to the work and approved it for publication.
This work was supported by the National Natural Science Foundation of China (Youth Project) (No. 52004064) and Postdoctoral Projects in Heilongjiang Province (No. LBH-Z20044).
MY was employed by the company No.6 Oil Provide Factory, Daqing Oilfield Limited Company. YX was employed by the company Institute of Drilling Engineering Technology. GL was employed by the company CNPC Logging Daqing Branch.
The remaining authors declare that the research was conducted in the absence of any commercial or financial relationships that could be construed as a potential conflict of interest.
All claims expressed in this article are solely those of the authors and do not necessarily represent those of their affiliated organizations, or those of the publisher, the editors, and the reviewers. Any product that may be evaluated in this article, or claim that may be made by its manufacturer, is not guaranteed or endorsed by the publisher.
Burges, C. J. C. (1998). A Tutorial on Support Vector Machines for Pattern Recognition. Data Min. Knowl. Discov. 2 (2), 121–167. doi:10.1023/a:1009715923555
Candefjord, S., Nguyen, L., Buendia, R., Oropeza-Moe, M., Andersen, N. G., Fhager, A., et al. (2021). A Wearable Microwave Instrument Can Detect and Monitor Traumatic Abdominal Injuries in a Porcine Model. Sci. Rep. 11, 23220. doi:10.1038/s41598-021-02008-5
Deng, M., Fang, C., Deng, P., Zhang, Y., and Zhu, J. (2020). Origin of Strike-Slip Thrust Structure in Lishu Area, Southern Songliao Basin: A Case Study of Xiaokuan Fault Belt. Acta Pet. Sin. 41 (09), 1089–1099. doi:10.7623/syxb202009005
Du, C. (2018). Research on Reservoir Identification Method Based on Convolutional Neural Networks. Chengdu: Chengdu University of Technology.
Gong, Q., Liu, Z., Song, G., Xia, Z., Liu, J., Guan, B., et al. (2019). Inter-Layers in Alluvial-Fan Thick Sandy Conglomerate Reservoir of Kunbei Oilfield, Qaidam Basin. Acta Pet. Sin. 40 (02), 152–164. doi:10.7623/syxb201902003
Guo, X. (2020). Identification of Coal Reservoir by Logging Curves - a Case Study of CK1 Well. Energy Technol. Manag. 45 (05), 166–168. doi:10.3969/j.issn.1672-9943.2020.05.059
Han, W., Zhou, Y., and Chi, Y. (2018). Deep Learning Convolutional Neural Networks for Random Noise Attenuation in Seismic Data. Geophys. Prospect. Pet. 57 (06), 862–869+877. Available at: http://www.geophysics.cn/CN/10.3969/j.issn.1000-1441.2018.06.008. doi:10.3969/j.issn.1000-1441.2018.06.008
He, P., and Guo-Feng, P. (2002). The Improvement of Fuzzy Isodata and its Application to Reservoir Prediction. J. Hebei Univ. Technol. 31 (02), 101–105. doi:10.3969/j.issn.1007-2373.2002.02.020
Hobza, T., Pardo, L., and Vajda, I. (2008). Robust Median Estimator in Logistic Regression. J. Stat. Plan. Inference 138 (12), 3822–3840. doi:10.1016/j.jspi.2008.02.010
Li, D., Liu, X., Zha, W., Yang, J., and Lu, D. (2020). Automatic Well Test Interpretation Based on Convolutional Neural Network for a Radial Composite Reservoir. Pet. Explor. Dev. 47 (3), 623–631. doi:10.1016/S1876-3804(20)60079-9
Li, J., Yu, Z., Zhou, Z., Wang, Y., and Li, J. (2021). Mechanical Analysis and Failure Modes Prediction of Composite Rock under Uniaxial Compression. Sci. Rep. 11, 22826. doi:10.1038/s41598-021-02331-x
Liu, K., Yin, C., Zhao, H., and Zhang, Y. (2020). Prediction of Sand Body Thickness Based on a Mixed Density Network Constrained by a Spatially Approximated Probability. Geophys. Prospect. Pet. 59 (04), 596–606+615. Available at: http://www.geophysics.cn/CN/10.3969/j.issn.1000-1441.2020.04.010. doi:10.3969/j.issn.1000-1441.2020.04.010
Liu, X., Li, D., Yang, J., Zha, W., Zhou, Z., Gao, L., et al. (2020). Automatic Well Test Interpretation Based on Convolutional Neural Network for Infinite Reservoir. J. Pet. Sci. Eng. 195, 107618. doi:10.1016/j.petrol.2020.107618
Mou, D., Wang, Z., Huang, Y., Xu, S., and Zhou, D.-P. (2015). Lithological Identification of Volcanic Rocks from SVM Well Logging Data: Case Study in the Eastern Depression of Liaohe Basin. Chin. J. Geophys. 58 (05), 1785–1793. doi:10.6038/cjg20150528
Ryu, B., Yoo, S., Kim, S., and Choi, J. (2021). Thirty-day Hospital Readmission Prediction Model Based on Common Data Model with Weather and Air Quality Data. Sci. Rep. 11, 23313. doi:10.1038/s41598-021-02395-9
Shan, J., Chen, X., Zhao, Z., Ge, X., and Zhang, Y. (2015). Identification of Complex Lithology for Tight Sandstone Gas Reservoirs Sase on BP Neural Net. Prog. Geophys. 30 (03), 1257–1263. doi:10.6038/pg20150335
Song, J., Gao, Q., and Li, Z. (2016). Application of Random Forests for Regression to Seismic Reservoir Prediction. Oil Geophys. Prospect. 51 (06), 1202–1211. doi:10.13810/j.cnki.issn.1000-7210.2016.06.021
Tharwat, A., Hassanien, A. E., and Elnaghi, B. E. (2017). A BA-Based Algorithm for Parameter Optimization of Support Vector Machine. Pattern Recognit. Lett. 93 (1), 13–22. doi:10.1016/j.patrec.2016.10.007
Tong, C. (2018). The Study of Logging Response Characteristics and Mechanism of Ultra-Long Borehole Cores Based on the Scientific Drilling in Songliao Basin. Sichuan Province, China: Jilin University.
Wang, Z., Zhang, S-N., and Kuang, J-C. (2010). A PCA-SVM Model for Reservoir Identification. Comput. Tech. Geophys. Geochem. Explor. 32 (06), 636–640+568. doi:10.3969/j.issn.1001-1749.2010.06.012
Wang, Z., Zhu, X., Sun, Z., Luo, X., Dai, X., and Dai, Y. (2015). Igneous Lithology Identification and Lithofacies Classification in the Basin Using Logging Data: Taking Junggar Basin as an Example. Earth Sci. Front. 22 (03), 254–268. doi:10.13745/j.esf.2015.03.022
Yu, D., Sun, J., Wang, H., Chen, W., Li, Z., Zhang, Z., et al. (2005). A New Method for Logging Lithology Identification: SVM. Pet. Geol. Oilfield Dev. Daqing 24 (5), 93–95. doi:10.3969/j.issn.1000-3754.2005.05.033
Zhang, J., Liu, Y., and Wan, W. (2020). Lithology Identification and Reservoir Prediction of Volcanic Reservoir in Xiquan Area. Xinjiang Oil Gas 16 (03), 6–10+1. doi:10.3969/j.issn.1673-2677.2020.03.003
Zhao, Y. (2018). Study on Reservoir Geological Characteristics of SA0 Formation in Sabei Development Area of Daqing Oilfield. Chem. Enterp. Manag. 16 (16), 220. doi:10.3969/j.issn.1008-4800.2018.16.154
Keywords: formation identification, reservoir identification, logging curves, XGBoost algorithm, machine learning, class imbalance learning
Citation: Liu W, Zhao Y, Yang M, Xu Y, Li G and Feng Z (2022) XGBoost Formation Thickness Identification Based on Logging Data. Front. Earth Sci. 10:918384. doi: 10.3389/feart.2022.918384
Received: 12 April 2022; Accepted: 23 May 2022;
Published: 07 July 2022.
Edited by:
Qinzhuo Liao, King Fahd University of Petroleum and Minerals, Saudi ArabiaReviewed by:
Z. Z, Hefei University of Technology, ChinaCopyright © 2022 Liu, Zhao, Yang, Xu, Li and Feng. This is an open-access article distributed under the terms of the Creative Commons Attribution License (CC BY). The use, distribution or reproduction in other forums is permitted, provided the original author(s) and the copyright owner(s) are credited and that the original publication in this journal is cited, in accordance with accepted academic practice. No use, distribution or reproduction is permitted which does not comply with these terms.
*Correspondence: Weikai Liu, bHdremRkQDE2My5jb20=; Ziming Feng, eHVleXVhbmZ6bUBhbGl5dW4uY29t
Disclaimer: All claims expressed in this article are solely those of the authors and do not necessarily represent those of their affiliated organizations, or those of the publisher, the editors and the reviewers. Any product that may be evaluated in this article or claim that may be made by its manufacturer is not guaranteed or endorsed by the publisher.
Research integrity at Frontiers
Learn more about the work of our research integrity team to safeguard the quality of each article we publish.