- 1Department of Geological Information, Chengdu Center, China Geological Survey, Chengdu, China
- 2Department of Fundamental Geological, Natural Resources Aerial Geophysical and Remote Sensing Center of China Geological Survey, Beijing, China
- 3Department of Geological Information, Research Center of Applied Geology of China Geological Survey, Chengdu, China
Urban geological modeling (UGM) is a fundamental approach for the visualization of underground space and recognition of complex geological conditions of a city. Previous UGM studies, with the assumption of homogeneous geological characteristics, have resulted in deviated modeling properties due to the negligence of parameters with obviously different spatial distributions in lithologies. This study presents a case study of Guang’an city in SW China by using a sequential simulation interpolation (SSI) method that reflects geological heterogeneity by combining field surveys, topography, borehole data, geological profiles, and stratigraphic columns to establish a lithology distribution model in the study area. The geotechnical attribute model of the area of interest was established based on lithology to capture subtle variations in lithology due to obvious differences in geotechnical characteristics of clay, sand, mudstone, sandy mudstone, and shaly sandstone. This 3D model could provide a reference for the urban underground space master planning and future sustainable development of Guang’an city. In addition, this study also discusses the prospects and directions of urban geological modeling and provides a few suggestions for engineering in urban areas.
Introduction
Urban areas are the priority place where people gather and anthropogenic activities occur. It is estimated that over 70% of the world’s population will be living in urban areas by 2050 (Price et al., 2018; Zhang et al., 2021b). Rapid urbanization has put massive pressure on land use and environmental optimization and has brought enormous challenges to urban master planning and sustainable development. These are forcing urban designers and administrators to take action to alleviate environmental pressure caused by population explosion and to assess new suitable spaces for future development.
Urban underground space (UUS) is a potential space that can be adapted to surface architecture and conditions and has attracted increasing attention worldwide as a promising way to address human-land conflicts, big city diseases, and future sustainable development problems. Proper use of UUS could make most of the available space and mitigate the potential interactions between the existing and planned objects (Li et al., 2021).
Distinct from the urban surface, UUS is fragile and vulnerable to damage during the development and utilization due to its geological features (Zhu et al., 2016), which would experience permanent and irreversible changes once utilized. Also, irrational development often leads to irregular arrangement of underground structures, which could cause safety issues, such as geological hazards like collapse and seepage (Tan et al., 2021). Therefore, it is crucial to identify the urban geological features before the utilization of UUS (Liao et al., 2006).
The advancement of computer processing speed and visualization methodology has enabled geologists to reveal the geology of UUS in an easy-to-read format through two-dimensional (2D) mapping and three-dimensional (3D) visualization. 2D mapping based on the GIS platform is mainly used for surface and subsurface UUS surveys worldwide (Dai et al., 2001; Xiong et al., 2006; El May et al., 2010; Hou et al., 2016; Peng and Peng, 2018; Andriamamonjisoa and Hubert-Ferrari, 2019; Zhou et al., 2019; Li et al., 2020; Mao et al., 2020), which could integrate geological factors with groundwater, geothermal, and geological materials (Doyle, 2016; Andriamamonjisoa and Hubert-Ferrari, 2019; Zhou et al., 2019). Combined with evaluation methods such as the analytic hierarchy process (AHP) and the most unfavorable grade method (MUGM), a comprehensive multielement qualitative to semi-quantitative UUS assessment model could be constructed (Guan et al., 2008; Peng et al., 2010; Liu et al., 2011; Peng and Peng, 2018). 3D modeling is an advanced visualization of these factors in UUS survey (Thierry et al., 2009; Tame et al., 2013; Mielby and Sandersen, 2017; He et al., 2020). It is characterized by the reflection of survey depth on the z-axis and spatial coupling of geological bodies, which has become a popular technique, gradually replacing 2D mapping in UUS survey, although its direct use may come from derived 2D map outputs (Price et al., 2018). However, previous studies using this approach may have considered geological features to be homogenous rather than heterogeneous, which could produce deviations in the geotechnical properties. Therefore, when modeling the attributed characteristics of geotechnical properties, caution should be taken in the selection of the interpolation method, the recognition of geological heterogeneity, and variations of small-scale vertical lithology to minimize the possible modeling deviations.
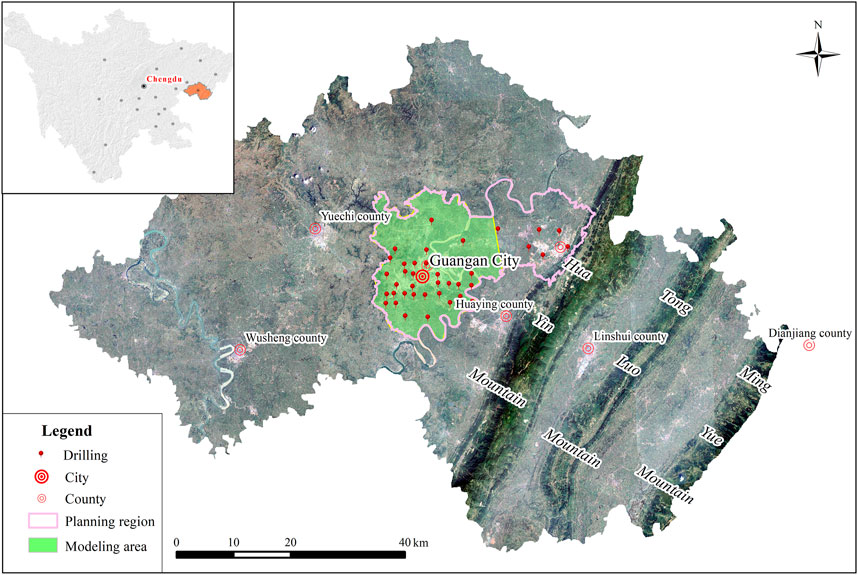
This study introduced the concepts of geological modeling based on the workflow in the GOCAD (version 2017) platform and proposed the proper selection of the interpolation method for lithology and geotechnical properties based on the available 2D/3D datasets. Sequential indicator simulation (SIS) that depicts the lithological spatial distribution and provides a zonal basis for attribute parameter models was chosen to build the 3D lithology model. Accordingly, small-scale variations in lithology with the lengths of the cores were revealed by collecting lithology data from 38 nonprofit boreholes distributed in the study area (Figure 1).
The attribute model of geotechnical properties based on the zonation of lithology was constructed using the sequential Gaussian simulation (SGS) method, which reveals distribution characteristics of geological conditions. Furthermore, 2D information derived from 3D geological and geotechnical properties was presented for UUS optimization and urban master planning.
3D Modeling Methodology
Introduction to Geostatistics Interpolation
Geostatistics is a powerful technique to estimate unknown values in a specific field based on the available data by interpolation, which is the core of the system (Hou, 1996; Hou, 1997; Hu, 2007). A proper interpolation method could reduce the deviation of interpolation results when building 3D geological models and is thus crucial for geologists and modelers to get reliable results.
Kriging and SSI are the most commonly adopted interpolation tools in 2D mapping and 3D modeling, respectively. In particular, the application of Kriging has been widely used in the fields of geology, oil, mining, and atmosphere (Wycisk et al., 2009; Yan et al., 2011; Yu et al., 2013). Theoretically, kriging takes regionalized variables as the core variables and attempts to obtain the best, unbiased, and minimum variance interpolation results (Xin et al., 1997), which indicate deterministic mapping or modeling results. The interpolation is merely from the initial available data using correlation defined by variograms (or semi-variograms). Comparing SSI against Kriging, SSI transforms data to a standard normal distribution; a value is randomly drawn from the normal distribution, and then the value and original data are used to interpolate (Rahimi et al., 2018). After that, the simulated values are then back-transformed to the reference distribution to acquire the real value.
The differences between Kriging and SIS demonstrate distinct application scenarios. SSI highlights the potential to respond to the heterogeneity and uncertainty of rocks and soils that show different geotechnical properties varying with positions (Asghari et al., 2009). The interpolation results of SSI are less smooth than those of the kriging method due to the mathematical logic (Liu et al., 2018), which corresponds to the underground distribution of geological bodies.
Therefore, kriging is suitable for small-scale and data-rich situations, whereas SSI is a better stochastic approach for urban geological modeling (UGM), especially for regions with uneven data distribution and large-scale modeling. Modeling using SSI instead of the kriging method could minimize the deviations of modeling and maintain a better intensity of global spatial variation (Hu, 2007; Zhao et al., 2010).
Sequential Simulation Interpolation Parameter Settings
The semi-variogram model is crucial to SSI; thus, the parameter settings of the semi-variogram model affect the reliability of modeling results. There are two sections in the semi-variogram model that represent spatial correlation in vertical and areal sectors, respectively. The key factors of the parameter setting consist of lag distance, number of lags, tolerance, bandwidth, direction, range, and sill. Lag distance and the number of lag computation based on data characteristics using empirical formulas are shown in Table 1. Tolerance and bandwidth are automatically calculated based on the lag distance and data characteristics. The direction, range, and sill are defined in the experiment by calculating the distance vs. semi-variance of data pairs which respond to the spatial correlation of input data. Direction and relevant range will be set when the semi-variance of data pairs sustains the longest distance in a particular direction. Sill is defined when the semi-variance of data pairs reaches a steady state in distance. Figure 2 demonstrates the case of the sand lithology semi-variogram model. The major direction was set to 45°, and the minor direction was set to 135° because semi-variance of data pairs sustains the longest distance in 45°. The corresponding range is set to 3,400 and 3,000 m; the sill value is set to about 0.2 where the semi-variance roughly remains constant along distance.
3D Geological Modeling Workflow
The GOCAD platform, initially designed for reservoir modeling and sedimentary formation, is compatible with UGM and mining modeling to meet the increasing requirements of diverse modeling tasks. This package provides tools for geologists to construct UUS models with pure data or multifactor datasets, including borehole data, 2D boundaries, cross sections, and seismic data (Zhou et al., 2020). Furthermore, regardless of data density, this package is capable of establishing a desired model covering all available data in the workflow, which is characterized by streamlining steps.
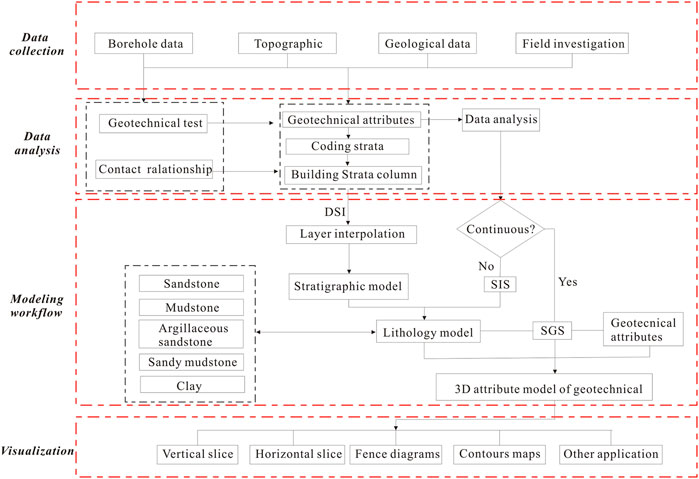
In general, the modeling workflow includes four steps (Figure 3). First, the available datasets for the tasks are gathered, analyzed, and sorted out. Second, contact relationships of strata are classified into conformable, eroded, baselap, and unconformable. Third, all strata data are imported to the workflow to produce a triangulated irregular network (TIN) surface of formations using the discrete smooth interpolation (DSI) method. Then, a fault framework is constructed, and contact relationships are revised based on the formation ages of faults. Finally, a specific grid size is set up, and a geological model is established by superposing strata and faults together.
Once the geological model is produced, the property model can be combined with the dataset through streamlining steps. First, properties from the borehole data are analyzed and classified, and thus, semi-variograms that reflect the spatial variability of different properties are built, respectively. Second, a lithology model is established based on the rock classification using SIS, an SSI method designed for a discrete dataset. Finally, a property model is constructed based on lithology zonation using SGS; an SSI method was designed for continuous datasets, such as porosity and permeability.
The workflow offered by GOCAD software not only improves the modeling speed but also ensures conflict-free processing of the multi-source datasets and precise modeling results.
3D Modeling and Results
Geological Setting
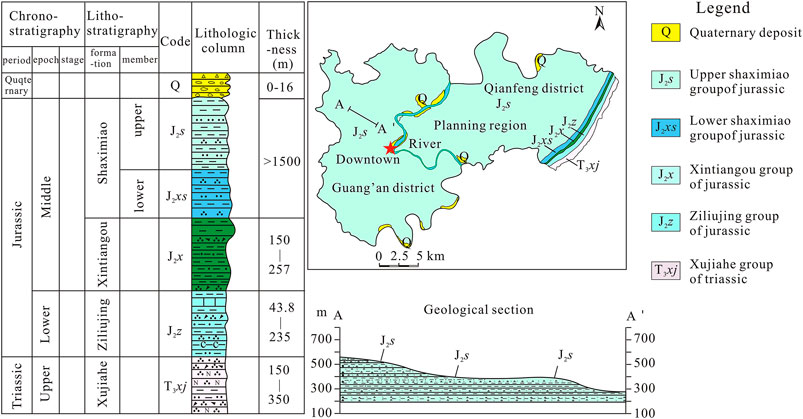
Guang’an city is situated at the junction of Sichuan province and Chongqing city and has lower elevations in the west than in the east (Figure 1) (Zhang et al., 2021a). It spans two different natural geographic regions, the red soil hilly area of Sichuan and the lower mountain area of the Huaying Mountain, and belongs to the Upper Yangtze platform and the Central Sichuan depression (Wei et al., 2017). The area is characterized by weak active fractures, with low magnitude seismic activity mainly in the eastern part. The Cambrian, Ordovician, Silurian, Carboniferous, Permian, Triassic, Jurassic, and Quaternary strata are exposed in the study area with gentle dip angles (1–5°). The most widely distributed Jurassic Shaximiao Formation (J2s) of 400–500 m thickness shows moderate to strong weathering (Figure 4). Interlayered and lenticular sand and mudstone account for about 80% of the entire outcrop.
Introduction to Modeling Raw Data
The modeling raw data are composed of boreholes, DEM, and geological section in this study.
Boreholes could offer reality intrusive investigation data which are vital to construct a reliable geological model. The stratigraphic and attribute modeling data are primarily derived from 38 nonprofit boreholes distributed in the study area. Wells are scattered in the planning region of Guang’an city and primarily located in the west region. Altitude and depth vary from 409 to 236 m and from 120.4 to 50 m. All the wells were drilled vertically, and coring was performed along the whole well section. Lengths of coring are between 0.3 and 0.7 m. The mechanical experiment of coring was performed in two qualified companies located in Sichuan and Chongqing. Tensile strength and shear strength experiments were implemented by the southern construction engineering testing corporation in Chongqing, and other attribute experiments were accomplished by the geological engineering exploration institute corporation in Sichuan. Specific attribute experiments in one coring sample, which were carried out more than once, were averaged for attribute modeling, such as compression strength and tensile strength.
The geological section was adopted to provide a whole picture of the stratum to support stratigraphic stratification. In this study, a geological section was surveyed in the northwest area in the study area, (Figure 4) and it ranges from 510 to 253 m in altitude. The outcrops of the section only consist of the Shaximiao (J2s) Formation. Therefore, stratigraphic stratification was implemented according to the proportion and rhythm of sand and mudstone in the outcrop.
DEM provides the surface shape of the model. DEM data were downloaded from the public Google earth map with 30 m resolution in the .tiff format, which covered the whole Guang’an city, and was converted to the .dat format for modeling in a GIS-based platform.
Stratigraphic Modeling
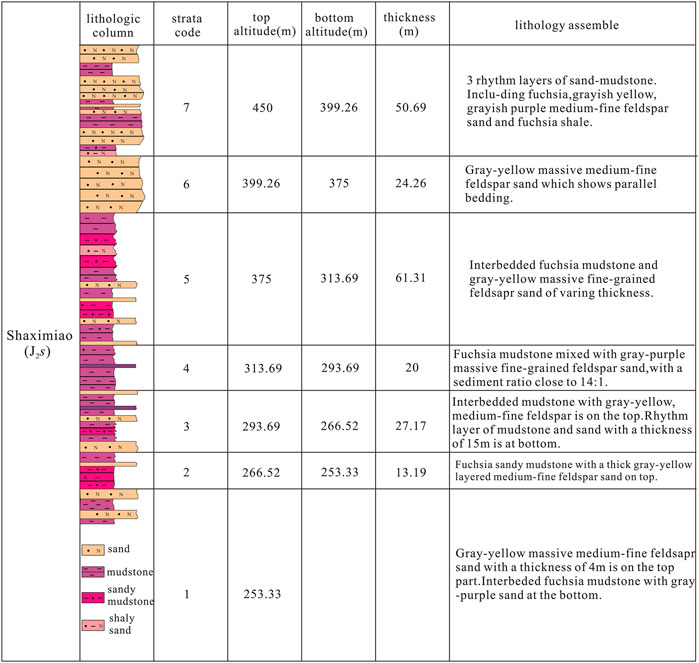
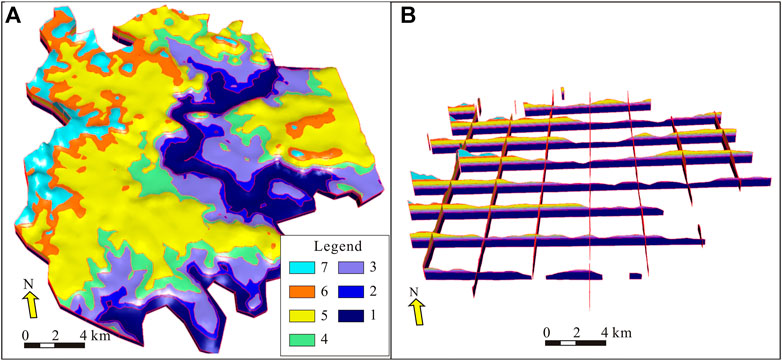
To perform stratigraphic modeling, the priority task is to stratify and construct a stratigraphic column. The Jurassic Shaximiao Formation (J2s), as the primarily exposed formation in the study area, is dominated by sand and mudstone with insignificant stratigraphy, but lithostratigraphy offers a way to correlate and group similar geological layers, according to their assemblage, geotechnical properties, and geological evolution history. It is combined with the gentle occurrence and geological section survey of the strata. Stratigraphic stratification was rationale marked for the Shaximiao (J2s) Formation. Thus, the Shaximiao (J2s) Formation can be divided into seven geotechnical units and named from one to seven in altitude from 450 to 200 m (Figure 5). The stratigraphic column which constrains the vertical deposition sequence of the seven units was established. In the column, the contact relationship is set to be conformable due to the absence of sedimentary gaps between those units. The surface digital elevation model (DEM) obtained from Google Earth is used to represent surface to cover the available datasets, with the contact relationship with geotechnical units set to be eroded. Fracture is rare in the study area and was thus not included in the workflow.
On the basis of the abovementioned work, TIN surfaces of units were possible to construct. DSI was employed in the process to generate the TIN surfaces, and the stratigraphic mark was used as “hard” data to constrain the depth of the surfaces. A GIS-based outline of the modeling area was adopted to constrain the extension and shape of the model. The top and bottom of the stratigraphic model were set to 600 and 150 m in altitude, respectively, to include all the above-mentioned datasets. The resolution of the model was set distinctively to satisfy the data interpolation requirement. Horizontal grid cells were set to 200 m × 200 m to reduce the number of grids and processing time. Vertical grid cells set to 1 m for unit 7 to unit 2 and 5 m for unit 1. Since most borehole data were between unit 7 and unit 2, they require a higher resolution for further attribute interpolation than unit 1 (Figure 6).
The whole stratigraphic modeling process mentioned in this section is illustrated in Figure 3.
Lithology and Engineering Geological Modeling
Inferior lithology was ignored in the previous geological modeling. The dominant lithology in the units or layers was adopted to represent the units or layers, which skipped subtle vertical lithological changes. This study transformed the lithology to a logging curve format and classified them into five categories of clay, sand, mudstone, shaly sandstone, and sandy mudstone based on the coring length without neglecting small-scale lithological changes.
Furthermore, the lithology curves were upscaled to the high vertical resolution grids as mentioned earlier; combined with the SIS method and semi-variogram, the lithology model (Figure 7) could be established following the workflow introduced previously. This approach could capture subtle vertical changes in lithology and make full use of core data, effectively refining the lithology modeling.
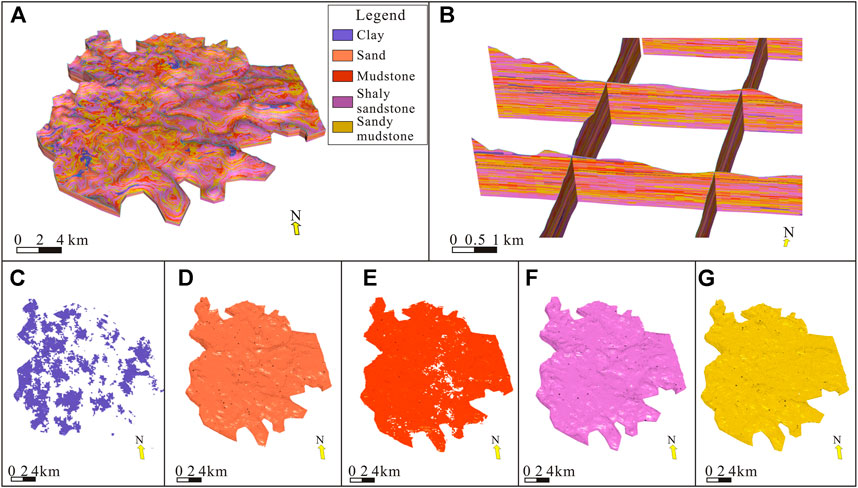
FIGURE 7. Lithology model (A), fence diagram (B), and lithology distribution of the research area (C,D,E,F, and G).
After lithology modeling, it is possible to produce the attribute of geotechnical properties from the borehole records. In Guang’an city, each property, such as porosity, cohesion, and permeability, was established, respectively, due to the different geological characteristics between lithologies. The process of property modeling is similar to that of lithology modeling. Interpolation employed in property modeling (Figure 8) was SGS because geotechnical logging data were considered to be continuous rather than discrete.
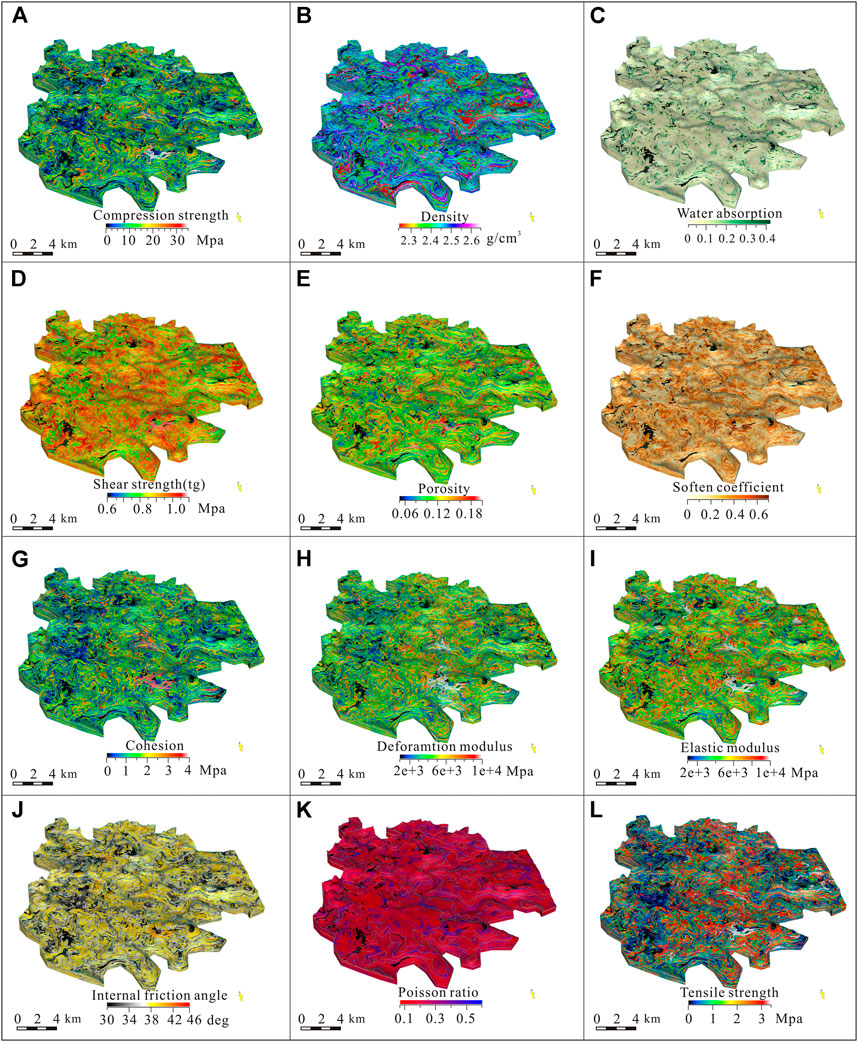
FIGURE 8. Geotechnical attribute model of Guang’an city. (A) compression strength; (B) density; (C) water absorption; (D) shear strength (tg); (E) porosity; (F) soften coefficient; (G) cohesion; (H) deformation modulus; (I) elastic modulus; (J) internal friction angle; (K) Poisson’s ratio; (L) tensile strength.
Discussion
Borehole and topographic data were adopted to produce the initial 3D urban geological model of Guang’an city. Based on the high-resolution urban geological model, lithologies of clay, sand, mudstone, shaly sandstone, and sandy mudstone and 12 geotechnical properties were modeled. Horizontal (Figure 9) and vertical slices of these models described previously were set to demonstrate the extension of geological bodies. The lithology and property variations with depth and the underground geology conditions were thus revealed. Importantly, the geotechnical model and derived 2D outputs provide the potential for the qualitative or quantitative assessment of UUS combined with the evaluation methods such as AHP or numerical simulation. More details of implication are discussed below:
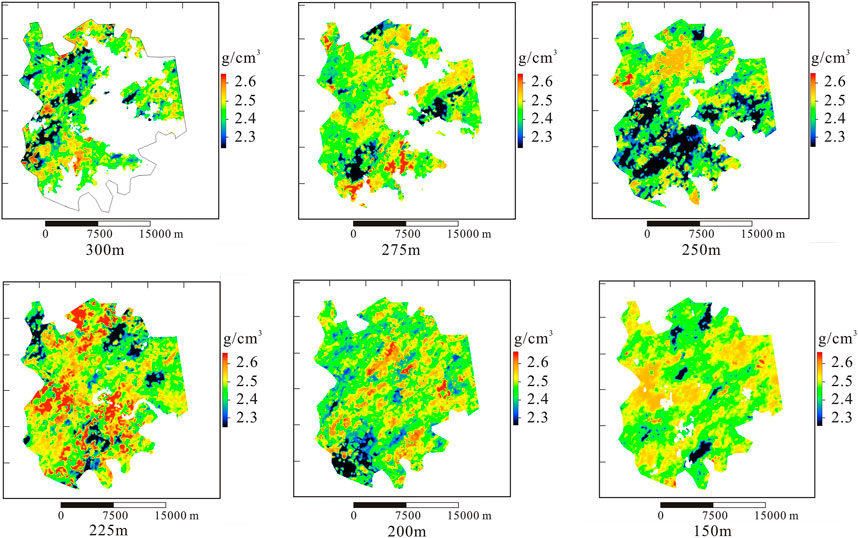
FIGURE 9. Horizontal slices of the geotechnical model in different elevations (considering density as an example).
Visualization
Visualization is the primary application of the 3D geological model. In contrast to the traditional GIS-based illustrations that are constrained in a fixed 2D-scene, the 3D geological model offers the ability to rotate the model in real 3D space from the surface to certain depth, which reveals the panorama of the study area. Meanwhile, fence diagrams, cross sections, and 2D slice extracts from the model present the extension and tendency of geobodies where investigation data are absent.
Furthermore, fence diagram, cross sections, 2D slices, and artificial construction could be coupled in the geological model to detect possible spatial distribution conflicts. Specifically, it is vital to underground artificial construction, such as tunnel construction. The model could provide measurable packages of hazardous geobodies (faults and gypsum) that have major effect on cost and safety in tunnel construction which could mitigate waste of space in tunnel construction by offering precise coordinates of these hazardous geobodies at the planning phase of tunnel construction.
Statistics and Simulation
The geological model is the visualization of numerals and data from multisource investigation. Therefore, it is essentially measurable and statistical of all the elements that are consisted in the geological model. Statistics of the geological model could offer the overall picture of features that interest the users of the model.
Mostly mentioned urban geological model statistics characteristics including area, volume, distance, and curvature could be accomplished by the statistic of stratigraphic structure modeling. Additional information like properties or attributes is usually derived from the attribute or property model. Features of the corresponding properties could be revealed by generating visualization diagrams and charts of the properties such as histograms, cross-plots, and pie-charts. Furthermore, natural resource reserve computation or analysis is available through a combination of particular dimensional properties on the basis of previous statistics.
Simulation is a major application of the urban geological model and statistics. The differentiation between simulation and statistic is enormous. Simulation mainly focuses on the dynamic restoration of the geological process and illustrates the principle of the present phenomenon. Meanwhile, simulation provides predictions of geology evolution over time or under particular situations. However, statistics is merely the summary of the present phenomenon without restoring or predicting the function.
Generally, realization of the specific simulation purpose through the integrating geological model with simulation software packages, for instance, Flac3D and ANSYS, is commonly adopted to implement geomechanics simulation, and FEFLOW is employed to simulate underground water migration and preservation. However, caution should be taken to mitigate simulation deviation caused by tiny deformation while transferring the model to simulation software packages and parameter settings before simulation.
3D Assessment of the Geological Resource
Traditional assessments of urban geological resources are two-dimensional (x, y) based on the GIS platform. The urban geological model offers the ability to conduct the assessment in three dimensions (x, y, and z). Taking suitability evaluation of urban underground space exploitation as an example, the urban geological model offers a high-dimensional dataset from heterogeneous property/attribute modeling. Every cell that makes up the model is an independent unit for assessment. Quantities of properties/attributes are dimensional of the units. Even more, assessors could transfer two-dimensional properties or factors into 3D for the units by assigning the properties or factors to the units with the same plane coordinates. Furthermore, by coupling AHP, MUGM, or the unsupervised learning algorithm, a three-dimensional quantitative evaluation of urban underground space could be achieved.
Suggestions for Future Urban Underground Space Utilization
Although the modeling approach of UUS provides impressive results, a few questions still need to be discussed before its wide utilization in future projects. First of all, data quantity and density uncertainty could give outcomes that deviated from the actual situation. An additional intrusive investigation is a precise way to obtain underground geological conditions, but it is costly and time-consuming. Therefore, combining the region-scale geophysical methods, which could provide a framework of the area of interest, with the available borehole data as “hard” constraints can alleviate the uncertainty and improve the reliability in a shorter time frame and at a lower cost. Second, due to the different theoretical frameworks that software manufacturers employed, the format barriers of geological models reduce the communication between disciplines and hinder the share of results to a wider audience. Therefore, there is an urgent need for a universal format of the UUS model that could be applied in various modeling systems. Third, the popularity and application of UUS should be further explored. The UUS model is not only a tool to illustrate the spatial coupling of geological bodies, but more importantly, it provides primary and public data for other disciplines. In recent years, attempts have been made in the applications of UUS models in underground engineering, geothermal, and groundwater. However, multidisciplinary collaboration and applications still need to be deepened to facilitate the usability of geological models produced by geologists. Finally, artificial construction coupling with geological models needs further research, in particular platforms that can simultaneously display, modify, and analyze the construction and geological models.
Generally, 3D UGM describes UUS in a regional scale and cannot replace the site-specific intrusive investigation. It could provide a brief reference with a gradually precise reliability modeling approach before conducting a site-specific assessment. Integrated with geotechnical variability and semi-quantitative analysis, 3D UGM enables urban planners to assess potential application and conflicts of underground geological unit assets and to optimize the future development of the urban underground survey.
Conclusion
Stratigraphy, lithology, and 12 geotechnical properties were successfully modeled. Horizontal slices of the geotechnical model at various altitudes were set up for display and query based on the borehole data by GOCAD software. Given the possible heterogeneous and inadequate data display in this case study, a better method to model the lithology and properties is to adopt SIS and SGS as interpolation methods instead of kriging. These methods provide the ability to model and capture variations in geotechnical properties based on lithology zonation and the high-resolution grid in the core-length scale.
Although the results of geotechnical property modeling are likely to be influenced by insufficient information or lower data density, this modeling is still a vital approach to identify the underground geological conditions, guide the initial evaluation, and restrict the UUS design based on physical characteristics. This 3D UGM, thus, will lower the future risk and uncertainty of decision-making in the spatial planning of UUS in Guang’an city (Zhang et al., 2020).
Data Availability Statement
The raw data supporting the conclusions of this article will be made available by the authors, without undue reservation.
Author Contributions
FZ performed modeling and dataset cleaning and wrote the first draft of the manuscript. ML, YL, and CH contributed to field investigation and geotechnical unit classification. HL and MH contributed to data collection and organization. JZ and BW contributed to manuscript revision, read, and approved the submitted version.
Funding
This research was financially supported by the China Geological Survey projects “Comprehensive geological survey of resources and environment in Guang’an, Sichuan” (DD20190524), “Geological survey of multi-energy resources in important basins in southwest China” (DD20221661), and “Geological safety examination and risk assessment in economic circle of Chengdu-Chongqing” (DD20221733).
Conflict of Interest
The authors declare that the research was conducted in the absence of any commercial or financial relationships that could be construed as a potential conflict of interest.
The reviewer ZL declared a shared affiliation with the author BW to the handling editor at the time of review.
Publisher’s Note
All claims expressed in this article are solely those of the authors and do not necessarily represent those of their affiliated organizations, or those of the publisher, the editors, and the reviewers. Any product that may be evaluated in this article, or claim that may be made by its manufacturer, is not guaranteed or endorsed by the publisher.
Acknowledgments
The authors would like to appreciate the software technical support from Paradigm Inc. They also would like to express their gratitude for content’s revised suggestions from reviewers and the editor.
Abbreviations
AHP, analytic hierarchy process; DEM, digital elevation model; MUGM, most unfavorable grade method; SGS, sequential Gaussian simulation; SIS, sequential indicator simulation; SSI, sequential simulation interpolation; TIN, triangulated irregular network; UGM, urban geological modeling; UUS, urban underground space.
References
Andersen, T. R., Poulsen, S. E., Pagola, M. A., Medhus, A. B., and Vernoux, J. F. (2020). Geophysical Mapping and 3D Geological Modelling to Support Urban Planning: A Case Study from Vejle, Denmark. J. Appl. Geophys. 180 (1), 104130–104164. doi:10.1016/J.Jappgeo.2020.104130
Andriamamonjisoa, S. N., and Hubert-Ferrari, A. (2019). Combining Geology, Geomorphology and Geotechnical Data for a Safer Urban Extension: Application to the Antananarivo Capital City (Madagascar). J. Afr. Earth Sci. 151, 417–437. doi:10.1016/J.Jafrearsci.2018.12.003
Asghari, O., Soltni, F., and Amnieh, H. B. (2009). Comparison between Sequential Gaussian Simulation (SGS) of Choghart Ore Deposit and Geostatistical Estimation Through Ordinary Kriging. Aust. J. Basic Appl. Sci. 3 (1), 12.
Dai, F. C., Lee, C. F., and Zhang, X. H. (2001). GIS-based Geo-Environmental Evaluation for Urban Land-Use Planning: A Case Study. Eng. Geol. 61 (4), 257–271. doi:10.1016/S0013-7952(01)00028-X
Doyle, M. R. (2016). From Hydro/Geology to the Streetscape: Evaluating Urban Underground Resource Potential. Tunn. Undergr. Space Technol. 55, 83–95. doi:10.1016/J.Tust.2016.01.021
El May, M., Dlala, M., and Chenini, I. (2010). Urban Geological Mapping: Geotechnical Data Analysis for Rational Development Planning. Eng. Geol. 116 (1), 129–138. doi:10.1016/J.Enggeo.2010.08.002
Guan, S. Y., Zhu, R., and Gao, Z. Y. (2008). The Influence of Geological Conditions on the Exploitation and Zoning Evaluation in Wuhan City. Geotech. Investig. 9, 5–10. CNKI:SUN:GCKC.0.2008-09-004.
He, H., He, J., Xiao, J., Zhou, Y., Liu, Y., and Li, C. (2020). 3D Geological Modeling and Engineering Properties of Shallow Superficial Deposits: A Case Study in Beijing, China. Tunn. Undergr. Space Technol. 100, 103390–103417. doi:10.1016/J.Tust.2020.103390
Hou, J. R. (1996). Present Situation of Geostatistical Development and Discussion on Some Problems. Gold Geol. 2 (1), 1–11.
Hou, J. R. (1997). Review and Prospect of Geostatistics(Spatial-Information Statistics) Developmant in China. Geol. Prospect. 33 (01), 53–58.
Hou, W., Yang, L., Deng, D., Ye, J., Clarke, K., Yang, Z., et al. (2016). Assessing Quality of Urban Underground Spaces by Coupling 3D Geological Models: the Case Study of Foshan City, South China. Comput. Geosciences 89, 1–11. doi:10.1016/J.Cageo.2015.07.016
Hu, X. L. (2007). Research and Application of Sequentially Conditional Simulation Methods. [Dissertation]. Chengdu: Chengdu University of Technology.
Li, F., Guo, S., Li, D., Li, X., Li, J., and Xie, S. (2020). A Multi-Criteria Spatial Approach for Mapping Urban Ecosystem Services Demand. Ecol. Indic. 112, 106119–106211. doi:10.1016/J.Ecolind.2020.106119
Li, P. Y., Han, H. D., Wang, D. H., and Wang, C. S. (2021). Current Situation and Development Trends of Suitability Evaluation of Urban Underground Space Resources. Sediment. Geol. Tethyan Geol. 41 (1), 121–128. doi:10.19826/J.Cnki.1009-3850.2020.11004
Liao, J. S., Peng, W. P., and Lin, B. H. (2006). Analysis and Partition Evaluation of Geological Factors Affecting Space Development and Utilization of Shallow Underground in Guangzhou City. Chin. J. Rock Mech. Eng. 25 (S2), 3357–3362. doi:10.3321/j.issn:1000-6915.2006.z2.003
Liu, K., Peng, J., and Peng, F. L. (2011). Evaluation Model for the Suitability of Underground Space Resources Exploitation and Utilization. Chin. J. Undergr. Space Eng. 7 (2), 219–231. doi:10.3969/J.issn.1673-0836.2011.02.003
Liu, Z. N., Song, Y. C., Meng, H. D., and Yu, X. Y. (2018). Application of Sequential Gaussian Simulation in Ore Grade Estimation. Contributions Geol. Mineral Resour. Res. 33 (1), 149–155.
Mao, S. Z., Hua, Q. W., Ying, D., Lin, L., Ping, P. S., and Ge, Z. (2020). Evaluation of Urban Underground Space Resources Using Negative List Method: Taking Xi'an City as an Example in China. China Geol. 3 (1), 124–136. doi:10.31035/cg2020006
Mielby, S., and Sandersen, P. B. E. (2017). Development of a 3D Geological/Hydrogeological Model Targeted at Sustainable Management of the Urban Water Cycle in Odense City, Denmark. Procedia Eng. 209, 75–82. doi:10.1016/J.Proeng.2017.11.132
Peng, J., Liu, K., Zheng, F. T., Li, X. J., and Peng, F. L. (2010). Evalution for the Suitability of Underground Space Exploitaion and Utilization Based on AHP. Chin. J. Undergr. Space Eng. 6 (3), 688–694. doi:10.3969/J.issn.1673-0836.2010.04.006
Peng, J., and Peng, F.-L. (2018). A GIS-Based Evaluation Method of Underground Space Resources for Urban Spatial Planning: Part 2 Application. Tunn. Undergr. Space Technol. 77, 142–165. doi:10.1016/J.Tust.2018.01.00210.1016/j.tust.2018.03.013
Price, S. J., Terrington, R. L., Busby, J., Bricker, S., and Berry, T. (2018). 3D Ground-Use Optimisation for Sustainable Urban Development Planning: A Case-Study from Earls Court, London, UK. Tunn. Undergr. Space Technol. 81, 144–164. doi:10.1016/J.Tust.2018.06.025
Rahimi, H., Asghari, O., and Afshar, A. (2018). A Geostatistical Investigation of 3D Magnetic Inversion Results Using Multi-Gaussian Kriging and Sequential Gaussian Co-Simulation. J. Appl. Geophys. 154, 136–149. doi:10.1016/J.Jappgeo.2018.05.003
Tame, C., Cundy, A. B., Royse, K. R., Smith, M., and Moles, N. R. (2013). Three-Dimensional Geological Modelling of Anthropogenic Deposits at Small Urban Sites: A Case Study from Sheepcote Valley, Brighton, UK. J. Environ. Manag. 129, 628–634. doi:10.1016/J.Jenvman.2013.08.030
Tan, F., Wang, J., Jiao, Y. Y., and Ma, B. C. (2021). Current Situation and Development of Urban Underground Space Suitability Evaluation. Earth Sci. 46 (5), 1896–1908. doi:10.3799/Dqkx.2020.155
Wei, X. J., Fu, B., Deng, X. L., and Wang, Z. L. (2017). The Risk Evalution on Geological Hazards Assessment in Guang’an Urban Overall Plan Areas. J. Chang. Inst.Tech. (Nat. Sci. Edi.) 18 (2), 110–116. doi:10.3969/J.issn.1009-8984.2017.02.026
Wycisk, P., Hubert, T., Gossel, W., and Neumann, C. (2009). High-Resolution 3D Spatial Modelling of Complex Geological Structures for an Environmental Risk Assessment of Abundant Mining and Industrial Megasites. Comput. Geosciences 35 (1), 165–182. doi:10.1016/J.Cageo.2007.09.001
Xin, H. X., Ju, T. Z., and Lin, J. Y. (1997). The Ordinary Krig's Application to Mineral Calculation of Reserves. Geol. Prospect. 33 (4), 46–51.
Xiong, J. X., Ni, S. J., Zhang, C. J., Ding, J., and Wei, L. W. (2006). The Design and Implementation of the GIS Software for Risk Assessment of Urban Geo-Environments. Sediment. Geol. Tethyan Geol. 26 (2), 106–109. doi:10.3969/j.issn.1009-3850.2006.02.021
Yan-lin, S., Ai-ling, Z., You-bin, H., and Ke-yan, X. (2011). 3D Geological Modeling and its Application under Complex Geological Conditions. Procedia Eng. 12, 41–46. doi:10.1016/J.Proeng.2011.05.008
Yu, X. C., Deng, W. K., Xiao, K. Y., and Zou, W. (2013). Visualized Reserves Estimation Based on 3D Kriging Method. Earth Sci. Front. 20 (4), 320–331.
Zhang, M.-s., Wang, H. Q., Wang, H.-q., Dong, Y., Li, L., Sun, P.-p., et al. (2020). Evaluation of Urban Underground Space Resources Using a Negative List Method: Taking Xi'an City as an Example in China. China Geol. 3 (1), 124–136. doi:10.31035/Cg2020006
Zhang, Y., Dai, Y., Wang, Y., Huang, X., Xiao, Y., and Pei, Q. (2021a). Hydrochemistry, Quality and Potential Health Risk Appraisal of Nitrate Enriched Groundwater in the Nanchong Area, Southwestern China. Sci. Total Environ. 784, 147186. doi:10.1016/J.Scitotenv.2021.147186
Zhang, Y., He, Z., Tian, H., Huang, X., Zhang, Z., Liu, Y., et al. (2021b). Hydrochemistry Appraisal, Quality Assessment and Health Risk Evaluation of Shallow Groundwater in the Mianyang Area of Sichuan Basin, Southwestern China. Environ. Earth Sci. 80 (17), 576–592. doi:10.1007/S12665-021-09894-Y
Zhao, Y. F., Sun, Z. Y., and Chen, J. (2010). Analysis and Comparison in Arithmetic for Kriging Interpolation and Sequential Gaussian Conditional Simulation. J. Geo-Information Sci. 12 (6), 767–776. CNKI:SUN:DQXX.0.2010-06-006.
Zhou, D., Li, X., Wang, Q., Wang, R., Wang, T., Gu, Q., et al. (2019). GIS-based Urban Underground Space Resources Evaluation toward Three-Dimensional Land Planning: A Case Study in Nantong, China. Tunn. Undergr. Space Technol. 84, 1–10. doi:10.1016/J.Tust.2018.10.017
Zhou, F., Wang, B. D., He, J., Hao, M., Wang, P., and Dong, Y. X. (2020). Deep Ore Body Targeting Based on 3D Integrated Information. Earth Sci. 45 (08), 3028–3039. doi:10.3799/Dqkx.2020.143
Keywords: urban geological modeling, urban underground space, sequential simulation interpolation, geotechnical attribute model, Guang’an city
Citation: Zhou F, Li M, Huang C, Liang H, Liu Y, Zhang J, Wang B and Hao M (2022) Lithology-Based 3D Modeling of Urban Geological Attributes and Their Engineering Application: A Case Study of Guang’an City, SW China. Front. Earth Sci. 10:918285. doi: 10.3389/feart.2022.918285
Received: 12 April 2022; Accepted: 30 May 2022;
Published: 15 July 2022.
Edited by:
Yunhui Zhang, Southwest Jiaotong University, ChinaReviewed by:
Qiqiang Ren, Chengdu University of Technology, ChinaZhaoliang Li, Natural Resources Aerial Geophysical Exploration and Remote Sensing Center of China Geological Survey, China
Wu Zhichun, East China University of Technology, China
Copyright © 2022 Zhou, Li, Huang, Liang, Liu, Zhang, Wang and Hao. This is an open-access article distributed under the terms of the Creative Commons Attribution License (CC BY). The use, distribution or reproduction in other forums is permitted, provided the original author(s) and the copyright owner(s) are credited and that the original publication in this journal is cited, in accordance with accepted academic practice. No use, distribution or reproduction is permitted which does not comply with these terms.
*Correspondence: Fang Zhou, NzkxNjMwMTYzQHFxLmNvbQ==; Minghui Li, TG1oNjgwNDA4QDE2My5jb20=
 Fang Zhou
 Minghui Li1*