 Liang Jiang
 Jie Chen2
95% of researchers rate our articles as excellent or good
Learn more about the work of our research integrity team to safeguard the quality of each article we publish.
Find out more
ORIGINAL RESEARCH article
Front. Earth Sci. , 04 August 2022
Sec. Environmental Informatics and Remote Sensing
Volume 10 - 2022 | https://doi.org/10.3389/feart.2022.918123
This article is part of the Research Topic Artificial Intelligence-Based Forecasting and Analytic Techniques for Environment and Economics Management View all 21 articles
The spatial distribution pattern of the economic development among counties is an important external representation of a balanced and sustainable regional development in China. With the rapid development of globalization and localization, spatial pattern of economic growth is increasingly obvious. The mechanisms of regional economic growth in China are also gradually gaining attention. However, there is still a lack of research at the province and county levels. As a result, based on the per capita GDP of each county in Hubei province from 2005 to 2020 as the research index, the spatial autocorrelation and the spatial variation function are used to analyze the spatial pattern evolution and the county economy mechanism in Hubei province. The results show that 1) there is a remarkable phenomenon of county-level economic spatial agglomeration in Hubei province. The urban area of Wuhan and its surrounding counties are high–high (HH-type) county agglomeration areas. The low–low (LL-type) counties are mainly distributed in the western parts of Hubei province and scattered in the northeastern and southern parts of Hubei province; 2) the county economy of Hubei province presents a spatial distribution pattern of “high in the east and low in the west.” The hot areas of the county economy are primarily located in the urban area of Wuhan and its surrounding areas. In the process of development, the hot spot areas tend to shift to Yichang, Jingmen, and Xiangyang. The cold spot areas are located on the edges of the western, northeastern, and southeastern areas of Hubei province; 3) the spatial continuity and self-organization of the county economic development are strengthened. The structural differentiation trend caused by spatial autocorrelation is also strengthened. The county economy is relatively balanced from the southeast to the northwest, and the spatial difference in economic development in other directions is increasing; and 4) the spatial evolution of county economic development in Hubei province is the result of the comprehensive effects of historical and cultural background, economic development, traffic location, and policy system, and the A-shaped point-axis structure is a reliable spatial structure for regional development in Hubei province.
The unbalanced distribution of economic activities and economic phenomena is a persistent problem for both developed and developing nations (Candelaria et al., 2009), which exhibits spatial and temporal patterns in geography. The spatial process and pattern make a difference to broad social, economic, and political processes (Massey, 1985). The objective existence of regional economic differences is determined by the local development path, economic structure, spatial linkages, and local resource endowments among different regions. China’s economic prosperity over the past 40 years has made its crowded cities and metropolises rich, but rest of the countries, especially the counties with a predominantly agricultural and rural economy, has remained relatively poor (He et al., 2019), more intensifying inequalities are mainly demonstrated across prefectures and counties. Different regional economic spatial patterns are formed because of this objective existence (Jin et al., 2007; Li and Li, 2018). Hence, a need to focus on “enhancing the county-level economy” was proposed in 2002 and was emphasized in the “National territorial planning framework (2016–2030),” approved by Premier Li, which aims to extend urban development beyond urban areas and promote the development of county economy. As the most basic administrative unit and industrial undertaking carrier of China’s economic development, the county is the basis of the construction of the regional economy, instead of the economic zone, province, city, etc. This specific pattern could be regarded as an important reference factor to promote a balanced and sustainable regional development and formulate the macro-control policy of the government (Ward, 2016). However, the ways in which regional economic differences is spatially formulated and connected at the county scale remains unknown. The research on the county spatial differences and its economic development mechanism is of great significance for understanding the regional economic pattern and its evolution and has become a major strategic problem that China’s economic macro-control is committed to solving (Xu et al., 2005; Jin and Lu, 2009; Zhao and Dong, 2012).
The literature on regional economic differences is popular with terms related to geography, such as region, spatiality, locality, district, and neighborhood effect. Scholars have found that regional economic difference is sensitive to geographical clustering and agglomeration, as corroborated in many empirical analyses at regional, provincial, and city levels (Liao and Wei, 2012; Wei and Kim, 2002), and that changing trajectories and fortunes of leading or lagging regions often have a huge impact on regional inequality (Yu and Wei, 2003; Ye and Wei, 2005). Regional differences have become a burning issue in the development of the social economy and have attracted tremendous concern and scholarly attention (Li and Qiao, 2001; Xu et al., 2005). From the perspective of space, regional economic differences are spatially represented by the economic spatial structure of the region in a certain period of time. Most of the studies conducted internationally have focused on the theoretical level and have provided the basis for a classical theoretical system (Czako et al., 2014). Perroux (1950)proposed the theory of the regional growth pole in 1955, which is regarded as a great theoretical contribution to the study of regional development from the perspective of economics, and Friedman (1966) proposed the “core-periphery” structure based on the simulation of urban system formation and development to explain the evolution of regional economic spatial structure. New economic geography places increasing return to scale and agglomeration at the center of regional development (Fujita et al., 1999). Initial studies by foreign scholars have suggested that the regional differences in economic development were ultimately reflected in the problem of social polarization between rich and poor populations, so early scholars used the Gini coefficient to measure polarization (Atkinson, 1970). Esteban et al. (2007) measured the average annual Esteban–Ray polarization index of five OECD countries (Canada, Germany, Sweden, the United Kingdom, and the United States) from 1970 to 2000. Fedorov (2002) calculated and decomposed Russia’s Esteban–Ray’s and Kanbur–Zhang’s polarization indexes of income inequality and consumption expenditure differences from 1990 to 1999. Ezcurra et al. (2006) used the Gini coefficient, Theil index, coefficient of variation, and Esteban–Ray polarization index to quantitatively analyze the overall differences and polarization level of the per capita income distribution dynamics in Europe from 1977 to 1999. Gasparini et al. (2006) found that the economic development of Latin American countries showed a highly polarized trend, while that of Caribbean countries was relatively flat (except Mexico, Nicaragua, and Peru). Zhang and Kanbur carried out a series of studies on regional economic differences and polarization, respectively, in China (Zhang and Kanbur, 2001, 2005; Kanbur and Zhang, 2005). Wan and Zhou. (2005) showed that since the 1980s, the differences in per capita net income among farmers in different regions, within regions, within provinces and cities, and even among farmers in the same township have been increasing.
At present, the research on regional economy in China mainly embodies the following aspects. ① The research object has changed from the differences between the east and the west (Lu et al., 1999; Wu D. Y., 2001; Lu and Xu, 2005), between the north and the south (Wu D. T., 2001), between urban and rural areas (Xu and Liu, 2012) to the differences between provinces (Zhang et al., 2010; Xiong et al., 2011; Fang et al., 2013a; Tian and Zhao, 2013), and between economic zones and urban agglomerations (Ma et al., 2007; Sun et al., 2009; Hu and Zhang, 2010; Sun et al., 2013). ② The research scale has changed from the macro-level province (city, autonomous region) (Chen and Zhu, 2012) to the micro prefecture-level city and county and has begun to focus on mechanism analysis (Ke and Lu, 2011; Ke et al., 2013a; Wang and Gao, 2014). ③ Research methods have been integrated, including the traditional standard deviation (Wu and Ding, 2011), coefficient of variation (Xu et al., 2015), Gini coefficient (Cai et al., 2011), Theil coefficient (Zhong and Lu, 2010; Zhou and Zhang, 2011), and other introduced mathematical analysis methods such as GIS (Feng et al., 2015), ESDA (Fang et al., 2013b), wavelet analysis (Xu et al., 2005), and other methods to explore the spatial dependence and heterogeneity of the county economy. ④ There has been a shift from an emphasis on quantity to a focus on quality, and the factors and structure of the county have also become an important issue. Rozelle et al. (2002) have examined how rural China is successful in participating in the sequence of economic activities that will lead to modernization and emphasize the significance of the state of China’s county economy. This issue has also been favored by some scholars (Ke et al., 2013b; Zhu and Wu, 2015), mainly focusing on research on land (Li and Fang, 2014), industry (Chen et al., 2016), urbanization (Liu and Yang, 2012), transportation (Liu and Zeng, 2011), ecology (Li et al., 2014), etc.
Regional economic difference is multi-scale in nature, and spatial agglomeration is an essential feature of geographical space. The significance of the spatial perspective has motivated a new round of methodological advances. With increasing amount of data and fast developing analytical methodologies, our understanding of regional economic differences (inequality) and spatial pattern is increasing drastically. This is particularly true when scholars started to apply spatial analytical approaches to understand the issue since the spatial distribution of economy is essentially a geographical problem (Dou et al., 2016; Ortega et al., 2018). World Development Report 2009 highlights the importance of economic geography in regional economic development (World Bank, 2009). Affected by various socioeconomic contexts, regional economic differences demonstrate many spatial features such as spatial heterogeneity (S. He, Fang, et al., 2017), spatial dependence (Anselin, 2013), spatial agglomeration (F. H. Liao and Wei, 2015), spatial mobility (Rey, 2016), spatial hierarchy, and spatial causation (Wei, 2015). Therein, spatial heterogeneity and spatial dependence are the two fundamental issues in social sciences (Goodchild, 2009). Regional economic differences are heterogeneous in both space and time. The effect of spatial dependence is also significant to understand structural instability in regional sciences. Geographical space or regions are heterogenous in nature, while a traditional inequality index measures the spread of the income distribution and fails to distinguish between convergence to the global mean and clustering around local means (Esteban and Ray, 1994). Declining overall inequality can mask rising polarization, with related concepts of geographical concentration, club convergence, and poverty trap. The development of GIS and spatial analysis has provided powerful tools to uncover the significant impact of spatial association and spatial heterogeneity on regional economic differences. Moreover, geographers also tend to pay less attention on rural economic differences, including inequality across counties and villages. Analyzing spatial association/heterogeneity and mechanisms of county-level can better explain the evolution trend of regional economy and deepen the understanding of regional inequality.
A spatial view is crucial for regional economic differences analysis, particularly in the case of the county-level China (Zhang and Dang, 2016). The relationships between regional inequality and its geospatial dimensions have been examined by a number of studies (Rey and Le Gallo, 2009; Liao and Wei, 2015). These studies investigate spatial distributional dynamics of regional economic differences, which conclude that space does matter in shaping uneven regional development. Spatial dependence, scale, and hierarchy are all significant for better understanding the complexity of China’s regional economic differences. For example, Rey (2015) suggests that the role of spatial context does influence the distributional dynamics of regional inequality by comparing the case of Mexico and the United States. Wei (2015) found that mechanism of regional economic differences in China is mainly demonstrated in terms of first nature (physical geography) and second nature (agglomeration). Although these studies have investigated the county-level inequality, most of them mainly focus on an individual coastal province in China, and no formal consensus has been reached to date and a geospatial analysis on the county-level economic differences in central China is lacking. Meanwhile, the new-type urbanization is required to realize regionalization and optimize spatial patterns of regional development in China. Hence, a spatially explicit view of development dynamics in the county-level central China requires further research, how the intra-county spatial inequality has evolved over time and whether these development strategies of regions became effective remains unknown.
In the new era, the implementation of rural revitalization and the development and study of the county economy play an important role in promoting the overall planning of urban and rural areas, coordinating regions, and accelerating the development of the national economy. Hubei is one of the most developed areas in China, making it an important component of development strategies of the “Yangtze River economic zone” and “Triangle of central China.” In 2020, the county population and total economic volume were 36.7536 million and 2,554.772 billion yuan, accounting for 59 and 60% of the province, respectively. With the rapid development of economy, the level of urbanization in Hubei has been continuously improved. Meanwhile, the spatial difference of county economic development in Hubei province is apparent. In the plain area along the Yangtze River in eastern Hubei with Wuhan as the core, large amounts of land resources are developed for industrial, commercial, residential, and infrastructure purposes. Conversely, the land development is restricted or forbidden in most counties of the middle and western Hubei. So there is an obvious regional gradient of economic growth from the eastern to the central and to the western Hubei, which is extremely similar to that of China. As such, Hubei province can be considered a miniature of economic development in China. In addition, Hubei province is one of the first regions to implement the reform of the financial system of the province directly governing county. This region could be regarded as a typical case for research. Moreover, the previous research works on the county economic differences in Hubei province only focused on the absolute spatial differences of the regional economy in different time sections, and there were few quantitative studies on the randomness, correlation, and structural factors affecting the spatial differences within the region, which failed to better reveal the spatial evolution process and mechanism of economic growth differences in Hubei province. Therefore, this study attempts to make contributions in the following aspects. First of all, a spatiotemporal analysis of county economy in Hubei province is conducted to examine their dynamic changes. Second, this study combines spatial heterogeneity and spatial dependence with spatial variability functions to analyze the formation mechanisms causing county-level economic differences. Finally, the results can offer novel thoughts for drafting future political strategies for regional development and rural revitalization.
Hubei province is located in the middle reaches of the Yangtze River, covering an area of 185,900 km2, with a high terrain in the west and low terrain in the east (Figure 1). At the end of 2020, the total population was 57.75 million, with a GDP of 4,344.34 billion yuan, ranking eighth in China. The highest per capita GDP was that of Huangpi District (87,988 yuan), and the lowest was that of Hefeng County (14,583 yuan), with a difference of six times. This indicates that there is a large imbalance between county economies in Hubei province.
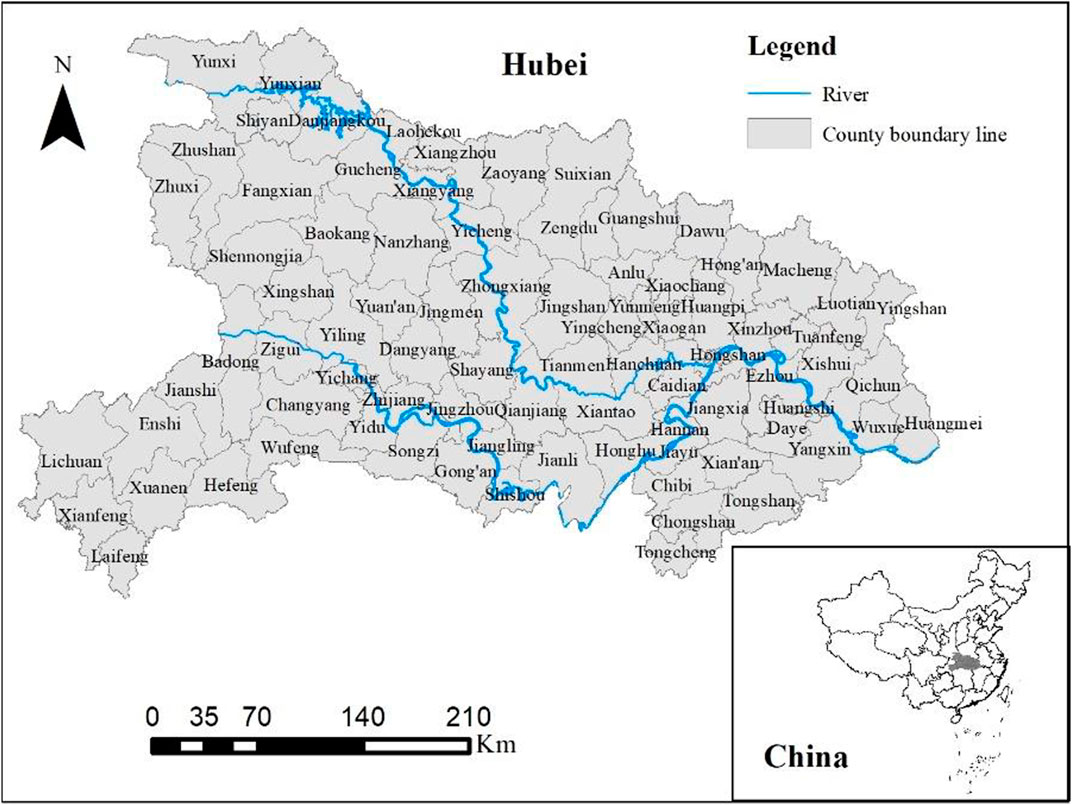
FIGURE 1. Location of the study area.
In this article, we chose the years 2005–2020 as the study period. During 2005 to 2020, the urbanization of Hubei province was developing rapidly, and the gap between urban and rural areas was more remarkable. For better revealing the change characteristics of county-level economy, we selected the year of 2005, 2010, 2015, and 2020 as the study time point to present their spatial–temporal changes. Then a county of Hubei province is taken as the research unit, and the per capita GDP of the county is used as the research indicator to reflect the level of economic development of the county; based on the integrity, scientificity, and availability of the data, some municipal jurisdictions are subjected to the merge application, and a total of 91 county units are obtained from 10 prefecture-level urban areas, 17 municipal districts, 24 county-level cities, and 40 counties. For the changed administrative division unit (such as the establishment of Suixian county in Zengdu District in 2009, and the transformation of Yunxian County to Yunyang District in 2014), the corresponding processing is performed in ArcGIS. The data used in this article were obtained from the China Statistical Year Book for Regional Economy, Hubei Statistical Year Book, and the China County Statistical Yearbook from 2006 to 2021.
1) Standard deviation and coefficient of variation: the absolute difference in per capita GDP of counties in Hubei province is calculated with the standard deviation, and the formula is
2) Gini coefficient and skewness coefficient: the Gini coefficient is the most commonly used index to measure the degree of regional imbalance. The geographical concentration of economic development is actually a kind of regional imbalance. The formula is as follows:
The value range of the Gini coefficient is [0, 1]. The more uniform the geographical distribution of county economic development is, the smaller the Gini coefficient of location is; the higher the concentration of county economic development is, the greater the Gini coefficient of location is.
The skewness coefficient measures the asymmetric distribution of geographic data distribution and describes the skewness centered on the average value. The formula is
In the aforementioned measurement methods,
The exploratory spatial data analysis is a combination of statistical principles and graphical charts to study the non-randomness or spatial autocorrelation of spatial information and reveal the spatial pattern of regional economic development, including global autocorrelation and local autocorrelation.
1) Global autocorrelation: global autocorrelation is used to describe the spatial distribution characteristics of object attributes in the whole region. It is measured by the global index
where
2) Local autocorrelation: local autocorrelation is used to analyze the degree of association among each spatial element attribute and its adjacent spatial element attribute, which is measured by the index
When
The Local
Standardized
A spatial variogram is a basic means to describe the randomness and structure of regionalized variables (Liu et al., 2009). Let
where
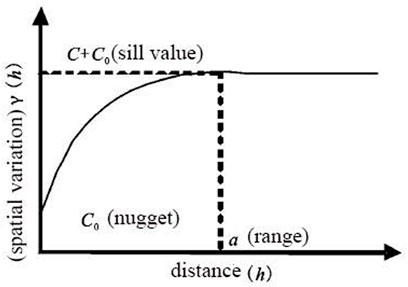
FIGURE 2. Model variogram.
With the increase in
The fractal dimension
The change trend of county economic differences in Hubei province from 2005 to 2020 is shown in Figure 3. Among them, the standard deviation continued to expand from 0.420 in 2005 to 3.075 in 2020, which reflected the absolute difference in county economic development in Hubei province have been on the rise trend. Based on the change trend of the coefficient of variation and the Gini coefficient, the relative difference in county economic development in Hubei province have been decreased generally during the study period. Meanwhile, 2010 was an important node of relative difference change. From 2005 to 2010, the Gini coefficient and coefficient of variation increased from 0.323 to 0.627 and from 0.365 to 0.793, respectively, and the relative difference in economic development among counties in Hubei province has expanded. After 2010, the relative difference in the county economy shrank steadily, and the Gini coefficient and coefficient of variation shrank to 0.329 and 0.615 in 2020. The main reason is that after 2010, with the implementation of the rise of central China, the Belt and Two Circles (the Yangtze River Economic Belt, Wuhan Metropolitan Area, and Western Hubei Eco-cultural Tourism Circle) and the construction of provincial sub-central cities, these development strategies and policies have effectively promoted the coordination of regional development in the province and continuously reduced the relative difference of county economy. Regarding the skewness coefficient, its value is greater than zero and declines in fluctuations, indicating that the economic differences among the counties in Hubei province present a right-skewed distribution, and the number of counties greater than the average GDP per capita of the province gradually increased, further indicating that the relative difference in economic development between the two countries has been shrinking.
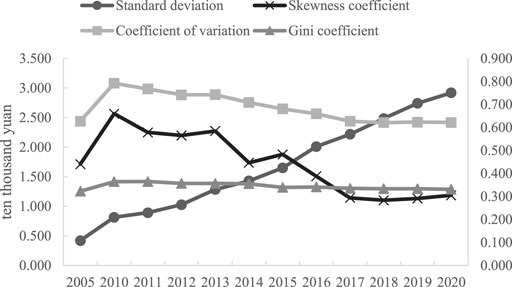
FIGURE 3. Changes of county economic differences in Hubei province from 2005 to 2020.
Figure 4 depicts the spatiotemporal patterns of county economy in Hubei province from 2005 to 2020. Although county economy has gained significant increase since 2000s, the spatial pattern was imbalanced and spatial agglomeration of county economy could be observed during this time period. Overall, the group of rich counties in red tended to cluster in Wuhan, Yichang, and Xiangyang, which explained the strong positive association between geographic agglomeration and economic growth documented by some scholars (Van Oort, et al., 2012). As the economic core area and growth pole of Hubei province, Wuhan was very stable; Yichang and Xiangyang were gradually taking shape as the growth poles of southwest and northwest Hubei. These three regions attracted the agglomeration of economic activities in metropolitan regions. Indicated by endogenous growth theory, the localized spillover effect would bring economic activities concentrating in neighboring rural counties because of low transport cost and easy access to innovation technologies. The group of poor counties in blue tended to cluster in mountainous areas of northwest, southwest, and northeast Hubei. Spatial agglomeration of these poor counties largely increases regional poverty because of their lack of growth poles and little mobility of capital and labor. These spatially clustered poor areas were mainly located in ecology fragile regions, such as mountainous areas, hilly areas, and restrictive/prohibited development areas.
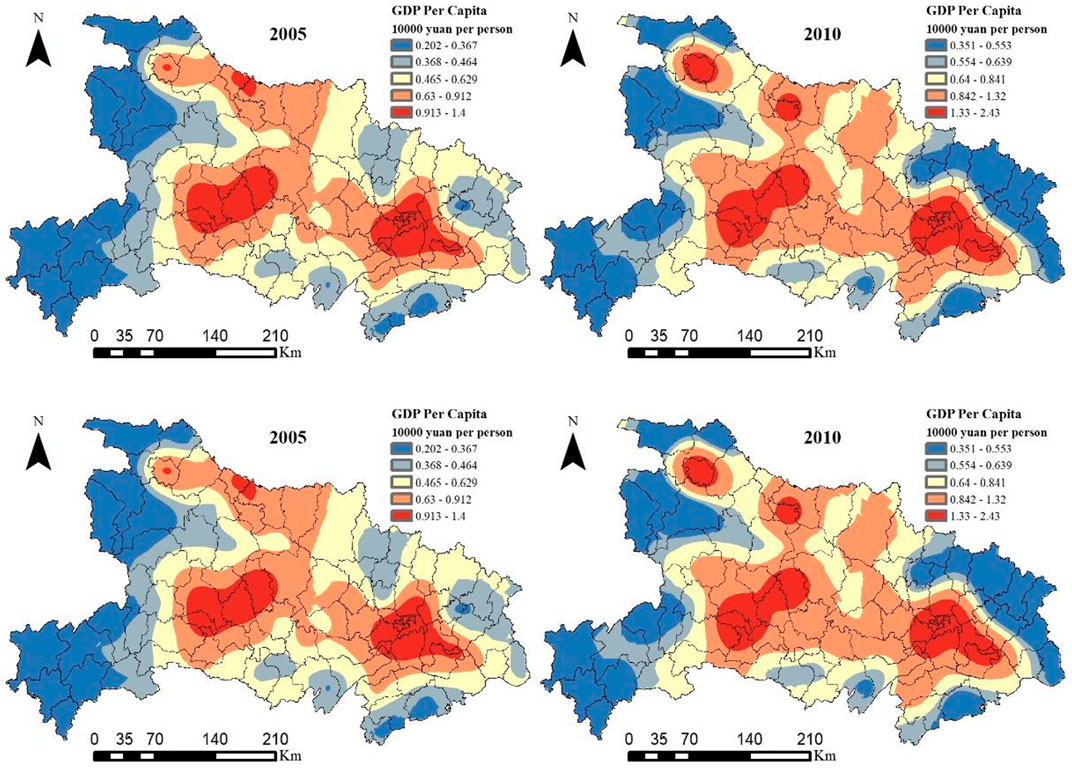
FIGURE 4. Spatial patterns of county economy in Hubei province from 2005 to 2020. (blue denotes the poor counties; gray denotes the less-developed counties; yellow denotes the well-developed counties; orange denotes the more-developed counties; and red denotes the rich counties).
In addition, the urban constellation theory indicates that the strategic design of sustainable regional development cannot ignore the differences between urban and rural areas, but should take the city (county) as the “star” of regional development, and connect many urban stars by the transportation axis to form a ring-shaped belt called the “City Constellation System” (Lewis, 1996). Figure 5A shows a night light map of cities (counties) in Hubei province in 2020 (http://59.175.109.173:8888/app/login.html, accessed on 21 December 2020), where the brightness of night lights can reflect the level of regional economic development and the scale of city stars. It can be seen that the brightest “first-class star” is Wuhan, and the second-brightest “second-class stars” include cities such as Xiangyang, Yichang, Ezhou, Shiyan, and Jingzhou. Among these bright cities, there were also bright lines along highways and railways. Connecting these bright cities along the bright lines constituted the “urban constellation system” of Hubei province: the ring-shaped belt connects almost all cities in Hubei, with dense cities and towns and intensive economic activities, and the central area surrounded by the ring-shaped belt is the Jianghan Plain. Therefore, with Wuhan as the vertex, an axis connects Yichang and Enshi to the southwest hinterland of Hubei, and an axis connects Xiangyang and Shiyan to the northwest hinterland of Hubei, forming an “A-shaped point-axis” spatial structure (Figure 5B). “A-shaped point-axis” covers 65 counties in Hubei province, not only connecting the three gradient regions of east, middle, and west of Hubei province but also taking into account the synchronous advancement of southwest and northwest Hubei, which is conducive to the coordinated development of Hubei province.
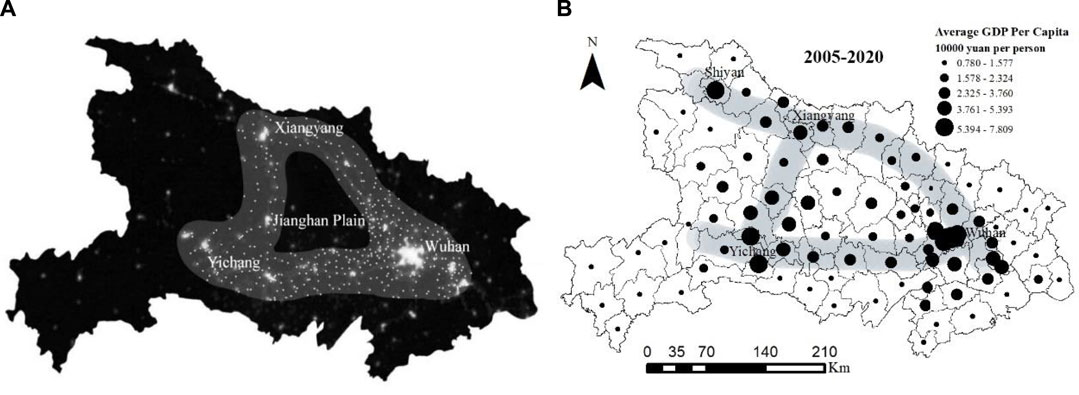
FIGURE 5. Fitting figure of city lights map and A-shaped point-axis structure in Hubei. (A) City Lights Map, (B) A-shaped Point-axis Structure.
The global Moran’s I was computed to capture the overall tendency of geographical concentration of county economic development in Hubei (Figure 6). We can see that the global Moran’s I fluctuated slightly but maintained a gradual rising trend, increased from 0.318 in 2005 to 0.444 in 2020 and all are significant at the 0.05 level. On the one hand, this result implied that the spatial distribution of county economy in Hubei is not random but showed a significant spatial agglomeration, that is, counties with high (or low) level tend to be adjacent to each other, and this agglomeration trend continues to strengthen over time. On the other hand, the increasing clustering of county economy possibly implied that the localized regional inequality across counties was decreasing. The reason is that the spatial pattern of county economic development in Hubei province is that developed areas are concentrated in eastern Hubei and relatively underdeveloped areas are concentrated in western Hubei. The reduction of the internal spatial difference between eastern and western Hubei makes the overall spatial difference of the county continuously narrow. This conclusion is that for the county-level spatial scale, it is the reduction of the spatial difference between counties (cities and districts) in the average sense, which is not contradictory to the expansion of the spatial difference on other scales. The localized spatial spillovers through rich counties pulling neighboring poor counties do make effective, resulting in the agglomeration extent of rich or well-developed counties being increased. Meanwhile, the localized clustering of poor counties tends to decrease by some poor counties getting rid of poverty. Combining coefficient of variation and Gini coefficient, they have been decreased from 2005 to 2020 despite one slight increase from 2005 to 2010. It indicated that the regional economic difference in Hubei province showed a decreasing trend at the county-level. With the economic transformation and development of Hubei and the implementation of the national targeted poverty alleviation strategy and eco-compensation mechanism, in the long run, the localized regional inequality across counties tends to be narrowing.
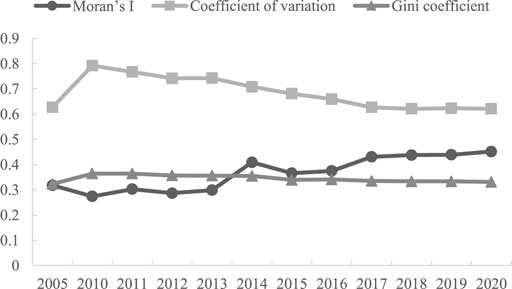
FIGURE 6. Global Moran’s I of county level GDP per capita in Hubei, 2005–2020.
To further analyze the spatial agglomeration characteristic of economic development across counties, we draw their distribution maps with 2005, 2010, 2015, and 2020 as time nodes. Specifically, high–high (HH) means the counties with high per capita GDP are surrounded by other counties with high value, low–low (LL) means the counties with low per capita GDP are surrounded by other counties with low value; low–high (LH) indicates that the counties with low per capita GDP are surrounded by other counties with high value. High–low (HL) shows that the counties with high per capita GDP are surrounded by other counties with a low value.
Results in Figure 7 showed that most counties were distributed in HH and LL. This implied that county economy had a positive spatial correlation. 1) Spatial clustering patterns observed in Wuhan were dominated by HH; HH is continuously strengthened in this region and it did not undergo any apparent changes from 2005 to 2020. Wuhan, as a primary and provincial capital city, is better able to access various forms than ordinary counties in Hubei; its economic development has been more rapid, and industrial development has more diversification than those observed in the other areas. To support socioeconomic development, such cities must exert their influence to agglomerate various production factors and direct policy-making. HH in Yichang city and its surrounding counties was also strengthened except the year of 2010. Yichang showed inherent advantages based on a collection of production factors due to their status, the “Bottom-up” urbanization has strengthened linkages between local counties. In addition, infrastructure is developing rapidly to form a complete and competitive transportation network, which has benefitted regional spatial integration and coordinated development. 2) LL patterns were observed in southwest, northwest, and northeast Hubei, this is likely related to natural features in the west and east Hubei, which is characterized by mountainous terrain and large spatial distances between counties. 3) The LH pattern only fall in Yuan’n County in 2005, whereas the regions transform into Nanzhang County and Caidian District; the HL pattern was distributed in Shishou City in 2005 and Shiyan City in 2010, but not in other years. Shiyan City is the central city in the hinterland of northwest Hubei, with automobile and tourism as the leading industries. It has the geographical advantage of connecting Hubei, Shaanxi, and Henan provinces and the policy advantage of the water source of the mid-route south-to-north water diversion project, which exhibited HL.
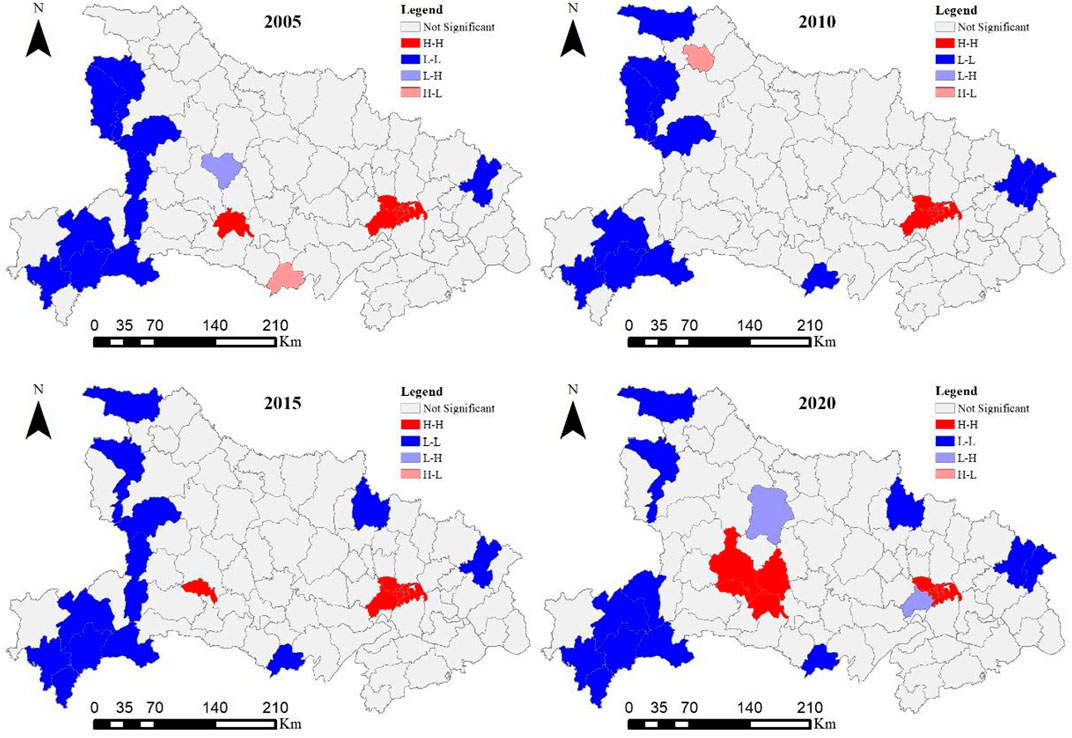
FIGURE 7. Local indicators of spatial association (LISA) of county economy in Hubei province.
This article used Getis-ord GI* in ArcGIS to identify the location of the high-value (hot spots) and low-value (cold spots) spatial clustering of counties in Hubei province. We divided the spatial agglomeration of economic development in 2005–2020 into four categories by the natural breakpoint method: hot spot area, sub-hot spot area, sub-cold spot area, and cold spot area. As illustrated in Figure 8, the spatial pattern of county economy in Hubei province is relatively stable, showing an obvious circle structure: Wuhan and its neighboring counties were hot spots, which form “hot spots, sub-hot spots, sub-cold spots, and cold spots” from outward to the edge of the province. Specifically, Wuhan and its neighboring such as Huanggang, Xiaogan, and Ezhou were always hot spots of the county economy from 2005 to 2020, and the economic development level of these counties was similar and higher than that of surrounding counties. By 2020, the number of the hot spots increased to 14. In the meantime, the hot spots moved to the southwest, adding Yichang, Zhijiang, Yuan’an, and Dangyang, which became a new core area of county economic development. The cold spots were mainly distributed in the western, northeastern, and southeastern of Hubei. From 2005 to 2020, the edge of western Hubei extended from Yunxi, Zhushan, and Zhuxi in the north to Xianfeng and Laifeng, forming a stable continuous strip covering 13 counties. In 2005, Guangshui, Anlu, Dawu, Xiaochang, Macheng, Luotian, and Yingshan in the northeastern of Hubei were cold spots. After 2005, the area presented strip-like distribution, increasing Hongan, Qichun, Wuxue, and Huangmei. In the southeastern of Hubei, Gongan, Jiangling, Shishou, Jianli, Chongyang, and Tongshan have been cold spots.
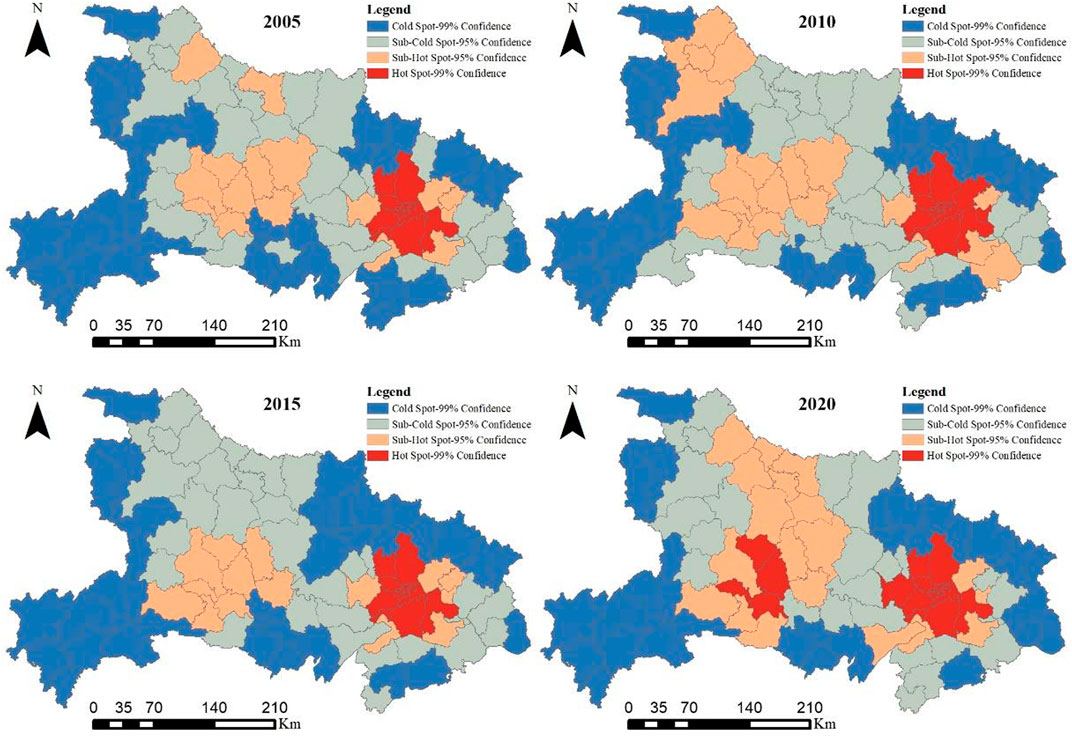
FIGURE 8. Distribution of county economy hot spots with different confidence levels from 2000 to 2016.
The sub-hot spots and sub-cold spots changed significantly, showing the characteristics of mutual transformation among counties. In 2005, there were three sub-hot spots: one was the surrounding areas of Wuhan in eastern of Hubei, which was composed of six counties; the next was the central areas, which was composed of eight counties, including Yichang and Zhongxiang, to the west of the hot spots; and the third was Danjiangkou and Xiangyang in northwestern of Hubei. In 2010, Xinzhou withdrew from the sub-hot spots, adding Yangxin, and the number of central sub-hot spots increased to 10. However, the sub-hot spots in the northwest moved northward, increasing to five counties. In 2015, the sub-hot spots in the northwest disappeared, leaving only two regions in eastern and central of Hubei. In 2020, the sub-hot spots expanded again, from Danjiangkou and Laohekou to Yichu and Songzi and other 14 counties southward, covering most of the central counties. The sub-hot spots in eastern of Hubei were basically stable.
Based on the aforementioned analysis, the hot spots analysis demonstrated that the county economic development in Hubei is becoming more closely related in space, and the relationship between county economic development in neighboring areas has mutual influence and infiltration. Overall, the county economy of Hubei presents a spatial distribution pattern of “low in the west, high in the east” and “dual core structure.” In terms of the change of years, the hot spots tend to move to Jingzhou–Xiangyang–Yichang urban agglomeration, demonstrating that the central and western Hubei economic circle will gradually become the growth pole of county economy, reflecting the trend of the gradual narrowing of county economic differences in Hubei province.
“Pattern–process–mechanism” is the basic paradigm of geographical research on geographical phenomena and laws (Fu, 2014). The spatial variation function is used to investigate the internal mechanism of the spatial pattern evolution of the county economy in Hubei province. In 2005, 2010, 2015, and 2020, with the GDP per capita as the research data, the sampling step is set as 40 km (the size of the step multiplied by the number of steps is approximately 0.5 times the maximum distance between sample points), and the experimental variogram is calculated (that is, the experimental variogram is fitted from the effective spatial samples). For the sample data, the sphere model, Gaussian model, exponential model, linear model, and other models are used for fitting. Finally, the model with the highest fitting degree is selected, and the fractal dimension on different sides of each year is calculated, and then Kriging interpolation is carried out. The results are as follows:
1) It can be seen from the changes in the sill value, nugget value, and nugget coefficient that the spatial differences in county economic development in Hubei increased, the sill value increased from 0.242 in 2005 to 0.428 in 2020, and the nugget value increased from 0.058 in 2005 to 0.082 in 2020. However, the nugget coefficient showed a declining trend, from 0.239 in 2005 to 0.191 in 2020, which showed that in the spatial pattern evolution of the county economy in Hubei, the spatial differentiation of the economy caused by random factors such as data variation was decreasing, while the structural differentiation of the economic spatial pattern caused by spatial autocorrelation was increasing, and the significant spatial agglomeration exists in county economy (Table 1). Meanwhile, the parameters of the range were increasing, indicating that the scope of the spatial effect of the county economy in Hubei province was gradually expanding.
2) From the variance fitting chart, we can see that the per capita GDP of 4 years decreased first and then increased under the given step length, showing that the scope of the spatial correlation effect caused by the structural spatial gradient of county economic development in Hubei province is expanding, and the economic development tends to spread to the hot spots. According to the fitting equation of the spatial variation function selected by the least square method, the fitting effect of the spherical model and the Gauss model was better. The development of the county economy in Hubei province had different structural characteristics in different periods. The decision coefficient of model fit first decreased and then increased, indicating that the randomness of county economic development is obvious, but with the passage of time, the spatial self-organization of county economic development is strengthened, and the spatial differentiation of the economy is obvious.
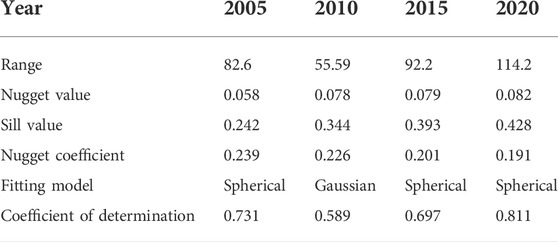
TABLE 1. Parameters of the variogram model on the spatial pattern of county economy in Hubei province.
The spatial differentiation of regional economy originates from the spatial heterogeneity or heterogeneity of factors affecting economic activities. Krugman. (1991) pointed out that an accidental event in history may lead to spatial self-organization behavior because this accidental event will inevitably bring about changes in certain factor endowments, and the heterogeneous space generated by such changes in factor endowments is suitable for the development of certain industries. This spatial self-organization promotes the economic growth and development of the region and become hot spots. There are structural characteristics in the development of county economy in Hubei province. Economic elements are linked together in a certain form of organization or combination and interact with each other to produce spatial correlation. This spatial correlation and self-organization structure dynamic system act on the regional economic system and promote the evolution and development of the regional economic system. With the continuous improvement of the level of social and economic development, the form of regional economic spatial organization has gradually evolved from low-level to high-level, and the pattern of regional economic spatial differentiation has shown the law of evolution and replacement from low-level equilibrium to high-level equilibrium or network. In addition, the institutional change within the country or region is an important mechanism that affects the spatial differentiation of regional economy. The marketization process in various regions of Hubei province has an asymmetric impact on the regional spatial pattern, forming a differentiated economic spatial gradient.
3) According to the fractal dimension of the spatial variation function (Table 2), the fractal dimension of all directions first increased and then decreased and increasingly deviated from the ideal value 2, and the determination coefficient first decreased and then increased, indicating that the difference in county economic development in Hubei province decreased before 2010 and gradually increased after 2010, and the spatial differentiation scale is also rising. In addition, the decrease in the degree of homogeneity in all directions showed more of the spatial difference at the macro and meso scale in Hubei province, and the spatial difference at the micro scale became less obvious. Observing the fractal dimension of each direction, aside from the fractal dimension of the southeast to northwest direction increased the fractal dimension of other directions decreased, which showed that the county economic development of Hubei province was relatively balanced in the southeast to northwest direction, and the spatial difference in economic development in other directions is increasing. The main reason is that after 2010, with the rapid social and economic development of Hubei province, the construction of Wuhan metropolitan area, Western Hubei eco-cultural tourism circle, and Hanjiang ecological economic belt has been proposed successively. The absolute difference in the total amount of county economy is expanding, which shows that the fractal dimensions in all directions are decreasing. With the opening of Wuhan–Xiangyang–Shiyan high-speed railway and the development of economy around the axis, the economic spatial difference from southeast to northwest is relatively balanced, and the economic development is of good homogeneity.
4) The kriging interpolation 3D fitting chart was depicted based on per capita GDP of each county in Hubei province. By observing the graph (Figure 9), we can see that there is a certain regularity in the development pattern of the county economy in Hubei province, and the distribution pattern has structural characteristics. The 4 years showed obvious correlation in all directions. There were obvious multi peak slope structures in the 4 years, among which the slope in 2010 was relatively steep, and the slope in the other 3 years was relatively gentle. Over time, the number of peaks tends to be stable, and the height gradually increased. The spatial structure of slope was consistent with the spatial structure of urban and economic development of “One Main and Two Deputy (One is Wuhan, the provincial central city; two are Yichang and Xiangyang, the provincial sub-central cities)” in Hubei Province, and the vast county periphery presents a plain structure. The results showed that the county economic pattern of Hubei province was relatively stable, and the peak value was mainly concentrated in three regions: the east, including Wuhan City and its surrounding counties; the northwest, including Xiangyang, Jingmen, and Shiyan; and the southwest, including Yichang city and its surrounding counties. The peak growth rate of Yichang city and its surrounding counties in the southwest was relatively high. In general, the spatial structural difference in county economic development in Hubei province is very significant.
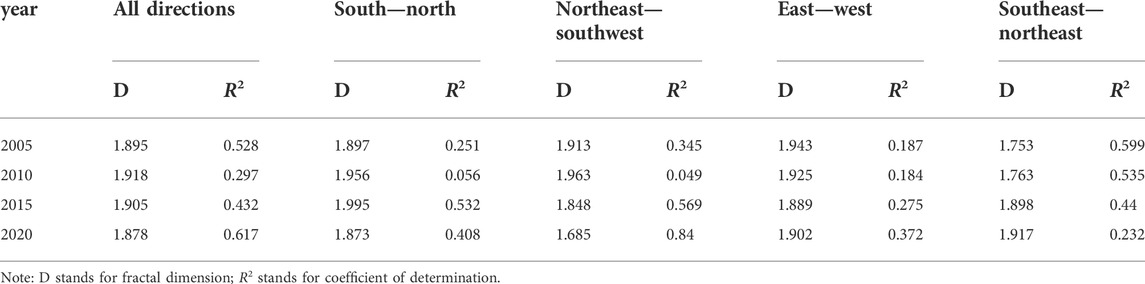
TABLE 2. Fractal of variogram on spatial pattern of county economy in Hubei province.
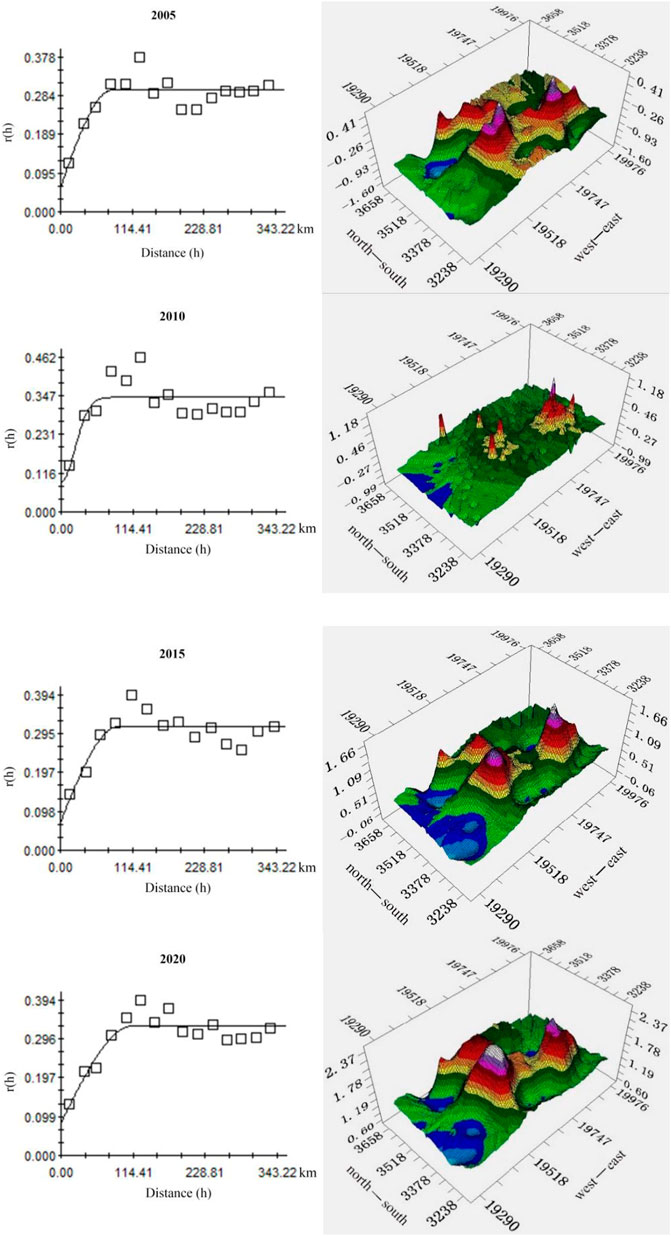
FIGURE 9. Evolvement of variogram on spatial pattern of county economy in Hubei province (left: covariance fitting chart and right: kriging interpolation 3D fitting chart).
The driving factors of county economy development refer to the internal and external factors and their mutual relations that promote the occurrence and development of county economy. The county economic system is a complex and open regional system. Its formation, development, and evolution involve a variety of influencing factors, and different influencing factors have different modes of action. This article uses statistical analysis methods to analyze the spatial pattern and mechanism of county economy in Hubei province. In terms of driving factors, this article mainly starts from systematic theory, combined with the aforementioned empirical research, and finds that the driving forces of county economy evolution is mainly the result of four important factors: historical and cultural background, economic development, traffic location, and policy system, which together form a relatively complete driving system (Figure 10).

FIGURE 10. Driving forces of the spatial evolution of the county economy in Hubei province.
Historical and cultural background is a basic driving force. The evolution of spatial pattern of economic development has its inherent historical basis. Since the economic reform starting in 1978, the regional economic pattern of Hubei is centered on Wuhan, the hot spots are mainly distributed stably in Wuhan and its neighboring counties. With the approval of the State Council, Wuhan also implements separate plans and is endowed with provincial economic management authority. The starting point of development of eastern Hubei represented by Wuhan is obviously higher than that of central and western Hubei, which makes eastern Hubei rely on good material foundation and achieve rapid economic development, while central and western Hubei develop relatively slow due to their own basic problems. A cold spot for economic development has been formed for a long time.
Economic development is a core driving force. Economic development is the most important factor affecting the evolution of economic pattern in Hubei. The advantages and disadvantages of the economic level will lead to the difference of development order and degree, as well as the difference of other economic growth factors. The higher the level of regional economic development is, the more employment opportunities can be provided and the more population can be accommodated, thus promoting the expansion of production space and living space and the continuous evolution of the urban and rural settlement system. Selecting urbanization level indicators to represent economic development and by analyzing the correlation between per capita GDP and urbanization level in each county, it is found that there is a significant correlation between the two at the level of 5%, and the overall trend is increasing year by year (Figure 11). The changes of population scale and structure directly promote the transformation of county economy and the reconstruction of settlement space and directly affect the different spatial changes of county (district) area, town area, and village land, thus promoting the continuous evolution of the county economic spatial pattern. In addition, under market economy conditions, the industries in the southeast coastal areas are transferred to the central and western regions, and Hubei is at the node of transfer. Guided by the concept of unbalanced development, in accordance with the principle of combining the regional tilt with industrial tilt, regional production specialization with comprehensive development, together with “opening up and developing the Hubei Yangtze River Economic Belt.” The economic pattern extends to northwest and southwest Hubei, forming the “big triangle” regional economic layout of Wuhan–Huangshi, Yichang–Jingzhou, and Xiangyang–Shiyan.
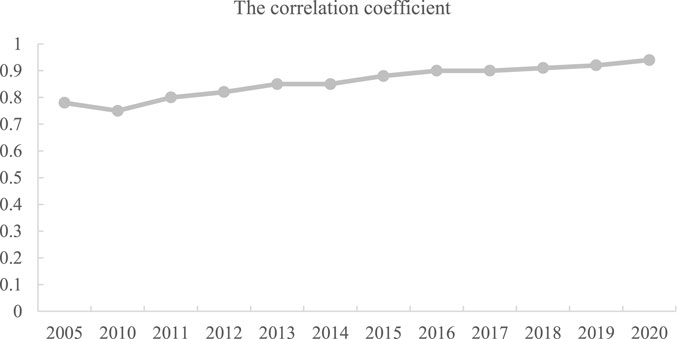
FIGURE 11. Correlation coefficient between per capita GDP and the urbanization level in Hubei province, 2005–2020.
Traffic location is a catalytic force. The transportation network constitutes an important channel for the flow of elements and resource exchange between counties, and it is also an important guarantee for the external connection of urban–rural integration. A developed transportation network means more convenient logistics, flow of people, and more development opportunities. The land rent difference in the county area is gradually changed to be determined by the transportation location. As a result, the county area usually expands along the two sides of the transportation line or around the transportation hub. The transportation network and its convenience have an important catalytic effect on the county settlement system and spatial evolution. The eastern Hubei represented by Wuhan is located in the Jianghan Plain, with a dense transportation network and frequent flow of various elements, making it always the core driving area of economic development. Except for Xiangyang and Yichang in central and western Hubei, the traffic conditions are relatively backward, the location is not good, and the economic development is in the cold spot.
Policy system is an external control force. Regional development positively relates to effective local state initiatives and favorable local conditions. The macro policy of the national and provincial governments is a special instrumental “resource,” which itself contains a specific right of preemption, especially the direct input of the government shows the orientation of its administrative behavior. It reflects the decision maker’s intention or goal of regional economic development, that is, balanced or unbalanced regional development. The spatiotemporal pattern evolution of economy is related closely to a series of Hubei regional development policies. From 2005 to 2015, Hubei province put forward the development strategy of “Wuhan metropolitan area” and “One Main and Two Deputy,” the spatial agglomeration trend is relatively stable. Although there is a switch between hot spots and cold spots in the economy, the switch has an obvious “trajectory.” The eastern Hubei region, represented by Wuhan, is attributable to their incomparable policy privileges and superior socioeconomic development advantages to other regions, thus their economic development reached the top level. Yichang and Xiangyang took special advantage of their optimal physical conditions, location, and socioeconomic factors, becoming the key areas of industrial construction in Hubei. In 2015, the GDP of two cities was 164.732 billion yuan and 163.830 billion yuan, respectively, accounting for 10.8% of the GDP of Hubei province, respectively, which is the intermediate bridge to promote the regional cascade development. Together with the adoption of trickle-down growth strategy by the government, the county economic differences in Hubei province have eased; From 2015 to 2020, under the guidance of the concept of balancing urban and rural development, Hubei province put forward the construction of the Yangtze River Economic Belt and the Han River ecological economic belt, as well as the construction of Jingzhou “waist-strengthening project,” which have significant spatial spillover effects. The hot spots and sub-hot spots of economic growth move to the central Hubei and concentrated in contiguous distribution, further narrowing the county economic differences in Hubei province.
The point-axis theory is an extension of the growth pole theory. It not only attaches importance to the role of “point” of growth pole but also emphasizes the role of “axis” to drive regional economic growth. With the formation of growth poles in different regions, the diffusion of multiple growth poles will form the aggregation of elements facing each other between growth poles, thus generating relatively dense element flow on the “axis” between growth poles, forming a relatively developed axis in the region relative to the growth poles. This axis is generally developed along the trunk lines of traffic, once it is formed, it is more favorable to develop the development potential of areas along the trunk lines of traffic. The axis area with its location advantage, adsorption enterprises, and economic sectors form secondary development advantage, which will eventually become a wider growth zone.
This article shows that the “point-axis” development model may be an effective form of economic spatial organization in Hubei province in the future. The spatial continuity and self-organization of the county economic development are strengthened. The aforementioned analysis showed that Hubei province has formed Wuhan, Yichang, and Xiangyang three economic growth points. Several economic growth points and key development axes can be identified in eastern, central, southwest, and northwest Hubei, so as to gradually spread and develop, and promote coordinated regional development in an all-round way. Specifically, east Hubei to southwest Hubei can form a southern horizontal development axis along the Yangtze River, Hu-Han-Rong expressway, and Hu-Han-Rong expressway and national highway 318, the area has a high density of towns and cities with close links to transportation and industry. The northern horizontal development axis from eastern Hubei to northwest Hubei can be formed along Han-Shi Expressway, Handan–XiangYu railway, and 316 national road. The central and southern part of Hubei province is centered on Jingmen and Jingzhou, with the Jianghan Plain as its vast hinterland and highway 318 as its core development axis. In addition, Xiangyang and Shiyan are the centers in the northwest of Hubei, which can take the Handan line and the Han River as the development axis. The southwest of Hubei province is sparsely populated, with uneven distribution of traffic lines and traffic jams. We should take Yichang as the center and the Yangtze River as the development axis, expand westward along the Qingjiang River and speed up traffic construction.
The A-shaped point-axis structure is a reliable transportation framework for regional development in Hubei province. It also has a significant spatial effect surface, which is conducive to giving full play to the role of central cities at all levels and realizing the optimal spatial combination between the production layout and linear infrastructure. It is beneficial to realize the specialization and cooperation between regions and urban and rural areas, and form an organic regional economic network, so as to make the region get the best development.
This article only takes per capita GDP as the measurement index, which cannot fully reflect the comprehensive economic strength of the county, and it only takes the county as the research unit, rather than smaller scales, such as township economic differences. In addition, the economic development has the spatial spillover effect, and the county economy will also be affected by the surrounding areas. Therefore, in future research, we can use the multi index evaluation system of economic differences, extend the research time range, try to explore the spatial differentiation of regional economic differences on a smaller scale, and further explore the effect intensity and regional differences in the influencing factors of economic development in Hubei province and its different regions.
Taking Hubei province as an example and based on spatial autocorrelation and a spatial variogram, this article revealed the spatial pattern evolution and mechanism of the county economy in Hubei province. The conclusions are as follows:
1) The absolute economic differences among the counties in Hubei province expanded from 2005 to 2020, the relative differences tended to narrow, and the number of counties larger than the average per capita GDP of the province gradually increased. On the whole, this reflects the trend of narrowing economic differences among counties. There has been significant spatial agglomeration in the development of the county economy, and the degree of agglomeration has increased. From the perspective of local spatial autocorrelation analysis, HH-type counties are mainly concentrated in the Wuhan urban area and surrounding areas, LL-type counties are mainly distributed in most counties in western Hubei, and the types are scattered in northeastern and south Hubei. The distribution of HL- and LH-type in counties is very small, and there is no obvious law.
2) The county economy in Hubei province presents a circular structure as a whole. From the Wuhan urban area to the edge of the province, a hot area, sub-hot area, sub-cold area, and cold area have successively formed. The Yichang urban area and its surrounding counties form another hot area of economic development in the province, and the sub-hot counties in the middle of the province have increased. The cold area concentrates in the edge counties of western, northeastern, and southeastern of Hubei. During the study period, the sub-hot area and the sub-cold area changed greatly, and they transformed each other.
3) The spatial self-organization and spatial autocorrelation of the county economic pattern in Hubei province have strengthened; the structural differentiation trend caused by the spatial autocorrelation has also strengthened, and the economic spatial differentiation is obvious. The southeast to northwest direction has the largest quantile, the county economy is relatively balanced in the southeast to northwest direction, and the spatial differences in other directions have increased. In addition, having multiple peaks is a feature of the evolution of spatial patterns of the county economy. Over time, the number of peaks has tended to be stable.
4) Our results have significant policy implications for county economic development in Hubei province. Through a spatiotemporal perspective, we find that spatial agglomeration is obvious, which indicates regional inequality will be continued. Therefore, we proposed some suggested countermeasures in this article. ① Build the economic development axis of “Wuhan–Yichang–Xiangyang” in central Hubei. On the axis of economic development, the first is to support Wuhan to speed up the construction of a national central city, optimize and adjust the administrative divisions in a timely manner, incorporate the corresponding surrounding cities (counties) into the territory of Wuhan, and expand the “waist circumference” of Wuhan; the second is to lead the construction of the “Xiang–Shi–Sui” urban belt and promote regional cooperation in the Han River basin; the third is to lead the construction of the “Yi–Jing–Jing” urban agglomeration and promote the ecological and economic cooperation of the Three Gorges, and forming an “A-shaped point-axis” spatial structure of economic development. ② The local county-level government in the western region should take more measures to adjust the industrial structure and improve farmers’ income such as enhancing infrastructure, developing ecological tourism, and selling agricultural products through e-commerce. Enhancing regional cooperation and coordinated development across counties is helpful to reinforce the spatial spillover effect between counties and then narrow the localized regional inequality.
The raw data supporting the conclusion of this article will be made available by the authors, without undue reservation.
LJ: methodology, writing—original draft, writing—review, and editing; JC: software; CZ: validation, data curation, and project administration; YT: formal analysis, investigation, resources, and visualization; and GW and JL: conceptualization and supervision.
This research was funded by the National Natural Science Foundation of China (Grant Numbers: 41871176, 42001185, and 42101209) and the Humanities and Social Science Foundation of Ministry of Education of China (Grant Number: 20YJCZH147).
The authors declare that the research was conducted in the absence of any commercial or financial relationships that could be construed as a potential conflict of interest.
All claims expressed in this article are solely those of the authors and do not necessarily represent those of their affiliated organizations, or those of the publisher, the editors, and the reviewers. Any product that may be evaluated in this article, or claim that may be made by its manufacturer, is not guaranteed or endorsed by the publisher.
Anselin, L. (2013). Spatial econometrics: Methods and models, 4. Berlin, Germany: Springer Science & Business Media.
Atkinson, A. (1970). On the measurement of inequality. J. Econ. Theory 2, 244–263. doi:10.1016/0022-0531(70)90039-6
Cai, A. N., Zhuang, L., and Liang, J. S. (2011). Analyse of regional economic inequality in Jiangsu province by decomposition of Gini. Econ. Geogr. 31, 1995–2000. doi:10.15957/j.cnki.jjdl.2011.12.009
Candelaria, C., Daly, M., and Hale, G. (2009). Beyond kuznets: Persistent regional inequality in China. Fed. Reserve Bank San Franc. Work. Pap. Ser. 7, 1.000–28.000. doi:10.24148/wp2009-07
Chen, L., Zhu, X. G., and Li, X. H. (2016). Disparities of country economy at Yunnan province in China base on the perspective of industrial structure. Sci. Geogr. Sin. 36, 384–391. doi:10.13249/j.cnki.sgs.2016.03.009
Chen, P. Y., and Zhu, X. G. (2012). Regional inequalities in China at different scales. Acta Geogr. Sin. 67, 1085–1097. doi:10.11821/xb201208007
Czako, K., Fekete, D., and Poreisz, V. (2014). Economic differences of countries by the river danube. Procedia Econ. Finance 9, 163–175. doi:10.1016/s2212-5671(14)00017-3
Dou, Y., Luo, X., Dong, L., Wu, C. T., Liang, H. W., Ren, J. Z., et al. (2016). An empirical study on transit-oriented low-carbon urban land use planning: Exploratory Spatial Data Analysis (ESDA) on Shanghai, China. Habitat Int. 53, 379–389. doi:10.1016/j.habitatint.2015.12.005
Esteban, J., Gradín, C., and Ray, D. (2007). An extension of a measure of polarization, with an application to the income distribution of five OECD countries. J. Econ. Inequal. 5, 1–19. doi:10.1007/s10888-006-9032-x
Esteban, J., and Ray, D. (1994). On the measurement of polarization. Econometrica 62, 819. doi:10.2307/2951734
Ezcurra, R., Gil, C., Pascual, P., and Rapun, M. (2006). Inequality, polarisation and regional mobility in the European Union. Urban Stud. 42, 1057–1076. doi:10.1080/00420980500120824
Fang, Y. L., Huang, Z. F., Chen, W. D., and Xie, H. W. (2013a). Spatial evolution of county economy in Anhui province during 2001-2010. Prog. Geogr. 32, 831–839. doi:10.11820/dlkxjz.2013.05.014
Fang, Y. L., Huang, Z. F., Tu, W., and Wu, L. M. (2013b). Research of spatial differences of county econ-omy in Anhui based on Geostatistical analysis. Econ. Geogr. 33, 33–38. doi:10.15957/j.cnki.jjdl.2013.02.005
Fedorov, L. (2002). Regional inequality and regional polarization in Russia, 1990-1999. World Dev. 30, 443–456. doi:10.1016/s0305-750x(01)00124-3
Feng, X. H., Zhong, Y. X., Li, J. X., and Huang, H. (2015). Spatial distribution of the comprehensive level of county-urbanization and its driving factors in urban agglomeration in the middle reaches of Yangtze river. Resour. Environ. Yangtze Basin 24, 899–908. doi:10.11870/cjlyzyyhj201506001
Friedman, J. R. (1966). Regional development policy—a case study of Venezuela. Cambridge: The MIT Press.
Fu, B., J. (2014). The integrated studies of geography: Coupling of patterns and processes. Acta Geogr. Sin. 69, 1052–1059. doi:10.11821/dlxb201408002
Gasparini, L., Horenstein, M., and Olivieri, S. (2006). Economic polarisation in Latin America and the caribbean: What do household surveys tell us? La Plata: Universidad Nacional de La Plata.
Goodchild, M. F. (2009). What problem? Spatial autocorrelation and geographic information science. Geogr. Anal. 41, 411–417. doi:10.1111/j.1538-4632.2009.00769.x
He, S., Fang, C., and Zhang, W. (2017). A geospatial analysis of multi-scalar regional inequality in China and in metropolitan regions. Appl. Geogr. 88, 199–212. doi:10.1016/j.apgeog.2017.08.017
He, S. W., Felix, H. L., and Li, G. D. (2019). A spatiotemporal analysis of county economy and the multi-mechanism process of regional inequality in rural China. Appl. Geogr. 111, 102073. doi:10.1016/j.apgeog.2019.102073
Hu, Y., and Zhang, J. X. (2010). Economic space evolution of Yangtze river delta city group based on county scale. Econ. Geogr. 30, 1112–1117. doi:10.15957/j.cnki.jjdl.2010.07.009
Jin, C., and Lu, Y. Q. (2009). Evolvement of spatial pattern of economy in Jiangsu province at county level. Acta Geogr. Sin. 64, 713–724. doi:10.11821/xb200906008
Jin, C., Xu, J., and Lu, Y. Q. (2007). Study on disparity of tourism scale for cities in Yangtze—Delta and construction for the system of rank—Size distribution. Econ. Geogr. 27, 676–680. doi:10.3969/j.issn.1000-8462.2007.04.035
Kanbur, R., and Zhang, X. (2005). Fifty years of regional inequality in China: A journey through central planning, reform and openness. Rev. Dev. Econ. 9, 87–106. doi:10.1111/j.1467-9361.2005.00265.x
Ke, W. Q., and Lu, Y. Q. (2011). Evolvement of spatial pattern of economy at county level in Fujian Province. Econ. Geogr. 31, 1081–1087. doi:10.15957/j.cnki.jjdl.2011.07.005
Ke, W. Q., Lu, Y. Q., Yu, Z. Y., Chen, W., and Wang, H. (2013a). Study on economic factor relation of Jiangsu counties and evolution process based on quantile regression. Geogr. Geo-Information Sci. 29, 72–77.
Ke, W. Q., Lu, Y. Q., Yu, Z. Y., Wang, H., and Ma, Y. Y. (2013b). Spatial evolution of economic development at county level in Jiangsu based on multivariate drive. Acta Geogr. Sin. 68, 802–812.
Krugman, P. (1991). Increasing returns and economic geography. J. Political Econ. 99, 483–499. doi:10.1086/261763
Lewis, P. H. (1996). Tomorrow by design: A regional design process for sustainability. New York: Wiley, 36–37.
Li, F., and Li, G. D. (2018). Agglomeration and spatial spillover effects of regional economic growth in China. Sustainability 10, 4695. doi:10.3390/su10124695
Li, G. D., and Fang, C. L. (2014). Quantitative measure and influencing mechanism of land intensive use in China at the county level. Acta Geogr. Sin. 69, 1739–1752. doi:10.11821/dlxb201412001
Li, R., Cao, M. M., Hu, S., Liu, W., and Ji, Q. J. (2014). The coordinated development about eco-environment and economy: A case study of yulin city of shanxi. Hum. Geogr. 29, 101–107. doi:10.13959/j.issn.1003-2398.2014.05.017
Li, X. J., and Qiao, J. Q. (2001). County level economic disparities of China in the 1990s. Acta Geogr. Sin. 68, 136–145. doi:10.3321/j.issn:0375-5444.2001.02.002
Liao, F. H. F., and Wei, Y. D. (2012). Dynamics, space, and regional inequality in provincial China: A case study of guangdong province. Appl. Geogr. 35, 71–83. doi:10.1016/j.apgeog.2012.05.003
Liao, F. H., and Wei, Y. D. (2015). Space, scale, and regional inequality in provincial China: A spatial filtering approach. Appl. Geogr. 61, 94–104. doi:10.1016/j.apgeog.2014.12.022
Liu, C. M., and Zeng, J. X. (2011). The calculating method about the comprehensive transport accessibility and its correlation with economic development at county level: The statistical analysis of 79 counties in Hubei province. Geogr. Res. 30, 2210–2220.
Liu, J. B., Yao, Y. J., and Zhang, Y. F. (2007). The analysis of multi-scale spatial patterns of vegetation based on fractal geometry. Res. Soil Water Conservation 14, 155–158. doi:10.3969/j.issn.1005-3409.2007.01.049
Liu, Y. S., and Yang, R. (2012). The spatial characteristics and formation mechanism of the county urbanization in China. Acta Geogr. Sin. 67, 1011–1020. doi:10.11821/xb201208001
Lu, D. D., Liu, Y., and Fan, J. (1999). The regional policy effects and regional development states in China. Acta Geogr. Sin. 66, 496–508. doi:10.11821/xb199906003
Lu, F., and Xu, J. H. (2005). Chinese regional economic inequalities based on the two-stage nested theil decomposition method. Sci. Geogr. Sin. 25, 401–407. doi:10.3969/j.issn.1000-0690.2005.04.003
Ma, G. X., Xu, Y., and Tian, Y. J. (2007). Spatial analysis of economic growth convergence mechanism in Beijing-Tianjin-Hebei Metropolitan Region. Geogr. Res. 26, 590–598. doi:10.3321/j.issn:1000-0585.2007.03.020
Massey, D. (1985). “New directions in space,” in Social relations and spatial structures. Editors D. Gregory, and J. Urry (London: Macmillan), 9–19.
Ortega, E., Monzon, A., and Lopez, E. (2018). The influence of spatial data allocation procedures on accessib-ility results: The case of high-speed rail networks. Appl. Geogr. 94, 241–250. doi:10.1016/j.apgeog.2018.03.020
Perroux, F. (1950). Economic space: Theory and applications. Q. J. Econ. 64, 89. doi:10.2307/1881960
Rey, S. J., and Le Gallo, J. (2009). Spatial analysis of economic convergence. Palgrave Handb. Econ. 2, 1251–1290. doi:10.1057/9780230244405_27
Rey, S. J., and Sastre Gutierrez, M. L. (2015). Comparative spatial inequality dynamics: The case of Mexico and the United States. Appl. Geogr. 61, 70–80. doi:10.1016/j.apgeog.2015.01.012
Rey, S. J. (2016). Space–time patterns of rank concordance: Local indicators of mobility association with application to spatial income inequality dynamics. Ann. Am. Assoc. Geogr. 106, 788–803. doi:10.1080/24694452.2016.1151336
Rozelle, S., Huang, J., and Zhang, L. (2002). Emerging markets, evolving institutions, and the new opportunities for growth in China's rural economy. China Econ. Rev. 13, 345–353. doi:10.1016/s1043-951x(02)00091-3
Sun, P. J., Xiu, C. L., and Dong, C. (2013). Quantitative analysis of economic spatial polarization and driving factors in the northeast of China. Hum. Geogr. 28, 87–93. doi:10.13959/j.issn.1003-2398.2013.01.015
Sun, S. S., Zhu, C. G., and Li, Z. J. (2009). Economic development disparities of huaihai economic zone. Acta Geogr. Sin. 64, 924–934.
Tian, X. Y., and Zhao, Y. T. (2013). Economic spatial disparity in Guizhou Province based on county. Resour. Environ. Yangtze Basin 22, 27–31.
Van Oort, F. G., Burger, M. J., Knoben, J., and Raspe, O. (2012). Multilevel approaches and the firm-agglomeration ambiguity in economic growth studies. J. Econ. Surv. 26, 468–491. doi:10.1111/j.1467-6419.2012.00723.x
Wan, G. H., and Zhou, Z. Y. (2005). Income inequality in rural China: Regression based decomposition using household data. Rev. Dev. Econ. 9, 107–120. doi:10.1111/j.1467-9361.2005.00266.x
Wang, F., and Gao, X. L. (2014). Spatial pattern evolvement of the economy in inner Mongolia at the county level. Sci. Geogr. Sin. 34, 818–824. doi:10.13249/j.cnki.sgs.2014.07.012
Ward, P. S. (2016). Transient poverty, poverty dynamics, and vulnerability to poverty: An empirical analysis using a balanced panel from rural China. World Dev. 78, 541–553. doi:10.1016/j.worlddev.2015.10.022
Wei, Y. D., and Kim, S. (2002). Widening inter-county inequality in Jiangsu province, China, 1950–95. J. Dev. Stud. 38, 142–164. doi:10.1080/00220380412331322621
Wei, Y. D. (2015). Spatiality of regional inequality. Appl. Geogr. 61, 1–10. doi:10.1016/j.apgeog.2015.03.013
World Bank (2009). World development report 2009: Reshaping economic geography. Washington, DC: World Bank.
Wu, D. T. (2001b). Systematic analysis on regional difference between east, middle and west of China. Areal Res. Dev. 20, 10–15. doi:10.3969/j.issn.1003-2363.2001.02.003
Wu, D. Y. (2001a). A study on north-south differences in economic growth. Geogr. Res. 20, 238–246. doi:10.3321/j.issn:1000-0585.2001.02.015
Wu, J. M., and Ding, J. H. (2011). A research on the spatial differences of the economic performance on the county level and the reasons: Taking Wuji county, Hebei Province for instance. Areal Res. Dev. 30, 33–37+44. doi:10.3969/j.issn.1003-2363.2011.02.007
Xiong, W., Xu, Y. L., and Wang, Y. G. (2011). Temporal-spatial change of the county-level economic disparities in Jiangsu Province. Prog. Geogr. 30, 224–230. doi:10.11820/dlkxjz.2011.02.012
Xu, J. H., Lu, F., Su, F. L., and Lu, Y. (2005). Spatial and temporal scale analysis on the regional economic dispariti-es in China. Geogr. Res. 24, 57–68. doi:10.3321/j.issn:1000-0585.2005.01.007
Xu, M., and Liu, C. L. (2012). Performance evaluation and correlation trend analysis of urban-rural integrated development in China. J. Nat. Resour. 27, 734–746. doi:10.11849/zrzyxb.2012.05.003
Xu, Y. N., Li, E. L., Xu, Y. H., and Wei, S. H. (2015). Spatial pattern change of the county scale economic development in Central Plains Economic Region. Econ. Geogr. 35, 33–39. doi:10.15957/j.cnki.jjdl.2015.04.005
Ye, X., and Wei, Y. H. D. (2005). Geospatial analysis of regional development in China: The case of zhejiang province and the wenzhou model. Eurasian Geogr. Econ. 46, 445–464. doi:10.2747/1538-7216.46.6.445
Yu, D. L., and Wei, Y. H. D. (2003). Analyzing regional inequality in post-mao China in a GIS environment. Eurasian Geogr. Econ. 55, 514–534. doi:10.2747/1538-7216.44.7.514
Zhang, J., and Deng, W. (2016). Multiscale spatio-temporal dynamics of economic development in an interprovincial boundary Region: Junction area of Tibetan plateau, hengduan mountain, yungui plateau and sichuan basin, southwestern China case. Sustainability 8, 215. doi:10.3390/su8030215
Zhang, J. Z., Liang, J. S., and Zhu, Y. X. (2010). The characteristics, reasons, and measures of county economic division of Xinjiang. Sci. Geogr. Sin. 30, 536–543. doi:10.13249/j.cnki.sgs.2010.04.024
Zhang, X., and Kanbur, R. (2005). Spatial inequality in education and health care in China. China Econ. Rev. 16, 189–204. doi:10.1016/j.chieco.2005.02.002
Zhang, X., and Kanbur, R. (2001). What difference do polarisation measures make? An application to China. J. Dev. Stud. 37, 85–98. doi:10.1080/00220380412331321981
Zhao, Y. Z., and Dong, P. (2012). Analysis on the characteristics of county economic disparities and its causes in Jiangxi Province. Hum. Geogr. 27, 87–91. doi:10.3969/j.issn.1003-2398.2012.01.017
Zhong, Y. X., and Lu, Y. Q. (2010). County level economic disparities in the red-triangle economic zone. Econ. Geogr. 30, 568–573. doi:10.15957/j.cnki.jjdl.2010.04.012
Zhou, J. W., and Zhang, L. (2011). Spatial scale effects of the regional economic disparities in the central China area. Geogr. Geo-Information Sci. 27, 49–52.
Keywords: county economic, spatial pattern evolution, spatial variogram, kriging interpolation, Hubei province
Citation: Jiang L, Chen J, Zhang C, Tian Y, Wu G and Luo J (2022) Study on spatial evolution and mechanism of county economic differences in Hubei province from 2005 to 2020. Front. Earth Sci. 10:918123. doi: 10.3389/feart.2022.918123
Received: 12 April 2022; Accepted: 06 July 2022;
Published: 04 August 2022.
Edited by:
Yan Hao, Shandong Normal University, ChinaReviewed by:
Qingsong He, Huazhong University of Science and Technology, ChinaCopyright © 2022 Jiang, Chen, Zhang, Tian, Wu and Luo. This is an open-access article distributed under the terms of the Creative Commons Attribution License (CC BY). The use, distribution or reproduction in other forums is permitted, provided the original author(s) and the copyright owner(s) are credited and that the original publication in this journal is cited, in accordance with accepted academic practice. No use, distribution or reproduction is permitted which does not comply with these terms.
*Correspondence: Jing Luo, bHVvamluZ0BtYWlsLmNjbnUuZWR1LmNu
Disclaimer: All claims expressed in this article are solely those of the authors and do not necessarily represent those of their affiliated organizations, or those of the publisher, the editors and the reviewers. Any product that may be evaluated in this article or claim that may be made by its manufacturer is not guaranteed or endorsed by the publisher.
Research integrity at Frontiers
Learn more about the work of our research integrity team to safeguard the quality of each article we publish.