 Xiaolong Liu
 Dafang Fu1,2*
 Meixiu Yu
 Alagarasan Jagadeesh Kumar
95% of researchers rate our articles as excellent or good
Learn more about the work of our research integrity team to safeguard the quality of each article we publish.
Find out more
ORIGINAL RESEARCH article
Front. Earth Sci. , 04 July 2022
Sec. Environmental Informatics and Remote Sensing
Volume 10 - 2022 | https://doi.org/10.3389/feart.2022.917069
This article is part of the Research Topic Extreme Precipitation Events: Spatio-Temporal Connections, Forecasting, Generation, Impact Analysis, Vulnerability and Risk Assessment View all 13 articles
As a result of the fast growth of remote sensing and data assimilation technology, many global land use land cover (LULC) and climate reanalysis data sets have been used to advance our understanding of climate and environmental change. This paper investigates the precipitation variations of the Yangtze Delta Megalopolis by using precipitation reanalysis data under conditions of dynamic urban sprawl. Compared with current precipitation characteristic analyses, which are often based on a limited number of ground rainfall stations, the approach followed in this study comprises a grid-based statistical method using large sets of samples with a uniform distribution and a same representative grid area. This novel approach of dynamic sampling is applied in this study to overcome the temporal and spatial inconsistency of stationary sampling. This approach allows to examine the impact of urbanization on regional precipitation characteristics. The Yangtze Delta Megalopolis (YDM) region, one of the most developed regions in China, was selected as a case study to evaluate the impact of urbanization on subsequent precipitation features. The results reveal that the annual total precipitation (TP) and the maximum daily precipitation (MDP) in both urban and non-urban areas of the YDM region generally have increased during the past 30 years. Hence, the region has become increasingly humid. Extrema of annual MDP and TP show obvious spatial characteristics, in which most maxima are located in the southern part of YDM while minima are more concentrated in the northern part. This newly developed approach has potentials for application in studies where underlying surface features exhibit rapid alterations. The findings of this case study provide relevant information for planning and design of regional water resources management, flood risk management, and planning of the urban drainage system of the YDM region.
The impact of climate change and associated anthropogenic activities on the alteration of the urban hydrological regime and meteorological characteristics are an emerging and challenging subject of current urban hydrological research. The World Bank reported that the global air temperature in the middle of this century will rise by 2°C and reach 4°C by the end of the century, compared to the pre-industrial level in the 18th century (Potsdam Institute for Climate Impact Research and Climate Analytics, 2013). This will lead to an increase in the frequency and intensity of extreme rainfall, heat waves, and consequently, of droughts and floods. There is scientific consensus attributing global warming and more frequent climate extremes to human activities (IPCC et al., 2013a; IPCC et al., 2021b; Zhang et al., 2022). In the past 100 years (1908–2007), the climate change pattern observed in China was similar to the global one (Ding et al., 2006). Its average surface temperature increased by 1.1°C, slightly higher than the global average for the same period. The average annual rainfall showed an upward trend in the past 50 years, especially in the middle and lower reaches of the Yangtze River basin and the southeast of China. Both the frequency and intensity of climate extreme events have increased (Zhang et al., 2022; Ding et al., 2006; The State Council Information Office of the People’s Republic of China, 2008; National Development and Reform Commission (NDRC), 2013).
Since the 1980s, China’s economy has grown sharply, and the level of urbanization has risen drastically (Liu et al., 2021). The nominal gross domestic product (GDP) expanded 274 times from 367.87 billion CNY in 1978 to 100.88 trillion CNY in 2020, while the urban population percentage climbed from 17.92 to 63.89%. Although the level of urbanization is a critical indicator of social and economic development, the rapid urbanization in the last two decades has triggered a series of social-ecological-environmental processes, resulting amongst others into the occurrence of urban rain islands, urban heat islands, urban dust domes, and urban canyon effects (Central Committee of the Communist Party of China (CPC), 2014; Ding, 2018; Zhang et al., 2014). Compared with natural vegetation coverage, the urban heat island effect and dust cover effect aggravate variations in the regional spatial distribution of rainfall, resulting in a marked increase in rainfall peaks in built zones and downwind areas (Shepherd, 2005; Goddard Space Flight Center, 2012). The increase of impervious surfaces reduces evapotranspiration and infiltration, shortens the time of concentration, and increases the runoff coefficient (Zhang et al., 2014; Schueler, 1995; Federal Interagency Stream Restoration Working Group (FISRWG), 1989; Fletcher et al., 2013; Zhao et al., 2013; He et al., 2003). The changes of urbanization to the underlying surface have exacerbated the occurrence of extreme rainfalls, floods, and droughts (Research Council, 2008; Yu et al., 2014).
The Yangtze River Delta (YRD) has experienced rapid urbanization in the past decades and has become one of the most developed regions in China, forming the world-renowned Yangtze Delta Megalopolis (YDM) (Fang, 2019; Yu et al., 2021). While rapid development brought prosperity to the YDM, it also caused drawbacks challenging its livability, such as foggy haze (Meng et al., 2015; Liu et al., 2020), heat waves (Huang et al., 2008; Huang and Lu, 2015), and heavy precipitation (Fu et al., 2017; Ding, 2018). In the past decade, the intensity and frequency of extreme rainfall events and the resulting flood disasters exceeded the stationary reference standards for both urban drainage and flood control systems in the region (Wang et al., 2015; Xu et al., 2019; Xu et al., 2020). Extreme rainfall and snow destroy infrastructure services such as housing, transportation, communications, and electricity, threatening city safety. The impact of urbanization on regional and extreme rainfall has received extensive attention. Most of the studies on the impact of urbanization on urban rainfall are based on ground rain gauge stations (Table 1). The statistical rigor and hence the effectiveness of the methods applied are dependent on the availability of reliable and representative urban precipitation data. These are often limited as they require a dense gauge station network to achieve true urban coverage. In addition, these studies rarely consider urbanization as a dynamic phenomenon influencing the environment of the observation sites, such as a change of the underlying surface conditions due to urban densification and expansion. This hinders the exploration of the temporal variation of rainfall characteristics, which makes such an analysis inconsistent in time and space.
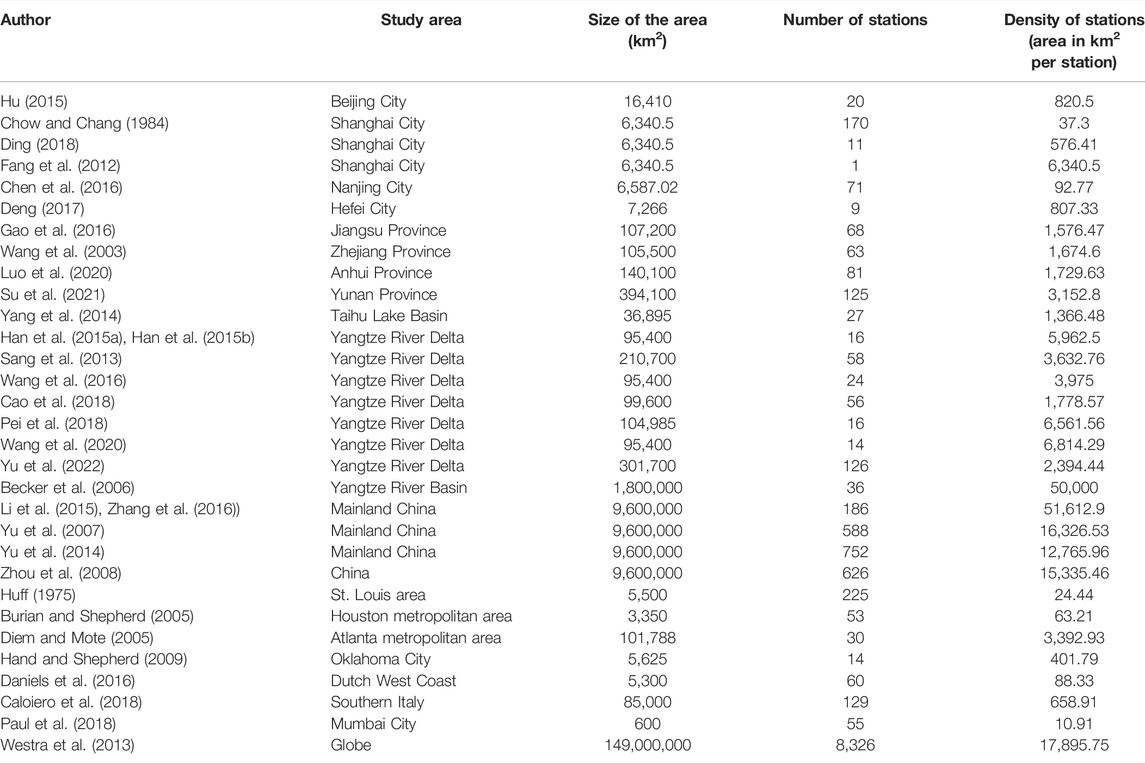
TABLE 1. Summary of the characteristics of the case study on precipitation.
It is common practice to examine the temporal and spatial distribution of urban precipitation using precipitation data from visible ground weather stations. Hu (2015) examined the characteristics of rainstorm-induced hazards in Beijing City and the effect of urbanization based on precipitation data derived from 20 precipitation gauge stations. Using precipitation data from 170 precipitation stations of Shanghai City, Chow and Chang (1984) plotted the isohyets of average annual precipitation, average wet season precipitation, and average dry season precipitation to analyze the relationship between precipitation distribution and city development. Significant urban rainfall islands were detected in the central region of Shanghai City based on the hourly precipitation of 11 precipitation stations by Ding (2018), who found that the maximum hourly precipitation occurred in the city center and gradually decreased from the city center to the suburbs. Fang et al. (2012) analyzed the daily precipitation at Baoshan Station in Shanghai and showed that the number of rainy days gradually decreased from 1971 to 2010, whilst the intensity and frequency of short-duration rainfall increased. The domain size, number of precipitation stations, and average density of research concentrating on differences in urban precipitation at different spatial scales are shown in Table 1. By dividing the domain area by the number of precipitation stations, the average density of precipitation stations was computed. The spatial scale of the study areas varied widely, ranging from cities to countries, natural river basins to the worldwide river system. Station network density ranged from 10.91 km2 per station to 51,612.9 km2 per station, with an average of 7,182.56 km2 per station. Some scholars were overly optimistic in their assessment of site precipitation trends as regional trends, while others cautioned that site precipitation characteristics merely represent gauge station precipitation trends (Fang et al., 2012; Şen, 2014). The spatial distribution of precipitation stations employed in most research was excessively sparse when compared to the World Meteorological Organization’s (WMO) suggested minimum densities of precipitation stations (10–20 km2 per station in urban areas) (World Meteorological Organization, 2008a; Chacon-Hurtado et al., 2017). When the density of precipitation stations is excessively high, the results of statistical analysis may be equivocal according to the large sample principle of statistical analysis, which states that the larger the sample size, the more they tend to their true value.
In a study spanning several decades, it is not uncommon that initially non-urban areas, or upwind/downwind zones, gradually become urban areas as a result of urban expansion. As a result, the weather stations in these shifting areas have transitioned from rural to urban stations. Many studies have used the existing underlying surface to differentiate between urban and non-urban areas when detecting precipitation trends without taking into account the passive changes in the site background environment generated by urbanization: for example, in Hu (2015), Hand and Shepherd (2009), Chen et al. (2016), and Kishtawal et al. (2010). Some researchers have noted that when cities grow, the classification of certain weather stations changes from non-urban to urban. To assess the impact of small and fragmented urban areas on precipitation along the Dutch West coast, Daniels et al. (2016) used land use data and geostrophic wind direction with a record length of 59 years for every 10 years to dynamically divide precipitation sites into rural and urban categories. By using remotely sensed image analysis, Zhang et al. (2021) discovered that land use and anthropogenic heat flow produced by urbanization had a considerable impact on the consistency of surface weather station data. Yu et al. (2022) identified urban and rural stations by using a method that combined a circular buffer and the percentage of urban area within the buffer to explore the shift pathways of the light and heavy precipitation associated with urbanization in the Yangtze River Delta region. Due to the availability of LULC data, there was no extra station identification for precipitation before 1980 and after 2015. In addition, the categories of stations were considered static in a few analyses, for example, the case analyzing the effect on sample size. Once the category of a rain gauge station being affected by urban expansion alters, it is often accompanied by a modification of the features of the domain that the rain station represents. This may lead to a loss of consistency in the rainfall data observed before and after the change (Dahmen and Hall, 1990; World Meteorological Organization, 2008b). If a trend analysis is performed directly on those precipitation stations while ignoring the change in their categories, the applicability of the precipitation characteristic data will be considerably reduced.
The purpose of this study is to describe and demonstrate a novel method based on a statistical analysis of remotely sensed data sets to overcome the sampling sufficiency challenge in rainfall trend analysis in terms of size and representativeness which acknowledges the dynamic nature of the surface area due to urbanization. The YDM region was selected as a case study as it experienced rapid expansion of its built area and frequent heavy precipitation events in recent decades.
The Yangtze River Delta is one of the most developed regions in China. The growth rate of its economic and urban development is ahead of the national average (Yu et al., 2021). The “Development Plan for the Yangtze Delta Megalopolis” was issued by the Chinese central government as one of the national strategies in 2016, in order to strengthen the coordination and cooperation in cross-city/regional development and enhance the international competitiveness of Chinese cities. The Yangtze Delta Megalopolis, located downstream of the Yangtze River Basin, has a land area of approximately 2.12 ×10⁵ km2, and accommodates 26 cities, i.e. Shanghai, nine cities in Jiangsu Province (Nanjing, Wuxi, Changzhou, Suzhou, Nantong, Yancheng, Yangzhou, Zhenjiang, and Taizhou), eight cities in Zhejiang Province (Hangzhou, Ningbo, Jiaxing, Huzhou, Shaoxing, Jinhua, Zhoushan, and Taizhou), and eight cities in Anhui Province (Hefei, Wuhu, Maanshan, Tongling, Anqing, Chuzhou, Chizhou and Xuancheng) (Figure 1) (National Development and Reform Commission of the People’s Republic of China (NDRC), 2016). At the end of 2019, its registered population had reached 132.6 million, accounting for 9.47% of China’s population and 1.73% of the global population. Its nominal GDP in 2019 was 19.71 trillion CNY, accounting for 19.98% of China’s GDP and 3.55% of the global GDP, respectively.
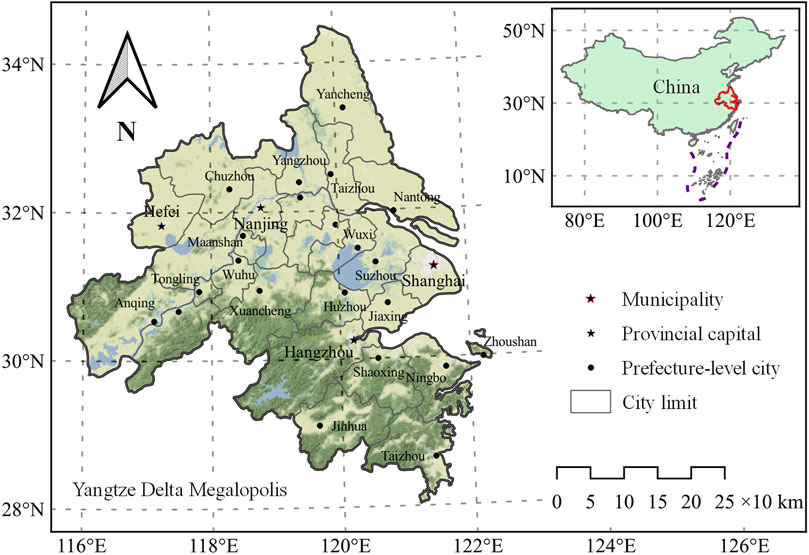
FIGURE 1. The study area of the Yangtze Delta Megalopolis, China. Terrain tiles by Stamen Design (Terrain Classic Contributors, 2021) are used as a background.
Climate Hazards Group InfraRed Precipitation with Station data (CHIRPS) was jointly released by the University of California, Santa Barbara (UCSB) Climate Hazards Center and the United States Agency for International Development (USAID) in 2015 (Funk et al., 2015). This data set is based on the fusion of ground station and satellite-based remotely sensed data. Ranging from 1981 to near-present, it completely covers the YDM with a resolution of 0.05°×0.05° (approximately 5.6 km at the equator, less than 5 km in the YDM). Bai et al. (2018) assessed the accuracy of CHIRPS compared with rain gauges over mainland China and concluded that CHIRPS had a better performance in rainy areas than in arid or semi-arid areas. Tang et al. (2019) conducted a series of hydrological simulations using the Soil and Water Assessment Tool (SWAT) forced with different precipitation products in the Lancang River Basin. CHIRPS performed well in both the whole basin and sub-basins on the daily and monthly scales. Catholic University of Louvain (UCLouvain) has produced Global Land Cover (ESA-CCI-LC), a global land cover data product based on data obtained from the European Space Agency’s (ESA) Climate Change Initiative (CCI) (Defourny et al., 2017; Copernicus Climate Change Service, 2020; European Space Agency (ESA), 2015). With a horizontal resolution of 300 m and a time resolution of a year, this data collection follows the land cover categorization system (LCCS) defined by the United Nations (UN) Food and Agriculture Organization (FAO) (Gregorio and Jansen, 2000). On the premise of ensuring the availability of data in the YDM region, and after comparing the time series lengths and temporal and spatial resolution of the current available precipitation/land cover data, the CHIRPS data set as the daily precipitation data source was selected for this study. This allowed taking advantage of the high spatial resolution of 5 km as well as the long time coverage from 1981 to the present. ESA-CCI-LC was chosen as the basic land cover data in this study since it has a horizontal resolution of 300 m and a yearly time resolution from 1992 to the present.
The original boundary of the YDM was extended about 10 km outwards. Then, the extended YDM was divided into grids with the same size and location as the land use and precipitation data grids. The spatial coordinate reference system (CRS) used for grid creation was EPSG:32650; the affine transformation was set by defining the limits (west, south, east, north), length, and width, with parameters of 340,000, 3,065,000, 1,060,000, 3,875,000, 5,000, and 5,000, respectively. In the study area YDM, a total of 9,698 effective grids with a horizontal resolution of 5 km × 5 km were created (Figure 2). The gridding method provides the advantages of a large sample size, uniform distribution, and the same cell area, as shown in Figure 2.
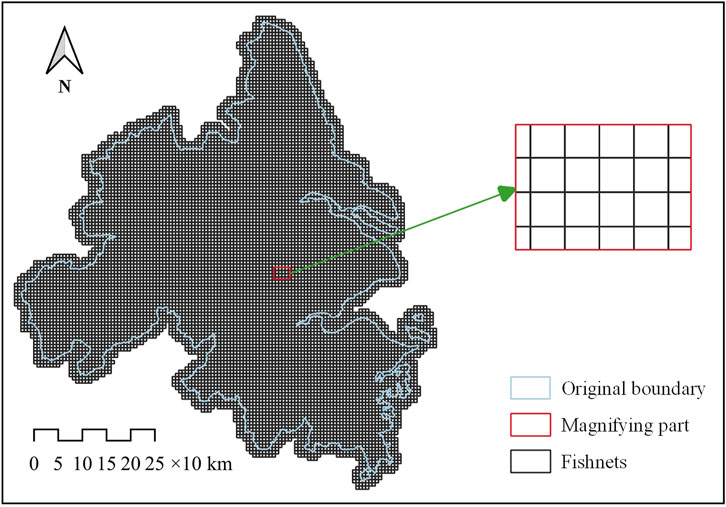
FIGURE 2. Fishnets in the YDM.
To compare the impact of urbanization on regional precipitation, the ESA-CCI-LC data set was binarized/converted into land use maps with two classes of urban/built-up and non-urban/built-up based on the class value of the land cover being equal to 190 or not (190 for urban areas). All grids of the urban/built-up class were designated as urban region, the others were deemed non-urban region in the YDM region (Supplementary Figure S1). To ensure that the land use maps matched the precipitation data grid, they were resampled at a horizontal resolution of 5 km × 5 km. Supplementary Figure S1 depicts the 2020 binarized land use map.
The annual land use maps for urban and non-urban regions from 1992 to 2020 were generalized by the binarization approach to characterize the evolution dynamics of urbanization. After binarization, the grid number of urban and non-urban regions was counted year by year using the land use map. Figure 3 presents the trend of the grid number over time. Supplementary Figure S2 depicts the temporal and spatial distributions of urban construction in the YDM from 1995 to 2015.
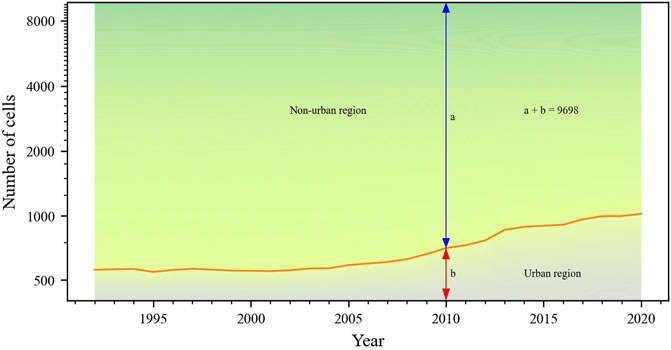
FIGURE 3. Temporal variations of the sampling grid number for urban and non-urban regions in the YDM. The sum of the grid numbers of urban region and non-urban region always equals to 9,698.
Using the yearly MDP as an example, the following statistical approach was developed for the above-mentioned year-by-year change of the gridded precipitation. Assuming that the dynamic area has n grids in the
where
The first statistic was taken on the above matrix
where
Then, in
Assuming
Taking out the
The time series constructed above has been used to conduct a precipitation trend analysis by adopting a probabilistic analysis strategy with percentile statistics (Stensrud and Yussouf, 2007; Du and Chen, 2010; IPCC, 2021b). Meanwhile, a decadal average was performed to smooth out the fluctuations of the yearly statistics and highlight their trends (Akrami et al., 2014). To investigate the linear correlation for the time series between urban and non-urban regions, the Pearson correlation coefficient (PCC) and corresponding significance p-value were calculated by using the linregress function provided by the SciPy library (Taylor, 1990; Virtanen et al., 2020). The overall agreement was quantified using modified Kling-Gupta efficiency (KGE) (Gupta et al., 2009; Kling et al., 2012). The Mann-Kendall test supported by pyMannKendall was implemented to determine the trends of statistics (Yue and Wang, 2004; Hussain and Mahmud, 2019).
The statistical method comparable to annual MAP was made for finding total annual precipitation. Here, in Eq. 2
where
As shown in Figure 3, the number of sampling grids exhibit a gradual increase in the urban region over time with a decrease in the non-urban region. It is to be expected that an expansion of the sampling regions will result in higher maxima and lower minima of daily precipitation than the unchanged sampling cells. To investigate how a change in sample size for the urban region affects the results, we compared the precipitation statistics for the expanding and unchanged urban regions using grids from 1992 to 2020. It follows from the results that these effects are too small (fall within the noise range) to be of particular concern for MDP in the urban regions before 2010 (Supplementary Figure S3). The interquartile ranges show a minor shift downwards from 2010 to 2020. These shifts are also quantitatively reflected in the MK values (Table 2). The effects of the reduced sampling cells are negligible in the non-urban regions (Supplementary Figure S4). Kling-Gupta efficiency coefficient (KGE) values reveal a similar pattern of all five quantiles of the annual MDP between the changing urban and non-urban regions and their unchanging parts, with values greater than 0.902 (Supplementary Table S1). In addition, the difference in sample size between urban and non-urban regions may also affect the results. We resampled an equal number of sampling cells from the non-urban region, equivalent to the number of sampling cells in the urban region, and extracted its five-number summary. After repeating 1,000 times, we found that the difference between the urban region and resampled non-urban regions was positively related to the difference between the urban and non-urban regions (Figures 4A–E). The extreme values of MDP amplified/decreased by the large sampling cells in the non-urban region. This amplification/decrease complicates an analysis of the relationship of precipitation extremes between the urban and non-urban regions, especially minima. As for the other three quartiles, they show great stability, irrespective of the sample size. Although the sample size matters, the difference in sample size disturbed the extrema of MDP slightly as well as strengthened the interquartile law under the context of a large sample strategy adopted in this study. Previous studies were hindered due to the limited number of ground stations and their representativeness (Sang et al., 2013; Han et al., 2015a; Han et al., 2015b; Wang et al., 2016; Cao et al., 2018; Pei et al., 2018; Wang et al., 2020; Yu et al., 2022). This limitation exacerbated after applying complex category identification of these stations (Diem and Mote, 2005; Yu et al., 2022). High-resolution reanalysis data such as CHIRPS provides a promising solution.
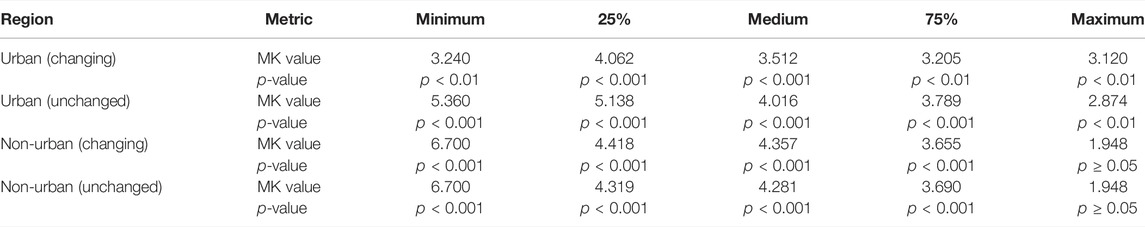
TABLE 2. The MK trend test for annual MDP in different percentiles of the YDM from 1992 to 2020.
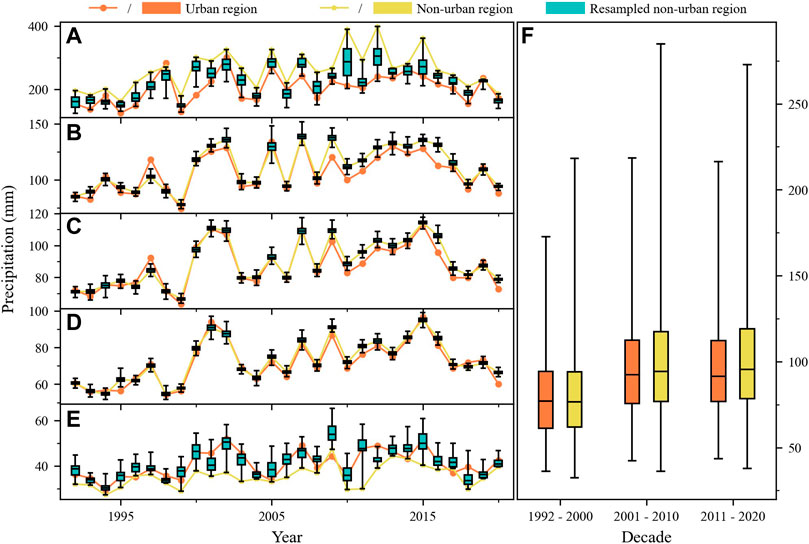
FIGURE 4. The annual MDP in the YDM from 1992 to 2020. (A) maximum, (B) 75th percentile, (C) median, (D) 25th percentile, and (E) minimum represent the yearly changes. The boxplot of decadal averages is shown in (F).
The distribution of MDP has recognizable spatial characteristics within each year interval, but there is no unified feature between the years (Figure 5). However, Figures 6A,B depict that most of the maxima of MDP are located south of 31°N and most of the minima are located north of 31°N for both urban and non-urban regions, which may be related to topography and landform (Supplementary Figure S7). This is in line with observations of more heavy precipitation in the southern part of YRD reported in previous work (Sang et al., 2013; Han et al., 2015a; Wang et al., 2016).
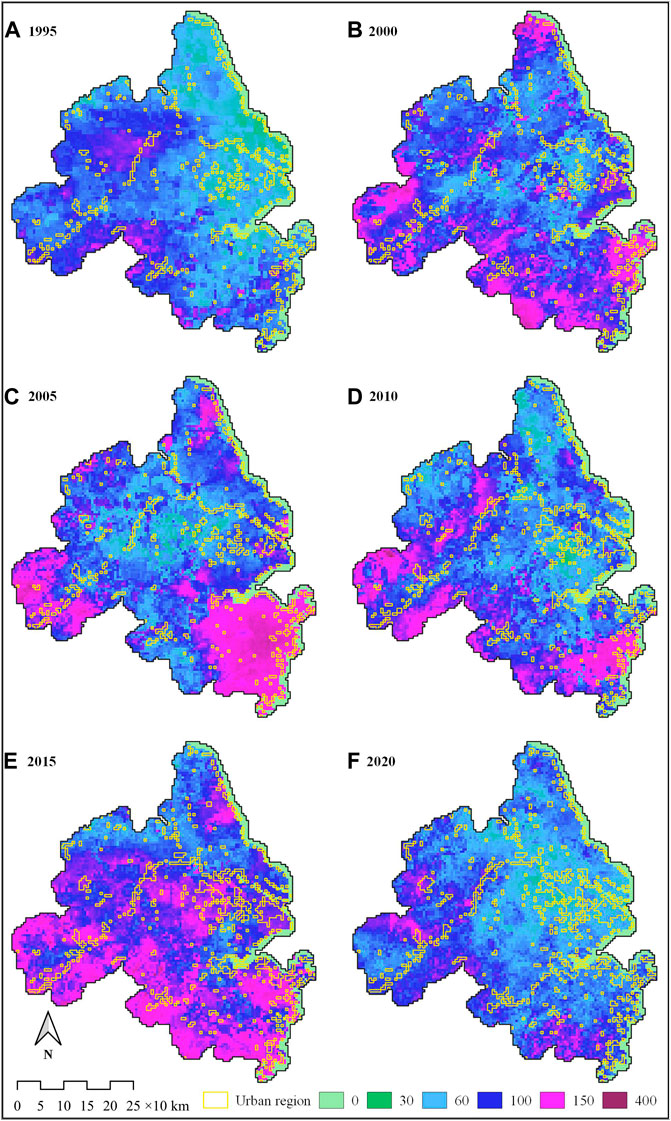
FIGURE 5. The distribution of annual MDP in the YDM at quinquennial intervals from 1995 to 2020.
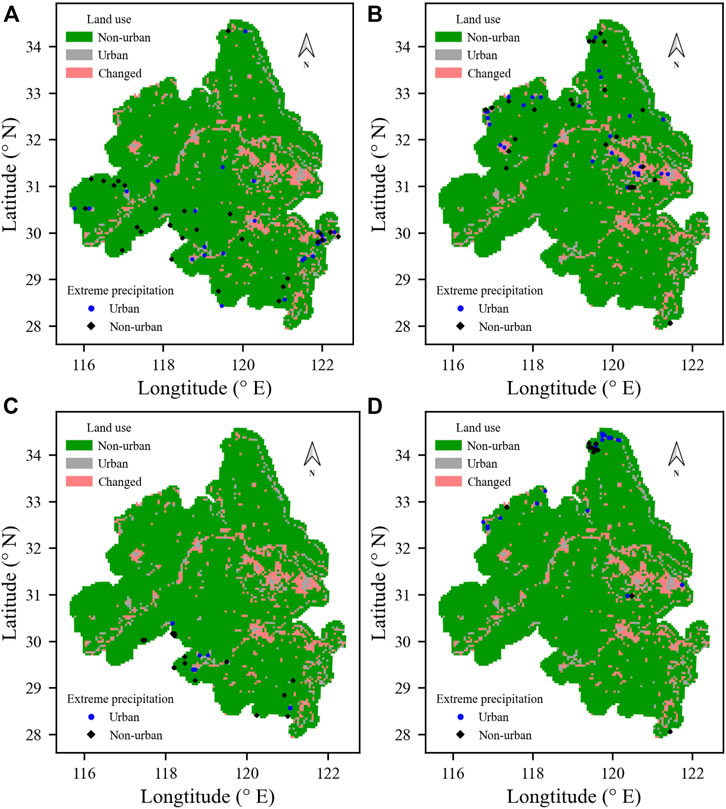
FIGURE 6. The distribution of yearly precipitation extrema in the YDM from 1995 to 2020 for (A) maxima of MDP, (B) minima of MDP, (C) maxima of TP, and (D) minima of TP.
Figures 4A–E show that the five quantiles of the yearly MDP increased to varying degrees in both the urban and non-urban regions. The percentiles of 25, 50, and 75% exhibit stable characteristics, ignoring the complexities of extrema that are influenced by the differences in sampling cells between urban and non-urban regions. All six time series in the MK trend test revealed a significant increasing trend, with five out of six (25% quantile and median of the annual MDP in the urban region and the 25%, median, and 75% in the non-urban region) meeting the significance level of 0.001 (Table 2). The distribution of difference for 10-year period averages of annual MDP in the YDM between the 1990s and 2010s is illustrated in Figure 7. In the past three decades, most cells have experienced an increase in annual MTP of decadal average. This increasing trend is uniform and significant for both urban and non-urban regions. If the non-urban region that is relatively less affected by human activities is regarded as a baseline, this explicitly indicates that the YDM climate change may be playing a dominant role in the trend variations of annual extreme precipitation. However, the yearly MDP in the YDM’s urban region is rising which may lead to a growing risk of urban flooding (Yu et al., 2022). This is in line with the observed increase in the frequency of flooding of many urban areas in recent years, as well as the higher economic losses caused by floods in the YDM. Figure 8 depicts a significant rise in economic losses due to urban flooding in the YDM region from 2006 to 2020 (Ministry of Water Resources of the People’s Republic of China (MWR), 2021). In addition, these results differ from previous studies on the impact of urbanization on hourly precipitation, which have shown a correlation between rapid urbanization and more extreme precipitation events (sub-daily) in urban areas (Liang and Ding, 2017; Ding, 2018; Jiang et al., 2020; Wang et al., 2021). In the comparison of these studies, this may be affected by data sources (station-/ non-station- based and the number of stations), statistic methods, and sizes and locations of case domains. And/or, it may be recommended that there are critical temporal resolutions greater than 3 h and less than 24 h in YDM, which separate these rules.
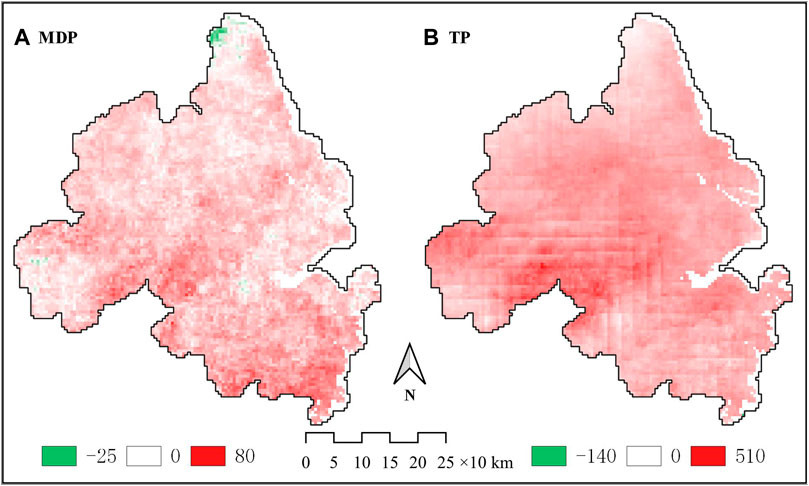
FIGURE 7. The distribution of precipitation difference for 10-year period averages in the YDM between the 1990s and 2010s for (A) MDP and (B) TP.
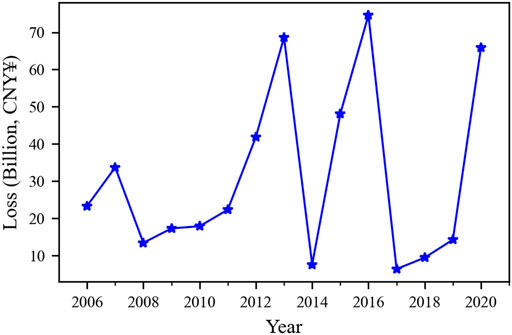
FIGURE 8. Historical flood loss in Jiang-Zhe-Hu-Wan region. Jiang, Zhe, Hu, and Wan are the abbreviations of Jiangsu Province, Zhejiang Province, Shanghai City, and Anhui province, respectively.
The Pearson correlation coefficient (PCC) and its p-value, as well as the Kling-Gupta efficiency coefficient (KGE) were used to assess the correlation between annual MDP of various quantiles across the urban and non-urban regions (Table 3). The line plots fluctuate similarly in the five quantiles of annual MDP in the urban and non-urban regions (Figures 4A–E), with values of PCC and KGE lying between 0.588–0.978 and 0.563–0.964, respectively (Table 3). The non-urban region has a significantly lower annual MDP than the urban region for the lowest, whereas the other quantiles in the non-urban region are generally higher than the urban region, with the maximum being the most significant. In both urban and non-urban regions, the 75th percentile, median, and 25th percentile of annual MDP are very close, and their PCC and KGE values are both above 0.9. According to the findings, there is a significant positive correlation between annual MDP in urban and non-urban areas, with the correlation in the middle three quantiles being significantly stronger than the correlation in the extreme quantiles. The yearly MDP of the urban region matches well with the non-urban region, with the middle three quantiles showing a better fit than the extreme quantiles. The yearly MDP fluctuation features in urban and non-urban locations are similar, with no significant differences, according to the strong correlation coefficients and satisfactory fitting methods.
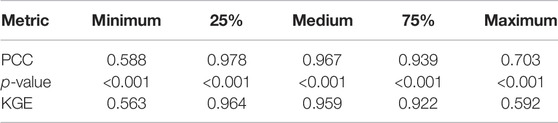
TABLE 3. Correlation and fitting of the annual MDP in different percentiles between urban and non-urban regions of the YDM during 1992–2020.
The box plot’s interdecadal variations reveal a gradual increase in the 10-year period averages of annual MDP in both urban and non-urban areas from the 1990s to the 2010s (Figure 4F). Except for the lowest percentile, non-urban regions’ yearly MDP percentiles are greater than those in urban areas. Using the median as an example, in the 1990s, the decadal averages in urban and non-urban regions are nearly identical (76.99 and 76.61 mm), but in the 2010s, the averages grow to 91.53 and 95.53 mm, respectively, with percentage increases of 18.89 and 24.70%. Comparing the MK values of the 25th percentile, median, and 75th percentile in Table 2, the increase of the values in the non-urban region are greater than those in the urban region. Regardless of the impact of the sample size, this may be due to land cover and atmospheric humidity changes caused by urban expansion and human activities. Lu et al. (2019) found that the increase in the recurrence levels of annual MDP of non-urban stations is higher than that of urban stations considering the urbanized impacts. The non-urban areas with woodland, rainfed croplands, and grassland as the main underlying surface, which are the dominant land covers of precipitationsheds, may provide more favorable conditions for the generation of stronger heavy precipitation or heavier rainstorm centers at a daily scale (Keys et al., 2012). However, evapotranspiration is weakened in urban areas due to the loss of green vegetation. In comparison with the natural ground cover, the evapotranspiration decreases from 40 to 30% of the precipitation as the impervious surface area increases in urban areas (Federal Interagency Stream Restoration Working Group (FISRWG), 1989; Ellison et al., 2017). This process will result in a drop of atmospheric water vapor content, so the precipitation possibly decreases in the precipitationshed’s sink zone (Keys et al., 2012; Luo and Lau, 2019).
An estimate of the impact of sample size changes on TP was conducted. Supplementary Figure S6 shows that the quantiles of TP for the decreasing non-urban regions are almost the same as those extracted from the unchanged region. The good fit reflected by these KGEs close to 1 are presented in Supplementary Table S1. Supplementary Figure S5 depicts that in the growing urban regions with more sampling cells the ranges of TP have expanded in certain years resulting from an increase of their extremes compared to the unchanged urban region. The interquartile ranges are a little bit narrowed due to the downward shift in the upper quartiles in the 2010s. Compared to the unchanged urban region, the MK values for percentiles of 25, 50, and 75% in the changing urban regions decrease as well (Table 4). Considering the large difference in sample size between non-urban and urban regions, Figures 9A–E reflect that this difference has little effect on the 25th percentile, median, and 75th percentile. There is a significant influence on most extrema, but the relative magnitude of TP extrema in urban and non-urban areas is rarely affected. Similar to annual MDP, impacts of sample size changes on annual TP are very limited, in contrast, the characteristics in the interquartile ranges are pretty stable under the large sample strategy.
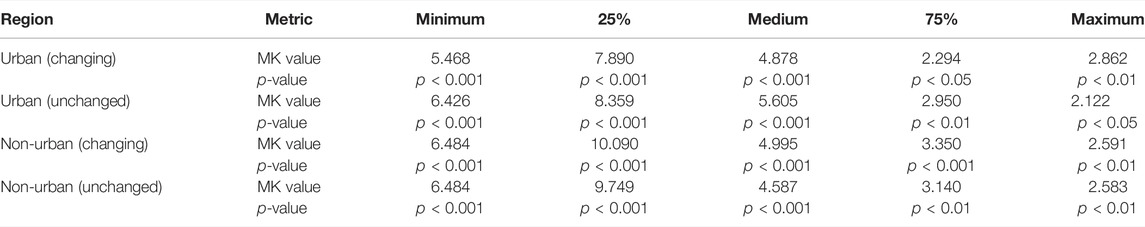
TABLE 4. The MK trend test for annual TP in different percentiles of the YDM during 1992–2020.
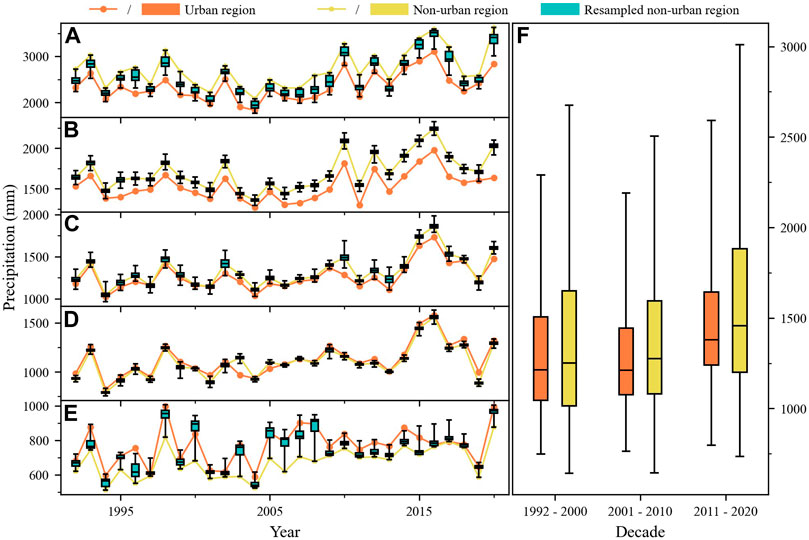
FIGURE 9. The annual TP from 1992 to 2020 in the YDM. Yearly fluctuations of (A) maximum, (B) 75th percentile, (C) median, (D) 25th percentile, and (E) minimum. (F) boxplot of decadal averages.
Figure 10 depicts the spatial characteristics of the coordinated increase in annual TP from northern to southern of the YDM, which is valid for all years. They coincide with the contour map of the average annual precipitation released by the Ministry of Water Resources (Bureau of Hydrology, Ministry of Water Resources and Nanjing Hydraulic Research Institute, 2006). A similar spatial distribution of average annual precipitation was obtained using TRMM 3B43 (Cao et al., 2018). Compared with annual MDP, the extrema of annual TP are more obviously concentrated in a certain small area. The maxima gather in the southern part and most minima are crowded into the northern part. The annual summary consolidates the spatial features and eliminates the randomness of daily precipitation.
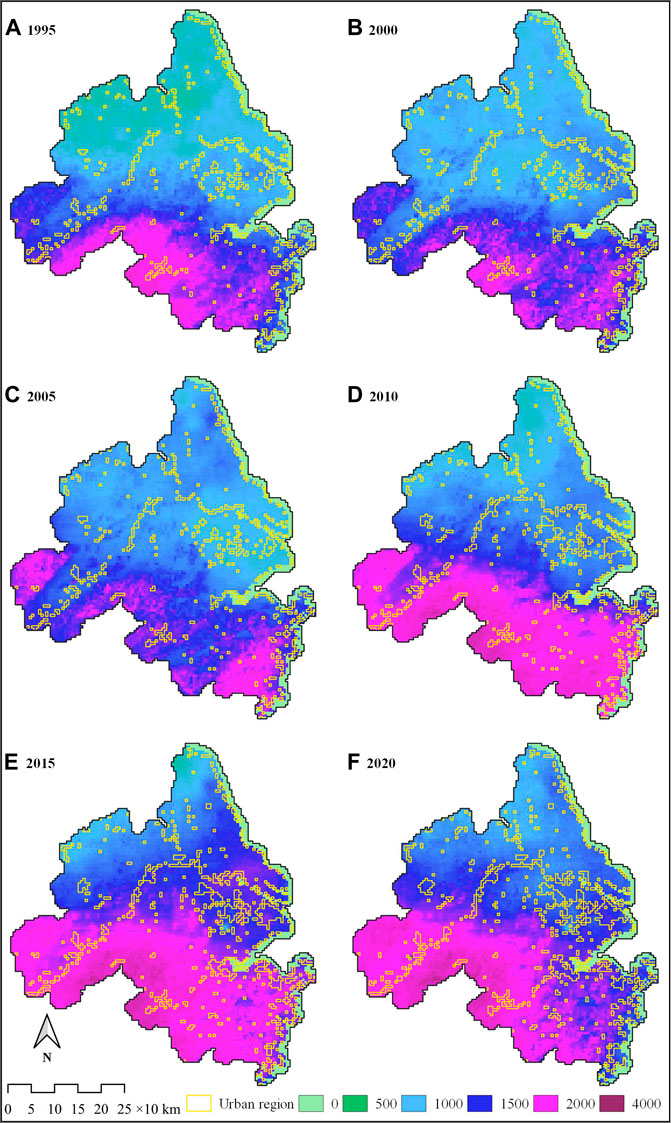
FIGURE 10. The distribution of annual TP in the YDM at quinquennial intervals from 1995 to 2020.
The five quantiles of the annual TP increase to varying degrees in both the urban and non-urban regions, as shown in Figures 9A–E. A significant rising trend is observed of the MK values of the lower, median, and upper quartiles of annual TP in both urban and non-urban regions. Except for the upper quartile in rural areas, the other five time series have a confidence level of 99.9% (Table 4). Of the 10 years averages, all sampling grids in YDM have witnessed the growth of TP from the 1990s to the 2010s (Figure 10). The observed rising trend in the annual TP in the YDM region reveals that regional water resources are more abundant in the 2010s than in the 1990s, as stated in China’s “National Assessment Report on Climate Change” (Lin et al., 2006). The significant increase in the amount of water resources in the YDM region will aid in resolving the contradictions between rapid economic development and rising water demands from industrial production, domestic water and ecological water requirements in urban areas, and rainfed agriculture water needs in non-urban areas.
The line charts fluctuate similarly in the five quantiles of annual TP in the urban and non-urban regions (Figures 9A–E). They are highly correlated and have a good fit with PCC and KGE of the middle three quartiles that are greater than or equal to 0.960 and 0.809, respectively (Table 5). Combined with the increasing trend, high correlation, and good agreement between urban and non-urban regions, climate change has impacted these features in the YDM.
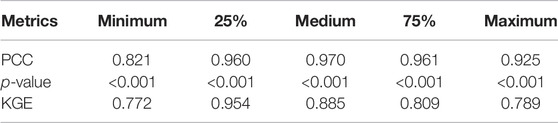
TABLE 5. Correlation and fitting of the annual TP in different percentiles between urban and non-urban regions of the YDM during 1992–2020.
The box plot’s interdecadal changes reveal that yearly TP in urban and non-urban areas grows from the 1990s to the 2010s, after remaining relatively consistent during the 1990s and 2000s (Figure 9F). Except for the lowest percentile, the non-urban percentiles of the annual TP are greater than the urban percentiles. Using the median as an example, from 1990 to 2010, the decadal averages of annual TP in urban and non-urban regions grows from 1,214.39 mm and 1,251.09 mm to 1,379.18 mm and 1,456.61 mm, with increases of 13.57 and 16.43%, respectively. MK values of the 25th percentile, median, and 75th percentile of annual TP in the non-urban region are greater than those in the urban region. This is similar to the annual MDP with a slightly smaller difference between urban and non-urban regions. The non-urban region, with woods, rainfed croplands, and grassland as the primary land uses of precipitationsheds, is more likely to provide more favorable formation conditions for large-scale precipitation than the urban region.
This study provides a statistical method using grid-based precipitation characteristics to demonstrate a novel approach of dynamic sampling area to effectively address the limited representative space of ground precipitation sites in dynamic urban areas. The temporal and spatial inconsistency of static sampling, which is caused by urban growth, has effectively been addressed by this novel approach resulting in figures which are based on hundreds of thousands of sampling grids. In non-urban areas, the density of their fundamental data has surpassed the WMO suggested density, while in urban areas, it is very close to the required value (World Meteorological Organization, 2008a; Chacon-Hurtado et al., 2017). The statistics gathered by the newly created approach in this study are more in line with the requirements of large samples for statistical analysis as compared to traditional site-based research. What’s more, this method is flexible in the sense that the resolution of the reanalyzed product can be adjusted according to requirements.
Applying the foregoing methodologies for the analysis of precipitation features and trends in the YDM region revealed that:
(i) In the context of the large-sample strategy, the spatiotemporal changes of the sampling cells interfere with the limited extrema and have little effect on the laws within the interquartile ranges in the YDM.
(ii) The annual TP and MDP in the YDM region’s urban and non-urban areas both show a considerable upward trend, mainly due to climate change. They demonstrate that the region’s water supplies are expanding and that the risk of urban waterlogging is increasing.
(iii) Most maxima of annual MDP and TP are located in the south of YDM, while the minima are located in the north. Geographical differences affect the spatial distribution characteristics of precipitation in the YDM.
(iv) The increase in annual MDP and TP in the non-urban regions is greater than in the urban regions. It indicates that the land cover categories woods, grassland, and rainfed agricultural land may play a positive role in the formation of precipitationsheds’ sink zones.
Despite the rapid improvement of precipitation reanalysis products, their spatial and temporal resolution remains a limitation. Both horizontal and temporal resolution of existing products are insufficient for a more precise and accurate analysis of precipitation characteristics in urban areas.
To improve the current study, future work should concentrate on the following aspects:
(i) The impact of urbanization on its downwind areas. The contribution of the influence of urbanization at a scale of a megalopolis on precipitation on its downwind areas to the precipitation of non-urban areas needs further investigation.
(ii) Due to a lack of attribution analysis of precipitation change, it is difficult to differentiate between the increase of precipitation in the YDM region which is affected by anthropogenic activities and by global climate change. Therefore, an attribution analysis based on a statistical or deterministic study still needs to be considered in future work.
The binarized land use images with a resolution of 5 km, as well as the extracted time series of percentile statistics in the YDM from 1992 to 2020, are available on Zenodo with a doi of https://doi.org/10.5281/zenodo.6640436 and are free to use and distribute under the CC BY 4.0 license.
Conceptualization, XL; methodology, XL; software, XL; validation, XL; formal analysis, XL; investigation, XL; resources, XL; data curation, XL; writing—original draft preparation, XL and MY; writing—review and editing, CZ, AK, and MY; visualization, XL; supervision, DF and CZ; project administration, DF; funding acquisition, DF and MY. All authors have read and agreed to the published version of the manuscript.
This research was funded by the National Key R&D Program of China (2018YFC0809904) and National Natural Science Foundation of China (51909058).
The authors declare that the research was conducted in the absence of any commercial or financial relationships that could be construed as a potential conflict of interest.
All claims expressed in this article are solely those of the authors and do not necessarily represent those of their affiliated organizations, or those of the publisher, the editors and the reviewers. Any product that may be evaluated in this article, or claim that may be made by its manufacturer, is not guaranteed or endorsed by the publisher.
Many thanks to Python community, Google Earth Engine, and QGIS. Land cover images from 1992 to 2020 in the YDM courtesy of the European Space Agency. The original boundary of the YDM courtesy of OpenStreetMap. Terrain tiles used as background in Figure 1 courtesy of Stamen Design. CHIRPS courtesy of UC Santa Barbara and USAID.
The Supplementary Material for this article can be found online at: https://www.frontiersin.org/articles/10.3389/feart.2022.917069/full#supplementary-material
Akrami, S. A., El-Shafie, A., Naseri, M., and Santos, C. A. G. (2014). Rainfall Data Analyzing Using Moving Average (MA) Model and Wavelet Multi-Resolution Intelligent Model for Noise Evaluation to Improve the Forecasting Accuracy. Neural Comput. Appl. 25 (7), 1853–1861. Dec 1. doi:10.1007/s00521-014-1675-0
Bai, L., Shi, C., Li, L., Yang, Y., and Wu, J. (2018). Accuracy of CHIRPS Satellite-Rainfall Products over Mainland China. Remote Sens. 10 (3), 362. Feb 26. doi:10.3390/rs10030362
Becker, S., Gemmer, M., and Jiang, T. (2006). Spatiotemporal Analysis of Precipitation Trends in the Yangtze River Catchment. Stoch. Environ. Res. Ris. Assess. 20 (6), 435–444. Sep 1. doi:10.1007/s00477-006-0036-7
Bureau of Hydrology, Ministry of Water Resources and Nanjing Hydraulic Research Institute (2006). Atlas of Statistical Parameters of Rainstorm in China. Beijing, CN: China Water Conservancy and Hydropower Press.
Burian, S. J., and Shepherd, J. M. (2005). Effect of Urbanization on the Diurnal Rainfall Pattern in Houston. Hydrol. Process. 19 (5), 1089–1103. Mar 30. doi:10.1002/hyp.5647
Caloiero, T., Coscarelli, R., and Ferrari, E. (2018). Application of the Innovative Trend Analysis Method for the Trend Analysis of Rainfall Anomalies in Southern Italy. Water Resour. Manage 32 (15), 4971–4983. Dec 1. doi:10.1007/s11269-018-2117-z
Cao, Y., Zhang, W., and Wang, W. (2018). Evaluation of TRMM 3B43 Data over the Yangtze River Delta of China. Sci. Rep. 8 (1), 5290. doi:10.1038/s41598-018-23603-z
Central Committee of the Communist Party of China (CPC) (2014). State Council. National New-type Urbanization Plan (2014-2020). [Internet]. Beijing, China: Xinhua News Agency. Available from: http://www.gov.cn/gongbao/content/2014/content_2644805.htm ([cited 2021 Nov 30].
Chacon-Hurtado, J. C., Alfonso, L., and Solomatine, D. P. (2017). Rainfall and Streamflow Sensor Network Design: a Review of Applications, Classification, and a Proposed Framework. Hydrol. Earth Syst. Sci. 21 (6), 3071–3091. Jun 28. doi:10.5194/hess-21-3071-2017
Chen, S., Yin, D., Li, Y., Sun, Y., and Li, C. (2016). Analysis of Differences of Rainfall between Urban and Rural Regions in Nanjing. J. Meteorol. Environ. 32 (6), 27–33. doi:10.3969/j.issn.1673-503X.2016.06.004
Chow, S. D., and Chang, C. (1984). Shanghai Urban Influences on Humidity and Precipitation Distribution. GeoJournal 8 (3), 201–204. Apr 1. doi:10.1007/bf00446468
Copernicus Climate Change Service (2020). “Product User Guide and Specification: ICDR Land Cover 2016 to 2019,”. [Internet]Report No. 2018/C3S_312b_Lot5_VITO/SC1, 38. UCLouvain and Brockmann Consult GMBHAugAvailable from: https://datastore.copernicus-climate.eu/documents/satellite-land-cover/D3.3.12-v1.3_PUGS_ICDR_LC_v2.1.x_PRODUCTS_v1.3.pdf (Accessed April 25, 2019).
Dahmen, E. R., and Hall, M. J. (1990). Screening of Hydrological Data: Tests for Stationarity and Relative Consistency. Wageningen, NL: ILRI publication.
Daniels, E. E., Lenderink, G., Hutjes, R. W. A., and Holtslag, A. A. M. (2016). Observed Urban Effects on Precipitation along the Dutch West Coast. Int. J. Climatol. 36 (4), 2111–2119. Mar 30. doi:10.1002/joc.4458
Defourny, P., Lamarche, C., Bontemps, S., De Maet, T., Van Bogaert, E., Moreau, I., et al. (2017). “Land Cover CCI Product User Guide Version 2.0,”. Report No. CCI-LC_PUGv2, 105. UCLouvain, Brockmann Consult GMBH and Gamma RSAprAvailable at: https://maps.elie.ucl.ac.be/CCI/viewer/download/ESACCI-LC-Ph2-PUGv2_2.0.pdf (Accessed September 14, 2015).
Deng, Z. (2017). On Temporal and Spatial Variation Characteristic of Precipitation in Hefei City from 1963 to 2012. J. Jiangsu Second Norm. Univ. Nat. Sci. 33 (6), 25–29+124. Jun. http://xb.jssnu.edu.cn/
Diem, J. E., and Mote, T. L. (2005). Interepochal Changes in Summer Precipitation in the Southeastern United States: Evidence of Possible Urban Effects Near Atlanta, Georgia. J. Appl. Meteorol. 44 (5), 717–730. May 1. doi:10.1175/jam2221.1
Ding, Y., Ren, G., Shi, G., Gong, P., Zheng, X., Zhai, P., et al. (2006). National Assessment Report of Climate Change (I): Climate Change in China and its Future Trend. Adv. Clim. Change Res. 02 (01), 3–8. doi:10.3969/j.issn.1673-1719.2007.z1.001
Ding, Y. (2018). Impact of Climate Change and Urbanization on Extreme Rainstorms in China’s Megacities. China Flood Drought Manag. 28 (02), 1–2. http://www.cfdm.cn
Du, J., and Chen, J. (2010). The Corner Stone in Facilitating the Transition from Deterministic to Probabilistic Forecasts-Ensemble Forecasting and Its Impact on Numerical Weather Prediction. Meteorol. Mon. 36 (11), 1–11. doi:10.7519/j.issn.1000-0526.2010.11.001
Ellison, D., Morris, C. E., Locatelli, B., Sheil, D., Cohen, J., Murdiyarso, D., et al. (2017). Trees, Forests and Water: Cool Insights for a Hot World. Glob. Environ. Change 43, 51–61. Mar 1. doi:10.1016/j.gloenvcha.2017.01.002
European Space Agency (ESA). ESA CCI Land Cover Website [Internet]. 2021. Available from: http://www.esa-landcover-cci.org/ (Accessed April 8, 2021)
Fang, C. (2019). The Basic Law of the Formation and Expansion in Urban Agglomerations. J. Geogr. Sci. 29 (10), 1699–1712. Oct 1. doi:10.1007/s11442-019-1686-y
Fang, G., Gao, Y., Xu, L., Hu, L., and Zhang, S. (2012). Analysis of Precipitation Change and the Characteristics of Disaster Rainfalls in Shanghai. Resour. Environ. Yangtze Basin 21 (10), 1270–1273. http://yangtzebasin.whlib.ac.cn
Federal Interagency Stream Restoration Working Group (FISRWG) (1989). Stream Corridor Restoration: Principles, Processes, and Practices. [Internet]. Washington, DC, USA: Federal Interagency Stream Restoration Working Group, 637. Available from: https://www.nrcs.usda.gov/wps/portal/nrcs/detailfull/national/water/manage/restoration/?cid=stelprdb1043244 ([cited 2019 Oct 3]).
Fletcher, T. D., Andrieu, H., and Hamel, P. (2013). Understanding, Management and Modelling of Urban Hydrology and its Consequences for Receiving Waters: A State of the Art. Adv. Water Resour. 51, 261–279. doi:10.1016/j.advwatres.2012.09.001
Fu, D., Tang, D., and Levy, G. (2017). The Impacts of 2008 Snowstorm in China on the Ecological Environments in the Northern South China Sea. Geomatics, Nat. Hazards Risk 8 (2), 1034–1053. Dec 15. doi:10.1080/19475705.2017.1292559
Funk, C., Peterson, P., Landsfeld, M., Pedreros, D., Verdin, J., Shukla, S., et al. (2015). The Climate Hazards Infrared Precipitation with Stations-A New Environmental Record for Monitoring Extremes. Sci. Data 2 (1), 150066. Dec 8. doi:10.1038/sdata.2015.66
Gao, F., Liu, H., Yang, J., and Liu, W. (2016). Analysis and Comparison on Plum Rain Characteristics within Yangtze-Huaihe Region and South Jiangsu Area. Water Resour. Hydropower Eng. 47 (09), 1–4+10. doi:10.13928/j.cnki.wrahe.2016.09.001
Goddard Space Flight Center (2012). NASA Satellite Confirms Urban Heat Islands Increase Rainfall Around Cities. [Internet]. Greenbelt, MD: National Aeronautics and Space Administration (NASA). Available from: https://svs.gsfc.nasa.gov/stories/urban_rain_20020618 ([cited 2022 Jan 10].
Gorelick, N., Hancher, M., Dixon, M., Ilyushchenko, S., Thau, D., and Moore, R. (2017). Google Earth Engine: Planetary-Scale Geospatial Analysis for Everyone. Remote Sens. Environ. 202, 18–27. Jul 6. doi:10.1016/j.rse.2017.06.031
Gregorio, A. D., and Jansen, L. J. M. (2000). Land Cover Classification System (LCCS). [Internet]. Rome, Italy: Food and Agriculture Organization of the United Nations. Available from: http://www.fao.org/3/x0596e/x0596e00.htm ([cited 2021 Apr 7]).
Gupta, H. V., Kling, H., Yilmaz, K. K., and Martinez, G. F. (2009). Decomposition of the Mean Squared Error and NSE Performance Criteria: Implications for Improving Hydrological Modelling. J. Hydrol. 377 (1), 80–91. Oct 20. doi:10.1016/j.jhydrol.2009.08.003
Han, L., Xu, Y., Pan, G., Deng, X., Hu, C., Xu, H., et al. (2015a). Changing Properties of Precipitation Extremes in the Urban Areas, Yangtze River Delta, China, during 1957-2013. Nat. Hazards 79 (1), 437–454. Oct 1. doi:10.1007/s11069-015-1850-3
Han, L., Xu, Y., Yang, L., and Deng, X. (2015b). Changing Structure of Precipitation Evolution during 1957-2013 in Yangtze River Delta, China. Stoch. Environ. Res. Risk Assess. 29 (8), 2201–2212. Dec 1. doi:10.1007/s00477-015-1034-4
Hand, L. M., and Shepherd, J. M. (2009). An Investigation of Warm-Season Spatial Rainfall Variability in Oklahoma City: Possible Linkages to Urbanization and Prevailing Wind. J. Appl. Meteorol. Climatol. 48 (2), 251–269. Feb 1. doi:10.1175/2008jamc2036.1
He, B., Chen, C., Zhou, N., and Xu, S. (2003). Urbanized Area Runoff Coefficient and its Application. Shanghai Environ. Sci. 22 (7), 472–475. https://mall.cnki.net/magazine/magalist/SHHJ.htm
Hu, H. (2015). Spatiotemporal Characteristics of Rainstorm-Induced Hazards Modified by Urbanization in Beijing. J. Appl. Meteorol. Climatol. 54 (7), 1496–1509. Jul 1. doi:10.1175/jamc-d-14-0267.1
Huang, L., Zhao, D., Wang, J., Zhu, J., and Li, J. (2008). Scale Impacts of Land Cover and Vegetation Corridors on Urban Thermal Behavior in Nanjing, China. Theor. Appl. Climatol. 94 (3–4), 241–257. doi:10.1007/s00704-007-0359-4
Huang, Q., and Lu, Y. (2015). The Effect of Urban Heat Island on Climate Warming in the Yangtze River Delta Urban Agglomeration in China. Ijerph 12 (8), 8773–8789. Aug. doi:10.3390/ijerph120808773
Huff, F. A. (1975). Urban Effects on the Distribution of Heavy Convective Rainfall. Water Resour. Res. 11 (6), 889–896. Dec. doi:10.1029/wr011i006p00889
Hussain, M., and Mahmud, I. (2019). pyMannKendall: a python Package for Non Parametric Mann Kendall Family of Trend Tests. Joss 4 (39), 1556. Jul 25. doi:10.21105/joss.01556
Jiang, X., Luo, Y., Zhang, D.-L., and Wu, M. (2020). Urbanization Enhanced Summertime Extreme Hourly Precipitation over the Yangtze River Delta. J. Clim. 33 (13), 5809–5826. Jul 1. doi:10.1175/jcli-d-19-0884.1
Keys, P. W., van der Ent, R. J., Gordon, L. J., Hoff, H., Nikoli, R., and Savenije, H. H. G. (2012). Analyzing Precipitationsheds to Understand the Vulnerability of Rainfall Dependent Regions. Biogeosciences 9 (2), 733–746. Feb 10. doi:10.5194/bg-9-733-2012
Kishtawal, C. M., Niyogi, D., Tewari, M., Pielke, R. A., and Shepherd, J. M. (2010). Urbanization Signature in the Observed Heavy Rainfall Climatology over India. Int. J. Climatol. 30 (13), 1908–1916. Nov 15. doi:10.1002/joc.2044
Kling, H., Fuchs, M., and Paulin, M. (2012). Runoff Conditions in the Upper Danube Basin under an Ensemble of Climate Change Scenarios. J. Hydrology 424-425, 264–277. Mar 6. doi:10.1016/j.jhydrol.2012.01.011
Li, J., Wang, W., Che, W., Liu, C., and Zhao, Y. (2015). Explanation of Sponge City Development Technical Guide: Regional Division for Total Rainfall Runoff Volume Capture Target. China Water Wastewater 31 (8), 6–12. doi:10.19853/j.zgjsps.1000-4602.2015.08.002
Liang, P., and Ding, Y. (2017). The Long-Term Variation of Extreme Heavy Precipitation and its Link to Urbanization Effects in Shanghai during 1916-2014. Adv. Atmos. Sci. 34 (3), 321–334. Mar 1. doi:10.1007/s00376-016-6120-0
Lin, E., Xu, Y., Jiang, J., Li, Y., Yang, X., Zhang, J., et al. (2006). National Assessment Report of Climate Change (Ⅱ): Climate Change Impacts and Adaptation. Adv. Clim. Change Res. 02 (02), 51–56. Mar 30. doi:10.3969/j.issn.1673-1719.2006.02.001
Liu, A., Wang, H., Cui, Y., Shen, L., Yin, Y., Wu, Z., et al. (2020). Characteristics of Aerosol during a Severe Haze-Fog Episode in the Yangtze River Delta: Particle Size Distribution, Chemical Composition, and Optical Properties. Atmosphere 11 (1), 56. Jan. doi:10.3390/atmos11010056
Liu, X., Fu, D., Zevenbergen, C., Busker, T., and Yu, M. (2021). Assessing Sponge Cities Performance at City Scale Using Remotely Sensed LULC Changes: Case Study Nanjing. Remote Sens. 13 (4), 580. doi:10.3390/rs13040580
Lu, M., Xu, Y., Shan, N., Wang, Q., Yuan, J., and Wang, J. (2019). Effect of Urbanisation on Extreme Precipitation Based on Nonstationary Models in the Yangtze River Delta Metropolitan Region. Sci. Total Environ. 673, 64–73. Jul 10. doi:10.1016/j.scitotenv.2019.03.413
Luo, M., and Lau, N. C. (2019). Urban Expansion and Drying Climate in an Urban Agglomeration of East China. Geophys. Res. Lett. 46 (12), 6868–6877. doi:10.1029/2019gl082736
Luo, X., Yang, B., Zhang, Y., Wang, C., and Yao, Y. (2020). Distribution Characteristics of Minute Rainfall Rate in Anhui Province. Chin. J. Radio Sci. 35 (6), 908–913. doi:10.13443/j.cjors.2020103001
IPCC (2021b). “Summary for Policymakers. [Internet] in Climate Change 2021: The Physical Science Basis Contribution of Working Group I to the Sixth Assessment Report of the Intergovernmental Panel on Climate Change. Editors V. Masson-Delmotte, P. Zhai, A. Pirani, S. L. Connors, C. Péan, S. Bergeret al. (Cambridge, United Kingdom and New York, NY, USA: Cambridge University Press). Available from: https://www.ipcc.ch/report/sixth-assessment-report-working-group-i/.
IPCC (2013a). [Internet] Editors T. F. Stocker, D. Qin, G-K. Plattner, M. M. B. Tignor, S. K. Allen, J. Boschunget al. (Cambridge, United Kingdom and New York, NY: Cambridge University Press), 1535. Available from: https://www.ipcc.ch/report/ar5/wg1/.Climate Change 2013: The Physical Science Basis.
Meng, Q., Fan, S., He, J., Zhang, J., Sun, Y., Zhang, Y., et al. (2015). Particle Size Distribution and Characteristics of Polycyclic Aromatic Hydrocarbons during a Heavy Haze Episode in Nanjing, China. Particuology 18, 127–134. Feb 1. doi:10.1016/j.partic.2014.03.010
Ministry of Water Resources of the People’s Republic of China (MWR) (2021). Bulletin of Flood and Drought Disaster in China. [Internet]. Beijing, CN: China Water Power Press. Available from: http://www.mwr.gov.cn/sj/.
National Development and Reform Commission (NDRC) (2013). Ministry of Finance (MOF) Ministry of Housing and Urban-Rural Development (MOHURD) Ministry of Transport (MOT) Ministry of Water Resources (MWR) Ministry of Agriculture (MOA). [Internet]Report No. FGQH-2013-2252. Beijing, CN: National Strategy for Climate Change Adaptation. Available from: https://www.ndrc.gov.cn/xxgk/zcfb/tz/201312/t20131209_963985.html?code=&state=123 ([cited 2021 Nov 24]Accessed Nov 24, 2021).
National Development and Reform Commission of the People’s Republic of China (NDRC) (2016). Ministry of Housing and Urban-Rural Development of the People’s Republic of China (MOHURD) The Plan for the Development of the Yangtze Delta Megalopolis [Internet]. Beijing 57. Report No.: FGGH-2016-1176. Available from: https://www.ndrc.gov.cn/xxgk/zcfb/ghwb/201606/t20160603_962187.html (Aceessed Jun).
Paul, S., Ghosh, S., Mathew, M., Devanand, A., Karmakar, S., and Niyogi, D. (2018). Increased Spatial Variability and Intensification of Extreme Monsoon Rainfall Due to Urbanization. Sci. Rep. 8 (1), 3918. Mar 2. doi:10.1038/s41598-018-22322-9
Pei, F., Wu, C., Liu, X., Hu, Z., Xia, Y., Liu, L.-A., et al. (2018). Detection and Attribution of Extreme Precipitation Changes from 1961 to 2012 in the Yangtze River Delta in China. CATENA 169, 183–194. Oct 1. doi:10.1016/j.catena.2018.05.038
Potsdam Institute for Climate Impact Research and Climate Analytics (2013). Turn Down the Heat: Climate Extremes, Regional Impacts and the Case for Resilience. [Internet]. Washington, DC, USA: World Bank. Available from: http://hdl.handle.net/10986/14000.
Research Council, National (2008). Urban Stormwater Management in the United States. Washington, DC, USA: National Research Council, 1–529.
Sang, Y.-F., Wang, Z., Li, Z., Liu, C., and Liu, X. (2013). Investigation into the Daily Precipitation Variability in the Yangtze River Delta, China. Hydrol. Process. 27 (2), 175–185. doi:10.1002/hyp.9202
Schueler, T. R. (1995). The Importance of Imperviousness. Watershed Prot. Tech. 1 (3), 100–111. https://owl.cwp.org/mdocs-posts/elc_pwp1/
Şen, Z. (2014). Trend Identification Simulation and Application. J. Hydrol. Eng. 19 (3), 635–642. doi:10.1061/(ASCE)HE.1943-5584.0000811
Shepherd, J. M. (2005). A Review of Current Investigations of Urban-Induced Rainfall and Recommendations for the Future. Earth Interact. 9 (12), 1–27. Jul 1. doi:10.1175/ei156.1
Stensrud, D. J., and Yussouf, N. (2007). Reliable Probabilistic Quantitative Precipitation Forecasts from a Short-Range Ensemble Forecasting System. Weather Forecast 22 (1), 3–17. Feb 1. doi:10.1175/waf968.1
Su, J., Zhang, W., Song, J., and Xu, A. (2021). Study on Spatio-Temporal Distribution of Hourly Precipitation in Yunnan Province. Meteorol. Mon. 47 (02), 133–142. doi:10.7519/j.issn.1000-0526.2021.02.001
Tang, X., Zhang, J., Wang, G., Yang, Q., Yang, Y., Guan, T., et al. (2019). Evaluating Suitability of Multiple Precipitation Products for the Lancang River Basin. Chin. Geogr. Sci. 29 (1), 37–57. Feb 1. doi:10.1007/s11769-019-1015-5
Taylor, R. (1990). Interpretation of the Correlation Coefficient: A Basic Review. J. Diagnostic Med. Sonogr. 6 (1), 35–39. Jan 1. doi:10.1177/875647939000600106
Terrain Classic Contributors (2021). China: Yangtze Delta Megalopolis. 119°56′15.84″E, 31°07′0795″N, zoom level 8. Map tiles by Stamen Design, under CC BY 3.0. Data by OpenStreetMap, under ODbL. [Internet]. Available from: https://github.com/stamen/terrain-classic ([cited 2021 Dec 8].
The State Council Information Office of the People’s Republic of China (2008). Responding to Climate Change: China’s Policies and Actions. [Internet]. Beijing, China: Xinhua News Agency. Available from: http://www.gov.cn/zwgk/2008-10/29/content_1134378.htm ([cited 2021 Oct 28].
Virtanen, P., Gommers, R., Oliphant, T. E., Haberland, M., Reddy, T., Cournapeau, D., et al. (2020). SciPy 1.0: Fundamental Algorithms for Scientific Computing in Python. Nat. Methods 17 (3), 261–272. Mar. doi:10.1038/s41592-019-0686-2
Wang, J., Wang, J., Wei, C., Hua, Z., Xu, Y., and Yin, P. (2015). Study on Urban Rainwater Utilization Modes in Jiangsu Province. China Water Resour. 15, 31–33+40. doi:10.3969/j.issn.1000-1123.2015.15.011
Wang, J., Chen, F., Doan, Q.-V., and Xu, Y. (2021). Exploring the Effect of Urbanization on Hourly Extreme Rainfall over Yangtze River Delta of China. Urban Clim. 36, 100781. Mar 1. doi:10.1016/j.uclim.2021.100781
Wang, W., Hu, B., Teng, W., and Zhuang, X. (2003). Analysis of Main Meteorological Conditions and Characteristics of Summer Drought in Zhejiang Province. J. Zhejiang Meteorol. 24 (1), 21–25. doi:10.3969/j.issn.1004-5953.2003.01.006
Wang, Y., Xu, Y., Lei, C., Li, G., Han, L., Song, S., et al. (2016). Spatio-temporal Characteristics of Precipitation and Dryness/wetness in Yangtze River Delta, Eastern China, during 1960-2012. Atmos. Res. 172-173, 196–205. May 15. doi:10.1016/j.atmosres.2016.01.008
Wang, Y., Xu, Y., Tabari, H., Wang, J., Wang, Q., Song, S., et al. (2020). Innovative Trend Analysis of Annual and Seasonal Rainfall in the Yangtze River Delta, Eastern China. Atmos. Res. 231, 104673. Jan 1. doi:10.1016/j.atmosres.2019.104673
Westra, S., Alexander, L. V., and Zwiers, F. W. (2013). Global Increasing Trends in Annual Maximum Daily Precipitation. J. Clim. 26 (11), 3904–3918. Jun 1. doi:10.1175/jcli-d-12-00502.1
World Meteorological Organization (2008a). “Data Processing and Quality Control,”. [Internet] in Guide to Hydrological Practices: Hydrology - from Measurement to Hydrological Information. 6th ed. (Geneva, Switzerland: WMO), 1. Available from: http://www.whycos.org/hwrp/guide/index.php.
World Meteorological Organization (2008b). “Methods of Observation,”. [Internet] in Guide to Hydrological Practices: Hydrology - from Measurement to Hydrological Information. 6th ed. (Geneva, Switzerland: WMO), 1. Available from: http://www.whycos.org/hwrp/guide/index.php.
Xu, T., Liu, K., Shan, Y., and He, S. (2019). Flood Situation Analysis and Strategy Research on Hangjiahu Area. China Rural. Water Hydropower (02), 123–125. doi:10.3969/j.issn.1007-2284.2019.02.025
Xu, Z., Ren, M., Cheng, T., and Chen, H. (2020). Managing Urban Floods: the Urban Water Cycle Is the Foundation; the Unified Management of River Basins Is the Fundamental. China Flood Drought Manag. 30 (04), 20–24. doi:10.16867/j.issn.1673-9264.2019119
Yang, M.-n., Xu, Y.-p., Pan, G.-b., and Han, L.-f. (2014). Impacts of Urbanization on Precipitation in Taihu Lake Basin, China. J. Hydrol. Eng. 19 (4), 739–746. Apr 1. doi:10.1061/(asce)he.1943-5584.0000852
Yu, M., Li, Q., Hayes, M. J., Svoboda, M. D., and Heim, R. R. (2014). Are Droughts Becoming More Frequent or Severe in China Based on the Standardized Precipitation Evapotranspiration Index: 1951-2010? Int. J. Climatol. 34, 545–558. doi:10.1002/joc.3701
Yu, R., Zhou, T., Xiong, A., Zhu, Y., and Li, J. (2007). Diurnal Variations of Summer Precipitation over Contiguous China. Geophys. Res. Lett. 34. Jan 1Available from. doi:10.1029/2006GL028129
Yu, X., Gu, X., Kong, D., Zhang, Q., Cao, Q., Slater, L. J., et al. (2022). Asymmetrical Shift Toward Less Light and More Heavy Precipitation in an Urban Agglomeration of East China: Intensification by Urbanization. Geophys Res. Lett. 49 (4), e2021GL097046. doi:10.1029/2021gl097046
Yu, Z., Chen, L., Li, L., Zhang, T., Yuan, L., Liu, R., et al. (2021). Spatiotemporal Characterization of the Urban Expansion Patterns in the Yangtze River Delta Region. Remote Sens. 13 (21), 4484. Jan. doi:10.3390/rs13214484
Yue, S., and Wang, C. (2004). The Mann-Kendall Test Modified by Effective Sample Size to Detect Trend in Serially Correlated Hydrological Series. Water Resour. Manag. 18 (3), 201–218. Jun 1. doi:10.1023/b:warm.0000043140.61082.60
Zhang, J., Song, X., Wang, G., He, R., and Wang, X. (2014). Development and Challenges of Urban Hydrology in a Changing Environment: Ⅰ: Hydrological Response to Urbanization. Adv. Water Sci. 25 (04), 594–605. doi:10.14042/j.cnki.32.1309.2014.04.020
Zhang, J., Zhou, T., and Jin, J. (2022). What Can the Water Sector Do to Achieve China’s Dual Carbon Target. Hydro-Sci Eng. (1), 1–8. doi:10.12170/20210927006
Zhang, K., Che, W., Zhang, W., and Zhao, Y. (2016). Discussion about Initial Runoff and Volume Capture Ratio of Annual Rainfall. Water Sci. Technol. 74 (8), 1764–1772. doi:10.2166/wst.2016.307
Zhang, Y., Ning, G., Chen, S., and Yang, Y. (2021). Impact of Rapid Urban Sprawl on the Local Meteorological Observational Environment Based on Remote Sensing Images and GIS Technology. Remote Sens. 13 (13), 2624. Jan. doi:10.3390/rs13132624
Zhao, A., Zhu, X., Shi, P., and Pan, Y. (2013). Review on Hydrological Response to Urbanization at Home and Abroad. J. China Hydrol. 33 (05), 16–22. doi:10.3969/j.issn.1000-0852.2013.05.004
Keywords: trend analysis, urbanization, land use change, statistical dynamic sampling, precipitation, climate change, Yangtze Delta megalopolis
Citation: Liu X, Fu D, Zevenbergen C, Yu M and Kumar AJ (2022) Precipitation Trends Analysis Using Gridded Dynamic Sampling Zones: Case Study Yangtze Delta Megalopolis. Front. Earth Sci. 10:917069. doi: 10.3389/feart.2022.917069
Received: 10 April 2022; Accepted: 13 June 2022;
Published: 04 July 2022.
Edited by:
Sanjeev Kumar Jha, Indian Institute of Science Education and Research, Bhopal, IndiaCopyright © 2022 Liu, Fu, Zevenbergen, Yu and Kumar. This is an open-access article distributed under the terms of the Creative Commons Attribution License (CC BY). The use, distribution or reproduction in other forums is permitted, provided the original author(s) and the copyright owner(s) are credited and that the original publication in this journal is cited, in accordance with accepted academic practice. No use, distribution or reproduction is permitted which does not comply with these terms.
*Correspondence: Dafang Fu, ZmRmQHNldS5lZHUuY24=; Chris Zevenbergen, Yy56ZXZlbmJlcmdlbkB1bi1paGUub3Jn
Disclaimer: All claims expressed in this article are solely those of the authors and do not necessarily represent those of their affiliated organizations, or those of the publisher, the editors and the reviewers. Any product that may be evaluated in this article or claim that may be made by its manufacturer is not guaranteed or endorsed by the publisher.
Research integrity at Frontiers
Learn more about the work of our research integrity team to safeguard the quality of each article we publish.