 Wen Xu1
 Guoqiao Yang
 Ang Li
95% of researchers rate our articles as excellent or good
Learn more about the work of our research integrity team to safeguard the quality of each article we publish.
Find out more
ORIGINAL RESEARCH article
Front. Earth Sci. , 13 June 2022
Sec. Structural Geology and Tectonics
Volume 10 - 2022 | https://doi.org/10.3389/feart.2022.916326
This article is part of the Research Topic Quantitative Characterization and Engineering Application of Pores and Fractures of Different Scales in Unconventional Reservoirs View all 24 articles
In order to determine the optimum lithofacies for continental shale, the reservoir characteristics of different lithofacies types were studied based on a series of experiments. The lacustrine organic-rich shale of the Shahezi Formation is divided into siliceous (ORS), argillaceous (ORA), calcareous (ORC), and mixed (ORM) shales. The ORS, ORA, ORC, and ORM shales all carried out comprehensive reservoir comparative analysis. The results showed that the moderate content of clay minerals (45%) can significantly improve porosity, and high and low clay mineral contents are not conducive to the improvement of porosity. The ORM shale tends to have better pore connectivity than the ORS and ORA shales, and the ORC shale has the poorest pore-throat connectivity in micron-size. Internal pores in bitumen and clay shrinkage cracks are the dominant pore type and are well developed in ORS and ORM shales. The two types of pores are less developed in the ORA shale; however, dissolution pores are better developed than those of ORS and ORM shales. Inorganic pores are well-developed in the ORC shale, but organic pores are not. Organic and inorganic pores tend to be better connected in the ORM shale than those of the other three types, which could help improve the gas storage capacity. The ORM shale may have more irregular surfaces and lower liquid/gas surface tension. The higher capillary condensation on pore surfaces is more likely to occur in the ORA shale. The ORS shale offers fewer adsorption sites for CH4 and has lower adsorption capacity. The ORC shale has weak heterogeneity of the pore structure. Therefore, the ORM shale may be the most favorable lithofacies for shale gas enrichment and development, which has high porosity, good pore connectivity, moderate brittleness, and strong gas adsorption and storage capacity, followed by the ORS and ORA shales. The ORC shale is the worst.
Shale gas is commercially exploited in both China and North America. The shale in China can be divided into three types: marine, transitional, and continental. Only the Paleozoic marine shale realized commercial exploitation of shale gas in the Sichuan Basin (Zou et al., 2010; Zhao et al., 2020; Li, 2021). However, continental shale gas has not made a major breakthrough for a long time, especially because of its strong heterogeneity; shale lithofacies is very different. Current research on shale gas mostly focuses on marine shale and lacks research reports on terrestrial shale.
Generally, the determination of favorable intervals is crucial and can directly affect the effect of further exploration and development of shale gas. At present, total organic carbon (TOC), thermal evolution, development of organic pores, brittleness index, gas content, preservation conditions, and burial depth are often considered the main factors for evaluating the favorable area of marine shale gas (Zhao et al., 2016). However, compared with marine shale, the mineral composition and sedimentary laminae of terrestrial shale are more complex. Multiple sources in different directions in the same lake basin at the same time and lateral migration of the depositional center in different periods lead to frequent intercalation and rapid change of the shale lithofacies. Different shale lithofacies have different pore structure characteristics, which can affect both the gas storage capacity and even further shale gas development (Wang and Carr, 2012; Nie et al., 2020). Therefore, understanding the reservoir characteristics of different types of lithofacies can provide significant guidance for evaluating and selecting favorable intervals.
A lot of studies have carried out lithofacies characteristics analysis for marine shale. Hu et al. (2019) found that lithofacies controls many reservoir parameters, such as the total organic carbon (TOC), porosity, pore size, shape, and volume. The siliceous and high TOC-mixed lithofacies are thought to be the best for shale gas exploration and development. Wang et al. (2017) analyzed the effects of shale lithofacies on the pore structure for the Niutitang shale. They found that the organic-rich siliceous shale has a strong gas storage capacity with a large pore surface area; however, the organic-poor calcareous shale has unsatisfied gas storage capacity with a poor pore volume and surface area. Wu et al. (2016) established that the favorable shale lithofacies of the Wufeng–Longmaxi Formation are mixed siliceous shale lithofacies and clay-rich siliceous shale lithofacies. Tang et al. (2016) indicated that the organic-rich argillaceous shale shows a strong methane adsorption capacity, and organic-rich siliceous shale generally has high gas desorption content in situ. Compared to the marine shale lithofacies, the proportion of the siliceous shale is lower and that of the argillaceous shale is higher for the continental shale lithofacies (Chen L. et al., 2016). The sedimentary environments and sediment provenances may affect the pore structure characteristics. However, there are few studies that investigated detailed reservoir characteristics of different lithofacies types for continental shale and their impact on shale gas enrichment.
Paleoclimate and provenance have an important influence on terrestrial shale deposition (Wang et al., 2020; Lin et al., 2021). The organic matter abundance, mineral composition, and scale of lamination are three primarily considered parameters to classify the lithofacies of terrestrial shale (Chen S. Y. et al., 2016; Liu et al., 2018; Yin and Wu, 2020). TOC determines the material basis for gas formation and also provides storage space. Mineral composition has an important influence on shale gas storage capacity and brittleness. The laminae are an important factor affecting the pore structure of terrestrial shales and can increase the heterogeneity of lithofacies (Chalmers et al., 2012; Mathia et al., 2016; Liang et al., 2018). However, the laminae in lacustrine shales are difficult to identify and predict based on conventional logging data in the well with no cores. A specific sedimentary environment has specific mineral composition and sedimentary structure. Therefore, due to the data limitations and the difficulties of lamina identification in the actual application process for production well, only the TOC and mineral composition were considered as the basis for the division of lithofacies in this research.
The Songliao Basin is an important petroliferous basin with abundant continental shale gas resources and is one of the basins most likely to achieve commercial exploitation of continental shale gas. In recent years, the Shahezi Formation has attracted extensive attention from researchers because of its developing thick organic-rich shale with high gas content. Gao et al. (2018) have studied the shale reservoir characteristics of the Shahezi Formation and discussed controlling factors of the pore structure; however, the comparison of pore structure characteristics for different lithofacies types is insufficient, and further analysis is needed to provide guidance for the optimization of intervals and target areas. In this study, a series of reservoir testing and analysis were carried out on shale core samples of the Shahezi Formation in the fault depression of the southern Songliao Basin. The reservoir characteristics of different shale lithofacies types were compared, and the most favorable lithofacies type is determined, which could provide an important reference for selecting favorable intervals.
The Songliao Basin, located in northeast China, is one of the largest continental petroliferous basins with a large Mesozoic–Cenozoic deposition (Shu et al., 2003). The Songliao Basin can be divided into the north depression, the northeast uplift, the west slope, the central depression, the south uplift, the southwest uplift, and the south depression (Figure 1C). The Changling Fault Depression is located in the middle and south of the central fault depression area and is the largest fault basin in the south of the Songliao Basin (Wang H. et al., 2015; Gao et al., 2018). The Songliao Basin has experienced four tectonic stages, i.e., extensional faulting, subsidence, tectonic inversion, and Cenozoic faulting (Hu et al., 2005; Li et al., 2017). Paleozoic metamorphic, volcanic, and magmatic rocks formed the basement of the basin, which is overlain by Jurassic, Cretaceous, and Cenozoic sedimentary rocks (Wang et al., 2013).
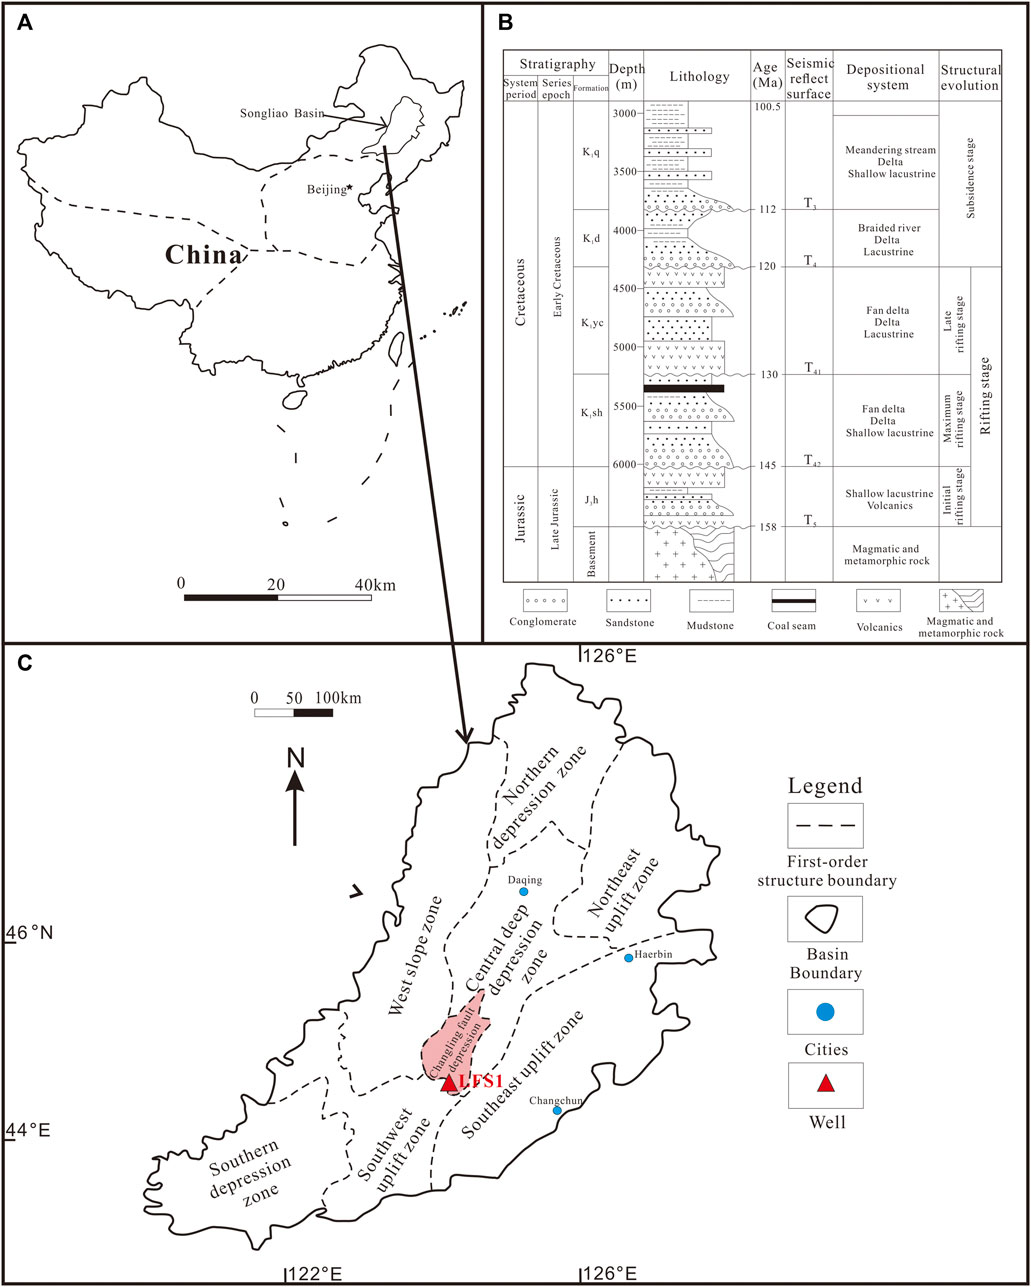
FIGURE 1. (A) Location of the Songliao Basin within China. (B) Stratigraphic column of the Changling Fault Depression. J3h, Huoshiling Formation; K1sh, Shahezi Formation; K1yc, Yingcheng Formation; K1d, Denglouku Formation; and K1q, Quantou Formation (modified after Cai et al., 2017).(C) Location of the Changling Fault Depression and sampling well (modified from Wang M. et al., 2015).
The Cretaceous strata are the main sedimentary cover in the Songliao Basin and can be divided into upper and lower series. The lower Cretaceous strata have great potential for oil and gas exploration and, from the bottom to the top, it developed the Huoshiling, Shahezi, Yingcheng, Denglouku, and Quantou formations (Figure 1B) (Han et al., 2021). The Shahezi Formation and Yingcheng Formation are the main source rocks in the deep petroleum system of the fault depression, which are also the main continental shale gas development layers. The dark shale of the Shahezi Formation in the Longfengshan sag of the Changling Fault Depression is a potential stratum for current exploration and research. The lithology of the Shahezi Formation is mainly black, gray-black mudstone and siltstone, intercalated with gray sandstone and glutenite, and develops thin layers of acid tuff, fused tuff, and tuff breccia at the bottom. The sedimentary facies is mainly shore-shallow lake subfacies.
Continuous shale coring was carried out for the Shahezi Formation in well LFS1 in the south of the Changling Fault Depression, with a total length of 69 m. For this study, 51 lacustrine shale core samples were collected continuously from the bottom to the top in this core section. Each sample was split into several aliquots for different tests. The field gas content, total organic carbon (TOC) content and X-ray diffraction (XRD), and helium porosity were carried out for all samples. Kerogen isolation, maceral component determination, vitrinite reflectance (Ro), and kerogen stable carbon isotope (δ13CP DB) analysis were performed for 11 shale samples. According to the results of TOC and XRD, seven samples were selected for field emission scanning electron microscopy (FE-SEM), low-temperature gas adsorption (CO2 and N2), and the mercury injection capillary pressure (MICP) measurements. Table 1 lists the detailed test items on each shale sample. The samples are selected and numbered from LFS1-1 to LFS1-51, considering the burial depth variation.
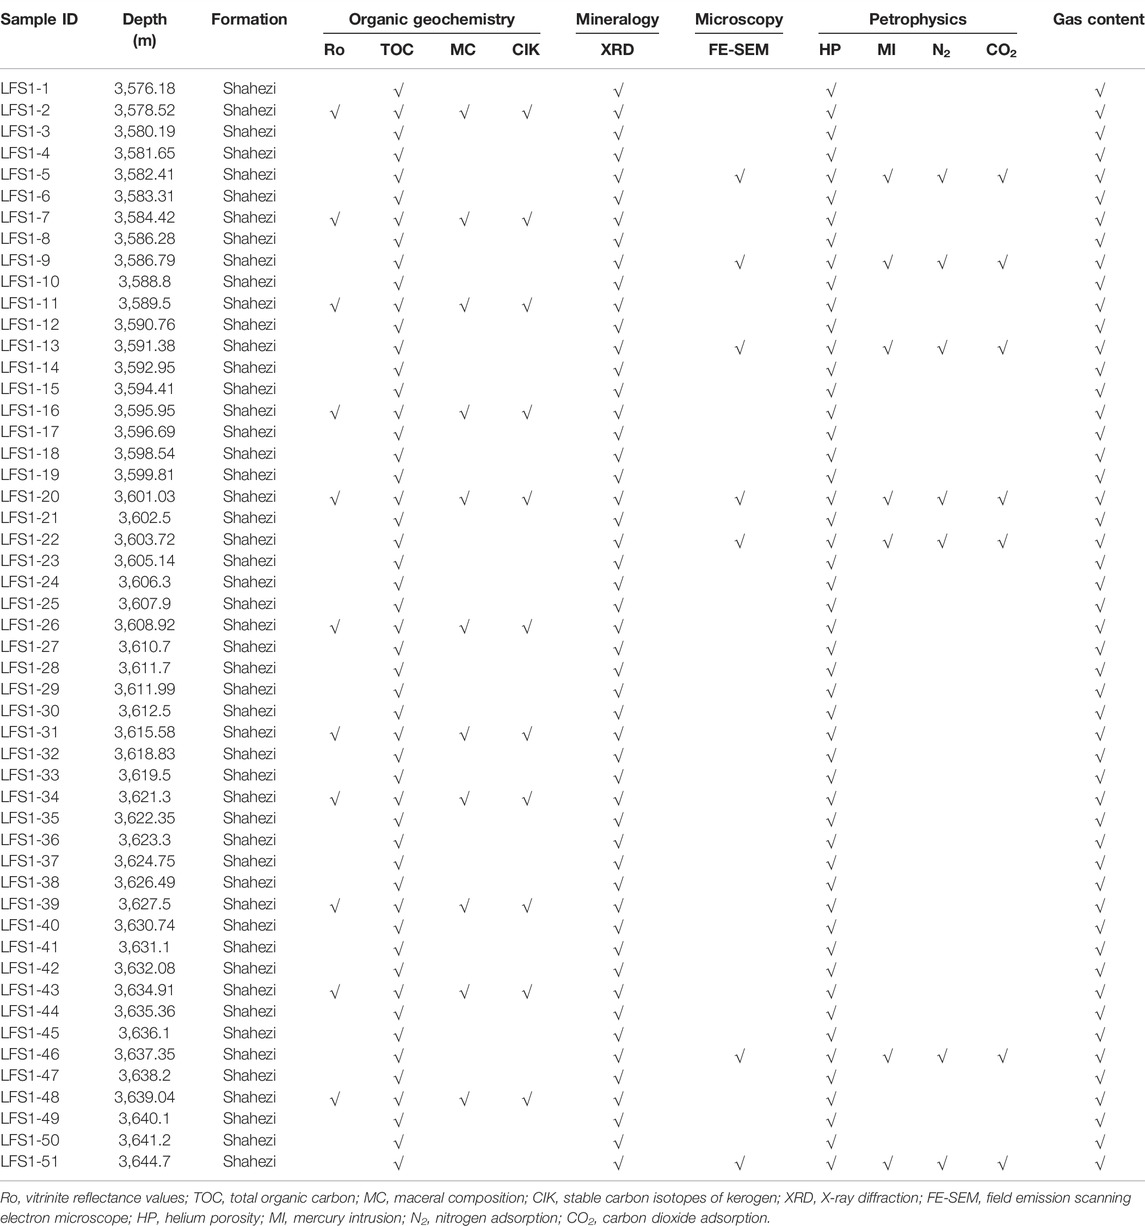
TABLE 1. Measurements for 51 shale samples of the Shahezi Formation of the LFS1 well.
The TOC content was determined using a Leco CS230 carbon/sulfur analyzer, according to GB/T 19145-2003. The shale samples were first ground to a particle diameter less than 200 mesh in size and weighed about 10 g and then dealt with 5% hydrochloric acid at 80°C in a porous crucible for 2 h to remove inorganic carbon. Before combustion, all samples were cleaned with deionized water, neutralized, dried, and reweighed. The TOC content was measured according to Littke (1993).
The maceral compositions are determined based on kerogen isolation which was conducted for all shale samples. The detailed experimental procedure can be found in Dang et al. (2016). Identification of kerogen macerals was conducted using a DM4500P polarizing microscope, according to SY/T5125-2014. The types of kerogen were determined according to the results of maceral composition and stable carbon isotopes of kerogen. The Finnigan DELTA plus V stable isotope mass spectrometer was used to measure the stable carbon isotopes of kerogen, according to GB/T18340.2-2010. The test results were relative to the V-PDB standard (δ13CPDB) with a measurement precision of ±0.5%.
Thermal maturity is commonly evaluated using Ro. Ro was measured with an MSP200 microphotometer, according to SY/T5124-2012. The readings of Ro were obtained with white light by using an oil immersion objective lens (Ma et al., 2021). The final value of Ro for each sample was an average of 40 measurements.
The mineral composition was tested using a Bruker D8 A25 X-ray diffractometer, according to SY/T 5163-2018. The shale samples were ground to a particle diameter of less than 300 mesh. The shale powder was mixed with ethanol and smeared onto glass slides for XRD analysis. The instrument worked at 40 kV and 40 mA with Cu Kα-radiation.
The Helios 650-focused ion beam scanning electron microscopy instrument was used to observe pore types and pore structure visually. FE-SEM has broken through the resolution limit of optical microscopes because of its secondary electronic imaging technique. FE-SEM has a strong three-dimensional imaging sense and is more intuitive in the observation of pore morphology characteristics. The pore surroundings are highlighted in response to secondary electrons which exhibit the pore morphology well (Loucks et al., 2012; Milliken et al., 2013; Wang et al., 2017). The samples were cut into regular shapes of 10 mm × 10 mm × 4 mm and pre-polished using hand sandpaper. Then, the shale samples were polished under vacuum conditions using an ion gun. Generally, the polishing time can last 3–4 h to obtain a high-quality surface, and then, the sample is coated with a 3-nm thick carbon film. The samples were observed in a vacuum.
The effective porosity measurements of shale samples were performed using an Ultrapore-200AH helium porosimeter, according to GB/T 34533-2017. Cylindrical shape samples with a diameter and length of 2.5 cm were drilled from the shale. The cylindrical samples were ground flat at both ends and then placed in an oven and dried at 105°C to a constant weight. The porosity of the samples was determined from the difference between bulk density and skeletal density (Chalmers et al., 2012; Xi et al., 2018a).
N2 and CO2 adsorption experiments were performed using a Micromeritics ASAP 2460 and JWBK-200C analyzer, respectively. The shale samples were crushed to a grain size of 60–80 mesh. Adsorbed moisture and capillary water were removed by drying the shale sample at 200°C for at least 2 h. The dehydrated samples for N2 and CO2 adsorption analysis were vacuum degassed for 24 h at 383.15 K. The experiments of N2 isothermal adsorption and desorption were conducted at 77.35 K and less than 760 mmHg. The isothermal adsorption experiments of CO2 were carried out at 273.15 K. All tests followed the standard of SY/T 6154-2019.
Based on the adsorption branch of the N2 isotherms, the Barrett–Joyner–Halenda (BJH) method and the Brunauer–Emmett–Teller (BET) model were used to obtain the pore size distribution (PSD) of mesopore (2–50 nm) and the specific surface area, respectively (Brunauer et al., 1938; Barrett et al., 1951; Yin et al., 2020b). The density functional theory (DFT) method was used to determine the PSD of micropores (<2 nm) with the CO2 isotherms (Gregg and Sing, 1982).
MICP measurements were performed using an Autopore 9520 microporous structure analyzer, according to GB/T 29171-2012. Shale samples were weighed out to 8–10 g. Before mercury injection, samples were dried in an oven for 24 h at 105°C under vacuum. According to the Washburn equation, a pore size of 6 nm can be detected as the mercury injection pressure in this experiment can reach up to 410 Mpa (Washburn, 1921).
The gas content was tested with a shale gas field desorption apparatus developed by the Wuxi Research Institute of Petroleum Geology, RIPEP, SINOPEC. The test process for 51 shale samples was according to the standard of SY/T 6940-2020. The lost gas, desorbed gas, and residual gas determined the final gas content. The lost gas was speculated with the data on desorption gas volume and desorption time adopted by the United States Bureau of Mines (USBM) method (Diamond and Schatzel, 1998). The desorbed gas and residual gas can be directly measured by sealing shale samples in a desorption canister, and shale samples were crushed when measuring the residual gas content. The experimental process was described in detail in Diamond and Schatzel (1998) and Chen L. et al. (2016).
TOC and Ro are two basic and important evaluation parameters of hydrocarbon generation potential; 51 shale samples were tested for TOC, and 11 of which were tested for thermal maturity at the same time. The TOC content of shale varies from 0.26% to 5.16%, with an average of 2.02%, showing a good hydrocarbon generating material base (Figure 5H). The Ro values of the shale range from 1.48% to 1.67%, with an average of 1.55%. The analysis of the Ro suggests that the shale of the Shahezi Formation evolved into the humid gas and thermal cracking gas window as the organic matter has reached the high maturation stage (Tissot, 1984). The Shahezi Formation was in a high thermodynamic environment due to volcanic thermal events, and thus, the shale reached a high maturity.
Kerogen has three major types: humic (type I), humic-sapropelic mixed (type II), and sapropelic (type III). Kerogen types determine the hydrocarbon generation characteristics, where type I has the strongest ability to generate oil, type III has the strongest ability to generate gas, and type II falls somewhere in between (Batten, 1996; Tang et al., 2019). Two methods are used to determine the types of organic matter, including type index (TI) analysis based on maceral compositions and carbon stable isotope analysis. TI values of 11 shale samples were calculated according to the maceral composition of the kerogen. The calculated TI values for the Shahezi Formation ranged from −37 to 17.5 with an average of −10 (Table 2). The δ13CPDB values of the kerogen of these 11 shale samples ranged from −23.8% to −22.3% with an average of−22.76% (Table 2). The results of carbon stable isotope analysis were consistent with the TI analysis aforementioned, except for four shale samples. In general, the kerogen types of shale samples from the Shahezi Formation were primarily Type II and Type III kerogen and tend to produce gas in the high maturation stage.
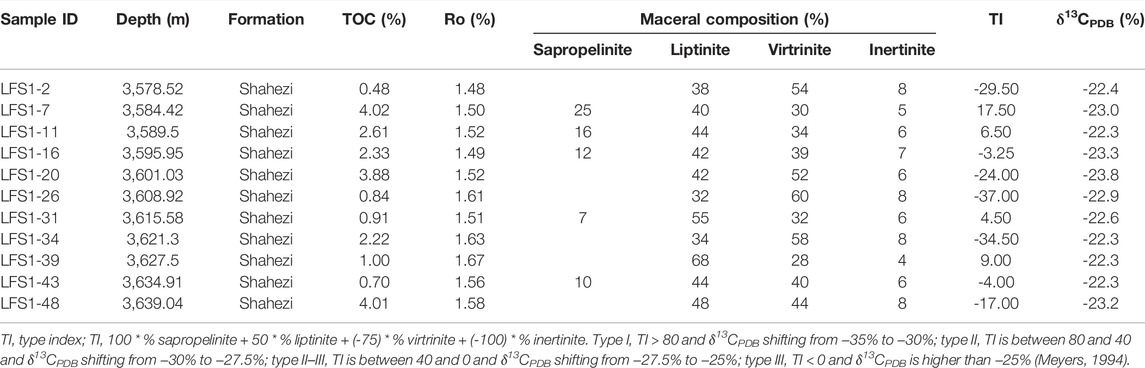
TABLE 2. Geochemical data on shale samples for the Shahezi Formation.
The gas content has an obvious positive correlation with TOC (Figure 5H), indicating the TOC plays an important role in shale gas enrichment. Previous studies have shown that the TOC content of at least 2.0% is necessary for the formation and enrichment of shale gas (Tan et al., 2014; Chen et al., 2015). The TOC content of two-thirds of the shale samples is greater than 2.0%. XRD analysis suggests that the shale of the Shahezi Formation is mainly composed of quartz, clay minerals, feldspar, carbonates (calcite and dolomite), and pyrite. The total content of quartz and feldspar ranged from 13.9% to 55.3%, with an average of 41.7%. The content of clay ranged from 15.3% to 69.8%, with an average of 45.7%. The total content of calcite and dolomite ranged from 0.2% to 63.9%, with an average of 4.0%. The shale of the Shahezi Formation in the study area shows high brittle mineral content. Combined with the mineral composition, the organic-rich shale (TOC>2%) is further classified into four types: organic-rich siliceous (ORS) shale (quartz and feldspar >50%), organic-rich argillaceous (ORA) shale (clay >50%), organic-rich calcareous (ORC) shale (carbonate >50%), and organic-rich mixed (ORM) shale (quartz and feldspar <50%, clay <50%, and carbonate <50%). The results showed that the lithofacies of organic-rich shale samples in the well LFS1 are mostly mixed, followed by siliceous and argillaceous shales and a few calcareous shale samples (Figure 2). For the ORS shale, the total content of quartz and feldspar is between 50% and 75%, the clay content is between 25% and 50%, and the carbonate content is less than 25%. For the ORA shale, the clay content is between 50% and 75%, the total content of quartz and feldspar is between 25% and 50%, and the carbonate content is less than 25%. For the ORC shale, the carbonate content is between 50% and 75%, the clay content is less than 25%, and the total content of quartz and feldspar is less than 25%. For the ORM shale, the total content of quartz and feldspar is between 25% and 50%, the clay content is between 25% and 50%, and the carbonate content is less than 25%. Seven shale samples of different lithofacies types were selected for detailed analysis of reservoir characteristics and to identify favorable lithofacies types. The basic parameters of the seven samples are shown in Table 3.
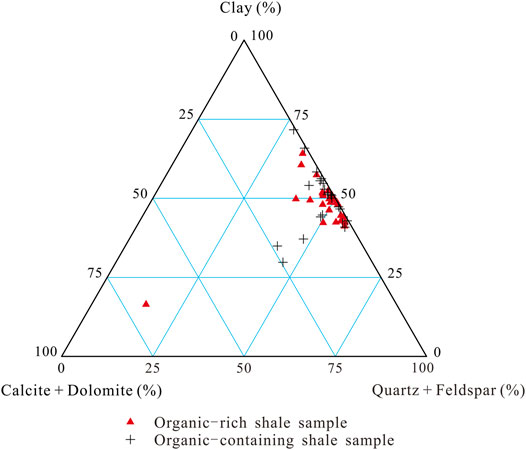
FIGURE 2. Ternary diagram of mineral components for shale samples from the Shahezi Formation based on XRD.
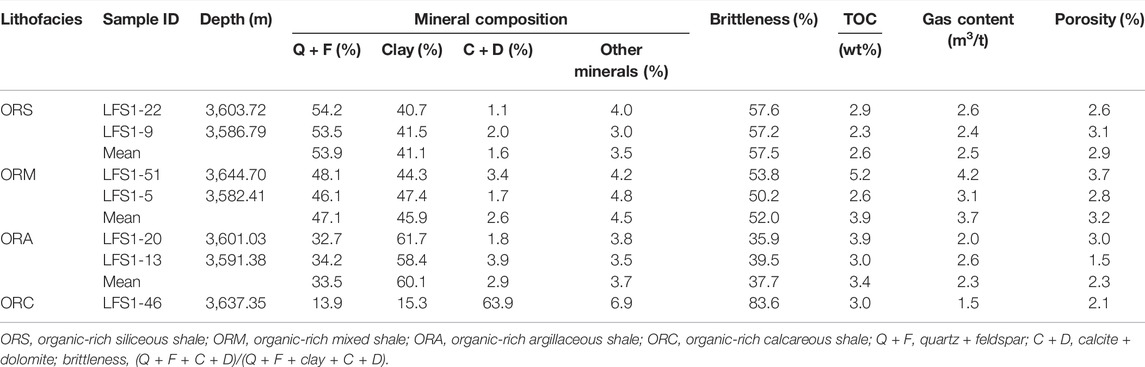
TABLE 3. Basic parameters of the selected seven samples.
The porosity of the selected seven organic-rich shale samples of four lithofacies types is compared. The porosity values of the seven samples are all larger than the limits (around 1%) for a shale gas reservoir (Nie et al., 2011). The ORS and ORM shales have obviously higher porosity than the ORA shale. Also, the porosity of the ORM shale seems to be relatively higher than the ORS shale as the clay mineral content of the two ORM shale samples is about 45% (Table 3). The only one ORC shale sample shows a low porosity, with a value of 2.1%, similar to the ORA shale (an average of 2.3%).
The ORM shale shows the highest gas content (with an average of 3.7 m3/t) in these seven shale samples, followed by the ORS and ORA shales with an average of 2.5 and 2.3 m3/t, respectively (Table 3). The ORC shale has poor gas content, with a value of only 1.5 m3/t.
N2 adsorption is commonly used to analyze mesoporous (2–50 nm) characteristics. The N2 adsorption–desorption isotherms for all shale samples were of type IV with a hysteresis loop, according to the classification of physisorption isotherms by Sing, 1985. N2 adsorption isotherms of shale samples rise rapidly at low pressure and then increase slowly, showing an anti-S shape. The shape shows a transition process of adsorption from monolayer to multilayer. N2 adsorption curves show that the adsorbed volumes of ORM shale samples are less than those of ORS and ORA shale samples (Figure 3), indicating that the ORM shale has lower mesopore volumes than the ORS and ORA shale. The ORC shale has a much lower mesopore volume than the other three lithofacies.
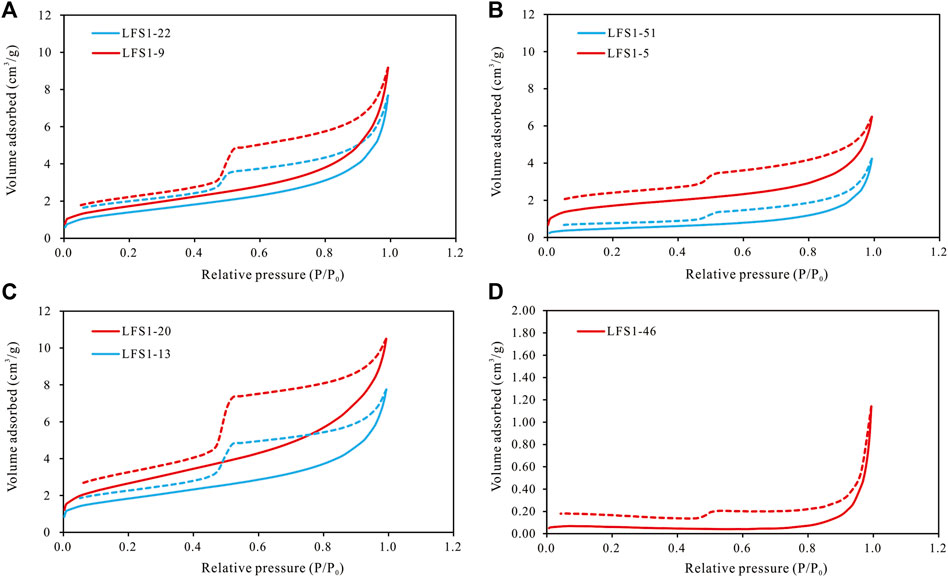
FIGURE 3. N2 adsorption isotherms of four types of lithofacies for shale samples in the Shahezi Formation. (A) ORS shale; (B) ORM shale; (C) ORA shale; and (D) ORC shale.
The pore shape of the shale can be characterized according to the N2 adsorption–desorption isotherms (Xi et al., 2017; 2018b). The hysteresis loops were classified into four types based on De Boer’s categories by IUPAC. In general, the type H2 hysteresis loop is often associated with pores that have narrow necks and wide bodies (defined as inkbottle-shaped pores), and the type H3 hysteresis loop represents slit-shaped or wedge-shaped pores. The slit-shaped or wedge-shaped pores can have a better connectivity than the inkbottle-shaped pores. The shapes of the hysteresis loop for the shale samples varied between types H2 and H3, indicating a combination of several typical pore types (Figure 3). At low pressure (P/P0 < 0.2), the unclosed hysteresis loops for all shale samples suggest the existence of ultra-micropores as N2 diffuses at a very slow velocity (Bertier et al., 2016). There are obvious differences in the shape of the hysteresis loop among the four types of lithofacies. The hysteresis loops of the ORM shale are smaller and flatter than those of the ORS and ORA shale, and the desorption curve is closer to the adsorption curve than that of the ORS and ORA shale (Figure 3). In addition, the desorption curves of the ORS and argillaceous shale are steeper at a relative pressure of 0.4–0.6 than that of the ORM shale. Furthermore, the hysteresis loops of the ORA shale are larger than those of the ORS shale. Also, for ORA shale, the distance between desorption and adsorption curves is further than that of the ORS shale at the relative pressure of 0.5–1.0. The results show that slit-shaped or wedge-shaped pores are better developed in the organic-rich mixed shale than those in ORS and ORA shales. The development degree of inkbottle-shaped pores is higher in the ORA shale and followed by the ORS shale, and the ORM shale seems to have a relatively low proportion of inkbottle-shaped pores. The hysteresis loop of ORC shale is similar to that of ORM shale, showing that the pores may be dominated by slit-shaped or wedge-shaped pores.
The mercury intrusion–extrusion curves are generally used to elucidate the characteristics of macropores (>50 nm), such as the distribution of micron-size pores and pore-throat connectivity (Rezaee et al., 2012). In this study, in order to eliminate the effects of the filling of fractures and surface irregularities, the surface roughness is corrected by subtracting injection volumes of the mercury intrusion porosimetry (MIP) data below 0.07 MPa (10 PSI) (Giesche, 2006; Gao and Hu, 2016). The mercury intrusion–extrusion curves of accumulated mercury saturation are similar among the ORS shale, ORM shale, and ORA shale (Figure 4). The cumulative intrusion curves increase stability when the capillary pressure is below 100 Mpa, and the mercury saturation increased with pressure, showing a slit-shaped pore structure consisting mainly of mineral matrix pores. Also, the slope of cumulative intrusion curves for the ORM shale is little higher than that of the ORS shale and ORA shale, indicating a better development degree of slit-shaped pores. When the capillary pressure exceeds 100 Mpa, the slope of cumulative intrusion curves increases distinctly, indicating that mercury breaks through the pores with narrow necks and enters the pores with wide bodies, which are mainly affected by the organic and clay mineral pores (Cai et al., 2013).
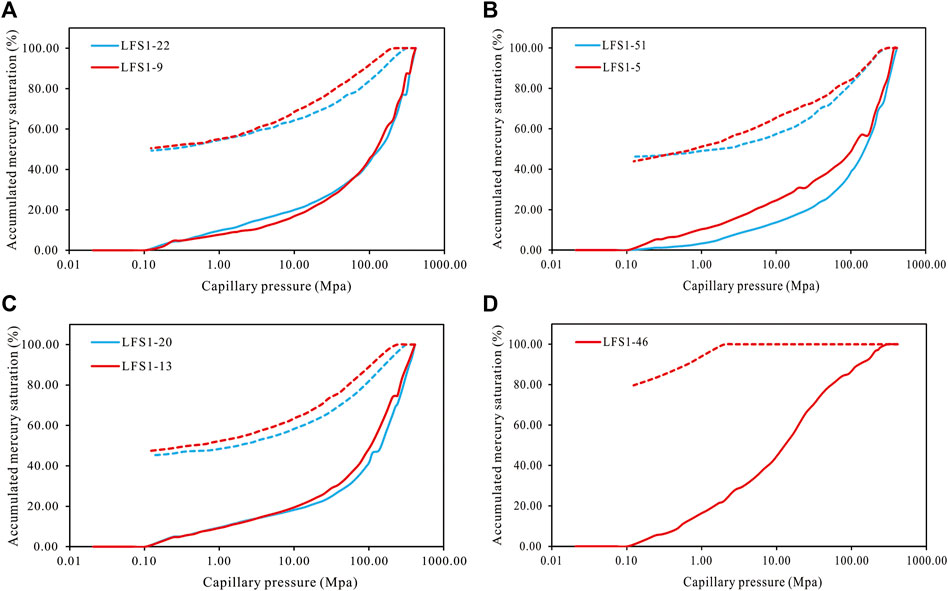
FIGURE 4. Curves of mercury intrusion–extrusion from different lithofacies for shale samples in the Shahezi Formation. (A) ORS shale; (B) ORM shale; (C) ORA shale; and (D) ORC shale.
The cumulative mercury extrusion curves have a platform in the initial stage at high pressure for the ORS shale, ORM shale, and ORA shale, and then, the curves gradually decrease (Figure 4). The platform of the ORS shale and ORA shale seems to be bigger than that of the ORM shale, indicating that the mercury in the ORS shale and ORA shale is more difficult to extrude from pores at high pressure than that in the ORM shale. The results suggest that the ORM shale may have better pore connectivity than the ORS shale and ORA shale. The average value of the mercury withdrawal efficiency for the ORM shale is 54.9% and is slightly higher than that for the ORS shale and ORA shale with an average of 50.1% and 53.7%, respectively.
The mercury intrusion–extrusion curve of the ORC shale is quite different from the other three (Figure 4). The slope of the intrusion curve increases when the capillary pressure exceeds 10 Mpa, showing a breakthrough of pore throat, and gradually decreases when the capillary pressure is higher than 60 Mpa. The extrusion curve has a large platform at a capillary pressure of 2–450 Mpa, and the final mercury withdrawal efficiency is only 20.4%. The results suggest the ORC shale may have poor pore-throat connectivity in micron-size pores.
Porosity is a key parameter to evaluate reservoirs, which provides a measure of the potential shale gas capacity. The weak correlation between porosity and TOC suggests that the organic pore may account for a low proportion of total porosity, and the inorganic pore is the main type (Figure 5D). Siliceous minerals are positively correlated with porosity (Figure 5A). Argillaceous minerals seem to be positively correlated with porosity when the content is lower than 45% and negatively correlated with porosity when the content exceeds 45% (Figure 5B). However, calcareous minerals have no correlation with porosity (Figure 5C). Therefore, the siliceous and argillaceous minerals are the key factors influencing the porosity. Siliceous minerals have a greater effect on porosity than argillaceous minerals. The siliceous minerals which have strong rigidity could shield the pores from compaction. Also, the combination of siliceous and argillaceous shales in a suitable proportion may be contributed to increasing the porosity. A high content of argillaceous minerals could decrease the porosity as it lacks the support from rigid minerals. The calcareous minerals may decrease the porosity due to re-precipitation within pore spaces.
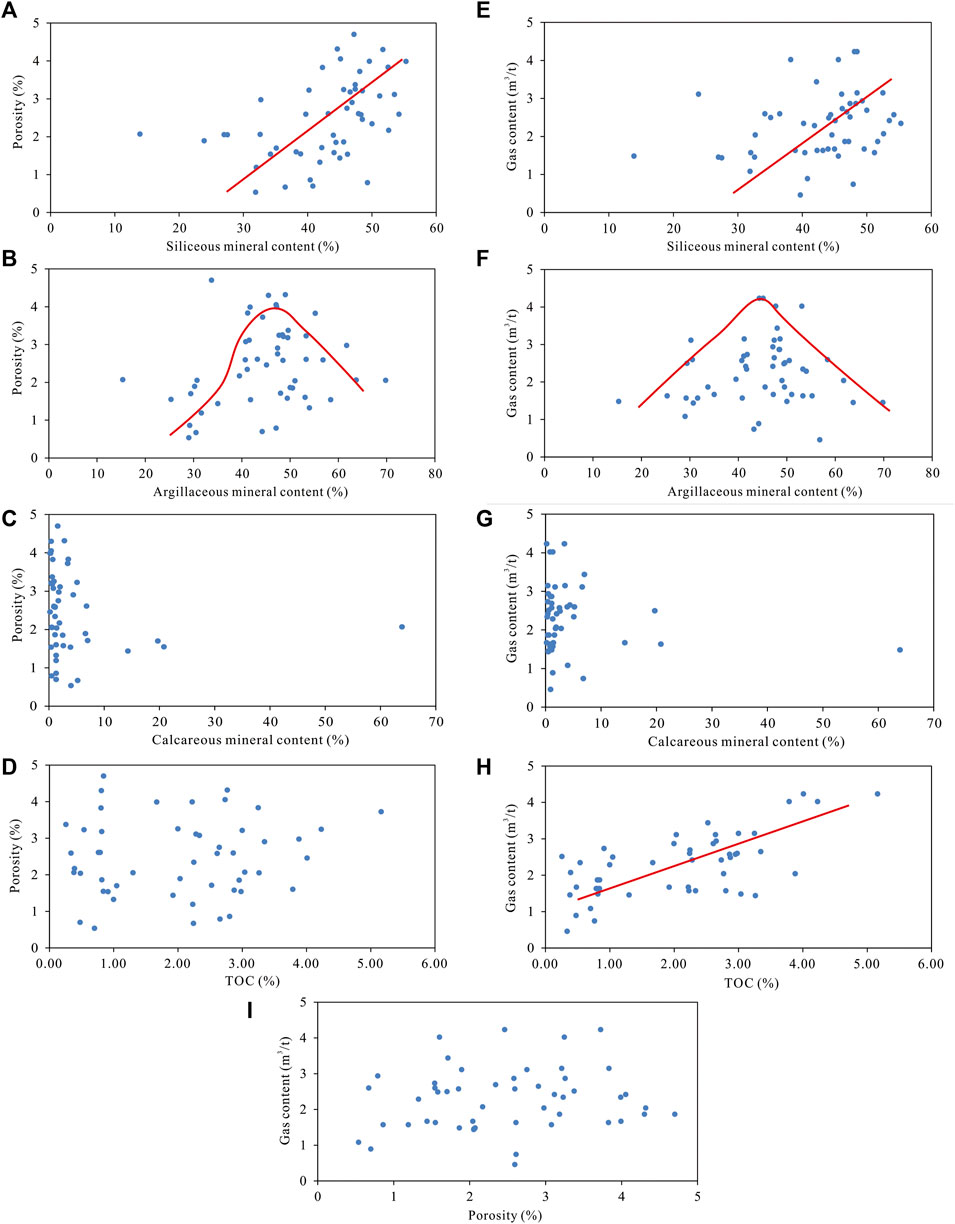
FIGURE 5. Relationship between porosity and (A) siliceous minerals, (B) argillaceous minerals, (C) calcareous minerals, (D) TOC; relationship between the gas content and (E) siliceous minerals, (F) argillaceous minerals, (G) calcareous minerals, (H) TOC; and (I) relationship between porosity and gas content.
TOC is positively correlated with the gas content (Figure 5H), and there is a slight positive correlation between siliceous minerals and the gas content (Figure 5E). The relationship between the gas content and porosity and gas content and calcareous minerals is not obvious (Figures 5G,I). Argillaceous minerals seem to be positively correlated with the gas content when the content is lower than 45% and negatively correlated with the gas content when the content exceeds 45% (Figure 5F). The results indicated that material basis is the key factor affecting the gas content, and the moderate argillaceous mineral content (45%) can contribute to the form of favorable reservoir space and increase the gas content. The influence of other factors on the gas content is relatively limited.
The PSD of shale of four lithofacies types was calculated on the basis of CO2 and N2 adsorption and MICP data. The micropores (0–2 nm), mesopores (2–50 nm), and macropores (>50 nm) were characterized with CO2 adsorption (DFT model), N2 adsorption (BJH model), and MICP (Washburn equation) data, respectively. The results showed that mesopores contribute mostly to the total pore volume in the ORS, ORM, and ORA shale (Figure 6). The average pore volume of mesopores in the ORM shale (0.0048 ml/g) is much smaller than that in the ORS shale (0.0084 ml/g) and the ORA shale (0.0104 ml/g) (Table 4). The average pore volume of micropores and macropores is similar among the ORS, ORM, and ORA shale. The development degree of pores for the ORC shale is weak compared with the other three types of shale.
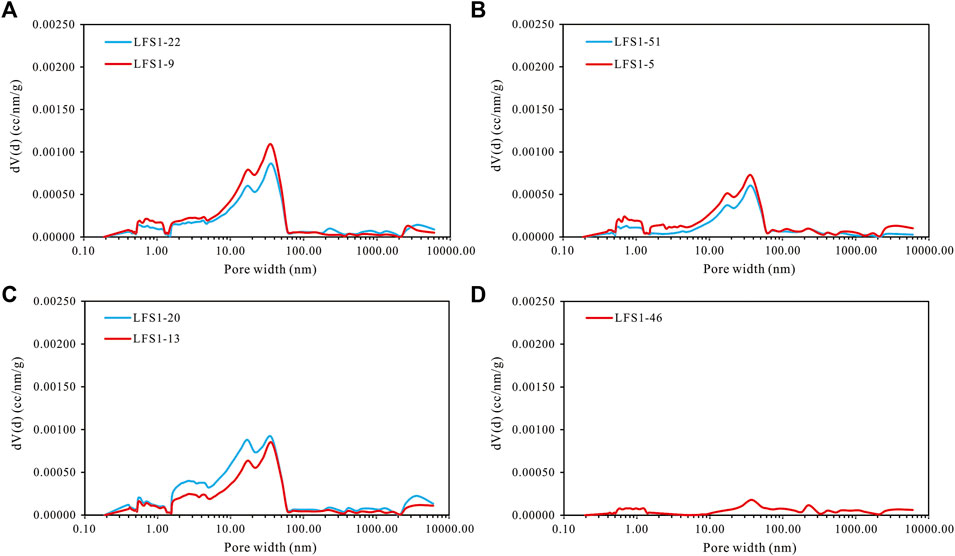
FIGURE 6. PSD of four types of lithofacies for shale samples in the Shahezi Formation. (A) ORS shale; (B) ORM shale; (C) ORA shale; and (D) ORC shale. Note: 0–2 nm, CO2 DFT model; 2–50 nm, N2 BJH model; >50 nm, mercury intrusion.
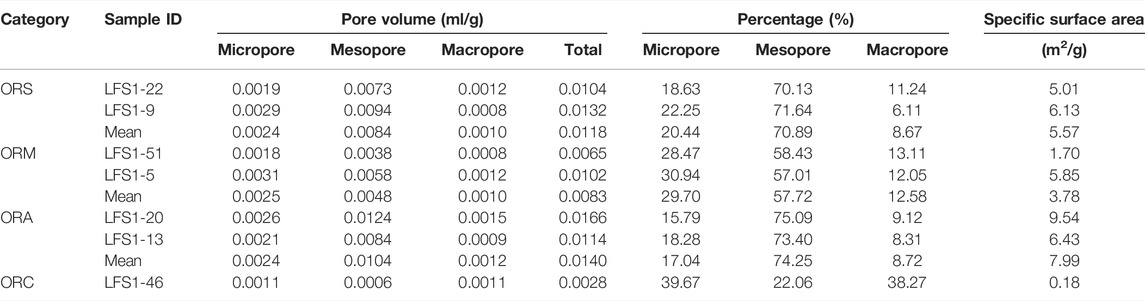
TABLE 4. Pore volume of all size pores in the shale of different lithofacies types from the Shahezi Formation.
For the ORM shale, the proportion of micropores and macropores (29.70% and 12.58%) in the total pore volume is higher than that of the ORS (20.44% and 8.67%) and ORA shale (17.04% and 8.72%). The proportion of mesopores (57.72%) in the ORM shale is much lower than that of the ORS (70.89%) and ORA shale (74.25%). The results indicate that for the ORM shale, the higher proportion of micropores may contribute to increasing the adsorption capacity, and the higher proportion of macropores may help promote pore connectivity.
The ORM shale has the highest specific surface area with an average value of 9.54 m2/g, followed by ORA shale and ORS shale with an average value of 7.99 and 5.57 m2/g, respectively (Table 4). The high specific surface area of ORM shale may be contributed by the moderately developed organic pores that were protected by the rigid minerals and clay-related pores. On the contrary, the ORC shale has the minimum specific surface area, with a value of 0.18 m2/g. The ORC shale shows a poor adsorption capacity as the pores are poorly developed.
For the two ORS shale samples, the matrix is dominated by quartz and clay. The organic matter mainly consists of higher plant detritus and bitumen filling between grains. The pores in the organic detritus are not developed (Figures 7A,E), but sometimes shrinkage cracks are developed (Figure 7E). Bitumen is usually filled between quartz grains or between layers of clay (Figures 7B,C,F,H), and some of the micropores in the bitumen are well developed, as protected by siliceous minerals or rigid grains. The big pore cavity can sometimes be observed in the bitumen (Figure 7C). The organic matter pore shapes are from elongated to irregular polygons, and pore sizes range from several to hundreds of nanometers (Figures 7B,C,F,H). The inorganic pores are mainly quartz intergranular pores and clay shrinkage cracks (Figures 7D,G). The organic matter pores appear to be interconnected with each other; however, most of the inorganic pores seem to be disconnected from the organic matter pores.
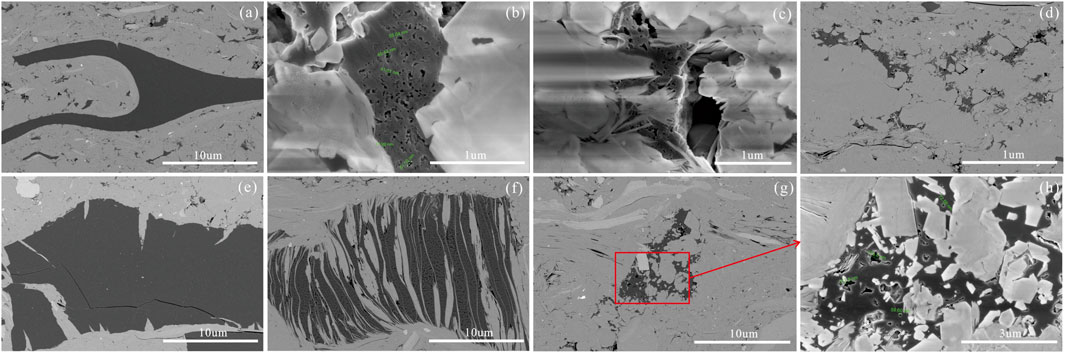
FIGURE 7. SEM images of ORS shale samples in the Shahezi Formation. (A–D) LFS1-22; (E–H) LFS1-9. (A) Organic debris with little internal pores; (B) micropores developed in the bitumen; (C) intergranular pores are well developed, and the micropores in the edge of bitumen are well developed; (D) quartz intergranular pores and clay shrinkage cracks are well developed; (E) organic debris with little pores; (F) bitumen is filled between clay layers; (G) clay shrinkage cracks; (H) micropores are developed in the bitumen which is filled between quartz.
For the two ORM shale samples, similar to the ORS shale, the matrix is dominated by clay and quartz, and the organic matter mainly consists of scattered higher plant detritus and bitumen filling between grains. The pores in the organic detritus are poorly developed (Figures 8E,G). Bitumen pores are generally unevenly developed (Figures 8B,D), and pore sizes can range from several to hundreds of nanometers (Figures 8B,D,F). The big pore cavity can also be observed in the bitumen (Figure 8D), and sometimes the shape of bitumen pores is honeycomb (Figure 8F). Inorganic pores are mainly contact gaps between quartz particles, shrinkage gaps between clay minerals, and gaps between clay mineral layers (Figures 8C,G). Different from the ORS shale, organic and inorganic pores in the two ORM shale tend to be interconnected by the microfractures, including structural microfractures and organic shrinkage fractures (Figures 8A–C, E,G). The moderate content of clay minerals seems to contribute to increasing the occurrence probability of longer shrinkage fractures. The interconnection between organic and inorganic pores contributes to providing more effective storage space as gas generated from organic matter can flow into the inorganic pores through connected microfractures.
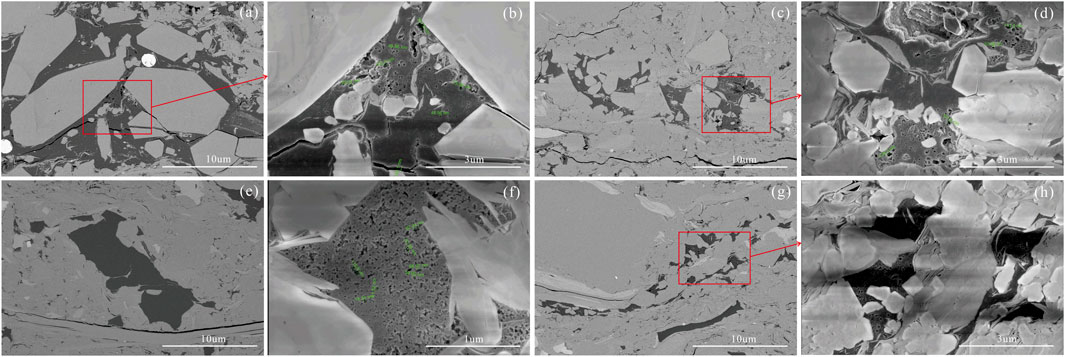
FIGURE 8. SEM images of ORM shale samples in the Shahezi Formation. (A–D) LFS1-5; (E–H) LFS1-51. (A) Structural microfractures and organic shrinkage fractures; (B) micropores developed in the bitumen; (C) contact gaps between quartz particles and shrinkage gaps between clay minerals; (D) unevenly developed bitumen pores; (E) organic debris with little internal pores; (F) cellular pores in bitumen; (G) gaps between clay mineral layers; (H) micropores are developed in the bitumen which is filled between quartz.
For the two ORA shale samples, the internal pores of organic clasts are poorly developed (Figure 9A). The internal pores of bitumen are generally not developed (Figure 9B) but can sometimes be observed locally (Figures 9E,F). The pores in bitumen vary in size and are irregular polygon shapes. The pores developed in bitumen seem to be bigger than those in the other types of shale (Figure 9F). Inorganic pores are mainly shrinkage cracks of clay minerals and dissolution pores in feldspar. The shrinkage cracks of clay minerals are less developed than those of ORS and ORM shale (Figure 9C) and generally developed locally (Figures 9D,H). The phenomenon shows that the ORA shale has a stronger compaction effect than ORS and ORM shales due to the reduction in the content of rigid minerals. Dissolution pores in feldspar are observed in the ORA shale (Figure 9G), which are rarely found in the ORS and ORM shale. In the process of hydrocarbon generation from organic matter, the clay minerals, as a favorable catalyst, promote the transformation of organic matter and the formation of organic acids, which results in the development of dissolution pores in feldspar. Higher clay contents in the ORA shale than those in the ORS and ORM shale may contribute to increased organic acid content and form a strong dissolution effect.
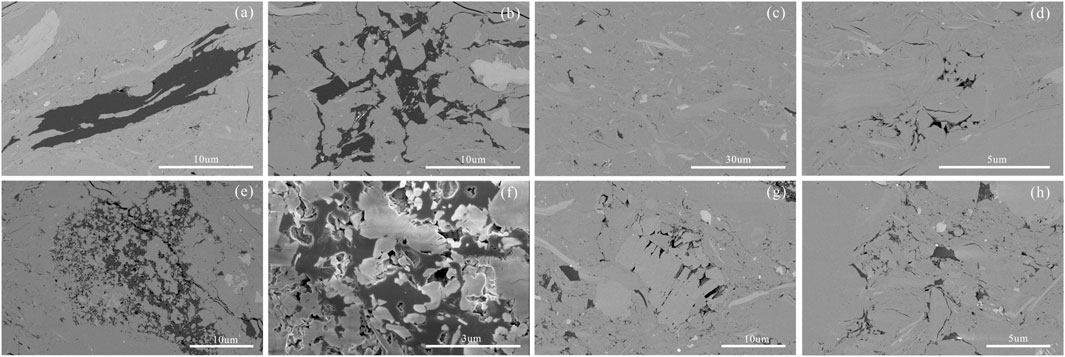
FIGURE 9. SEM images of ORA shale samples in the Shahezi Formation. (A–D) LFS1-13; (E–H) LFS1-20. (A) Organic debris with little internal pores; (B) bitumen with little internal pores; (C) shrinkage gaps between clay minerals are undeveloped; (D) shrinkage gaps between clay minerals and intergranular pores; (E) internal pores developed locally in bitumen; (F) internal and marginal pores in bitumen; (G) dissolution pores in feldspar grains; (H) shrinkage cracks of clay minerals.
For the ORC shale sample, the pores in organic detritus and bitumen are less developed, and only a few pores can be observed (Figures 10A,B). The poor development of organic pores may be caused by alkaline diagenetic conditions that inhibit the pore development of organic matter. Also, the low clay mineral content may decrease the rate of hydrocarbon generation of organic matter as clay minerals are effective catalysts for hydrocarbon generation from organic matter. Inorganic pores are well developed, including intergranular pores and shrinkage gaps between clay minerals (Figures 10C,D). In addition, a few dissolution pores inside the mineral particles can be observed (Figures 10B–D). Most of the inorganic pores seem to be disconnected from organic matter, which may not be conducive to shale gas storage and enrichment.
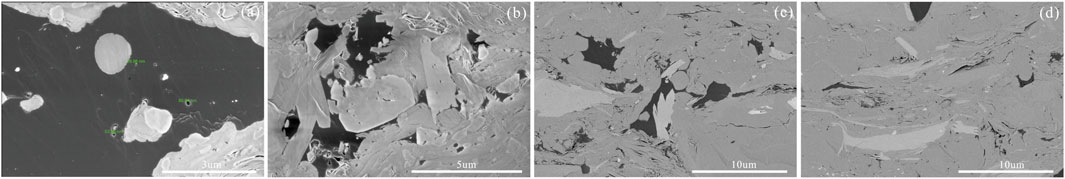
FIGURE 10. SEM images of ORA shale samples in the Shahezi Formation. (A–D) LFS1-46. (A) Organic debris with little internal pores; (B) bitumen with little internal pores; (C,D) a few dissolution pores inside the mineral particles, intergranular pores, and shrinkage gaps between clay minerals.
Fractal theory can describe the heterogeneity of a porous material and has been proven to be a useful tool to characterize the roughness of the pore surface and the complexity of the pore structure for porous media such as shale (Yao et al., 2009; Mishra et al., 2018). The fractal dimension (D) is a key parameter that is commonly used to quantitatively describe the heterogeneity of shale surfaces and pores. In general, the fractal dimension values range between 2 and 3, and the larger the fractal dimension, the rougher is the pore surface or the more complex is the pore structure. The values 2 and 3 for surface fractal dimension indicate a perfect flat pore surface and a very rough pore surface, respectively. The fractal BET (Brunauer–Emmett–Teller), fractal Frenkele–Halseye–Hill (FHH), and thermodynamic methods are three available methods to obtain the value of D based on gas adsorption isotherms (Avnir and Jaroniec 1989; Yao et al., 2008; Cai et al., 2013). Among these, the FHH model is the most commonly used and most effective. According to FHH, the fractal dimension can be calculated with the results of nitrogen adsorption, according to the following equation:
where V represents the adsorbed volume (cm3) at equilibrium pressure P (MPa); K is the power-law exponent that is dependent on D and the mechanism of adsorption; and P0 (MPa) is the saturation pressure of the gas. Fractal dimension D can be derived from the expression “K = (D−3),” which can provide realistic results.
Scatter diagrams of ln (V) versus ln (ln (P0/P)) for these shale samples were drawn using the original low-temperature N2 adsorption isotherm data. The plots all show a good linear relationship (Figure 11), indicating that the pores of the shale sample are fractal. The two distinct linear segments can be observed at a relative pressure (P/P0) of 0–0.55 and 0.55–1, indicating that the pores in shale have different fractal characteristics in these two regions, and the fractal dimension D1 at a lower relative pressure (P/P0) of 0–0.55 and fractal dimension D2 at a higher relative pressure (P/P0) of 0.55–1 can be obtained. Previous studies have researched the discrepancies of D1 and D2 and their contributions to the CH4 adsorption capacity (Li et al., 2016). The pore structure fractal dimension and the surface fractal dimension are the two conventional definitions in describing fractality (Pyun and Rhee, 2004). At a lower relative pressure (P/P0) of 0–0.55, with the increasing pressure, gas molecules gradually adsorb on the whole pore surfaces from monolayer to multilayer until the smoothing effect appears. In this region, micropore filling mainly occurs, and van der Waals forces between gas and solid control the gas/solid interface. The fractal dimension D1 corresponds to the surface fractal dimension. A higher value of D1 means a more irregular surface of the shale sample, which can have more adsorption sites for CH4 and increase the adsorption capacity of shale. At a higher relative pressure (P/P0) of 0.55–1, the increasing adsorbed layers lead to the occurrence of smoothing effects as van der Waals forces between gas and solid become weak, and the capillary condensation of gas clumps in the shale pores takes more effects (Qi et al., 2002; Mahnke and Mögel, 2003; Sing, 2004). The fractal dimension D2 corresponds to the pore structure fractal dimension; a greater pore structure fractal dimension D2 indicates that the shale has a higher capillary condensation on pore surfaces, which causes the decrease of CH4 adsorption.
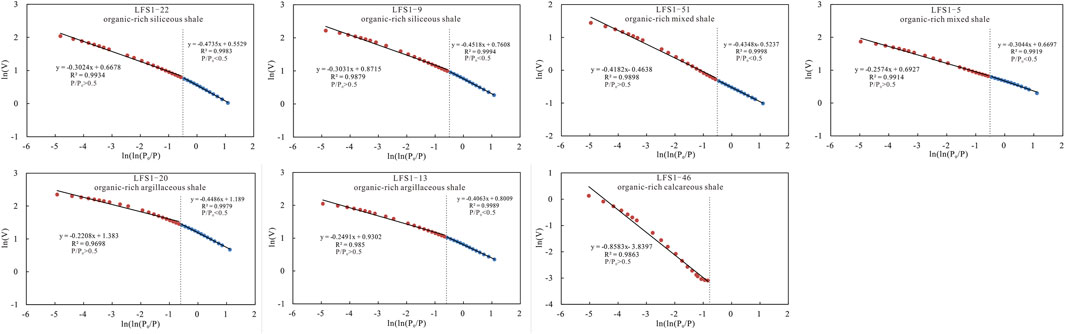
FIGURE 11. Scatter diagram of ln (V) vs. ln (ln (P0/P)) from N2 adsorption data for shale samples from the Shahezi Formation.
The values of fractal dimensions D1 and D2 for four lithofacies types of shale are calculated by D = K + 3, and the results are shown in Table 5. Compared with the ORS and ORA shale, the ORM shale has the highest fractal dimension D1 and lowest fractal dimension D2, with the mean values of 2.6304 and 2.6622, respectively. This suggests that the ORM shale may have a more irregular surface which could provide more space for CH4 adsorption and have lower liquid/gas surface tension that can enhance CH4 adsorption capacity. Also, this may be an important reason for explaining that the ORM shale has higher gas content than the ORS and ORA shale. The ORA shale has a higher fractal dimension D2 (a mean value of 2.7651) than that of the ORS and ORM shale (a mean value of 2.6973 and 2.6622), indicating that higher capillary condensation on pore surfaces is more likely to occur in the ORA shale, which causes the decrease of CH4 adsorption and lower gas content than that of the ORS and ORM shale. The ORS shale has a lower fractal dimension D1 (a mean value of 2.5374) than that of the ORA and ORM shale (a mean value of 2.5726 and 2.6304), showing that the ORS shale offers fewer adsorption sites for CH4 and has lower adsorption capacity. For the ORC shale, at a lower relative pressure (P/P0) of 0–0.55, it has very weak gas adsorption, and the fractal dimension D1 is unrealistic. The fractal dimension D2 of the ORC shale is much lower than the ORS, ORM, and ORA shale, with a value of 2.1417, indicating that the ORC shale has weak heterogeneity of the pore structure and is unlikely to occur in the capillary condensation of gas clumps.
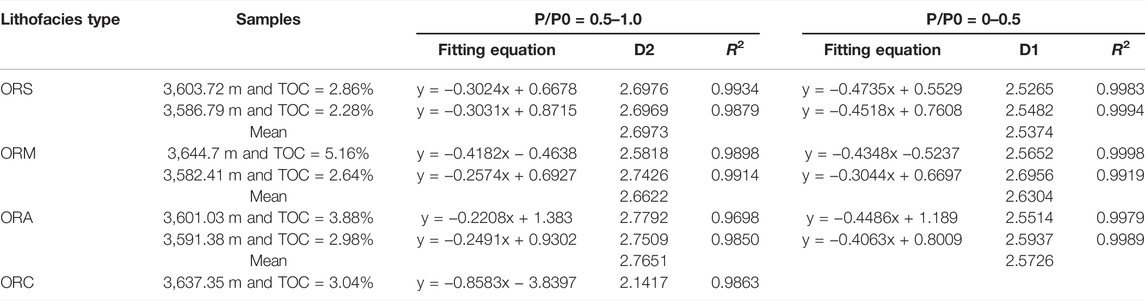
TABLE 5. Fractal dimensions of four types of lithofacies.
Based on the multi-methods, including organic geochemical analysis, XRD analysis, porosity tests, FE-SEM, N2 and CO2 adsorption, and MIP experiments, reservoir characteristic differences among ORS, ORA, ORC, and ORM shales from the Shahezi Formation are comprehensively analyzed, and the favorable lithofacies is determined. The following conclusions can be drawn:
1) The ORM shale may be the most favorable lithofacies for shale gas enrichment and development, which has high porosity, good pore connectivity, moderate brittleness, and strong gas adsorption and storage capacity, followed by the ORS and ORA shale; the ORC shale is the worst.
2) The moderate content of clay minerals (45%) can significantly improve porosity, and high and low clay mineral contents are not conducive to the improvement of porosity. The ORM shale tends to have better pore connectivity than the ORS shale and ORA shale, and the ORC shale has the poorest pore-throat connectivity in micron-size. The ORM shale is dominated by slit-shaped or wedge-shaped pores; however, ORS and ORA shales mainly develop inkbottle-shaped pores. The ORC shale shows low mercury withdrawal efficiency.
3) Internal pores in bitumen and clay shrinkage cracks are the dominant pore type. The two types of pores are likely interconnected in the ORM shale as structural microfractures and organic shrinkage fractures are well developed. However, they are generally disconnected for the ORS and ORA shale. The bitumen pores and shrinkage cracks of clay minerals for ORA shale are less developed than those of the ORS and mixed shale; however, dissolution pores are better developed than that of them. Inorganic pores are well developed in the ORC shale, but organic pores are not.
4) The ORM shale may have a more irregular surface which could provide more space for CH4 adsorption and have lower liquid/gas surface tension which can enhance the CH4 adsorption capacity. The higher capillary condensation on pore surfaces is more likely to occur in the ORA shale, which causes the decrease of CH4 adsorption. The ORS shale offers fewer adsorption sites for CH4 and has lower adsorption capacity. The ORC shale has weak heterogeneity of the pore structure and is unlikely to occur in the capillary condensation of gas clumps.
The original contributions presented in the study are included in the article/Supplementary Material; further inquiries can be directed to the corresponding authors.
WX and GY are responsible for the idea, writing, and revision of this manuscript. AL is responsible for the data analysis and review. ZS and WH are responsible for drawing and editing.
This work was supported by the National Natural Science Foundation of China (Grant No. 42072156) and the Project of Sinopec Science and Technology Department (P21035-2).
Authors GY and ZS were employed by the company RIPEP, SINOPEC.
The remaining authors declare that the research was conducted in the absence of any commercial or financial relationships that could be construed as a potential conflict of interest.
All claims expressed in this article are solely those of the authors and do not necessarily represent those of their affiliated organizations, or those of the publisher, the editors, and the reviewers. Any product that may be evaluated in this article, or claim that may be made by its manufacturer, is not guaranteed or endorsed by the publisher.
Avnir, D., and Jaroniec, M. (1989). An Isotherm Equation for Adsorption on Fractal Surfaces of Heterogeneous Porous Materials. Langmuir 5, 1431–1433. doi:10.1021/la00090a032
Barrett, E. P., Joyner, L. G., and Halenda, P. P. (1951). The Determination of Pore Volume and Area Distributions in Porous Substances. I. Computations from Nitrogen Isotherms. J. Am. Chem. Soc. 73, 373–380. doi:10.1021/ja01151a04610.1021/ja01145a126
Batten, D. J. (1996). Sedimentary Organic Matter. Organic Facies and Palynofacies. Mar. Petroleum Geol. 13 (5), 595–596. doi:10.1016/0264-8172(96)88335-8
Bertier, P., Schweinar, K., Stanjek, H., Ghanizadeh, A., Clarkson, C. R., Busch, A., et al. (2016). On the Use and Abuse of N2 Physisorption for the Characterization of the Pore Structure of Shales. CMS Workshop Lect. 21, 151–161. doi:10.1346/CMS-WLS-21.12
Brunauer, S., Emmett, P. H., and Teller, E. (1938). Adsorption of Gases in Multimolecular Layers. J. Am. Chem. Soc. 60, 309–319. doi:10.1021/ja01269a023
Cai, Q., Hu, M., Ngia, N. R., and Hu, Z. (2017). Sequence Stratigraphy, Sedimentary Systems and Implications for Hydrocarbon Exploration in the Northern Xujiaweizi Fault Depression, Songliao Basin, NE China. J. Petroleum Sci. Eng. 152, 471–494. doi:10.1016/j.petrol.2017.02.022
Cai, Y., Liu, D., Pan, Z., Yao, Y., Li, J., and Qiu, Y. (2013). Pore Structure and its Impact on CH4 Adsorption Capacity and Flow Capability of Bituminous and Subbituminous Coals from Northeast China. Fuel 103, 258–268. doi:10.1016/j.fuel.2012.06.055
Chalmers, G. R., Bustin, R. M., and Power, I. M. (2012). Characterization of Gas Shale Pore Systems by Porosimetry, Pycnometry, Surface Area, and Field Emission Scanning Electron Microscopy/transmission Electron Microscopy Image Analyses: Examples from the Barnett, Woodford, Haynesville, Marcellus, and Doig Units. Bulletin 96, 1099–1119. doi:10.1306/10171111052
Chen, L., Jiang, Z., Liu, K., Wang, P., Ji, W., Gao, F., et al. (2016). Effect of Lithofacies on Gas Storage Capacity of Marine and Continental Shales in the Sichuan Basin, China. J. Nat. Gas Sci. Eng. 36, 773–785. doi:10.1016/j.jngse.2016.11.024
Chen, S. Y., Zhang, S., Wang, Y. S., and Tan, M. Y. (2016). Lithofacies Types and Reservoirs of Paleogene Fine-Grained Sedimentary Rocks in Dongying Sag, Bohai Bay Basin. Petroleum Explor. Dev. 43 (2), 198–208. (in Chinese with English abstract). doi:10.1016/S1876-3804(16)30025-8
Chen, Y., Wei, L., Mastalerz, M., and Schimmelmann, A. (2015). The Effect of Analytical Particle Size on Gas Adsorption Porosimetry of Shale. Int. J. Coal Geol. 138, 103–112. doi:10.1016/j.coal.2014.12.012
Dang, W., Zhang, J., Tang, X., Chen, Q., Han, S., Li, Z., et al. (2016). Shale Gas Potential of Lower Permian Marine-Continental Transitional Black Shales in the Southern North China Basin, Central China: Characterization of Organic Geochemistry. J. Nat. Gas Sci. Eng. 28, 639–650. doi:10.1016/j.jngse.2015.12.035
Diamond, W. P., and Schatzel, S. J. (1998). Measuring the Gas Content of Coal: a Review. Int. J. Coal Geol. 35, 311–331. doi:10.1016/s0166-5162(97)00040-2
Gao, F., Song, Y., Li, Z., Xiong, F., Chen, L., Zhang, Y., et al. (2018). Lithofacies and Reservoir Characteristics of the Lower Cretaceous Continental Shahezi Shale in the Changling Fault Depression of Songliao Basin, NE China. Mar. Petroleum Geol. 98, 401–421. doi:10.1016/j.marpetgeo.2018.08.035
Gao, Z., and Hu, Q. (2016). Wettability of Mississippian Barnett Shale Samples at Different Depths: Investigations from Directional Spontaneous Imbibition. Bulletin 100 (1), 101–114. doi:10.1306/09141514095
Giesche, H. (2006). Mercury Porosimetry: a General (Practical) Overview. Part. Part. Syst. Charact. 23 (1), 9–19. doi:10.1002/ppsc.200601009
Gregg, S. J., and Sing, K. S. W. (1982). Adsorption, Surface Area, and Porosity. New York: Academic Press, 303.
Han, H., Dai, J., Guo, C., Zhong, N., Pang, P., Ding, Z., et al. (2021). Pore Characteristics and Factors Controlling Lacustrine Shales from the Upper Cretaceous Qingshankou Formation of the Songliao Basin, Northeast China: A Study Combining SEM, Low‐temperature Gas Adsorption and MICP Experiments. Acta Geol. Sin. ‐ Engl. Ed. 95 (2), 585–601. doi:10.1111/1755-6724.14419
Hu, H., Hao, F., Guo, X., Yi, J., Shu, Z., Bao, H., et al. (2019). Effect of Lithofacies on the Pore System of Over-mature Longmaxi Shale in the Jiaoshiba Area, Sichuan Basin, China. Mar. Petroleum Geol. 109, 886–898. doi:10.1016/j.marpetgeo.2019.06.050
Hu, W., Lü, B., Zhang, W., Mao, Z., Leng, J., and Guan, D. (2005). An Approach to Tectonic Evolution and Dynamics of the Songliao Basin. Sci. Geol. Sin. 1, 16–31. (in Chinese with English abstract). doi:10.3321/j.issn:0563-5020.2005.01.002
Li, A., Ding, W., He, J., Dai, P., Yin, S., and Xie, F. (2016). Investigation of Pore Structure and Fractal Characteristics of Organic-Rich Shale Reservoirs: a Case Study of Lower Cambrian Qiongzhusi Formation in Malong Block of Eastern Yunnan Province, South China. Mar. Petroleum Geol. 70, 46–57. doi:10.1016/j.marpetgeo.2015.11.004
Li, S., Zhang, J., Gong, F., Zhu, H., and Bai, Y. (2017). The Seven Properties Characteristics of Mudstone in the First and Second Member of Upper Cretaceous Qingshankou Formation and Favorable Area Optimization of Shale Oil in the North of Songliao Basin. Geol. Rev. 63 (Suppl. p), 71–72. (in Chinese with English abstract). doi:10.16509/j.georeview.2017.s1.035
Li, Y. (2021). Mechanics and Fracturing Techniques of Deep Shale from the Sichuan Basin, SW China. Energy Geosci. 2 (1), 1–9. doi:10.1016/j.engeos.2020.06.002
Liang, C., Cao, Y., Liu, K., Jiang, Z., Wu, J., and Hao, F. (2018). Diagenetic Variation at the Lamina Scale in Lacustrine Organic-Rich Shales: Implications for Hydrocarbon Migration and Accumulation. Geochimica Cosmochimica Acta. 229, 112–128. doi:10.1016/j.gca.2018.03.017
Lin, L., Liu, S., Xu, Y., and Li, F. (2021). Lithofacies and Pore Structure of Fine‐grained Sedimentary Rocks of Qing‐1 Member of Cretaceous in the Southern Songliao Basin. Acta Geol. Sin. ‐ Engl. Ed. 95 (2), 570–584. doi:10.1111/1755-6724.14657
Littke, R. (1993). Deposition, Diagenesis and Weathering of Organic Matter-Rich Sediments. Lect. Notes Earth Sci. 47. doi:10.1007/bfb0009988
Liu, B., Shi, J. X., Fu, X. F., Lv, Y. F., Sun, X. D., Gong, L., et al. (2018). Petrological Characteristics and Shale Oil Enrichment of Lacustrine Fine-Grained Sedimentary System: A Case Study of Organic-Rich Shale in First Member of Cretaceous Qingshankou Formation in Gulong Sag, Songliao Basin, NE China. Petroleum Explor. Dev. 45 (5), 1–11. doi:10.1016/S1876-3804(18)30091-0
Loucks, R. G., Reed, R. M., Ruppel, S. C., and Hammes, U. (2012). Spectrum of Pore Types and Networks in Mudrocks and a Descriptive Classification for Matrix-Related Mudrock Pores. Bulletin 96 (6), 1071–1098. doi:10.1306/08171111061
Ma, Z., Tan, J., Zheng, L., Shen, B., Wang, Z., Shahzad, A., et al. (2021). Evaluating Gas Generation and Preservation of the Wufeng-Longmaxi Formation Shale in Southeastern Sichuan Basin, China: Implications from Semiclosed Hydrous Pyrolysis. Mar. Petroleum Geol. 129, 105102. doi:10.1016/j.marpetgeo.2021.105102
Mahnke, M., and Mögel, H. J. (2003). Fractal Analysis of Physical Adsorption on Material Surfaces. Colloids Surfaces A Physicochem. Eng. Aspects. 216, 215–228. doi:10.1016/S0927-7757(02)00577-0s
Mathia, E. J., Bowen, L., Thomas, K. M., and Aplin, A. C. (2016). Evolution of Porosity and Pore Types in Organic-Rich, Calcareous, Lower Toarcian Posidonia Shale. Mar. Petroleum Geol. 75, 117–139. doi:10.1016/j.marpetgeo.2016.04.009
Meyers, P. A. (1994). Preservation of Elemental and Isotopic Source Identification of Sedimentary Organic Matter. Chem. Geol. 114 (3), 289–302. doi:10.1016/0009-2541(94)90059-0
Milliken, K. L., Rudnicki, M., Awwiller, D. N., and Zhang, T. (2013). Organic Matter-Hosted Pore System, Marcellus Formation (Devonian), Pennsylvania. Bulletin 97 (2), 177–200. doi:10.1306/07231212048
Mishra, S., Mendhe, V. A., Varma, A. K., Kamble, A. D., Sharma, S., Bannerjee, M., et al. (2018). Influence of Organic and Inorganic Content on Fractal Dimensions of Barakar and Barren Measures Shale Gas Reservoirs of Raniganj Basin, India. J. Nat. Gas Sci. Eng. 49, 393–409. doi:10.1016/j.jngse.2017.11.028
Nie, H., Li, D., Liu, G., Lu, Z., Hu, W., Wang, R., et al. (2020). An Overview of the Geology and Production of the Fuling Shale Gas Field, Sichuan Basin, China. Energy Geosci. 1 (3–4), 147–164. doi:10.1016/j.engeos.2020.06.005
Nie, H., Zhang, J., and Li, Y. (2011). Accumulation Conditions of the Lower Cambrian Shale Gas in the Sichuan Basin and its Periphery. Acta Pet. Sin. 32, 959–967. doi:10.1007/s12182-011-0123-3
Pyun, S.-I., and Rhee, C.-K. (2004). An Investigation of Fractal Characteristics of Mesoporous Carbon Electrodes with Various Pore Structures. Electrochimica Acta. 49, 4171–4180. doi:10.1016/j.electacta.2004.04.012
Qi, H., Ma, J., and Wong, P.-z. (2002). Adsorption Isotherms of Fractal Surfaces. Colloids Surfaces A Physicochem. Eng. Aspects. 206, 401–407. doi:10.1016/S0927-7757(02)00063-8
Rezaee, R., Saeedi, A., and Clennell, B. (2012). Tight Gas Sands Permeability Estimation from Mercury Injection Capillary Pressure and Nuclear Magnetic Resonance Data. J. Petroleum Sci. Eng. 88-89, 92–99. doi:10.1016/j.petrol.2011.12.014
Shu, L. S., Mu, Y. F., and Wang, B. C. (2003). The Oil-Gas-Bearing Strata and the Structural Features in the Songliao Basin, NE China. J. Stratigr. 27 (4), 340–347. (in Chinese with English abstract). doi:10.1016/S0955-2219(02)00073-0
Sing, K. S. W. (2004). Characterization of Porous Materials: Past, Present and Future. Colloids Surfaces A Physicochem. Eng. Aspects. 241, 3–7. doi:10.1016/j.colsurfa.2004.04.003
Sing, K. S. W. (1985). Reporting Physisorption Data for Gas/solid Systems with Special Reference to the Determination of Surface Area and Porosity (Recommendations 1984). Pure Appl. Chem. 57 (4), 603–619. doi:10.1351/pac198557040603
Tan, J., Weniger, P., Krooss, B., Merkel, A., Horsfield, B., Zhang, J., et al. (2014). Shale Gas Potential of the Major Marine Shale Formations in the Upper Yangtze Platform, South China, Part II: Methane Sorption Capacity. Fuel 129, 204–218. doi:10.1016/j.fuel.2014.03.064
Tang, X., Jiang, Z., Huang, H., Jiang, S., Yang, L., Xiong, F., et al. (2016). Lithofacies Characteristics and its Effect on Gas Storage of the Silurian Longmaxi Marine Shale in the Southeast Sichuan Basin, China. J. Nat. Gas Sci. Eng. 28, 338–346. doi:10.1016/j.jngse.2015.12.026
Tang, Y., Yang, R., Zhu, J., Yin, S., Fan, T., Dong, L., et al. (2019). Analysis of Continental Shale Gas Accumulation Conditions in a Rifted Basin: A Case Study of Lower Cretaceous Shale in the Southern Songliao Basin, Northeastern China. Mar. Petroleum Geol. 101, 389–409. doi:10.1016/j.marpetgeo.2018.12.002
Tissot, B. P.(1984). Recent Advances in Petroleum Geochemistry Applied to Hydrocarbon Exploration. Bulletin 68 (5), 545–563. doi:10.1306/ad461336-16f7-11d7-8645000102c1865d
Wang, C., Feng, Z., Zhang, L., Huang, Y., Cao, K., Wang, P., et al. (2013). Cretaceous Paleogeography and Paleoclimate and the Setting of SKI Borehole Sites in Songliao Basin, Northeast China. Palaeogeogr. Palaeoclimatol. Palaeoecol. 385, 17–30. doi:10.1016/j.palaeo.2012.01.030
Wang, G., and Carr, T. R. (2012). Methodology of Organic-Rich Shale Lithofacies Identification and Prediction: a Case Study from Marcellus Shale in the Appalachian Basin. Comput. Geosciences. 49, 151–163. doi:10.1016/j.cageo.2012.07.011
Wang, H., Fan, T., and Wu, Y. (2015). The Subsurface Structure and Stratigraphic Architecture of Rift-Related Units in the Lishu Depression of the Songliao Basin, China. J. Asian Earth Sci. 99, 13–29. doi:10.1016/j.jseaes.2014.11.026
Wang, H., Shi, Z., Zhao, Q., Liu, D., Sun, S., Guo, W., et al. (2020). Stratigraphic Framework of the Wufeng-Longmaxi Shale in and Around the Sichuan Basin, China: Implications for Targeting Shale Gas. Energy Geosci. 1 (4), 124–133. doi:10.1016/j.engeos.2020.05.006
Wang, M., Xue, H., Tian, S., Wilkins, R. W. T., and Wang, Z. (2015). Fractal Characteristics of Upper Cretaceous Lacustrine Shale from the Songliao Basin, NE China. Mar. Petroleum Geol. 67, 144–153. doi:10.1016/j.marpetgeo.2015.05.011
Wang, P., Jiang, Z., Yin, L., Chen, L., Li, Z., Zhang, C., et al. (2017). Lithofacies Classification and its Effect on Pore Structure of the Cambrian Marine Shale in the Upper Yangtze Platform, South China: Evidence from FE-SEM and Gas Adsorption Analysis. J. Petroleum Sci. Eng. 156, 307–321. doi:10.1016/j.petrol.2017.06.011
Washburn, E. W. (1921). Note on a Method of Determining the Distribution of Pore Sizes in a Porous Material. Proc. Natl. Acad. Sci. U.S.A. 7 (4), 115–116. doi:10.1073/pnas.7.4.115
Wu, L., Hu, D., Lu, Y., Liu, R., and Liu, X. (2016). Advantageous Shale Lithofacies of Wufeng Formation-Longmaxi Formation in Fuling Gas Field of Sichuan Basin, SW China. Petroleum Explor. Dev. 43 (2), 208–217. doi:10.1016/S1876-3804(16)30024-6
Xi, Z., Tang, S., Wang, J., Yang, G., and Li, L. (2018a). Formation and Development of Pore Structure in Marine-Continental Transitional Shale from Northern China across a Maturation Gradient: Insights from Gas Adsorption and Mercury Intrusion. Int. J. Coal Geol. 200, 87–102. doi:10.1016/j.coal.2018.10.005
Xi, Z., Tang, S., Wang, J., Yi, J., Guo, Y., and Wang, K. (2018b). Pore Structure and Fractal Characteristics of Niutitang Shale from China. Minerals 8 (4), 163. doi:10.3390/min8040163
Xi, Z., Tang, S., Zhang, S., and Li, J. (2017). Nano-Scale Pore Structure of Marine-Continental Transitional Shale from Liulin Area, the Eastern Margin of Ordos Basin, China. J. Nanosci. Nanotechnol. 17 (9), 6109–6123. doi:10.1166/jnn.2017.14501
Yao, Y., Liu, D., Tang, D., Tang, S., and Huang, W. (2008). Fractal Characterization of Adsorption-Pores of Coals from North China: An Investigation on CH4 Adsorption Capacity of Coals. Int. J. Coal Geol. 73, 27–42. doi:10.1016/j.coal.2007.07.003
Yao, Y., Liu, D., Tang, D., Tang, S., Huang, W., Liu, Z., et al. (2009). Fractal Characterization of Seepage-Pores of Coals from China: An Investigation on Permeability of Coals. Comput. Geosciences. 35, 1159–1166. doi:10.1016/j.cageo.2008.09.005
Yin, S., Dong, L., Yang, X., and Wang, R. (2020b). Experimental Investigation of the Petrophysical Properties, Minerals, Elements and Pore Structures in Tight Sandstones. J. Nat. Gas Sci. Eng. 76, 103189. doi:10.1016/j.jngse.2020.103189
Yin, S., and Wu, Z. (2020). Geomechanical Simulation of Low-Order Fracture of Tight Sandstone. Mar. Petroleum Geol. 117, 104359. doi:10.1016/j.marpetgeo.2020.104359
Zhao, W. Z., Li, J. Z., Yang, T., Wang, S. F., and Huang, J. L. (2016). Geological Difference and its Significance of Marine Shale Gases in South China. Petroleum Explor. Dev. 43 (4), 499–510. (in Chinese with English abstract). doi:10.1016/S1876-3804(16)30065-9
Zhao, Z., Wu, K., Fan, Y., Guo, J., Zeng, B., and Yue, W. (2020). An Optimization Model for Conductivity of Hydraulic Fracture Networks in the Longmaxi Shale, Sichuan Basin, Southwest China. Energy Geosci. 1 (1–2), 47–54. doi:10.1016/j.engeos.2020.05.001
Keywords: Shahezi Formation, pore structure, continental shale, shale lithofacies, shale gas
Citation: Xu W, Yang G, Li A, Song Z and Hu W (2022) Determination of Favorable Lithofacies for Continental Shale Gas: A Case Study of the Shahezi Formation, Changling Fault Depression, Songliao Basin. Front. Earth Sci. 10:916326. doi: 10.3389/feart.2022.916326
Received: 09 April 2022; Accepted: 09 May 2022;
Published: 13 June 2022.
Edited by:
Hu Li, Southwest Petroleum University, ChinaReviewed by:
Xinlu Yan, Taiyuan University of Technology, ChinaCopyright © 2022 Xu, Yang, Li, Song and Hu. This is an open-access article distributed under the terms of the Creative Commons Attribution License (CC BY). The use, distribution or reproduction in other forums is permitted, provided the original author(s) and the copyright owner(s) are credited and that the original publication in this journal is cited, in accordance with accepted academic practice. No use, distribution or reproduction is permitted which does not comply with these terms.
*Correspondence: Guoqiao Yang, eWFuZ2d1b3FpYW8uc3lreUBzaW5vcGVjLmNvbQ==; Ang Li, bGlhbmcyMDIwQGpsdS5lZHUuY24=
Disclaimer: All claims expressed in this article are solely those of the authors and do not necessarily represent those of their affiliated organizations, or those of the publisher, the editors and the reviewers. Any product that may be evaluated in this article or claim that may be made by its manufacturer is not guaranteed or endorsed by the publisher.
Research integrity at Frontiers
Learn more about the work of our research integrity team to safeguard the quality of each article we publish.