 Xiangang Jiang1,2*
 Qin Huang1Zongliang Zhang3Luis E. Vallejo4
 Xiaoqing Chen5Wanyu Zhao5Hongyan Deng6Xingrong Liu7Danqing Song8Zhuo Chen1
- 1College of Civil Engineering, Sichuan Agricultural University, Dujiangyan, China
- 2Sichuan Higher Education Engineering Research Center for Disaster Prevention and Mitigation of Village Construction, Sichuan Agricultural University, Dujiangyan, China
- 3HYDROCHINA Kunming Engineering Corporation, Kunming, China
- 4Department of Civil and Environmental Engineering, University of Pittsburgh, Pittsburgh, PA, United States
- 5Key Laboratory of Mountain Hazards and Surface Process, Institute of Mountain Hazards and Environment, CAS, Chengdu, China
- 6College of Civil Engineering, Southwest Jiaotong University, Chengdu, China
- 7Geological Hazards Prevention Institute, Gansu Academy of Sciences, Lanzhou, China
- 8State Key Laboratory of Hydroscience and Engineering, Department of Hydraulic Engineering, Tsinghua University, Beijing, China
Clay particles have an important influence on the cracking of clay–sand mixture, but the quantitative relationships between the clay content and crack evolution of the clay–sand mixture are still not clear. In order to explore the crack evolution process of the clay–sand mixture under different clay content conditions, we prepared nine groups of saturated clay–sand mixture samples with different clay contents and carried out drying experiments and Brazilian tests. The geometric dimensions and development forms of soil cracking were quantitatively analyzed by taking pictures of the sample cracks, image processing, and weighing the variation of the soil mass at the corresponding time during the drying process. The results showed that when the clay content was greater than 50%, the development process of the clay–sand mixture cracks can be divided into three stages: the formation stage of main cracks, the generation stage of the autonomously derived secondary fractures, and the stage of cracks widening. When it was less than 50%, the cracks in the development process of clay–sand mixture cracks had the characteristics of short length, dense crack spacing, no main cracks, and no obvious stage. The clay could add the tensile strength of the mixture and restrain crack development. The clay content had a significant effect on the shrinkage cracking and crack development process of soil, which shows that with the increase in the clay content, the tensile strength increases and restrains the crack development; the crack rate increases continuously and the width of cracks become larger; the lower the clay content, the lower is the crack rate and the smaller is the average crack width. The water content of samples with different clay soil contents all nonlinearly decreased with the increase in drying time, and the corresponding residual water content increased with the increase in the clay soil content at the same time. The water content of initial cracking, stable crack length, stable crack width, and stable block of the clay–sand mixture increased with the increase in the clay content, and the water content of the stable crack length was the same as that of the stable block number.
1 Introduction
When the soil loses water during the drying process, it shrinks and generates cracks on the surface of the soil. The generation of cracks would change the structure of the soil, increase the permeability of the soil, and greatly reduce the strength and stability of the soil, which causes various geological engineering problems and natural disasters (Morris et al., 1992; Albrecht and Benson, 2001; Tang et al., 2008; Ma et al., 2020; Liu et al., 2021; Yang et al., 2022).
Many researchers studied the characteristics of soil cracks from different aspects. In the aspect of crack geometry characteristics and evolution, Baer et al. (2009) analyzed the crack morphology and crack surface variation characteristics of silt loam based on the fractal theory, providing a method to quantify soil cracks, and their patterns considered fractal dimension; Miller et al. (1998) introduced a crack strength factor which can describe the development process of soil surface cracks quantitatively; Vogel et al. (2005a) and Vogel et al. (2005b) stated that the Minkowski function is a useful function to investigate the development modes of soil cracks quantitatively; Yuan and Yin (2004) used the remote optical microscope and made a quantitative analysis of the crack evolution law through the gray entropy of the crack image; Liu et al. (2013) developed a computer image processing method to describe the number of crack intersection nodes, length, number of cracks, number of blocks, block area, and crack rate of cracks. In terms of the causes and influencing factors, scholars believe that the occurrence of cracks in clay soil has a certain relationship with soil shrinkage. When soil shrinkage is inhibited or the surface tensile stress exceeds the cohesive strength between soil particles, cracks are prone to occur (Towner, 1987; Fleureau et al., 2015). Morris et al. (1992) found that some parameters of the soil, such as compressive modulus, Poisson’s ratio, shear strength, and tensile strength, have a certain influence on the development and growth of soil cracks; Wang et al. (2017) indicated that with the increase in the dry-wet cycle, the crack rate and mean crack width also decreased; by drying experiments of lean clay, Zeng et al. (2019) and Zeng et al. (2020) found that the total length of cracks increases with the increase in interface roughness, and the total length of cracks decreases with the increase in soil thickness; Tang et al. (2008) analyzed the geometric characteristics of clayey soil cracks at different temperatures and considered that the crack rate, crack width, and crack length increase with the increasing temperature, and the shapes of the crack intersection notes were generally “+” and “T”. However, the aforementioned studies were mostly focused on cohesive soil, and the mixtures which are common in nature and engineering fields were rare to report.
Fine and coarse particle mixtures are a type of common soil composed of coarse particles, such as block stones, gravel, and sand and fine particles, such as silt, sand, and clay (Medley, 2001). Under the change in external environments, such as temperature changes, cracks often appear in the mixture, which affects the soil’s structure, strength, and seepage characteristics. The fine particle content in mixed soil is one of the decisive factors affecting their properties, which has been widely concerned by researchers (Sridharan and Prakash, 1998; Vallejo and Mawby, 2000; Vallejo, 2001; Chik and Vallejo, 2005; Ouyang and Takahashi, 2015; Guo and Cui, 2020). Although there are abundant research studies on the relationships between fine particle content and the strength, permeability, and pore change of mixed soil (Vallejo, 2001; Rahardjo et al., 2008), there is still a lack of relevant research on how the content of clay affects the development of cracks in mixed soils and the relationship between the content of clay and the geometry parameters of cracks.
This article aimed to explore the crack process and evolution characteristics of mixtures with different clay contents. The mixture of clay and quartz sand was selected as the research object. In this study, drying experiments and Brazilian tests were conducted. The Brazilian tests were designed to get the tensile strengths of different clay contents and how the clay contents help the crack development. Through the drying experiments, first, the evolution process and morphology of the geometric size of the surface cracks during the drying process of the soil were analyzed. Second, the quantitative relationships between the clay soil content and tensile strength and soil crack parameters (such as crack rate, crack length, and crack width) are studied with drying experiments and Brazilian tests. Finally, the influence of water content change during the crack development process was discussed.
2 Experimental Materials and Methods
2.1 Experimental Materials and Preparation
The clay mineral component used in this experiment is kaolinite, which is one of the main mineral components of clay. The experimental material was the mixed soil of clay and quartz sand. The clay content of the artificially prepared material was 100, 90, 80, 70, 60, 50, 40, 30, 20, and 10%, and the corresponding sample number was S1–S10. The Malvern particle size analyzer was used to investigate the size distribution of fine particle mixtures, and the screening device was used to achieve the size distribution of sands. The particle grading curve of the experimental material is shown in Figure 1.
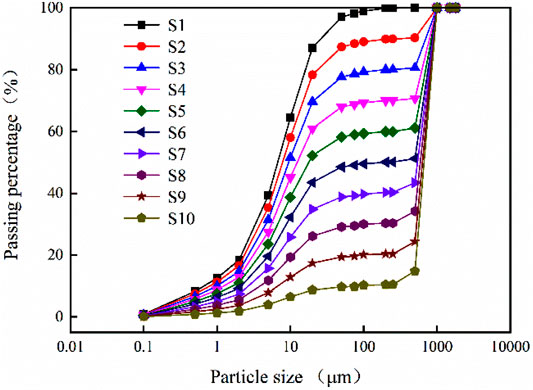
FIGURE 1. Particle size distribution.
The preparation process of the materials for the drying experiment is as follows. First, clay particles and quartz sands were dried up. Second, the corresponding mass was weighed according to the design requirements, and the clay and quartz sands were mixed evenly. The prepared mixed soil was put into a circular container with a diameter of 200 mm, and the thickness of the sample was 10 mm. The surface of the circular container was covered with a filter paper larger than the diameter of the container, and it was bound to the container with rubber reinforcement. Then, the container with the sample was placed in the distilled water cooled after boiling, and the water was ensured to overflow the top of the vessel. In this way, water could enter the container through a filter paper covering the surface of the container. The sample was placed in water for 72 h to saturate the sample. It was reported that 40°C is the global average maximum temperature (Middel et al., 2014), and at such temperature, the soil in the field would dry the fastest naturally. Therefore, 40°C was selected as the experimental temperature. During the drying process, the sample was weighed and photographed until the crack remained stable.
For Brazilian tests, the experimental materials were prepared the same way as the drying experiments. For soil sample preparation before Brazilian tests, the material was mixed with some water, and the water content was 8.3%.
2.2 Image Processing Method
Photographs were taken for soil cracks during the drying process, and the photographs were processed through image processing software to get crack geometry parameters. The processing steps are as follows: first, the photographs were preliminarily cut through the image processing software to make the image size 1,200 × 1,200 (pixels). Second, we created the image by binarization and skeletonization. Finally, according to the crack images after binarization and skeletonization, the crack rate, crack length, average crack width, and other parameters were calculated. In the analysis process, the processed image is expressed in the form of pixel value, and the relationship between the pixel value and the actual size of the image is as follows (Luo et al., 2020):
where Ai0 and Li0 are the crack pixel area and crack pixel length of the specimen, respectively; Ai and Li are the actual crack area and actual crack length area, respectively; βi1 is the area conversion coefficient; βi2 is the length conversion coefficient; A1 is the actual initial surface area of the sample, which is 31,400 mm2 in the test; A10 is the initial pixel area in the sample image; Rs is the crack rate of the sample, and
2.3 Method of Brazilian Test
Brazilian test is the most common method for determining the tensile strength of soils. The test is an indirect tensile strength test method, also called the radial-splitting test. In this test, a cylindrical specimen was placed horizontally between compression plates (Jiang et al., 2015). One batten was put above, and one was put below the specimen, which is used to distribute the applied load evenly along the entire length, as shown in Figure 2. In order to cause tensile radial failure in the specimen, load was applied on the top of the batten. At that moment, the lateral stress along the diameter is the tensile strength of the specimen with elasticity theory. The tensile strength σt is obtained using the following relationship:
where Q is the applied load, N; D is specimen diameter, m; and L is the specimen length, m.
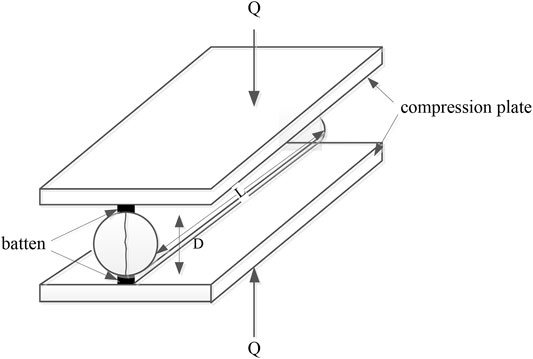
FIGURE 2. Radial-splitting test method.
3 Experimental Results
3.1 Development Process of Cracks
Figure 3 and Figure 4 show the timing of drying time from sample drying. We found that the development process and shape of the cracks are related to the clay content from the experiments. When the clay content was less than 30%, there were few cracks or no cracks on the surface of the soil sample (take sample S9 as an example) (Figure 3). When the clay content was more than or equal to 30% and less than or equal to 50%, the development process of cracks was basically the same. It is shown that with the continuous drying, short and small cracks appeared at the specimen boundary first. Then, the cracks on the specimen surface developed from the boundary to the center of the specimen, and the cracks stopped growing when cracks intersect with other cracks. For all cracks, their lengths were short, and there was no main crack in the soil.
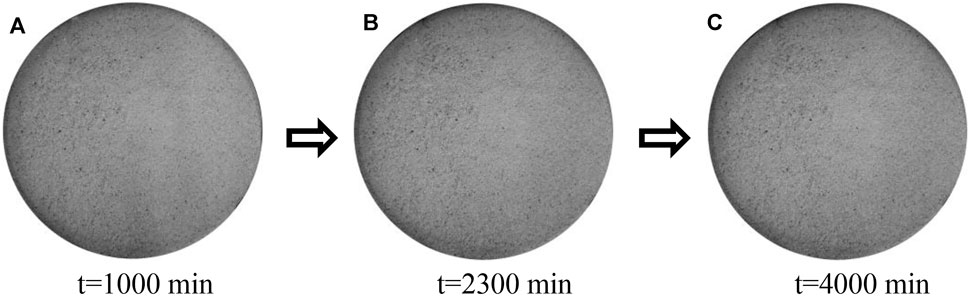
FIGURE 3. Surface crack development process of the soil sample (clay content of 20%). (A) t=1000 min, (B) t=2300 min, and (C) t=4000 min.
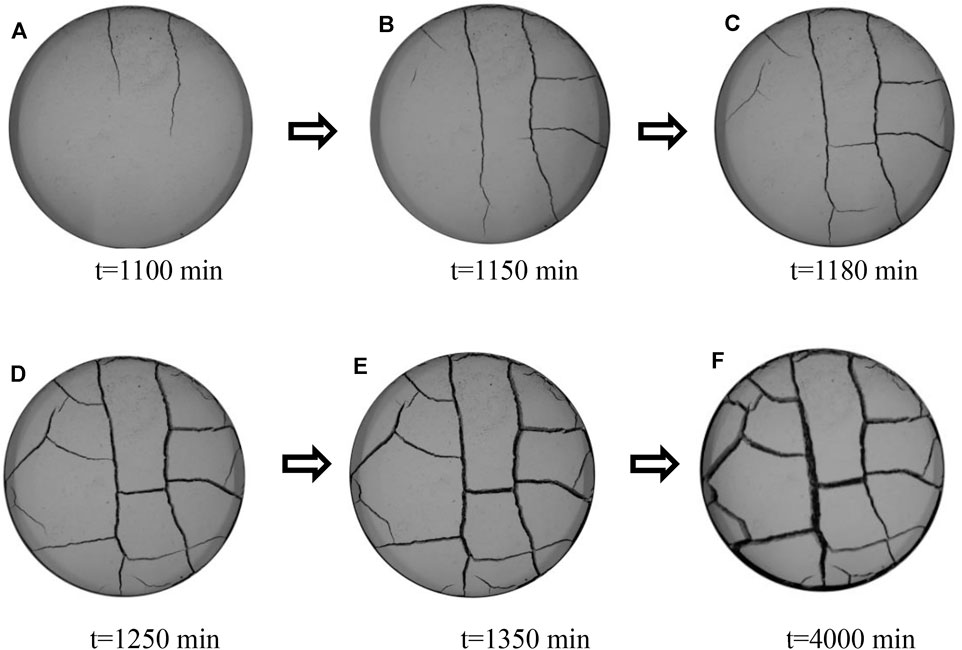
FIGURE 4. Surface crack development process of the soil sample (clay content of 80%). (A) t=1100 min, (B) t=1150 min, (C) t=1180 min, (D) t=1250 min, (E) t=1350 min, and (F) t=4000 min.
When the clay content was more than 50%, the formation and development process of cracks were basically similar and could be divided into three stages. This takes sample S3 as an example to illustrate, which is shown in Figure 4.
The first stage: the formation stage of the main crack. With the drying of the sample, cracks first appeared around the boundary of the sample and whose number was little, that is, generally one or two. Then, the crack tip extended to the center of the sample and continued to grow through the center of the soil until the crack tip reached the boundary of the soil sample. These kinds of first-formed cracks were the main cracks, and these cracks divided the soil into several blocks (Figures 4A and B).
The second stage: the stage of self-derived secondary cracks. After the main cracks passed through the whole soil sample, new cracks were generated from the main crack and extended to the periphery of the sample, and the direction was approximately perpendicular to the main crack (Figures 4C and D). These self-derived new cracks are called secondary cracks, which will divide the primary block into more secondary blocks until they are intersected with adjacent cracks perpendicularly, and then stop growing. With the development of drying, more new cracks may emerge from the secondary cracks and divide the secondary blocks into smaller blocks. In this stage, the variation of crack width was small, but the length of the cracks increased rapidly. In addition, the number of blocks did not change after the length of cracks stopped growing.
The third stage: The stage of cracks widening. As the drying time continued, the crack length did not develop, and there were no new cracks. The number, shape, and development direction of the cracks did not change. The cracks only gradually widened and finally stabilized until the end of drying, as shown in Figures 4E and F. When the experiments finished, the width and length of the main cracks were wider and longer than the secondary cracks.
3.2 Crack Development Mode
The crack development process of each sample was recorded by photographs, which can be processed with image processing software. Figure 5 shows the morphological characteristics of cracks. It can be seen that the cracks of the S1–S5 sample are almost straight-line, while the cracks of the S6–S8 sample are mostly arc with relatively few straight lines. The mutual cracks of samples with different clay content all show a “T” shape, and the intersection angle between cracks is mostly 90°. The separated blocks are mostly triangle, quadrilateral, pentagon, and hexagon, especially since most of the blocks are quadrilateral. From the Figures S1(a), S2(a), S3(a), S4(a), S5(a), S6(a), S7(a), S8(a), it can be seen that at the initial time, with the decreasing of clay content, the cracks of the samples become shorter and thinner, and the crack width becames smaller. As the drying time increased, new cracks were generated from both the specimen boundary and the initial cracks, and the original blocks were divided [Figure 5 S1–S8 (b-c)]. The number and shape of the blocks were unchanged when the fracture length became stable [Figure 5 S1–S8(d)]. Figure 5D shows that when the clay content is 100%, the block separated by cracks around the boundary of the specimen is dominated by a triangle, and the blocks inward the center are mainly quadrilateral. When the clay contents were 50, 60, 70, 80, and 90%, there are two forms of shapes of triangle and quadrangle around the boundary of the specimen, and the interior is still dominated by a quadrilateral. Moreover, when the clay content is 50–100%, the number of blocks increases with decrease of the clay content. When the clay content is less than 50%, the number decreased, and the block shape around the sample is irregular and difficult to identify. However, the block shape inside the sample was mostly quadrilateral, and the cracks are approximately arc.
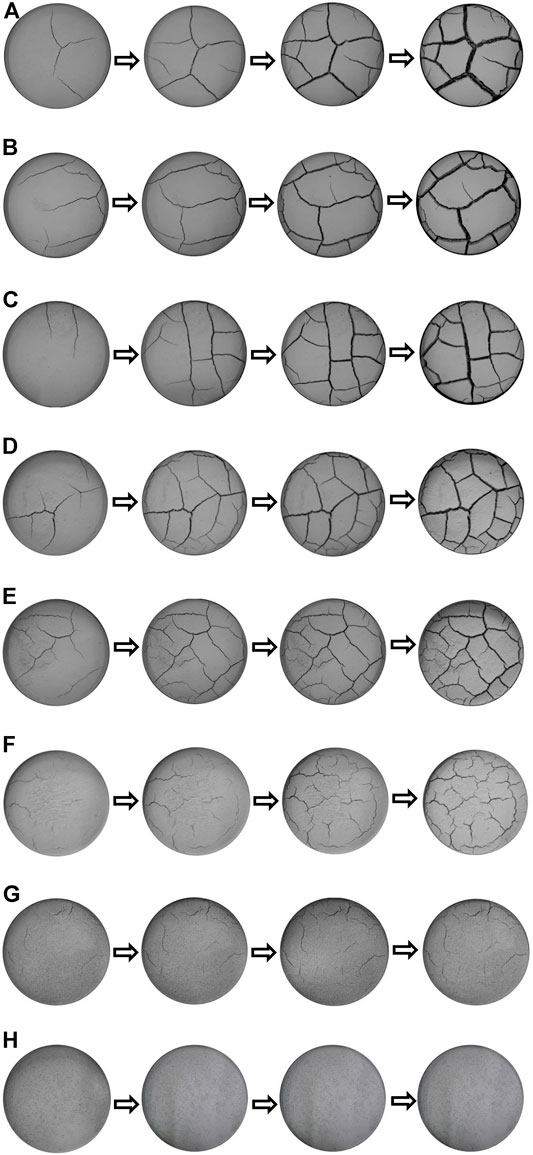
FIGURE 5. Crack images of different clay content samples at different stages [(A–H) refers to clay content samples: 100, 90, 80, 70, 60, 50, 40, and 30%].
3.3 Characteristics of the Crack Geometry Size and Tensile Strength for Different Clay Contents
The geometric parameters of cracks with different clay soil contents are shown in Figure 6. The figure indicates that, in the initial stage, the soil samples with higher clay contents (80–100%) basically did not produce cracks, and while the clay content was lower (except 20% clay content of the sample, as it did not crack), such as 30–70%, the cracks had started to generate. This means that the clay soil content has an inhibitory effect on the crack’s generation (Figure 6A). From the crack development process, the crack rate increased with the development of time, especially before 1,350 min, and the crack rate first increased and then decreased with the increase in the clay content, and the critical clay content was 70%. After 1,350 min, there was a monotonic relationship between the crack rate and the clay content (Figure 6A). After the crack finish development, the crack rate of the sample with the highest clay soil content was 15.22%, while the crack rates of the sample with the clay content decreasing, in turn, were 13.43, 11.64, 9.28, 7.51, 4.68, 1.91 and 0.01%, respectively. It indicated that the crack rate increases with the increase in the clay content, and the clay content has a promoting effect on the final crack area (Figure 6A). Moreover, there is a linear relationship between the crack rate and the clay content at the final moment. Figure 6B shows the change curve of the total crack length under different clay content conditions. It can be seen from the figure that the crack length decreases with the increase in the clay content. In the period of 550 and 1,050 min, the total crack length decreased the fastest between 70 and 80% clay content. In addition, after the cracks were stable, the crack length increased first and then decreased with the decrease in the clay content.
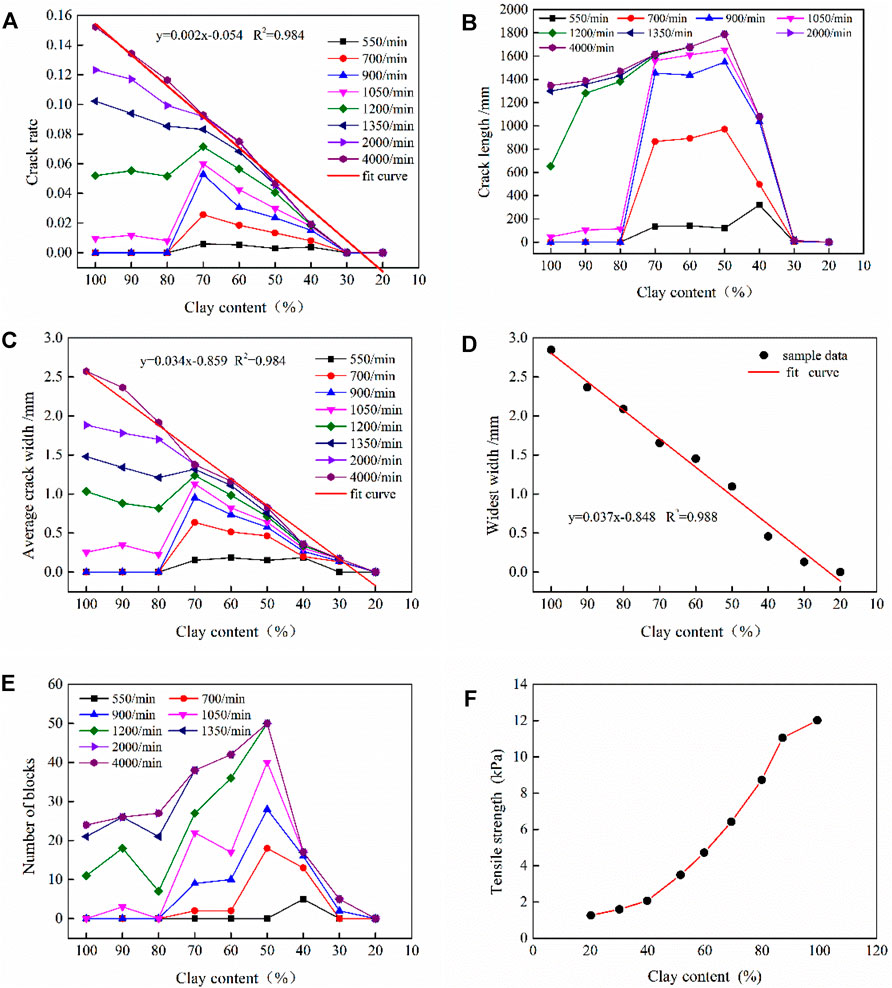
FIGURE 6. Relationship between the crack parameter and tensile strength and clay content: (A) relationship between the crack rate and clay content. (B) Relationship between the crack length and clay content. (C) Relationship between the average crack width and clay content. (D) Relationship between the maximum crack width and clay content. (E) Relationship between the number of blocks and clay content. (F) Relationship between the tensile strength and clay content.
Figure 6C shows the average width variation curve of the cracks with different soil clay contents. It can be seen that the various characteristics of the average crack width are consistent with that of the crack rate with clay content. In addition, there is a linear relationship between the average crack width and the clay content. The curve of the maximum crack width of the sample shows that after the completion of the drying experiments, the maximum crack width of the sample with the most clay soil content is 2.84 mm, and the maximum crack width of the sample with the least clay soil content is 0.13 mm. It indicated that the maximum crack opening degree of the sample is obviously affected by the clay content. In addition, Figure 6D shows a significant linear correlation between the clay content and maximum crack width. The variation curve of the number of sample blocks with different clay soil contents (Figure 6E) shows that during the whole process of crack development, the number of blocks of the soil is the most with a clay content of 50% and the minimum number of blocks with a clay content of 30%. It means that with the increase in the content of clay soil, the number of soil blocks separated by cracks increase first and then decrease. In particular, a clay content of 50% is the inflection point (Figure 6E).
Figure 6F shows the relationship between tensile strength and clay content. It indicates that the tensile strength increases with the increase in the clay content. Combined with the abovementioned results, this figure demonstrates that the clay adds tensile strength to the mixtures, which helps the samples to develop no cracks.
3.4 Variation of the Water Content in the Cracking Process of Mixed Soil and Its Influence on Crack Development
The relationships between the water content and time for different clay contents are shown in Figure 7. It can be seen from the figure that the water content of the samples with different clay contents decreases non-linearly with the increase in drying time. Moreover, the higher the clay content, the greater was the remained water content at the same time during the drying process. Corresponding to the geometric parameters of the crack mentioned in Section 3.3, this section selects the water content at the first crack occurred time (w1), water content when the length of the crack reaches its maximum value (w2), water content when the width of the crack reaches its maximum value (w3), and water content when the number of blocks reaches its maximum value (w4). These parameters reflect the characteristics of water content in the process of crack development. Figure 7 shows that the w1 of S1–S8 samples are 45.92, 42.02, 36.19, 35.62, 30.73, 26.45, 23.17, and 13.24%, respectively. It indicates that the w1 increases with the increase in the clay content. It reflects that w1 is greatly affected by the clay content. For S1–S8 samples, the w2 values were 32.20, 23.50, 17.31, 16.52, 13.68, 11.97, 9.28 and 4.38%, respectively. It means that w2 increases with the increase in the clay soil content. The figure shows the clay of 70% is the critical clay content for the difference between w2 and w1. When the clay content is greater than or equal to 70%, the difference decreases with the increase in the clay content; otherwise, the difference increases with the increase of the clay content. In addition, the w4 is the same as w2. It indicates that when the crack length is stable, the number of blocks separated by the crack is basically stable. From the moment when the crack width is stable, the w3 for the highest clay content is 2.01%, while w3 values with the clay content decreasing, in turn, were 1.85, 1.56, 1.34, 1.27, 1.19, 1.08 and 0.98%. It means the difference of w3 for different clay contents is not much.
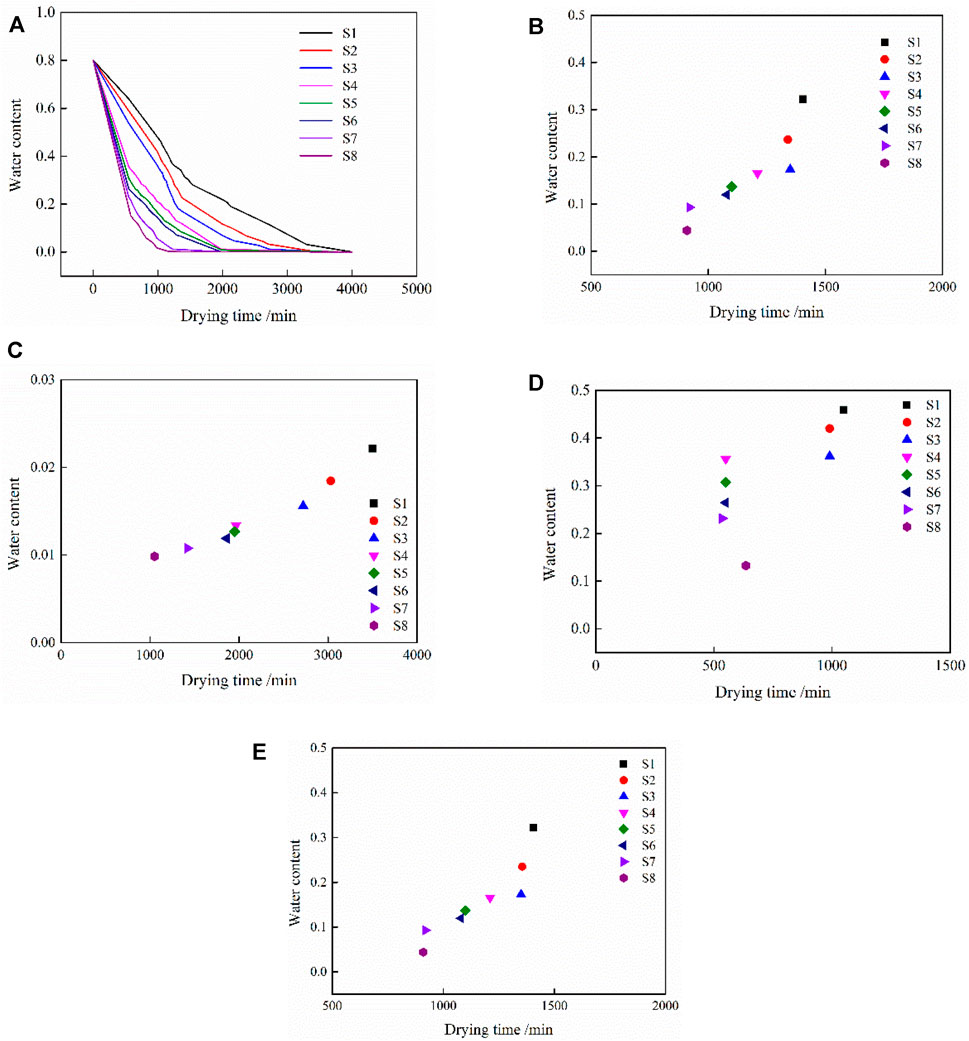
FIGURE 7. Variation of the water content during the drying process: (A) Relationship between the water content and drying time for different materials. (B)Relationship between water content and time for different materials when the number of blocks was stable. (C) Relationship between the water content and time for different materials when the width of crack was stable. (D) Relationship between the water content and time for different materials when the first crack occurred. (E)Relationship between water content and time for different materials when the length of crack was stable.
4 Discussion and Conclusion
In this study, the development process and morphology of soil cracks under different clay soil contents were analyzed by drying experiments. In particular, with image processing software, the geometric dimensions of the cracks were quantitatively analyzed. In this study, the clay particles mainly consisted of kaolin minerals. In such a way, the previous results may be applicable to the kaolin minerals. In addition, the montmorillonite mineral is also one kind of clay mineral in nature. Although the montmorillonite mineral was not considered in this study, the results of other researchers have shown that the results in this study are applicable to the montmorillonite mineral. For example, the intersection angle between cracks in soils is both 90°, and the cracks are both mainly vertically intersected during the drying process for the montmorillonite and kaolin minerals (Tang et al., 2010; Tang et al., 2011; Costa et al., 2013). Also, after the crack development and stability, there is a linear relationship between the crack rate and clay content for both the montmorillonite mineral and the kaolin mineral (Xia et al., 2016). However, there are some differences during the process of fracture evolution for montmorillonite and kaolin. For example, the residual water content for the first crack that occurred for montmorillonite is higher than that of kaolin (El Hajjar et al., 2019). The main reason is that there is a large hydrated part in the form of bound water for the matrix of montmorillonite. This requires a temperature of 200°C to evaporate and crystalline water that does not leave the paste until temperatures above 550°C (Wakim, 2005). During the drying process, the montmorillonite has a greater influence on the shrinkage limit water content and shrinkage limit suction of soil than that of kaolin (Fleureau et al., 2015). This difference may lead to different sizes of cracks during the process of the crack development for the two clay minerals.
The conclusions are as follows:
1) For samples with clay content less than 30%, there are about no cracks on the surface of the soil sample. For samples with clay content greater than 50%, the formation and development of cracks are divided into three stages. The first stage is mainly the formation and elongation of the main crack; the second stage is mainly the formation of secondary cracks, and new secondary cracks are derived from secondary cracks; the third stage is mainly the crack width widening tends to be stable. For samples with the clay soil content more than or equal to 30% and less than or equal to 50%, the formation and development of cracks have no stage characteristics. The cracks are generated from the perimeter and develop to the center of the sample, and there are no main cracks, the length of the crack is short, and the spacing is small.
2) The clay content has a significant influence on the crack form. When the clay content is high, the cracks show a straight-line shape, and when the clay soil content is less, the cracks are mostly in the form of arc-shape. The internal cracks in the soil with different clay contents are mainly quadrilateral. When the clay contents are 100%, 50%–90%, and less than 50%, the shape of the block around the soil is mainly trilateral, trilateral and quadrilateral, and irregular, respectively. The clay content could restrain the crack development by increasing the tensile strength of soils.
3) The clay content has an inhibitory effect on the initial time of sample cracking. With the increase in the clay soil content, the maximum crack width, the average crack width, and the crack rate increase. When the cracks are stable, there is a linear relationship between the crack rate, average crack width, maximum crack width, and clay soil content; when the clay content is between 100 and 50%, the crack length increases with the decrease in the clay content, while the total length of cracks between 50 and 30% decreases with the decrease in the clay content.
4) During the drying process, the mixed soil samples with higher clay soil content have higher remained water content at the same time. The water content responding to the moment of initial cracking, the crack length, width, and the block unchanged increases with the increasing of the clay content. The remained water content of soils when the number of block stable reached its maximum value is the same as that of when the length of the crack reached its maximum value.
Data Availability Statement
The original contributions presented in the study are included in the article, further inquiries can be directed to the corresponding author.
Author Contributions
XJ and QH designed this research and drafted the manuscript. ZZ and LV helped with the language. XC, WZ, HD, XL, DS, and ZC provided ideas and discussion throughout the progress. All authors have read and agreed to the published version of the manuscript.
Funding
This work was supported by the National Natural Science Foundation of China (Grant No. U19A2049), the Second Tibetan Plateau Scientific Expedition and Research Program (Grant No. 2019QZKK0906), the National Natural Science Foundation of China (Grant Nos. 42177149 and 41925030), Gansu Province’s 2021 Key Talent Project (Grant No. 2021RCXM066), and the Gansu Academy of Sciences Applied Research and Development Project (Grant No. 2021JK-07).
Conflict of Interest
ZZ was employed by the company HYDROCHINA Kunming Engineering Corporation.
The remaining authors declare that the research was conducted in the absence of any commercial or financial relationships that could be construed as a potential conflict of interest.
Publisher’s Note
All claims expressed in this article are solely those of the authors and do not necessarily represent those of their affiliated organizations, or those of the publisher, the editors, and the reviewers. Any product that may be evaluated in this article, or claim that may be made by its manufacturer, is not guaranteed or endorsed by the publisher.
References
Albrecht, B. A., and Benson, C. H. (2001). Effect of Desiccation on Compacted Natural Clays. J. Geotech. Geoenviron. Eng. 127 (1), 67–75. doi:10.1061/(asce)1090-0241(2001)127:1(67)
Baer, J. U., Kent, T. F., and Anderson, S. H. (2009). Image Analysis and Fractal Geometry to Characterize Soil Desiccation Cracks. Geoderma 154 (1-2), 153–168. doi:10.1016/j.geoderma.2009.10.008
Chik, Z., and Vallejo, L. E. (2005). Characterization of the Angle of Repose of Binary Granular Materials. Can. Geotech. J. 42 (2), 683–692. doi:10.1139/t04-118
Costa, S., Kodikara, J., and Shannon, B. (2013). Salient Factors Controlling Desiccation Cracking of Clay in Laboratory Experiments. Géotechnique 63 (1), 18–29. doi:10.1680/geot.9.p.105
El Hajjar, A., Ouahbi, T., Eid, J., Taibi, S., Bouchemella, S., and Eid, J. (2019). “Desiccation and Cracking Behaviour of Clayey Soils: Experimental Characterization and Mechanisms Identification,” in Soil Mechanics Geotech Eng, ECSMGE. Reykjavik, Iceland 1st - 6th of September 2019. doi:10.32075/17ECSMGE-2019-0998
Fleureau, J. M., Wei, X., Ighil-Ameur, L., Hattab, M., and Bicalho, K. V. (2015). Experimental Study of the Cracking Mechanisms of Clay during Drying. Proceedings of the 15th Pan-American Conference on Soil Mechanics and Geotechnical Engineering, Buenos Aires, Argentina. 2101-2108. Stand Alone, 2101–2108. doi:10.3233/978-1-61499-603-3-2101
Guo, C., and Cui, Y. (2020). Pore Structure Characteristics of Debris Flow Source Material in the Wenchuan Earthquake Area. Eng. Geol. 267 (1), 105499. doi:10.1016/j.enggeo.2020.105499
Jiang, X., Cui, P., and Ge, Y. (2015). Effects of Fines on the Strength Characteristics of Mixtures. Eng. Geol. 198, 78–86. doi:10.1016/j.enggeo.2015.09.011
Liu, C., Tang, C.-S., Shi, B., and Suo, W.-B. (2013). Automatic Quantification of Crack Patterns by Image Processing. Comput. Geosci. 57, 77–80. doi:10.1016/j.cageo.2013.04.008
Liu, Z., Qiu, H., Ma, S., Yang, D., Pei, Y., Du, C., et al. (2021). Surface Displacement and Topographic Change Analysis of the Changhe Landslide on September 14, 2019, China. Landslides 18 (4), 1471–1483. doi:10.1007/s10346-021-01626-4
Luo, Z. G., Wang, S. J., Zhang, J. W., and Yang, Z. B. (2020). Thickness Effect on Crack Evolution of Expansive Soil. J. Geotech. Eng. 42 (10), 1922–1930. (in Chinese). doi:10.11779/CJGE202010018
Ma, S., Qiu, H., Hu, S., Yang, D., and Liu, Z. (2020). Characteristics and Geomorphology Change Detection Analysis of the Jiangdingya Landslide on July 12, 2018, China. Landslides 18, 383–396. doi:10.1007/s10346-020-01530-3
Medley, E. W. (2001). Orderly Characterization of Chaotic Franciscan Melanges. Eng. Geol. 19 (4), 20–32.
Middel, A., Häb, K., Brazel, A. J., Martin, C. A., and Guhathakurta, S. (2014). Impact of Urban Form and Design on Mid-Afternoon Microclimate in Phoenix Local Climate Zones. Landsc. Urban Plan. 122, 16–28. doi:10.1016/j.landurbplan.2013.11.004
Miller, C. J., Mi, H., and Yesiller, N. (1998). Experimental Analysis of Desiccation Crack Propagation in Clay Liners. J. Am. Water Resour. Assoc. 34 (3), 677–686. doi:10.1111/j.1752-1688.1998.tb00964.x
Morris, P. H., Graham, J., and Williams, D. J. (1992). Cracking in Drying Soils. Can. Geotech. J. 29 (2), 263–277. doi:10.1139/t92-030
Ouyang, M., and Takahashi, A. (2015). Influence of Initial Fines Content on Fabric of Soils Subjected to Internal Erosion. Can. Geotech. J. 53 (2), 299–313. doi:10.1139/cgj-2014-0344
Rahardjo, H., Indrawan, I. G. B., Leong, E. C., and Yong, W. K. (2008). Effects of Coarse-Grained Material on Hydraulic Properties and Shear Strength of Top Soil. Eng. Geol. 101 (3-4), 165–173. doi:10.1016/j.enggeo.2008.05.001
Sridharan, A., and Prakash, K. (1998). Characteristic Water Contents of a Fine-Grained Soil-Water System. Géotechnique 48 (3), 337–346. doi:10.1680/geot.1998.48.3.337
Tang, C.-S., Shi, B., Liu, C., Suo, W.-B., and Gao, L. (2011). Experimental Characterization of Shrinkage and Desiccation Cracking in Thin Clay Layer. Appl. Clay Sci. 52 (1-2), 69–77. doi:10.1016/j.clay.2011.01.032
Tang, C. S., Cui, Y. J., Tang, A. M., and Shi, B. (2010). Experiment Evidence on the Temperature Dependence of Desiccation Cracking Behavior of Clayey Soils. Eng. Geol. 114 (3-4), 261–266. doi:10.1016/j.enggeo.2010.05.003
Tang, C. S., Shi, B., Liu, C., Zhao, L. Z., and Wang, B. J. (2008). Influencing Factors of Geometrical Structure of Surface Shrinkage Cracks in Clayey Soils. Eng. Geol. 101 (3-4), 204–217. doi:10.1016/j.enggeo.2008.05.005
Towner, G. D. (1987). The Mechanics of Cracking of Drying Clay. J. Agric. Eng. Res. 36 (2), 115–124. doi:10.1016/0021-8634(87)90118-1
Vallejo, L. E. (2001). Interpretation of the Limits in Shear Strength in Binary Granular Mixtures. Can. Geotech. J. 38 (5), 1097–1104. doi:10.1139/t01-029
Vallejo, L. E., and Mawby, R. (2000). Porosity Influence on the Shear Strength of Granular Material-Clay Mixtures. Eng. Geol. 58 (2), 125–136. doi:10.1016/s0013-7952(00)00051-x
Vogel, H. J., Hoffmann, H., Leopold, A., and Roth, K. (2005b). Studies of Crack Dynamics in Clay Soil: II. A Physically Based Model for Crack Formation. Geoderma 125 (3-4), 213–223. doi:10.1016/j.geoderma.2004.07.008
Vogel, H. J., Hoffmann, H., and Roth, K. (2005a). Studies of Crack Dynamics in Clay Soil: I. Experimental Methods, Results, and Morphological Quantification. Geoderma 125 (3-4), 203–211. doi:10.1016/j.geoderma.2004.07.009
Wakim, J. (2005). Influence des solutions aqueuses sur le comportement mécanique des roches argileuses. France, Paris: ThȲse de l’ȁcole Nationale SupȲrieure des Mines de Paris.
Wang, C., Zhang, Z.-Y., Liu, Y., and Fan, S.-M. (2017). Geometric and Fractal Analysis of Dynamic Cracking Patterns Subjected to Wetting-Drying Cycles. Soil Tillage Res. 170, 1–13. doi:10.1016/j.still.2017.02.005
Xia, D. S., Liu, Q. B., Xiang, W., Wang, J. E., and Ai, M. (2016). Impact of Montmorillonite Content on Desiccation Cracks on Clay Surface. J. Yangtze River Sci. Res. Inst. 33 (9), 83–86+92. (in Chinese). doi:10.11988/ckyyb.20150607
Yang, D. D., Qiu, H. J., Ma, S. Y., Liu, Z. J., Du, C., Zhu, Y. R., et al. (2022). Slow Surface Subsidence and its Impact on Shallow Loess Landslides in a Coal Mining Area. Catena 209, 105830. doi:10.1016/j.catena.2021.105830
Yuan, J. P., and Yin, Z. Z. (2004). Quantitative Index of Fissure and Strength Characteristics of Fissured Expansive Soils. J. Hydraul. Eng. 1 (06), 108–113. (in Chinese). doi:10.13243/j.cnki.slxb.2004.06.019
Zeng, H., Tang, C.-S., Cheng, Q., Inyang, H. I., Rong, D.-Z., Lin, L., et al. (2019). Coupling Effects of Interfacial Friction and Layer Thickness on Soil Desiccation Cracking Behavior. Eng. Geol. 260, 105220. doi:10.1016/j.enggeo.2019.105220
Keywords: clay, evolution, drying curve, crack geometrical size, Brazilian test
Citation: Jiang X, Huang Q, Zhang Z, Vallejo LE, Chen X, Zhao W, Deng H, Liu X, Song D and Chen Z (2022) Influence of Clay Content on Crack Evolution of Clay–Sand Mixture. Front. Earth Sci. 10:915478. doi: 10.3389/feart.2022.915478
Received: 08 April 2022; Accepted: 02 May 2022;
Published: 17 June 2022.
Edited by:
Haijun Qiu, Northwest University, ChinaReviewed by:
Jun Li, Sichuan University of Science and Engineering, ChinaCui Kai, Lanzhou University of Technology, China
Copyright © 2022 Jiang, Huang, Zhang, Vallejo, Chen, Zhao, Deng, Liu, Song and Chen. This is an open-access article distributed under the terms of the Creative Commons Attribution License (CC BY). The use, distribution or reproduction in other forums is permitted, provided the original author(s) and the copyright owner(s) are credited and that the original publication in this journal is cited, in accordance with accepted academic practice. No use, distribution or reproduction is permitted which does not comply with these terms.
*Correspondence: Xiangang Jiang, NDE0NDZAc2ljYXUuZWR1LmNu