 Danzhou Wang1,2,3
 Qiang Zhang1,2,3*Vijay P. Singh4,5Zexi Shen1,2,3
 Gang Wang1,2,3Wenhuan Wu1,2,3Ruyue Yuan1,2,3
- 1Key Laboratory of Environmental Change and Natural Disaster, Ministry of Education, Beijing Normal University, Beijing, China
- 2State Key Laboratory of Earth Surface Processes and Resource Ecology, Beijing Normal University, Beijing, China
- 3Faculty of Geographical Science, Beijing Normal University, Beijing, China
- 4Department of Biological and Agricultural Engineering and Zachry Department of Civil and Environmental Engineering, Texas A&M University, Killeen, TX, United States
- 5National Water and Energy Center, UAE University, Al Ain, United Arab Emirates
Drought changes and the underlying causes have, in the backdrop of warming climate, aroused widespread concern. However, exact changes in patterns of meteorological droughts in both space and time are still open for debate. The Northern Hemisphere is home to 90% of the world’s population and has been afflicted by droughts over time. Here we present the evolution of spatiotemporal patterns of meteorological droughts, quantified by standardized precipitation evapotranspiration index across the Northern Hemisphere and related causes during a period of 1961–2018. We found amplifying droughts characterized by higher frequency, longer duration, and stronger severity across middle- and low-latitudes of the Northern Hemisphere, specifically, Mongolia, China and Central Asia expanding along central Eurasia, Circum-Mediterranean region, and southwestern North America (NA). Russia, Central Asia, China and the Indian Peninsula are regions with frequent droughts. Period of 1961–2018 witnessed spatial evolution of droughts in counterclockwise direction over North America. In general, the spatial evolution of meteorological droughts in Northern Hemisphere also followed counterclockwise direction due to the atmospheric pressure belt, wind belt, atmospheric circulation, and sea-land breeze. SPEI-based droughts were in close relation with El Niño-Southern Oscillation (ENSO) and Atlantic Multidecadal Oscillation (AMO). In particular, La Niña phenomenon could dry out southern NA and central and western Russia; and Atlantic Multidecadal Oscillation might affect the spatiotemporal variation of the drought in mid-high latitudes. These findings help understand meteorological droughts in the context of global warming.
1 Introduction
Drought is of stochastic nature afflicting society and eco-environment and is often considered as one of the costliest natural hazards (Mishra & Singh, 2010; Hayes et al., 2011; Svoboda and Fuchs, 2016; Yu et al., 2019). Drought-induced global economic losses have been estimated to be as high as six to eight billion US dollars each year (Wilhite, 2000; Yu et al., 2019). Recent decades witnessed growing population and expansion of agricultural, energy, and industrial sectors which pushed up the demand for water resources and water scarcity risk over the globe (Vörösmarty et al., 2000; Mishra & Singh, 2010; Sternberg, 2011; Yu et al., 2019). Meanwhile, anthropogenic global warming is accelerating the global hydrological cycle (e.g., Allen and Ingram, 2002) and hence is altering the spatiotemporal patterns of precipitation resulting in increased hydrometeorological extremes, such as floods and droughts (Easterling et al., 2000; Dore, 2005; Zhang et al., 2013), while there are remarkable discrepancies in terms of drought variations under changing climate. Dai et al. (1998) and Dai (2011) indicated the amplification of droughts and showed continuously enhancing drought risk in a warming climate, while Sheffield and Wood (2008) and Sheffield et al. (2012) argued that little change was observed in global droughts over the past 60 years. The Northern Hemisphere is home to ∼90% of the world’s population, and accounts for about 66.6% of the world’s land area (Miller et al., 2010). Drought events were usually recognized as four categories: i.e. meteorological drought caused by insufficient precipitation, agricultural drought caused by insufficient soil moisture, hydrological drought caused by insufficient river flow and water storage, and socioeconomic drought caused by insufficient demand and supply of economic commodities brought about by drought (Mishra & Singh, 2010). While, meteorological drought is usually the starting point for other three droughts and therefore thorough investigation of meteorological droughts and relevant causes are of paramount importance in the sustainability of reginal water resources and socio-economy over Northern Hemisphere.
A multitude of studies have addressed spatiotemporal patterns of droughts at regional and even global scales (Zhang et al., 2015; Herrera-Estrada et al., 2017). Shiau and Lin (2016) analyzed meteorological drought variations in both space and time over Taiwan, China, using quantile regression and cluster analysis techniques. Spinoni et al. (2019) detected a remarkable increase in the frequency and severity of meteorological droughts during the periods of 1951–1980 and 1981–2016 across the Mediterranean region, the Sahel, the Congo River basin, northeastern China, and central Asia. Zhang et al. (2021) quantified relationships between drought and 23 drought factors using remote sensing data during the period of 2002–2016 across China and found that precipitation and soil moisture made relatively large contributions to droughts. Recent studies started to focus on the spatiotemporal evolution of hydrometeorological variables, such as air temperature (e.g., Ji et al., 2014) and droughts (Xu et al., 2015; Yu et al., 2019). Wang et al. (2015) analyzed drought evolution trajectories and found that drought evolution can be attributed to the East Asian summer monsoon. Zhou et al. (2019) analyzed spatiotemporal variations of meteorological drought within Poyang Lake Basin, China, in terms of drought clusters, migration trajectory and migration direction. In this study, we attempt to depict meteorological drought evolution as well as migration trajectories over the Northern Hemisphere.
Highlighting causes behind meteorological droughts can help understand meteorological droughts and drought hazards. Previous studies have linked spatiotemporal evolutions of droughts with sea surface temperature (SST) and large-scale climate indices reflecting the occurrence of the climate events (Wu & Kinter, 2009). Erfanian et al. (2017) found that warmer-than-usual SSTs in the Tropical Pacific (also El Niño events) and Atlantic were the main driving factors behind extreme droughts in South America. However, SST anomalies also results from atmospheric circulation anomalies (Andreas & Hazeleger, 2005; Zhe et al., 2016; Turner et al., 2022). Madden Julian Oscillation (MJO; Zhang 2005) often affects the evolution of SST anomalies; SST anomalies in the tropics can also feedback extratropical circulation anomalies (Lau, 1997). Besides, relations between MJO and precipitation extremes also indirectly corroborate the impact of SST on droughts (e.g. Zheng et al., 2020). Hence, we attempted to quantify the relationship between SST and spatiotemporal evolution of meteorological droughts across Northern Hemisphere, and investigate causes behind meteorological droughts from the perspective of SST changes.
El Niño Southern Oscillation (ENSO) and other large-scale climate events such as Pacific Decadal Oscillation (PDO) have substantial impacts on the occurrence and development of regional and global droughts (Özger et al., 2009; Wang & Arun, 2015; Wang et al., 2019; Gore et al., 2020; Nguyen et al., 2021; Pieper et al., 2021). Sun and Yang (2012) found that the interactions between La Nina, North Atlantic Oscillation (NAO), and thermal conditions of the Qinghai-Tibet Plateau triggered severe droughts in southern China in spring. Feng et al. (2020) evidenced the important role of large-scale climate drivers such as ENSO in drought forecasting, showing critical relations between drought and large-scale climate drivers.
Temporal features of droughts involve frequency, intensity, duration and trend, and spatial features include drought-affected area, drought centroid, drought cluster and severity (Mishra et al., 2010; Mishra & Singh, 2010; Zhou et al., 2019). Yevjevich (1967) proposed a one-dimensional method to extract duration, severity and intensity of droughts from drought index sequence. Andreadis et al. (2005) and Lloyd-Hughes (2012) proposed the three-dimensional clustering method (e.g., Xu et al., 2015). Perez et al. (2011) developed the methodologies for characterizing droughts can be classified into non-contiguous and contiguous drought area analyses (i.e., NCDA and CDA). The one-dimensional method does not take into account the spatial distribution of drought events and is suitable for research based on site data. The three-dimensional clustering method can use spatial heterogeneity to correct spatial discontinuity caused by abnormal drought indices and is more suitable for grid data-based research. Considering that the data in the present study is a grid dataset, we use a three-dimensional clustering method (Andreadis et al., 2005) to identify meteorological droughts and characterize meteorological droughts in terms of duration, severity, intensity, spatial range, drought centroid and migration trajectory to delineate the spatiotemporal pattern and evolution of meteorological droughts.
Here we attempt to analyze the evolution of meteorological droughts in both space and time and anatomize causes behind their spatiotemporal evolutions in Northern Hemisphere. This study can help understand changes of meteorological droughts, relevant causes and mitigation to meteorological droughts over Northern Hemisphere.
2 Data and Methods
2.1 Data
We used SPEI to meteorological drought (Vicenteserrano et al., 2010) during a period of 1961–2018. The gridded SPEI data were sourced from Consejo Superior de Investigaciones Científicas (CSIC, https://spei.csic.es) with a spatial resolution of 0.5°×0.5°. Drought grade classification is shown in Supplementary Table S1 (Yu et al., 2019). Since droughts make no sense in arid regions, such as desert as well as extremely cold areas, so we excluded these areas from the study regions considered in here by mask processing (Spinoni et al., 2019). Here we analyzed seasonal and interannual drought variations (Liu et al., 2020) using the following concepts. We calculated annual SPEI from the 12-months SPEI (SPEI 12) and seasonal droughts (SPEI 03) during spring (March to May), summer (June to August), autumn (September to November), and winter (December to February of the subsequent year). Droughts at decadal scales were computed by averaging annual SPEI for every 10 years.
Relative humidity (RH), latitudinal wind velocity (V/U) of 850 h Pa, and the SST were sourced from the ERA5 reanalysis data with a spatial resolution of 0.25°×0.25° (https://cds.climate.copernicus.eu/#!/search?text=ERA5&type=dataset). Global mean temperature anomaly data (TA) from HadCRUT5 with a spatial resolution of 5°×5° was also analyzed (https://crudata.uea.ac.uk/cru/data/temperature/). The duration of the abovementioned data was 1961–2018 (Supplementary Table S2).
Large-scale climate indices (Supplementary Table S3) considered in this study included the Southern Oscillation Index (SOI) (Ropelewski & Jones, 1987), the Atlantic Multidecadal Oscillation (AMO) (Kerr, 2000), and the East Pacific-North Pacific (EP-NP) (Linkin & Nigam, 2007). SOI and EP-NP data were sourced from the Climate Prediction Center (CPC) of the National Oceanic and Atmospheric Administration (NOAA). AMO was calculated by the Physical Sciences Laboratory (PSL) of NOAA using the HardiSST v1.1 SST dataset (https://www.cpc.ncep.noaa.gov/and https://psl.noaa.gov/gcos_wgsp/Timeseries/).
2.2 Methods
2.2.1 Modified Mann–Kendall Trend Test and Sen’s Slope
The MMK trend test (Hamed & Rao, 1998) was used to quantify the significance of SPEI trends (at 5% significance level). The magnitude of the SPEI trend was estimated by Sen’s slope (Sen, 1968) as:
where
2.2.2 Identification of Long-Term Drought Events
Drought events were defined as SPEI < -0.5, while a long-term drought event was defined by the drought with a duration of at least 3 months. Here we considered three aspects of drought features, i.e., frequency refers to the number of drought occurrences during a given period (Spinoni et al., 2019); duration refers to consecutive time intervals dominated by drought events (Haile et al., 2020); and severity is represented by cumulative SPEI values throughout the drought period. Smaller cumulative SPEI value shows severer drought and vice versa (Yu et al., 2019); Centroid refers to the geometric center of the drought-affected region, depicting a 3-dimensional space-time space defined by longitude, latitude, and time (Xu et al., 2015). Here we use the MatLab image processing function regionprops (The MathWorks, 2014) identify the centroids of drought events.
2.2.3 K-Means Clustering Method
The K-means method was used to classify a given data set into K clusters (K is a hyperparameter), giving the center point corresponding to each sample data (Mcrae, 1971). Here we identified regions with homogeneous dry and/or wet conditions based on temporal mean SPEI value, coordinate position, and trends of SPEI (MMK value and Sen’s slope). We also used the K-means method to delineate the spatiotemporal pattern of propagation trajectory of drought events.
2.2.4 Maximum Covariance Analysis
MCA is a singular value decomposition (SVD) analysis that has been widely used for extracting coupled modes of variability between time series of two fields (Bretherton et al., 1992; Mo, 2003). Here we used MCA to quantify teleconnection relationship between SPEI and SST. The SPEI and SST anomalies (SSTA) were smoothed with a 5-years bandwidth Butterworth low-pass filter implemented by the bwfilter function in the mFilter library of the R package to filter out high-frequency signals within 5 years, highlighting the interdecadal trend. Then we quantify the time coefficients obtained by MCA with those of other large-scale climate indices, and evaluate the significance of time coefficients to anatomize the atmospheric circulation background of the spatiotemporal evolution of drought in the Northern Hemisphere. The analysis procedure of this current study is illustrated in Figure 1.
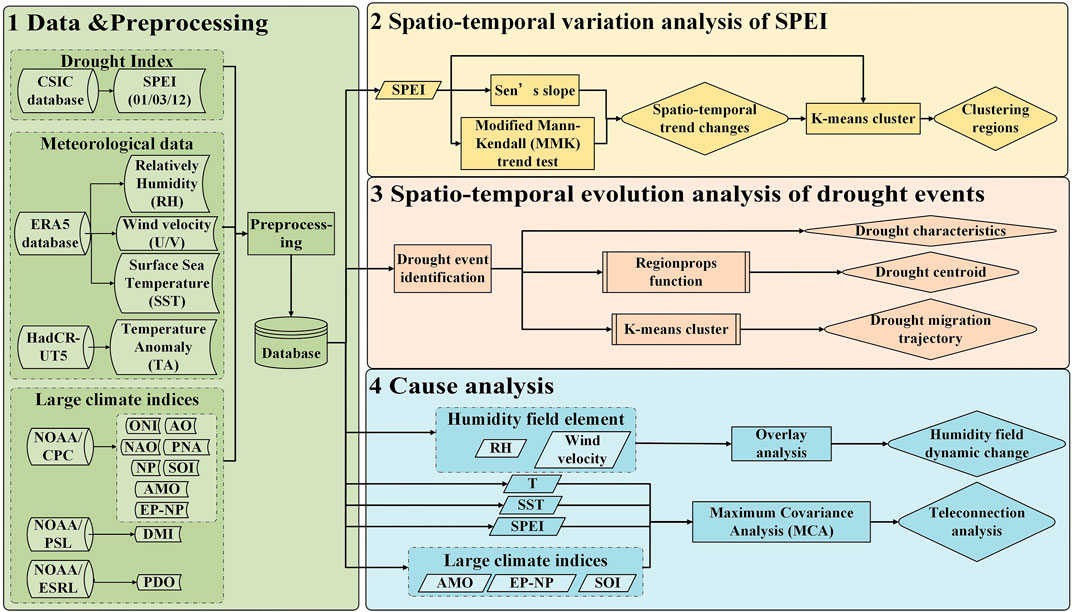
FIGURE 1. Analysis procedure of this current study.
3 Results and Discussion
3.1 Spatiotemporal Evolution of SPEI-Based Drought
3.1.1 Spatiotemporal Evolution of SPEI-Based Dry-Wet Changes
North America (NA) was dominated by wetting conditions while drought-affected regions were observed in southeastern parts of NA from 1961 to 1970 (Figure 2A); The drought-affected areas in NA shifted roughly counterclockwise along an east-central-northern-west-south trajectory and drought intensity increased over time from 1971 to 2018 (Figures 2B–G); Severe drought occurred in southwestern parts of NA (Figure 2F). In Eurasia, the drought-affected areas had evolved from scattered distribution to continuous distribution in patches with amplified droughts (Figure 2): From 1961 to 1970, scattered drought-affected areas were found in Russia and the Qinghai-Tibet Plateau (Figure 2A); Besides, the drought-affected regions were mainly concentrated in the area between 30°N and 60°N in Eurasia, and distributed along an east-west strip from 1971 to 2018 (Figures 2B–F). During 1981–2000, the entire Eurasian continent was dominated by mild drought, and drought-affected regions were located mainly in central Eurasia with expanding drought-affected areas (Figures 2C,D). Drought intensity increased over Eurasia, and moderate drought-affected regions were concentrated in Mongolia, northern and western China, and the northern Indian peninsula during a period from 2001 to 2010. Meanwhile, moderate drought started to occur in Central Asia (Figure 2E). The period from 2011 to 2018 witnessed intensifying droughts in Eurasia and the drought-affected regions were concentrated between 50°N and 60°N, such as southern Europe, southern Kazakhstan, Mongolia, and Russia (Figure 2F). Moreover, Northern Hemisphere was dominated mainly by mild droughts and all drought types continued to increase with time and it was particularly the case during 2010–2018, that is, 23.1% (mild drought: 18.1%, moderate drought: 4.5%, severe drought: 0.5%) (Supplementary Figure S1A). In addition, droughts mainly occurred during spring and summer (Supplementary Figure S1B) and particularly in June and July (Supplementary Figure S3M). In Eurasia, the arid areas were concentrated along the east-west strip between 30°N and 50°N with similar spatiotemporal patterns of droughts during spring and at the yearly scale (Supplementary Figures S2A,C).
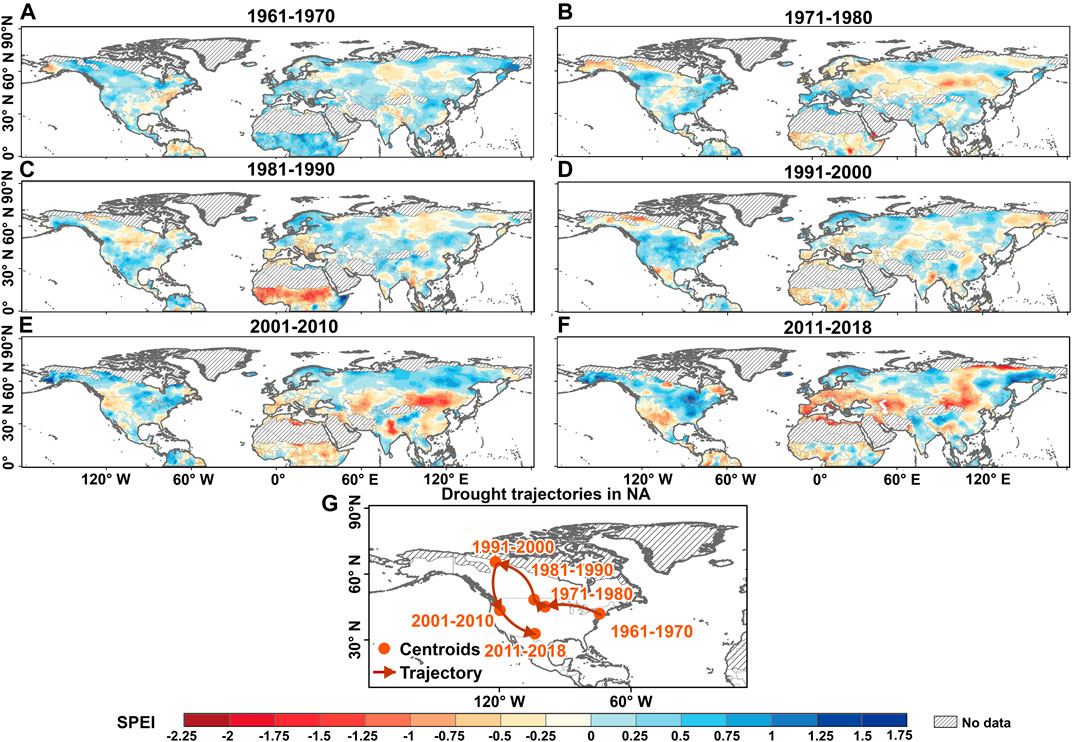
FIGURE 2. Spatiotemporal evolution of SPEI during the period from 1961 to 2018. (A) 1961–1970; (B) 1971–1980; (C) 1981–1990; (D) 1991–2000; (E) 2001–2010; (F) 2011–2018; (G) Drought trajectories in North America (NA). The slashed area was excluded from analysis by mask processing.
3.1.2 Spatiotemporal Evolution of Trends in SPEI-Based Dry-Wet Conditions
Here we used MMK and Sen’s slope methods to quantify SPEI trends with significance level of 0.05. Sen’s slope of SPEI in Northern Hemisphere ranged between -0.499 and 0.677. Scattered regions with significant drying conditions (significant decrease in SPEI) and/or with significant wetting conditions (significant increase in SPEI) were found across Northern Hemisphere (Figure 3). The period of 1961–2018 witnessed the propagation of drying conditions across NA along the northwest-southeast diagonal direction (Figure 3): the period from 1961 to 1970 was dominated by significant drying trends in northwestern NA (Figure 3A); regions with significant drying conditions began to spread to central NA from 1971 to 1990 and concentrated in southwestern parts of NA from 1981 to 1991 (Figures 3B,C); regions with significant drying tendency shrunk and propagated from southeastern to northwestern parts of NA during 1991–2018 (Figures 3D–F). However, no depictable spatial pattern could be identified for drying and/or wetting tendency over the Eurasian continent (Figure 3). We could still identify specific time intervals dominated by significant drying tendency over NA such as periods of 1971–1990 across NA and 1961–1970 and 1991–2010 across Eurasia (Figure 3). Furthermore, areas dominated by decreasing and increasing droughts reached the trough values during 2010–2018 (significant drying: 1.3%; significant wetting: 1.4%) (Supplementary Figures S1B).
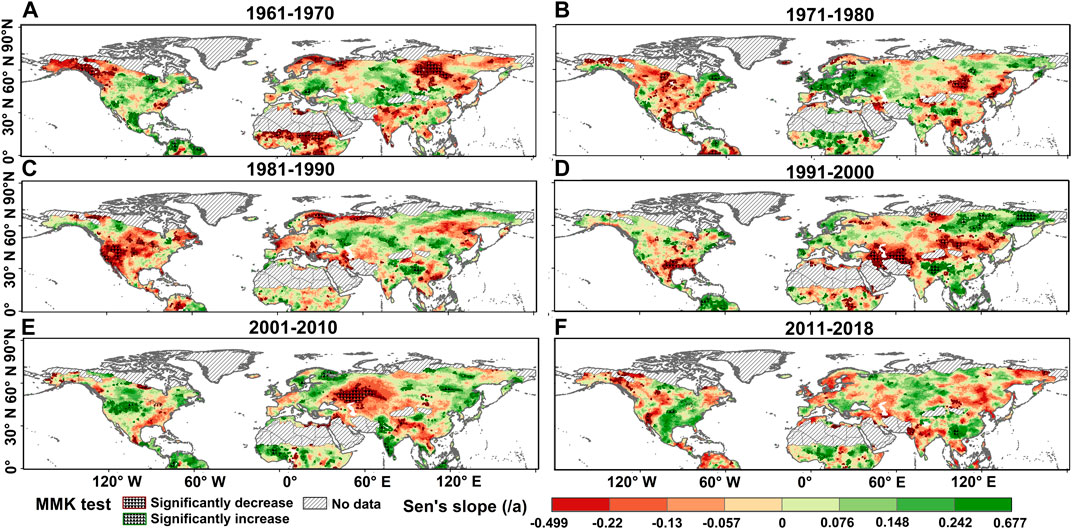
FIGURE 3. Spatiotemporal evolution of trends in SPEI at interdecadal scales based on MMK trend and Sen’s slope method from 1961 to 2018. (A) 1961–1970; (B) 1971–1980; (C) 1981–1990; (D) 1991–2000; (E) 2001–2010; (F) 2011–2018.
At annual and seasonal scales, regions dominated by SPEI-based significant drying tendency during 1961–2018 were concentrated mostly in mid-latitudes of Eurasia and western parts of NA (Supplementary Figures S4A,C–F). Nevertheless, spring and summer were characterized by a significant drying tendency and autumn a significant wetting tendency (Supplementary Figures S4C–E) and areas dominated by the significant drying tendency accounted for as high as 18.8% in spring and 17.6% in autumn (Supplementary Figures S4B).
3.1.3 Regionalization of Wetting/Drying Tendency
The Northern Hemisphere can be subdivided into seven subregions with different wetting/drying tendencies, i.e. R1-R7 (Figure 4G; Table 1). At seasonal scales, all subregions are subject to a wetting tendency (Figure 4A). However, we found no evident changes in drying/wetting conditions (Figure 4C). At decadal scales, R2, R6, and R7 were in a drying tendency over time and R4 and R5 in a wetting tendency (Figures 4B,D). In probability sense, wetting/drying changes within all subregions followed a normal distribution (Figures 4E,F). Therefore, we could find that R7 was the driest region out of seven subregions and would be in a persistently drying tendency, while R5 was the wettest region out of seven subregions and would be in a persistently wetting tendency (Table 1).
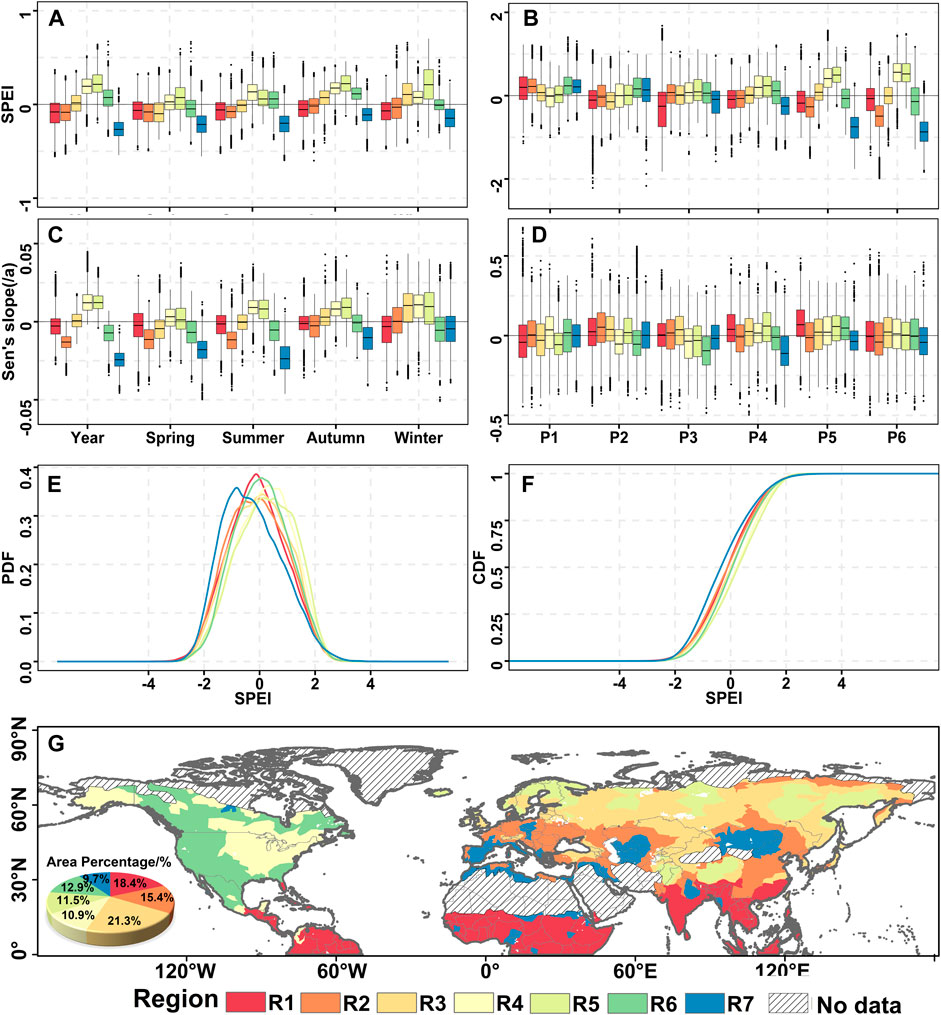
FIGURE 4. Statistical analysis results for SPEI within subregions by clustering analysis. (A,C): box plots and Sen’s slope of SPEI at annual and seasonal scales; (B,D): box plots and Sen’s slope of SPEI at decadal scale; (E) Probability distributions of SPEI; (F) Cumulative probability distributions of SPEI; (G) Subregions subdivided by K-means method.
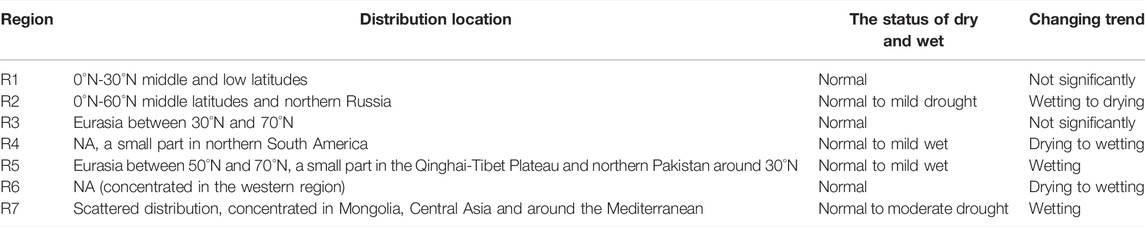
TABLE 1. Characteristics of dry and wet changes in the cluster regions from 1961 to 2018.
3.2 Drought Identification
3.2.1 Identification and Features of Droughts
We analyzed drought features, such as drought frequency, drought duration, and drought severity. A spatial pattern of drought events is illustrated in Figure 5. The 30 drought events with the largest drought intensity considered in this study are displayed in Supplementary Table S4. Drought events with higher frequency, longer duration and stronger severity occurred mainly along the middle and low latitudes, especially in Mongolia, China, Central Asia in central Eurasia, the Circum-Mediterranean regions and the southwestern NA (Figures 5A–C), and this phenomenon can be attributed to warming climate and amplifying Arctic warming (e.g., Cohen et al., 2014).
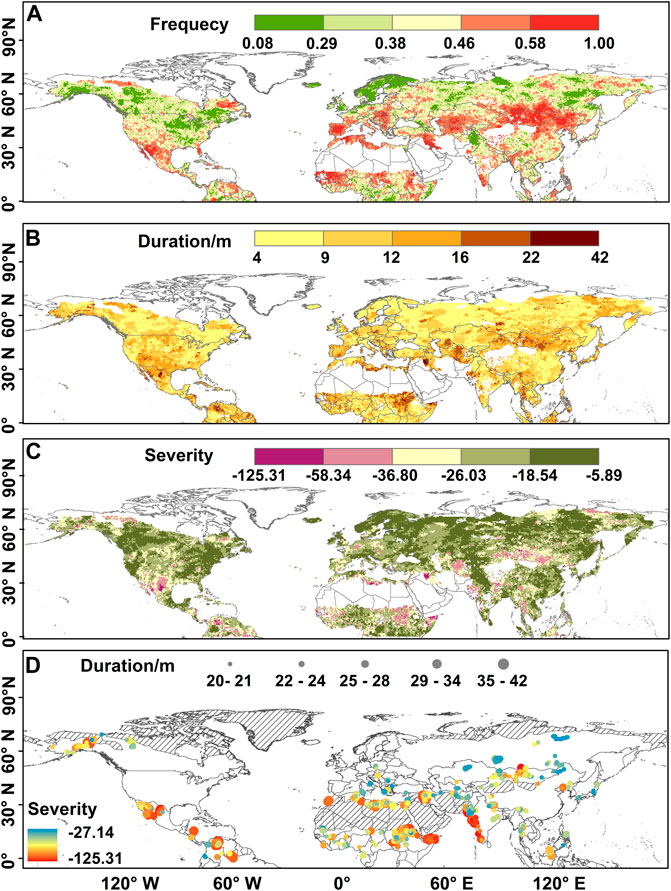
FIGURE 5. Spatial pattern of top 100 long-term droughts in terms of (A) drought frequency is the number of drought occurrences, whose range is 0–1; (B) drought duration is consecutive time intervals dominated by drought events, whose unit is month; (C) drought severity is cumulative SPEI values; and (D) drought centroid is the geometric center of the drought-affected region.
The top 100 long-term droughts occurred mainly in southern NA, Caribbean Rim, North Africa, East Africa, East and South India, Mediterranean region, Mongolia and Russia (Figure 5D). Meanwhile, the top 10 long-term droughts occurred mainly during 1992–2018 with drought duration ranging between 33 and 42 months, and most of these droughts occurred in R1 (4 drought events) and R7 (4 drought events) regions (Supplementary Table S4, Figure 5D), pointing to amplifying droughts along middle and low latitudes of the Northern Hemisphere. For example, the drought event that began in 1998 in the eastern Mediterranean Levant region, which comprises Cyprus, Israel, Jordan, Lebanon, Palestine, Syria, and Turkey, was recognized as the worst drought of the past nine centuries (NASA, 2016). In eastern Africa, we found a severe drought event that was ranked as the second most severe drought (Supplementary Table S4), lasting 39 months from June 2008 to September 2011 (Figure 5D). In addition, one drought occurred during 2010–2011 in Eastern Africa was one of the most recent extreme drought events that affected over 20 million people and caused widespread crop failure (AghaKouchak, 2015). Another severe drought occurred in South India that can be ranked as the fourth most severe drought (Supplementary Table S4), lasting 31 months from September 2015 to May 2018, and the drought reached its peak value in November 2017 (Figure 5D) (Mishra et al., 2021).
For further understanding of the statistical relations amongst drought features considered in this study, we performed linear fitting analysis between drought severity and duration (Supplementary Figure S5). The color shaded range of the linear fitting started to expand from the drought duration of 20 months and the data points also tended to be more scattered, implying increasing violation of linear relations between drought duration and severity with drought duration of longer than 20 months, and that droughts with duration of >20 months were scarce (Supplementary Figure S5). Thus, we took drought duration of 20 months as the threshold value for the identification of a large-scale long-term drought.
3.2.2 Identification of Centroid and Migration Trajectory of Drought
Identification of drought centroid and migration trajectory are important for mitigation to drought hazards. Figure 6A shows drought trajectories across NA, Europe (EU), Central Asia and Tibet (CT), North Asia, East and Southeast Asia (NES), and South Asia (SAS). We depicted and analyzed drought trajectories for each region considered in this study (Figure 6). We attempted to delineate the evolution of droughts over five subregions. We observed the clear spatial pattern of drought evolution over NA (Supplementary Table S4), and analyzed the spatial pattern of drought evolution during a period from March 2013 to March 2016 across NA. We did similar analyses for other four regions considered in the study, i.e. EU, CT, NES, SAS. Drought migration trajectories in NA at 6 months followed a counterclockwise direction (Figures 6B–G). Meanwhile, extremely low cumulative SPEI values mainly appeared in the northeastern NA (Figures 6B–E). For drought evolution over other four regions (Supplementary Figures S6, S8, S10, S12), the propagation of droughts also followed a counterclockwise direction (Supplementary Figures S6A–C, S8A,B, S10A–C, S12C). We also found some drought evolution trajectories in clockwise direction (Supplementary Figures S8D, S12B). Therefore, we concluded that migration of drought trajectories in the Northern Hemisphere mainly followed a counterclockwise direction.
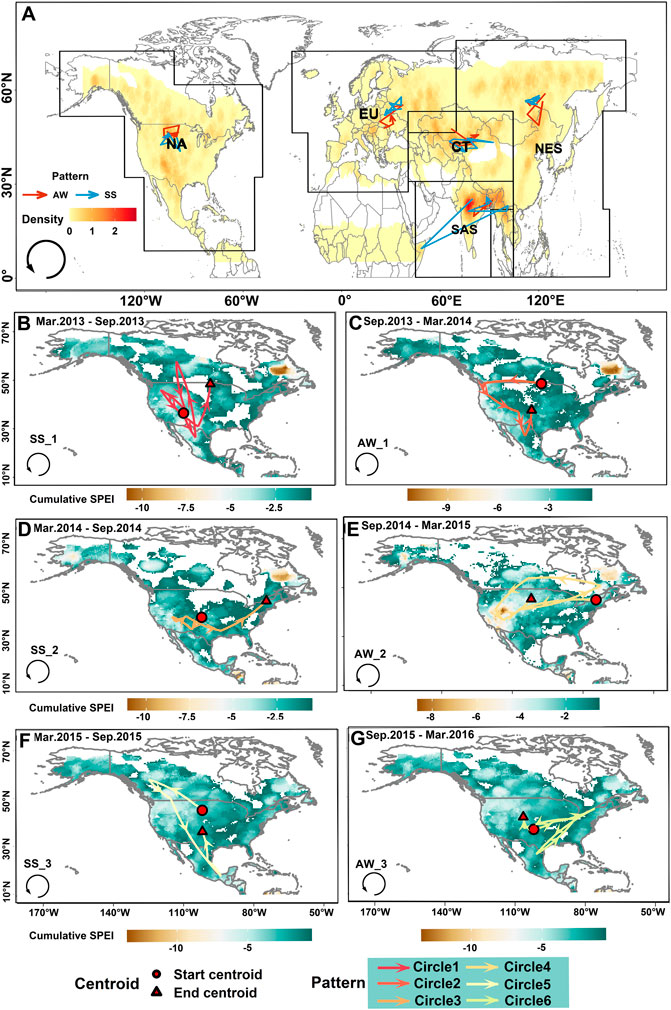
FIGURE 6. Spatial pattern of droughts in terms of centroids, migration trajectories. (A) Drought centroids and migration trajectories in Northern Hemisphere. (B–G) Drought centroids and migration trajectories in NA from March 2013 to March 2016. (B) March 2013–September 2013. (C) September 2013–March 2014. (D) March 2014–September 2014. (E) September 2014–March 2015. (F) March 2015–September 2015. (G) September 2015–March 2016. AW: autumn and winter; SS: spring and summer. Density: the point density of drought centroids.
3.3 Mechanistic Analyses for Drought Evolution
3.3.1 Changes of RH and V/U Behind Drought Evolution
We analyzed RH and V/U to investigate potential causes behind drought evolution in the Northern Hemisphere. RH in the Pacific Ocean near western NA decreased from March to April in 2013 (Figure 7A), which could be attributed to a clockwise wind with an increasing velocity within the Pacific Ocean and the cold and dry air mass from high to low latitudes along the western coast of NA. The aforementioned driving factors together with the joint influence of subtropical high pressure, cold current and south wind, the drought centroid in NA began to appear in the southwestern region and moved southward (Figure 6B). Southeasterly winds prevailed in central NA from April to May (Figure 7B), and warm and humid air masses from March to April affected drought occurrences over eastern NA (Figure 7A). The wind direction and warm and humid air masses pushed the dry air masses in the central and southern regions northwards, so the drought centroid began to move northwestward (Figure 6B). From May to June, the warm air masses from low latitudes were likely to be forced to be lifted up in the subpolar low-pressure belt in the northern NA, which was prone to rainfall changes (Figure 7C). During summer in the Northern Hemisphere, the drought centroid moved northward and then returned to the warmer and drier western NA (Figure 6B). Cold current appeared again along the western coast of NA from June to July causing warm and dry conditions (Figure 7D) and then the westward propagation of drought centroid (Figure 6B). Then cold current began to appear along the eastern coast of NA causing trying tendency within NA (Figure 7E), triggering southeastward propagation of the drought centroid (Figure 6B); From August to September, the northeasterly wind began in the southern parts of NA (Figure 7F), causing northeastward propagation of the drought centroid (Figure 6B). From September to October, the wind velocity on the western coast of NA increased, the wind direction brought cold current along the coastline again, causing cold but humid conditions due to the influence of the subpolar low-pressure belt (Figure 7G), which in turn caused the westward propagation of the drought centroid (Figure 6C). From November to January of the next year 2014, southwesterly and northwesterly winds began to prevail in NA (Figures 7I,J), causing southeastward propagation of the drought centroid (Figure 6C). From January to February in 2014, the strong land breeze in southern NA caused a decrease of water vapor (Figure 7K), triggering southward movement of the drought centroid (Figure 6C). From February to March, the strong sea breeze from southern North America blew toward the central region (Figure 7L) causing the northward shift of droughts (Figure 6C). Therefore, drought migration trajectory is heavily reliant on season, the atmospheric pressure belt, wind belt, the circulation, and the sea and land breeze. However, these driving factors have varying impacts on drought propagation.
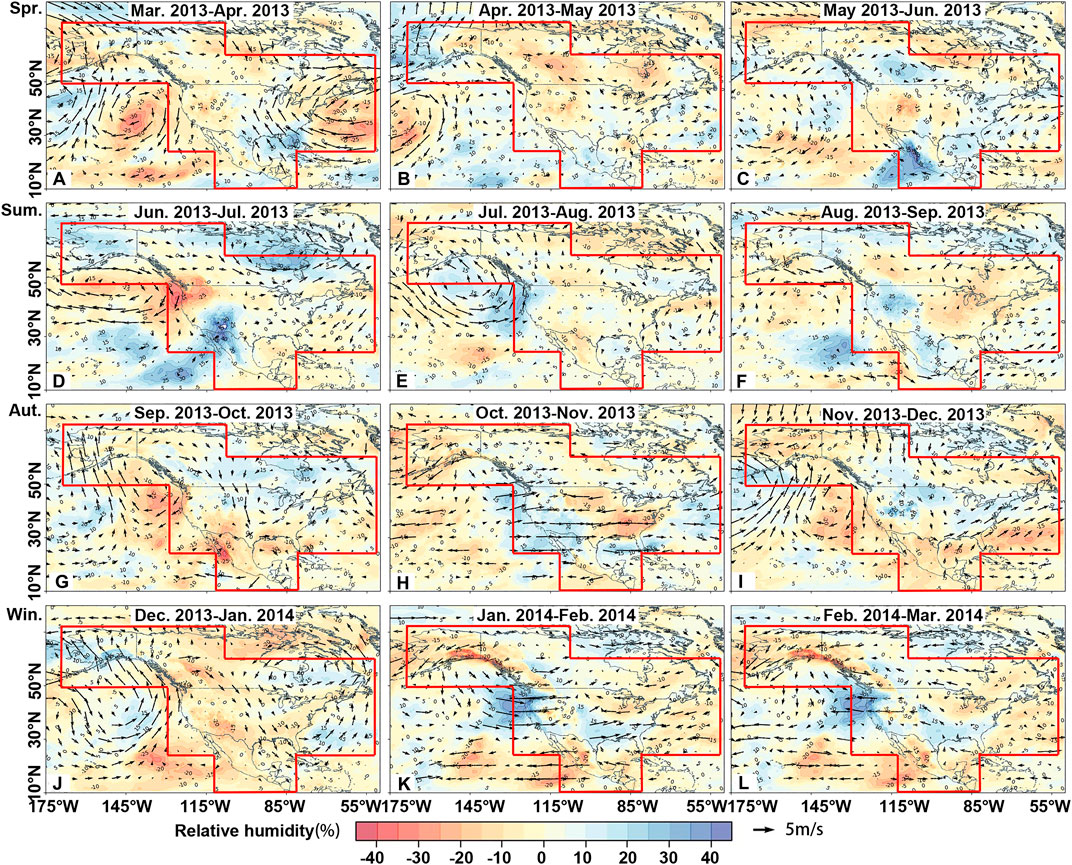
FIGURE 7. Spatial pattern of water vapor changes in NA from March 2013 to March 2014. (A) March 2013–April 2013. (B) April 2013–May 2013. (C) May 2013–June 2013. (D) June 2013–July 2013. (E) July 2013–August 2013. (F) August 2013–September 2013. (G) September 2013–October 2013. (H) October 2013–November 2013. (I) November 2013–December 2013. (J) December 2013–January 2014. (K) January 2014–February 2014. (L) February 2014–March 2014. The red box refers to the boundary of the study region.
We also found close relations between drought migration trajectories and the water vapor changes in other regions considered in this study (Supplementary Figures S6–13). Most of the drought centroids concentrated in mid-latitudes of the Northern Hemisphere were heavily affected by prevailing westerly winds, subtropical high-pressure belt, and subpolar low-pressure belt, so the migration of drought centroids in large areas followed a counterclockwise pattern. For example, in Supplementary Figures S8, 9, severe drought conditions over much of southern India from October to December were reliant on seasonal winter rainfall associated with the northeastern monsoon (NEM) (Mishra et al., 2021).
3.3.2 Spatial Coupling Relationship Between SPEI and SST
We attempted to quantify the teleconnection relationship between SPEI and SST through the MCA method. The top four coupled modes of the MCA method explained 17.9, 6.5, 5.7 and 4.8% of the variance, respectively. The correlation coefficients of the time coefficients between SSTA and SPEI in modes one and 4 (M1, 4) were all greater than 0.95 (p<0.001), indicating significant response relationship between SSTA and SPEI (Figures 8A,J). However, the correlation coefficients of time coefficients between SSTA and SPEI in modes two and 3 (M2, 3) were 0.074 and 0.15 respectively (p<0.001), indicating that SSTA was not related to SPEI (Figures 8D,G).
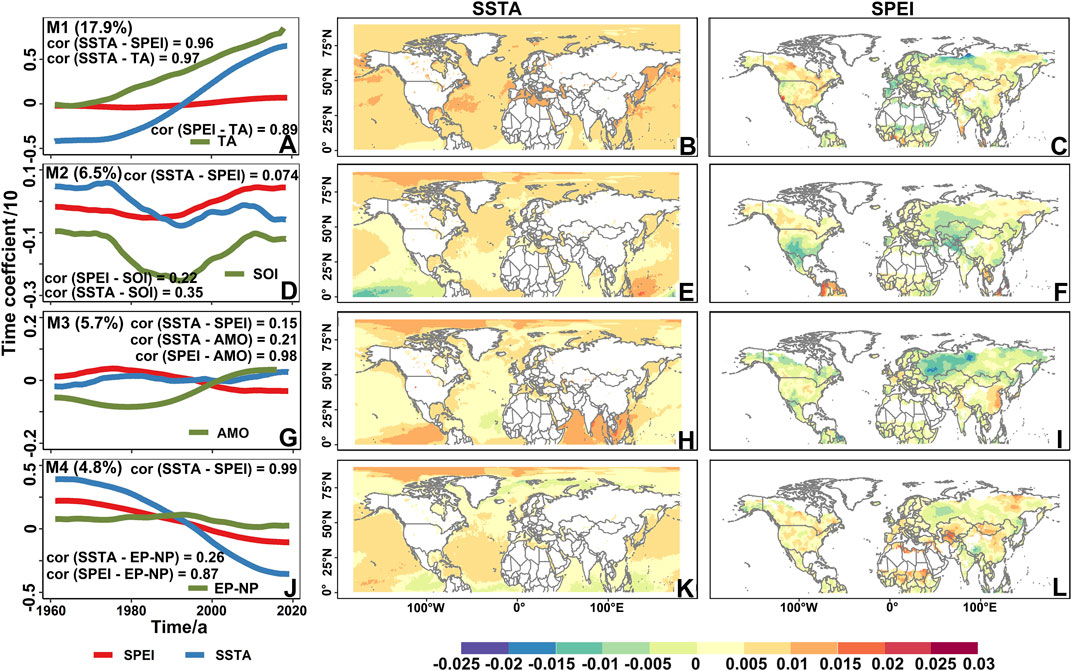
FIGURE 8. Spatial coupling of SPEI and SSTA based on MCA. Left column (A,D,G,J): SPEI (red), SST anomaly (blue) time coefficient and correlation index series (green) (percentage represents the variance contribution rate of each modal interpretation, and the correlation coefficient between each index is marked in the figure); Middle column (B,E,H.K): spatial distribution of SSTA; Right column (C,F,I,L): spatial distribution of SPEI.
The SSTA time coefficient in M1 generally showed a significant upward trend, while the SPEI time coefficient showed a slow upward trend, where the SSTA time coefficient had risen sharply since 1975 and the SPEI time coefficient had indeed risen slowly around zero. In M1, the correlation coefficient between SSTA time coefficient and TA was 0.96 (p < 0.001), while that between SPEI time coefficient and TA was 0.89 (p < 0.001), indicating that SPEI was greatly possible to be affected by global warming (Figure 8A). SSTA in M1 showed a different intensity of SST warming (Figure 8B) but was in line with global warming (Figure 8A). Besides, the SPEI values were relatively low between 60°N and 75°N in northern Russia, Mediterranean region and northern Africa (Figure 8C), and were high in other regions, especially in most parts of NA, Central Asia, eastern Russia, and eastern China. These observations evidenced the impact of SST changes on meteorological drought changes.
In M2, the SSTA time coefficients were in downward trend, while the SPEI time coefficients in upward trend. The correlation coefficient between SSTA time coefficient and SOI was 0.35 (p < 0.001), while that between SPEI time coefficient and SOI was 0.22 (p < 0.001), indicating that the SPEI may be affected by SOI and ENSO events (Figure 8D). SSTA in M2 mainly manifested as a cooling phenomenon in the west-central Pacific region, which may be related to the La Niña phenomenon (Figure 8E). Correspondingly, the SPEI value of the SPEI field distribution was relatively low in southern NA, Central Asia, and central and western Russia, and the SPEI changes were consistent with the linear trend of SOI (Figure 8F). Thus, it could be seen that the meteorological drought during 1961–2018 could be related to ENSO events, especially the La Niña phenomenon. Our findings were consistent with those of other scholars. For example, Stevens and Ruscher (2014) examined the relationship between surface climatological variables and climatic oscillations in the Apalachicola-Vhattahoochee-Flint River basin in southern NA. They showed that the meteorological drought at 24-months time scale in the southern part of the basin was largely influenced by SOI. And Sun et al. (2022) demonstrated impacts of ENSO, and speccifically La Niña-like condition on the East Asian climate anomalies during autumn–winter 2020/2021.
In M3, SSTA and SPEI time coefficients were in steady trends in general with moderate fluctuations. The correlation coefficient between SSTA time coefficient and AMO was 0.21 (p < 0.001), while that between SPEI time coefficient and AMO was 0.98 (p < 0.001), indicating potential impacts of AMO on SPEI changes (Figure 8G). Besides, SSTA in M3 was in decreasing tendency along the east coast of the Atlantic Ocean near Africa, but was in increasing in the Arctic Circle and low latitudes near the equator (Figure 8H). In the corresponding SPEI field, the SPEI values of most regions were relatively low, especially in western Russia, while that were relatively high in eastern China and northern Indian peninsula (Figure 8I). So, changes in the AMO might affect the spatiotemporal changes in mid- and high-latitude drought-affected regions.
In M4, the SSTA and SPEI time coefficients were in decreasing tendency with correlation coefficient of 0.26 (p < 0.001) between SSTA time coefficient and EP-NP, and that of 0.87 (p < 0.001) between SPEI time coefficient and EP-NP, indicating that SPEI might be affected by EP-NP (Figure 8J). Moreover, SSTA near the equator and high latitudes of the North Hemisphere was in decreasing tendency and was rising in Arctic Circle and mid-latitudes of the North Hemisphere (Figure 8K). The SPEI values in western Russia were relatively low, while the SPEI values over other regions except western Russia were relatively high (Figure 8L). Hence, the EP-NP changes potentially affected the spatiotemporal changes of droughts in mid-high North Hemisphere.
In addition to climate indices, many scholars are beginning to find that Arctic sea ice is increasingly affecting drought. Chen et al. (2021) found that the influence of the early spring Arctic sea ice on the subsequent summer drought takes place mainly through the Eurasian snow from spring to summer. which ultimately affects the subsequent drought through soil moisture–precipitation feedback and soil moisture–temperature feedback. Sun et al. (2022) attributed drought in South China during autumn 2020 to water vapor divergence anomalies induced by an anomalous anticyclone over eastern China, which are caused by an anomalous Eurasian atmospheric wave-train triggered by the negative sea ice anomalies in the Barents Sea-Kara Sea region.
4 Conclusion
The present study analyzed the evolution of the spatiotemporal pattern of drought in the Northern Hemisphere during the past about 60 years from 1961 to 2018 and its causes from the basic idea of “phenomenon-law-essence”. The following conclusions can be drawn from this study:
1) In the context of global warming, terrestrial meteorological drought in the Northern Hemisphere from 1961 to 2018 was amplifying, and often spring and summer were concentrated seasons for its occurrence. For different regions, the drought-affected region in NA shifted counterclockwise, and its significant drying region showed a wandering evolution characteristic in the northwest-southeast diagonal direction. In Eurasia, the drought-affected areas had evolved from scattered distribution to continuous distribution, while, the specific time intervals were dominated by significant drying tendency over NA such as periods of 1971–1990 across NA and 1961–1970 and 1991–2010 across Eurasia. Among the seven subregions, R7 scattered but concentrated in Mongolia, Central Asia, and around the Mediterranean region was the driest region and in persistently drying tendency, while R5 was mainly distributed in Eurasia between 50°N and 70°N, in a small part of the Tibetan Plateau and in northern Pakistan at about 30°N was the wettest region and in persistently drying tendency.
2) Amplifying droughts were characterized by higher frequency, longer duration and stronger severity across middle- and low-latitudes of the Northern Hemisphere, specifically, Mongolia, China and Central Asia expanding along the central Eurasia, Circum-Mediterranean region and southwestern NA. In terms of the characteristics of drought events, the absolute value of drought severity in each region of northern Hemisphere showed a good linear increase relationship with drought duration, where the duration was less than 20 months. Surprisingly, the drought migration trajectories in five regions, i.e., NA, EU, CT, NES, and SAS, followed a counterclockwise direction.
3) The drought evolution had a strong relationship with season, atmospheric pressure belt, wind belt, the atmospheric circulation, and the sea-land breeze. Most of the drought centroids in the Northern Hemisphere were concentrated in mid latitudes, so they were easily affected by the prevailing westerly winds, subtropical high-pressure belt and subpolar low-pressure belt. About the coupling relationship between SPEI and SST, SPEI was mainly affected by global warming, and was related to SOI and AMO; In particular, La Niña phenomenon could dry out southern NA and central and western Russia; AMO might affect the spatiotemporal variation of SPEI in mid-high latitudes.
In short, this study used a variety of methods to analyze the spatiotemporal pattern of meteorological droughts, the identification of drought events, the evolution of characteristics, and the cause mechanisms in the Northern Hemisphere based on the SPEI index. However, the cause of drought can be further analyzed from the perspective of physical mechanisms in combination with a more stable mathematical model.
Data Availability Statement
The original contributions presented in the study are included in the article/Supplementary Material, further inquiries can be directed to the corresponding author.
Author Contributions
DW and QZ designed the research and wrote the manuscript. DW performed the analysis. VS, ZS, GW, WW, and RY discussed and modified the manuscript. All authors contributed to the interpretation of results.
Funding
This research was supported by the China National Key R&D Program (Grant No. 2019YFA0606900) and the National Natural Science Foundation of China (Grant No. 42041006).
Conflict of Interest
The authors declare that the research was conducted in the absence of any commercial or financial relationships that could be construed as a potential conflict of interest.
Publisher’s Note
All claims expressed in this article are solely those of the authors and do not necessarily represent those of their affiliated organizations, or those of the publisher, the editors and the reviewers. Any product that may be evaluated in this article, or claim that may be made by its manufacturer, is not guaranteed or endorsed by the publisher.
Acknowledgments
Here we also thank the editor, Tomas Halenka, and reviewers for their pertinent and professional comments and suggestions which are greatly helpful for quality improvement of this manuscript.
Supplementary Material
The Supplementary Material for this article can be found online at: https://www.frontiersin.org/articles/10.3389/feart.2022.914232/full#supplementary-material
References
AghaKouchak, A. (2015). A Multivariate Approach for Persistence-Based Drought Prediction: Application to the 2010-2011 East Africa Drought. J. Hydrol. 526, 127–135. doi:10.1016/j.jhydrol.2014.09.063
Allen, M. R., and Ingram, W. J. (2002). Constraints on Future Changes in Climate and the Hydrologic Cycle. Nature 419, 228–232. doi:10.1038/nature01092
Andreadis, K. M., Clark, E. A., Wood, A. W., Hamlet, A. F., and Lettenmaier, D. P. (2005). Twentieth-century Drought in the Conterminous United States. J. Hydrometeorol. 6 (6), 985–1001. doi:10.1175/jhm450.1
Andreas, S., and Hazeleger, W. (2005). The Relative Roles of Tropical and Extratropical Forcing on Atmospheric Variability. Geophys. Res. Lett. 32, 18. doi:10.1029/2005GL023757
Bretherton, C. S., Smith, C., and Wallace, J. M. (1992). An Intercomparison of Methods for Finding Coupled Patterns in Climate Data. J. Clim. 5 (6), 541–560. doi:10.1175/1520-0442(1992)005<0541:aiomff>2.0.co;2
Chen, D., Gao, Y., Zhang, Y., and Wang, T. (2022). Effects of Spring Arctic Sea Ice on Summer Drought in the Middle and High Latitudes of Asia. Atmos. Ocean. Sci. Lett. 15, 100138. doi:10.1016/j.aosl.2021.100138
Cohen, J., Screen, J. A., Furtado, J. C., Barlow, M., Whittleston, D., Coumou, D., et al. (2014). Recent Arctic Amplification and Extreme Mid-latitude Weather. Nat. Geosci. 7, 627–637. doi:10.1038/ngeo2234
Corzo Perez, G. A., van Huijgevoort, M. H. J., Voss, F., and van Lanen, H. A. J. (2011). On the Spatio-Temporal Analysis of Hydrological Droughts from Global Hydrological Models. Hydrol. Earth Syst. Sci. 15 (9), 2963–2978. doi:10.5194/hess-15-2963-2011
Dai, A. (2011). Drought under Global Warming: a Review. WIREs Clim. Change 2 (1), 45–65. doi:10.1002/wcc.81
Dai, A., Trenberth, K. E., and Karl, T. R. (1998). Global Variations in Droughts and Wet Spells: 1900-1995. Geophys. Res. Lett. 25 (17), 3367–3370. doi:10.1029/98gl52511
Dore, M. H. I. (2005). Climate Change and Changes in Global Precipitation Patterns: What Do We Know? Environ. Int. 31, 1167–1181. doi:10.1016/j.envint.2005.03.004
Easterling, D. R., Meehl, G. A., Parmesan, C., Changnon, S. A., Karl, T. R., and Mearns, L. O. (2000). Climate Extremes: Observations, Modeling, and Impacts. Science 289, 2068–2074. doi:10.1126/science.289.5487.2068
Erfanian, A., Wang, G., and Fomenko, L. (2017). Unprecedented Drought over Tropical South America in 2016: Significantly Under-predicted by Tropical SST. Sci. Rep. 7, 5811. doi:10.1038/s41598-017-05373-2
Feng, P., Wang, B., Luo, J.-J., Liu, D. L., Waters, C., Ji, F., et al. (2020). Using Large-Scale Climate Drivers to Forecast Meteorological Drought Condition in Growing Season across the Australian Wheatbelt. Sci. Total Environ. 724, 138162. doi:10.1016/j.scitotenv.2020.138162
Gore, M., Abiodun, B. J., and Kucharski, F. (2020). Understanding the Influence of ENSO Patterns on Drought over Southern Africa Using SPEEDY. Clim. Dyn. 54, 307–327. doi:10.1007/s00382-019-05002-w
Haile, G. G., Tang, Q., Leng, G., Jia, G., Wang, J., Cai, D., Sun, S., Baniya, B., and Zhang, Q. (2020). Long-term spatiotemporal variation of drought patterns over the Greater Horn of Africa, Sci. Total Environ. 704, 135299. doi:10.1016/j.scitotenv.2019.135299
Hamed, K. H., and Ramachandra Rao, A. (1998). A Modified Mann-Kendall Trend Test for Autocorrelated Data. J. Hydrol. 204, 182–196. doi:10.1016/s0022-1694(97)00125-x
Zhe, H, Luo, F., and Wan, J. (2016). The Observational Influence of the North Atlantic SST Tripole on the Early Spring Atmospheric Circulation. Geophys. Res. Lett. 43 (6), 2998–3003. doi:10.1002/2016GL068099
Hayes, M., Svoboda, M., Wall, N., and Widhalm, M. (2011). The Lincoln Declaration on Drought Indices: Universal Meteorological Drought Index Recommended. Bull. Am. Meteorol. Soc. 92 (4), 485–488. doi:10.1175/2010bams3103.1
Herrera-Estrada, J. E., Satoh, Y., and Sheffield, J. (2017). Spatiotemporal Dynamics of Global Drought. Geophys. Res. Lett. 44, 2254–2263. doi:10.1002/2016gl071768
Ji, F., Wu, Z., Huang, J., and Chassignet, E. P. (2014). Evolution of Land Surface Air Temperature Trend. Nat. Clim. Change 4, 462–466. doi:10.1038/nclimate2223
Kerr, R. A. (2000). A North Atlantic Climate Pacemaker for the Centuries. Science 288 (5473), 1984–1985. doi:10.1126/science.288.5473.1984
Lau, N.-C. (1997). Interactions between Global SST Anomalies and the Midlatitude Atmospheric Circulation. Bull. Amer. Meteor. Soc. 78, 21–33. doi:10.1175/1520-0477(1997)078<0021:ibgsaa>2.0.co;2
Linkin, M., and Nigam, S. (2007). The North Pacific Oscillation–West Pacific Teleconnection Pattern: Mature-Phase Structure and Winter Impacts. J. Clim. 21 (9), 1979–1997.
Liu, W., Zhu, S., Huang, Y., Wan, Y., Wu, B., and Liu, L. (2020). Spatiotemporal Variations of Drought and Their Teleconnections with Large-Scale Climate Indices over the Poyang Lake Basin, China. Sustainability 12 (9), 3526. doi:10.3390/su12093526
Lloyd-Hughes, B. (2012). A Spatio-Temporal Structure-Based Approach to Drought Characterisation. Int. J. Climatol. 32 (3), 406–418. doi:10.1002/joc.2280
McRae, D. J. (1971). MIKCA: a FORTRAN IV Iterative K-Means Cluster Analysis Program. Behav. Sci. 16, 423–424. doi:10.1177/003693307101600113
Miller, F. P., Vandome, A. F., and Mcbrewster, J. (2010). Northern Hemisphere. Mishawaka, IN, United States: Alphascript Publishing.
Mishra, A. K., and Singh, V. P. (2010). A Review of Drought Concepts. J. Hydrol. 391 (1-2), 202–216. doi:10.1016/j.jhydrol.2010.07.012
Mishra, P. T., Chandra, R., Saxena, S. K., Verma, S., and Bhuyan, A. (2010). High Sensitivity C-Reactive Protein (hsCRP) Level in Cerebrovascular Accident (Stroke). J. Indian Acad. Clin. Med. 11 (3), 204–207.
Mishra, V., Thirumalai, K., Jain, S., and Aadhar, S. (2021). Unprecedented Drought in South India and Recent Water Scarcity. Environ. Res. Lett. 16, 054007. doi:10.1088/1748-9326/abf289
Mo, R. (2003). Efficient Algorithms for Maximum Covariance Analysis of Datasets with Many Variables and Fewer Realizations: a Revisit. J. Atmos. Ocean. Technol. 20, 1804–1809. doi:10.1175/1520-0426(2003)020<1804:eafmca>2.0.co;2
NASA (2016). NASA Finds Drought in Eastern Mediterranean Worst of Past 900 Years. Available at: https://www.nasa.gov/feature/goddard/2016/nasa-finds-drought-in-eastern-mediterranean-worst-of-past-900-years.
Nguyen, P., Min, S., and Kim, Y. (2021). Combined Impacts of the El Niño‐Southern Oscillation and Pacific Decadal Oscillation on Global Droughts Assessed Using the Standardized Precipitation Evapotranspiration Index. Int. J. Climatol. 41 (S1), E1645–E1662. doi:10.1002/joc.6796
Özger, M., Mishra, A. K., and Singh, V. P. (2009). Low Frequency Variability in Drought Events Associated with Climate Indices. J. Hydrol. 364, 152–162.
Pieper, P., André, D., and Johanna, B. (2021). Improving Seasonal Predictions of Meteorological Drought by Conditioning on ENSO States. Environ. Res. Lett. ERL 16, 9. doi:10.1088/1748-9326/ac1cbb
Ropelewski, C. F., and Jones, P. D. (1987). An Extension of the Tahiti-Darwin Southern Oscillation Index. Mon. Wea. Rev. 115, 2161–2165. doi:10.1175/1520-0493(1987)115<2161:aeotts>2.0.co;2
Sen, P. K. (1968). Estimates of the Regression Coefficient Based on Kendall's Tau. J. Am. Stat. Assoc. 63, 1379–1389. doi:10.1080/01621459.1968.10480934
Sheffield, J., and Wood, E. F. (2008). Projected Changes in Drought Occurrence under Future Global Warming from Multi-Model, Multi-Scenario, IPCC AR4 Simulations. Clim. Dyn. 31 (1), 79–105. doi:10.1007/s00382-007-0340-z
Sheffield, J., Wood, E. F., and Roderick, M. L. (2012). Little Change in Global Drought over the Past 60 Years. Nature 491 (7424), 435–438. doi:10.1038/nature11575
Shiau, J.-T., and Lin, J.-W. (2016). Clustering Quantile Regression-Based Drought Trends in Taiwan. Water Resour. Manage 30, 1053–1069. doi:10.1007/s11269-015-1210-9
Spinoni, J., Barbosa, P., De Jager, A., McCormick, N., Naumann, G., Vogt, J. V., et al. (2019). A New Global Database of Meteorological Drought Events from 1951 to 2016. J. Hydrol. Reg. Stud. 22, 100593. doi:10.1016/j.ejrh.2019.100593
Sternberg, T. (2011). Regional Drought Has a Global Impact. Nature 472 (7342), 169. doi:10.1038/472169d
Stevens, K. A., and Ruscher, P. H. (2014). Large Scale Climate Oscillations and Mesoscale Surface Meteorological Variability in the Apalachicola-Chattahoochee-Flint River Basin. J. Hydrol. 517, 700–714. doi:10.1016/j.jhydrol.2014.06.002
Sun, B., Wang, H., Li, H., Zhou, B., Duan, M., and Li, H. (2022). A Long‐Lasting Precipitation Deficit in South China During Autumn‐Winter 2020/2021: Combined Effect of ENSO and Arctic Sea Ice. JGR Atmos. 127, e2021JD035584. doi:10.1029/2021JD035584
Sun, C. H., and Yang, S. (2012). Persistent Severe Drought in Southern China during Winter-Spring 2011: Large-Scale Circulation Patterns and Possible Impacting Factors. J. Geophys. Res. 117 (D10), D10112. doi:10.1029/2012jd017500
Svoboda, M., and Fuchs, B. A. (2016). “Handbook of Drought Indicators and Indices,” in Integrated Drought Management Program (IDMP), Integrated Drought Management Tools and Guidelines Series 2 (Geneva: World Meteorological Organization). Available at: https://digitalcommons.unl.edu/droughtfacpub/117/.
The Math Works (2014). Image Processing ToolboxTM User’s Guide, Version R2014. Massachusetts, United States: The MathWorks.
Turner, K. J., Burls, N. J., von Brandis, A., Lübbecke, J., and Claus, K. (2022). Seasonality in the Relationship between Equatorial-Mean Heat Content and Interannual Eastern Equatorial Atlantic Sea Surface Temperature Variability. Clim Dyn. doi:10.1007/s00382-021-06116-w
Vicente-Serrano, S. M., Beguería, S., and López-Moreno, J. I. (2010). A Multiscalar Drought Index Sensitive to Global Warming: The Standardized Precipitation Evapotranspiration Index. J. Clim. 23, 1696–1718. doi:10.1175/2009jcli2909.1
Vörösmarty, C. J., Green, P., Salisbury, J., and Lammers, R. B. (2000). Global Water Resources: Vulnerability from Climate Change and Population Growth. Science 289 (5477), 284–288. doi:10.1126/science.289.5477.284
Wang, H., and Kumar, A. (2015). Assessing the Impact of ENSO on Drought in the U.S. Southwest with NCEP Climate Model Simulations. J. Hydrol. 526, 30–41. doi:10.1016/j.jhydrol.2014.12.012
Wang, M., Gu, Q., Jia, X., and Ge, J. (2019). An Assessment of the Impact of Pacific Decadal Oscillation on Autumn Droughts in North China Based on the Palmer Drought Severity Index. Int. J. Climatol. 39 (14), 5338–5350. doi:10.1002/joc.6158
Wang, S., Li, W., Zhou, Y., Yan, F., Wang, F., and Liu, W. (2015). Space-time Evolution of Historical Drought Hazards in Eastern China. Nat. Hazards 77, 2027–2047. doi:10.1007/s11069-015-1685-y
Wilhite, D. A. (2000). Drought as a Natural Hazard: Concepts and Definitions. Lincoln, United States: University of Nebraska - Lincoln.
Wu, R., and Kinter, J. L. (2009). Analysis of the Relationship of U.S. Droughts with SST and Soil Moisture: Distinguishing the Time Scale of Droughts. J. Clim. 22, 4520–4538. doi:10.1175/2009jcli2841.1
Xu, K., Yang, D., Yang, H., Li, Z., Qin, Y., and Shen, Y. (2015). Spatio-temporal Variation of Drought in China during 1961-2012: A Climatic Perspective. J. Hydrol. 526, 253–264. doi:10.1016/j.jhydrol.2014.09.047
Yevjevich, V. (1967). An Objective Approach to Definitions and Investigations of Continental Hydrologic Droughts. Fort Collins, United States: Colorado State University. Available at: http://hdl.handle.net/10217/61303.
Yu, H., Zhang, Q., Xu, C.-Y., Du, J., Sun, P., and Hu, P. (2019). Modified Palmer Drought Severity Index: Model Improvement and Application. Environ. Int. 130, 104951. doi:10.1016/j.envint.2019.104951
Zhang, Q., Li, J., Singh, V. P., and Xiao, M. (2013). Spatio-temporal Relations between Temperature and Precipitation Regimes: Implications for Temperature-Induced Changes in the Hydrological Cycle. Glob. Planet. Change 111, 57–76. doi:10.1016/j.gloplacha.2013.08.012
Zhang, Q., Shi, R., Singh, V. P., Xu, C., Yu, H., Fan, K., et al. (2021). Droughts across China: Drought Factors, Prediction and Impacts. Sci. Total Environ. 803, 150018. doi:10.1016/j.scitotenv.2021.150018
Zhang, Q., Sun, P., Li, J., Singh, V. P., and Liu, J. (2015). Spatiotemporal Properties of Droughts and Related Impacts on Agriculture in Xinjiang, China. Int. J. Climatol. 35 (7), 1254–1266. doi:10.1002/joc.4052
Zheng, Y., Zhang, Q., Luo, M., Sun, P., and Singh, V. P. (2020). Wintertime Precipitation in Eastern China and Relation to the Madden-Julian Oscillation: Spatiotemporal Properties, Impacts and Causes. J. Hydrol. 582, 124477. doi:10.1016/j.jhydrol.2019.124477
Keywords: meteorological droughts, standardized precipitation evapotranspiration index, spatiotemporal evolution, attribution analysis, northern hemisphere
Citation: Wang D, Zhang Q, Singh VP, Shen Z, Wang G, Wu W and Yuan R (2022) Amplifying Meteorological Droughts Across Middle- and Low-Latitude Northern Hemisphere. Front. Earth Sci. 10:914232. doi: 10.3389/feart.2022.914232
Received: 06 April 2022; Accepted: 10 June 2022;
Published: 30 June 2022.
Edited by:
Tomas Halenka, Charles University, CzechiaReviewed by:
Bo Sun, Nanjing University of Information Science and Technology, ChinaKeyan Fang, Fujian Normal University, China
Copyright © 2022 Wang, Zhang, Singh, Shen, Wang, Wu and Yuan. This is an open-access article distributed under the terms of the Creative Commons Attribution License (CC BY). The use, distribution or reproduction in other forums is permitted, provided the original author(s) and the copyright owner(s) are credited and that the original publication in this journal is cited, in accordance with accepted academic practice. No use, distribution or reproduction is permitted which does not comply with these terms.
*Correspondence: Qiang Zhang, emhhbmdxNjhAYm51LmVkdS5jbg==