
95% of researchers rate our articles as excellent or good
Learn more about the work of our research integrity team to safeguard the quality of each article we publish.
Find out more
ORIGINAL RESEARCH article
Front. Earth Sci. , 22 July 2022
Sec. Solid Earth Geophysics
Volume 10 - 2022 | https://doi.org/10.3389/feart.2022.912341
This article is part of the Research Topic Geoscientific Visualization in Solid Earth Geophysics View all 9 articles
 Bateer Wu1,2,3,4*
 Tian Ma3
We present a newly developed three-dimensional seismic velocity model and high-precision earthquake relocations in North China using seismic data recorded by the National Earthquake Data Center of China from 2008 to 2017 through the double-difference tomography (tomoDD) method. The Vp model in the upper crust (below 15 km) generally agrees with those in previous studies, and it fits well with the geological structure. The result shows that the vast majority of earthquakes in North China occurred at the junction of the low-velocity zone (depression zone) and the high-velocity zone (uplift zone). This situation is difficult to change in the short term, so it is highly unlikely that another earthquake of the magnitude of 7.2 in Xingtai in 1966 and 6.2 in Zhangjiakou North in 1998 will occur in these areas in the near future. But in the Tangshan earthquake area, the situation is completely different. Our joint inversion results of 3D P-wave velocity structure and earthquake relocation show that there is a narrow low-velocity anomaly perpendicular to the surface at 20–25 km in the Tangshan area and there are no earthquakes in this anomaly area. The formation of this low-velocity zone is most likely due to the remnants of the delayed subduction of the Pacific plate to the Eurasian plate, and in the context of the Kobe earthquake in Japan, we believe that this anomaly will continue to erode the Tangshan subsurface structure and may cause strong earthquakes in the future. Our study provides the groundwork for future earthquake prevention and mitigation in North China.
According to the plate tectonic theory (Mc.Kenzie and Parker, 1967; Le Pichon, 1968; Morgan, 1968), the global lithosphere was divided into six major plates: the Pacific plate, the Eurasian plate, the Indian Ocean plate, the African plate, the American plate, and the Antarctic plate. The Chinese mainland is part of the Eurasian plate. Its structure and tectonics are affected by the two surrounding tectonic plates: the Pacific plate and the Indian Ocean plate. There are three oldest (>2.5 Ga) cratons (Yangtze, Tarim, and Sino-Korean) in the Chinese continent (Liu et al., 1992). The North China Craton (NCC) is a general term used to refer to the Chinese part of the Sino-Korea Platform, which is an old tectonic unit in mainland China.
It is also seismically one of the most active intracontinental regions in the world (Tian et al., 2009). Many previous studies have shown that North China has experienced significant lithospheric thinning since the late Mesozoic (e.g., Ma et al., 1984; Ye et al., 1987; Griffin et al., 1998; Xu, 2001; Ren et al., 2002; Deng et al., 2003; Huang and Zhao, 2004,2009). The North China Basin is a Mesozoic and Cenozoic rift zone (Ye et al., 1985; Liu, 1987). Our present study area, the Jing-Jin-Ji region, is situated in the northern part of North China. The northern portion of the study area is the relatively stable Yanshan uplift oriented in an E-W direction, while its middle and western part is the active North China Basin and the Taihangshan uplift oriented in an NNE direction. The southeast portion is adjacent to the Bohai Sea (Figure 1). During its long geological history, the North China region has undergone several large tectonic movements that have caused very complex tectonic features. Its main tectonic features are oriented in an NNE direction. Several active seismic belts exist in this region, such as the Tangshan–Xingtai, Beijing–Laishui, and Huailai–Weixian seismic belts, which are all oriented in an NNE direction. However, the most active Zhangjiakou–Penglai seismic belt is oriented in an NNW direction. Most of the large earthquakes, such as the 1976 Tangshan earthquake (M 7.8) and the 1643 Sanhe earthquake (M 8.0), occurred in the intersection area of the two groups of seismic belts (Figure 1). This region is the industrial, commercial, cultural, and political center of China with a population of 110 million. Hence, it is very important to study the crust mantle structure and its relationship with seismic activity for understanding the seismogenesis and for reducing the seismic hazard (Huang and Zhao, 2009).
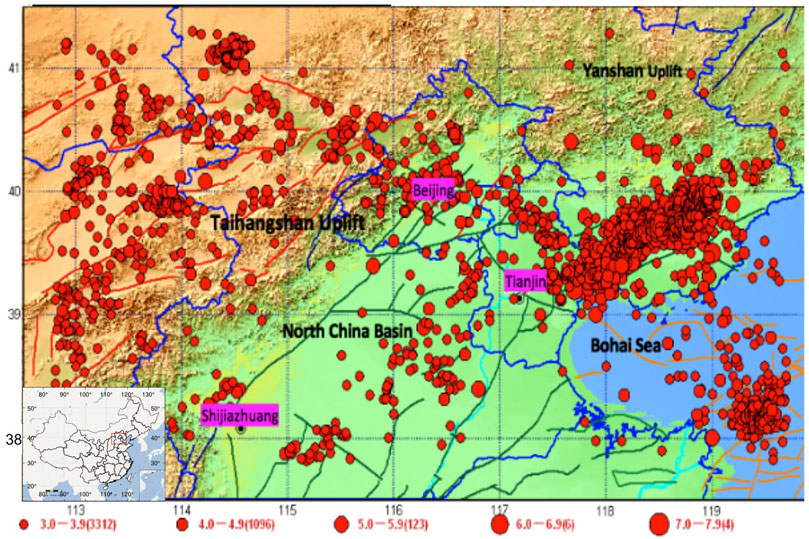
FIGURE 1. Map showing the major geological background and related historical seismicity of North China. The color shows the surface topography. Red curved lines show major active faults, and blue curved lines show provincial boundaries. Red dots denote earthquakes with magnitudes (M) equal to or greater than 3 that occurred in the study area since BC 780. The earthquake magnitude scale and number are shown below the map. The insert map shows the location of the present study area. The red rectangular box indicates the study area in this paper.
Given that the region is the political, economic, and cultural center of China and that a large number of destructive earthquakes have occurred since the beginning of earthquake records, causing great damage to people’s lives and properties, it is necessary to conduct an in-depth study of its seismicity. However, since the usual earthquake reports are not precise in determining the depth of the earthquake source, the study of seismicity cannot achieve the expected results. So, scientists have proposed the double-difference method to improve the accuracy of earthquake relocation (Waldhauser and Ellsworth, 2000), especially the accuracy of earthquake source depth determination. The relative earthquake relocation method calculates the relative position by introducing the time difference, which thus can eliminate the error caused by the uncertainty of velocity model to a considerable extent.
To obtain this advanced earthquake relocation method, seismologists have gone through a long and arduous exploration. The relative earthquake relocation method has been used earliest to study shallow-source seismicity associated with reservoir faults (Fitch and Muirhead, 1974) and to study the depth of earthquakes in the Middle East (Jackson and Fitch, 1979). A detailed exposition of the theory is given by Spence and Gubbins (1980). The basic principle is to select a main event with a relatively accurate earthquake location, calculate the location of a group of events occurring around relative to it, and then calculate the source location of this group of events: the biggest drawback of the main event method is that the determination of the absolute location is strongly dependent on the main event, and the main earthquake error will be transferred to the individual earthquakes to be determined. To avoid the transfer of the main-event error to the pending earthquakes, the multiplet relative relocation method (Got et al., 1994) has been used. This is done by forming a pair of every two earthquakes and establishing the observed travel time difference equation. Waldhauser and Ellsworth (2000) developed this method for the double-difference method (DD: double-difference location). In this method, the relative locations of two earthquakes are determined using the residuals between the observed and theoretically calculated values of their travel time differences (“double difference”). The outstanding advantage of this method is that it can read the time-to-event difference by using the correlation analysis in the spectral domain, which greatly improves the accuracy of the time-to-event data.
On the contrary, researchers found that, to improve the earthquake localization accuracy, in addition to the relative localization method, a more reasonable initial velocity model, such as a three-dimensional velocity model, should be used. In 2003, Zhang et al. developed a double-difference tomography (tomoDD) program based on the double-difference earthquake relocation program (hypoDD), which can simultaneously invert the exact seismic position and the three-dimensional seismic wave velocity structure. In this paper, we will use this method to obtain more accurate earthquake locations in North China, thus providing a strong support for the study of seismicity in the region. Many researchers in China have successfully applied the double-difference localization method to study the small-earthquake’s precise location in North China and obtained new and more reliable results (Zhu A. L. et al., 2005; Zhang et al., 2011; Liet al., 2015). However, the lack of simultaneous inversion of the 3D seismic wave velocity structure does not allow us to find the causal relationship between earthquake occurrence and crustal structure, limiting the usefulness of these studies to support seismicity studies. In this study, we propose to use the seismic P-wave arrival data from 2008 to 2017 in North China to simultaneously invert the precise location of earthquakes (especially the accurate depth of the hypocenter) and the 3D P-wave velocity structure of the North China crust, so as to visually give the characteristics of the seismic wave velocity structure at the historical earthquake locations and thus provide stronger support for the analysis of earthquake trends’ potential and seismic risk areas, thus contributing more to the reduction of seismic risk in the metropolitan area.
In this study, we used the double-difference tomography (tomoDD) method developed by Zhang and Thurber (2003), which is a tomography technique that combines the double-difference method with tomography. The detailed derivation is as follows:
The body-wave arrival time T from an earthquake i to a seismic station k is expressed using ray theory as a path integral, where τ is the origin time of event i, u is the slowness field, and ds is an element of path length. The source coordinates (x1, x2, x3), origin times, ray paths, and slowness field are the unknown ones. The relationship between the arrival time and the event location is highly non-linear, so a truncated Taylor series expansion is generally used to linearize Eq. 1. This linearly relates the misfit between the observed and predicted arrival times to the desired perturbations to the hypocenter and velocity structure parameters:
Subtracting a similar equation for event j observed at station k from Eq. 2, Zhang and Thurber (2003) have
Assuming that these two events are near each other so that the paths from the events to a common station are almost identical and the velocity structure is known, Eq. 3 can be simplified as
where dr
The observed differential arrival times
In this approach, earthquake locations may be biased when interevent distances exceed the scale length of velocity variations. Waldhauser and Ellsworth (2000) applied a distance-weighting factor to reduce or exclude data from event pairs that are far apart. Although the arrival difference data from such events may be excluded, they can still be linked in the inversion via a series of intermediate pairs (Got et al., 1994). For example, the pair T
To overcome this limitation, Zhang and Thurber (2003) used the differential arrival time data and Eq. 3 directly. It is known that there is a coupling effect between the event hypocenters and the velocity structure (Thurber, 1992). Their purpose is to determine not only the relative event locations but also their absolute locations and the velocity structure. Also note that the ray paths from two nearby events will substantially overlap, meaning that the model derivatives in Eq. 3 will essentially cancel outside the source region. For this reason, Zhang and Thurber (2003) included the absolute arrival times in the inversion to resolve the velocity structure outside the source region. By doing this, Zhang and Thurber (2003) jointly determined the velocity structure and the relative event locations as well as the absolute event locations accurately.
In summary, the method takes into account the path difference between the pairs of events ignored in double-difference positioning, adds the path difference between the event pairs in the inversion, and combines the absolute travel time of the event with the time difference of the event pair, so after the inverse performance, the source information and the underground velocity structure are more accurate.
The seismic arrival time data which we used in this study are sharing Infrastructure of National Earthquake Data Center (http://data.earthquake.cn). In the time span from 1 January 2008 to 30 September 2017, there are 323,901 P-wave travel time data, involving 18,388 earthquakes (the spatial scope is 36°N–43°N, 113°E–120°E) (Figure 2). There are 200 fixed seismic stations in this area (Figure 2). In order to obtain better inversion results and to ensure the reliability of the inversion results, the obtained seismic phase arrivals were selected according to the following criteria: seismic events observed by at least eight seismic stations; and according to the method of fitting the time–distance curve, the time information with obvious abnormalities in the initial data is excluded, i.e., the time outside the interval enclosed by the two green lines in Figure 3; the number of seismic pairs was no more than 30, the distance from the seismic pair to the station was no more than 800 km, the distance between each pair was between 0.1 and 30 km, and the number of seismic phases required for each pair was between 8 and 120. This resulted in 8,059 valid seismic events, including 163,527 absolute P-wave arrivals and 2,011,338 relative P-wave arrivals.
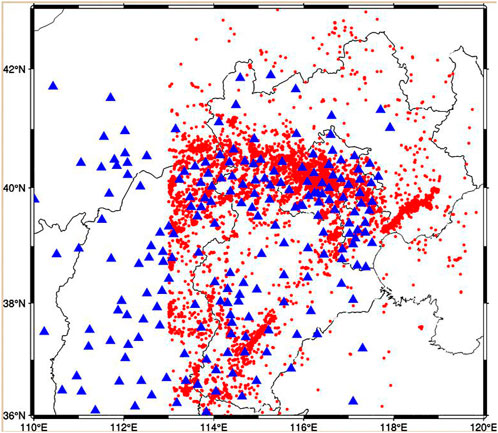
FIGURE 2. Distribution of seismic station (blue triangle) and earthquake epicenter (red circle) used in this study.
The double-difference tomography (tomoDD) method is based on a 3D regular grid for model parameterization. In order to select the best grid node spacing, we repeatedly performed resolution tests with the seismic phase data, station distribution, and earthquake epicenter location in this study. By comparing the resolution results obtained with different grid node spacing, we finally divided the 3D velocity structure model in the study area at 0.5°×0.5° in the horizontal direction and at 5 km intervals in the vertical direction from 0 to 45 km depth. The initial velocity model of this study is a reference Yu et al. (2003)’s speed model, which is adjusted appropriately (Table 1). The inversion process uses smoothness and damping factors to ensure the stability of the inversion results (Thurber et al., 2009), and the L-curve (Eberhart-Phillips, 1986) is used to set the smoothness factor to 20 and the damping factor to 600 after several tests (Figure 4).

TABLE 1. One-dimensional underground velocity structure in Hebei Province (Yu et al., 2003).
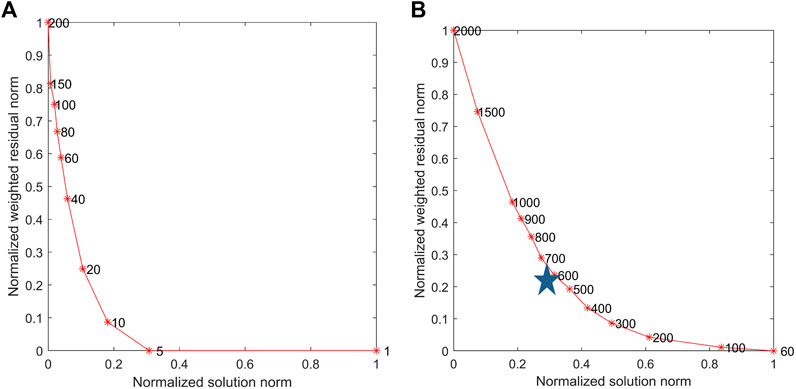
FIGURE 4. Trade-off curves for determining the best values of smoothing (A) and damping (B) parameters.
The P-wave checkerboard resolution test is used to determine whether the inversion results are reliable (Humphreys and Clayton, 1988; Inoue et al., 1990; Zhao et al., 1992). The P-wave checkerboard resolution test results are obtained by adding ±5% perturbation between the nodes of the initial velocity model grid and then inverting the results of the P-wave checkerboard resolution test. If the velocity variation of the test is positive and negative, the resolution is high and the inversion result is reliable. From the results of P-wave checkerboard resolution test shown in Figure 5, we can see that the resolution of the P-wave inversions is higher in the depth range of 5–15 km and lower in the depths of 20–30 km. This is because there is few seismicity in the depths of 20–30 km and the ray density is low; however, the P-wave resolution is much better at 35–45 km depths (top of the upper mantle), which is because the Pn waves are mainly propagated at the top of the upper mantle, and we have gained a lot of P-wave arrival time data from the seismic station which is far from the center of our study area; therefore, we can obtain better coverage of the seismic rays at a depth of 30–45 km, which can help us to invert the results with great reliability.
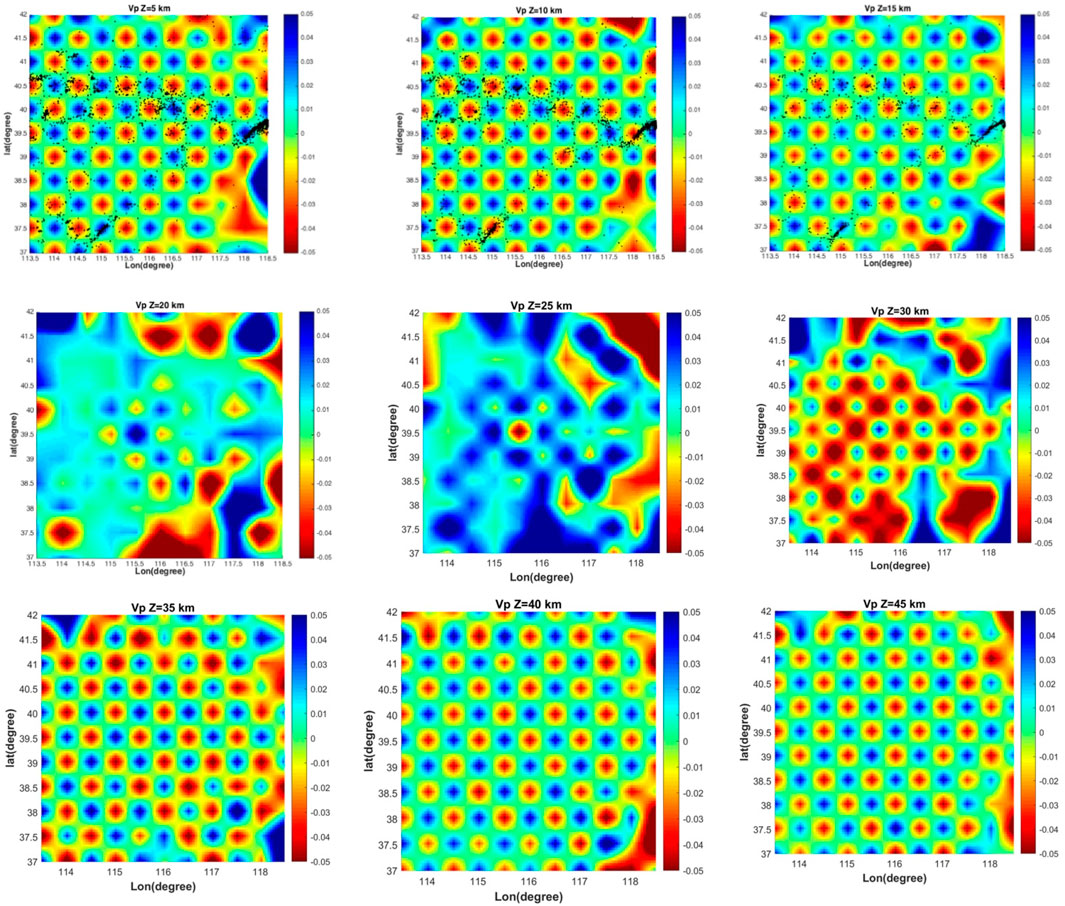
FIGURE 5. Results of the P-wave checkerboard resolution test. The depth of the layer is shown on the top of each map.
The tomographic inversion is convergent after 10 iterations, and the root-mean-square (RMS) of the absolute arrival time residuals of the selected 8,059 earthquakes is reduced from 0.8918 to 0.3094s for P arrivals. From this, it can be found that the continuous iteration of the inversion effectively improves the accuracy of the results. Figure 6 shows the map views of our final P-wave velocity model structures at different depths and the relocated earthquakes in the range of 2.5 km above and below each depth level, indicating the existence of significant structural heterogeneities in the crust and uppermost mantle in this region. In the shallow crust [i.e., at 5 and 10 km depths (as shown in Figures 6A,B)], the seismic P-wave velocity anomalies are in good agreement with the surface geological structures (as shown in Figure 1) and active fractures, such as the Yanshan uplift and Taihangshan uplift both corresponding to seismic P-wave high-speed anomalies. In the North China Basin (as shown in Figure 1), the situation is more complicated; the Jizhong depression and the Huanghua depression correspond to seismic P-wave low-velocity anomalies, and the Cangxian uplift corresponds to seismic P-wave high-speed anomalies. These three form a sandwich-like structure, which is consistent with the results of previous studies (Huang and Zhao, 2004; Hu et al., 2008; Huang and Zhao, 2009) (Figure 7). In addition, we find that the seismicity of the shallow crust mainly occurs in the Zhangjiakou-Bohai seismic zone and northeast of Xingtai, both of which are seismic P-wave high- and low-velocity transition regions (as shown in Figures 6A–C). Most of the earthquakes in North China were located at a depth of 15 km or more shallow depth (as shown in Figures 6A–E). This is also very consistent with the previous results (Wang et al., 2016). In the deeper part, the Taihang Mountains show low-velocity anomalies at 40 km depth, while most of the Yanshan Mountains and the North China Plain show high velocities (as shown in Figure 6H). These results are similar to those of Pn wave tomography (Huang and Zhao, 2004; Huang and Zhao, 2009; Pei et al., 2007).
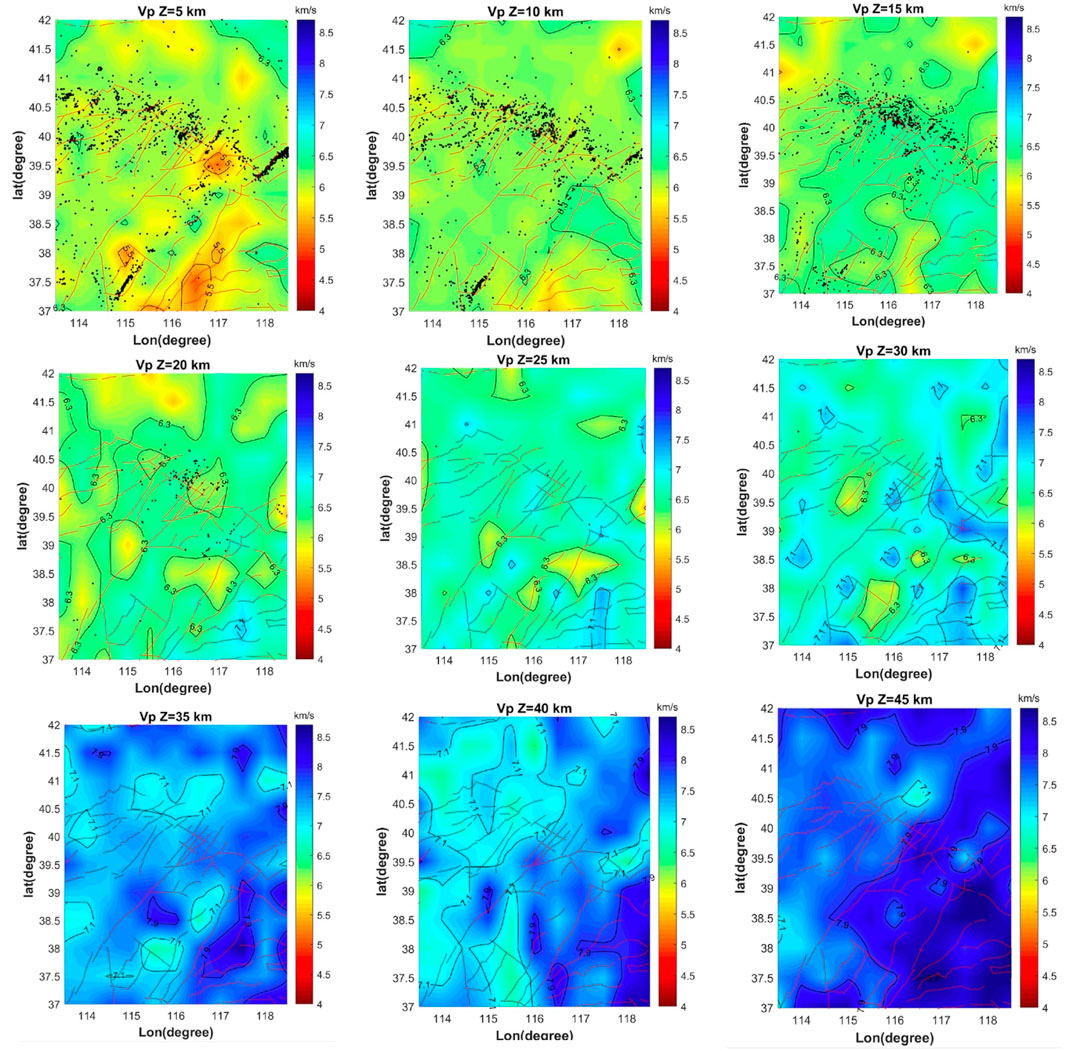
FIGURE 6. P-wave velocity image at each depth slice. The depth of each layer is shown on the top of each map. Red and blue colors denote low and high velocities, respectively. Black dots indicate the relocated seismicity within ±2.5 km distance of the profile lines. The red curved line shows major active faults.
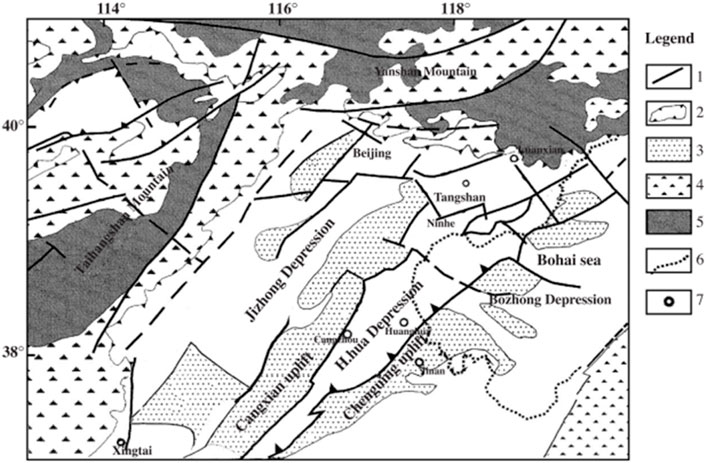
FIGURE 7. Tectonic map of North China. The legend is shown on the right. Dashed lines show the deduced faults. (1) Major faults, (2) boundary of Cenozoic basins, (3) uplift areas in the North China Basin, (4) granitic areas, (5) pre-Cambrian basement, (6) coast line, and (7) cities (Huang and Zhao, 2004).
Figures 8A–H present eight vertical cross-sections of P-wave velocity images, respectively. Blue and red colors denote high and low velocities, respectively, and black dots indicate the relocated seismicity. The locations of the profiles are shown as solid red lines in Figure 8I. The solid blue curve in Figure 8I indicates the major active faults. The P-wave velocity distribution can be seen along 37.5°N (Figure 8A), 39.5°N (Figure 8B), 40°N (Figure 8C), 40.5°N (Figure 8D) and 115°E (Figure 8E), 115.5°E (Figure 8F), 117.5°E (Figure 8G), 118.5°E (Figure 8H). It can also be seen that the junction zone between the high-velocity anomaly and the low-velocity anomaly of P-wave velocity in the shallow part reflects well the junction between the uplift zone and the plains and basins. For example, on the profile at 115°E (Figure 8E), there is an intersection area between a plain or depression area (low-velocity anomaly) and an uplift area (high-velocity anomaly) at 40.5°N, and on the profile at 115.5°E (Figure 8F), there are two intersection areas between a plain or depression area (low-velocity anomaly) and an uplift area (high-velocity anomaly) at 37.5°N and 39.5°E. In addition, there are three mutually corroborating plains or depressions (low-velocity anomalies) and uplifts (high-velocity anomalies) at 37.5°N (Figure 8A), 39.5°N (Figure 8B), and 40°N (Figure 8C) and three mutually corroborating plains or depressions (low-velocity anomalies) and uplifts (high-velocity anomalies) at 114.5°E, 115.5°E, and 118.5°E. These areas are also the locations of the northeast Xingtai seismically active area and the Zhangjiakou seismically active area. In contrast, both the 117°E and 40°N profiles show a high-speed anomaly zone extending from 10 km below ground to about 20 km below ground in the Beijing and Tianjin areas. In particular, below the Tangshan area, there is a very low velocity anomaly with a P-wave velocity of only 5.6 km/s at 20–25 km below ground, which is about 12.5% lower than the normal velocity of 6.4 km/s in the surrounding area. We also found an anomalous high-speed zone (14.3% higher than the surrounding area) about 220 km north of Tangshan in these two profiles, which should be in the Yanshan uplift zone of Chengde City.
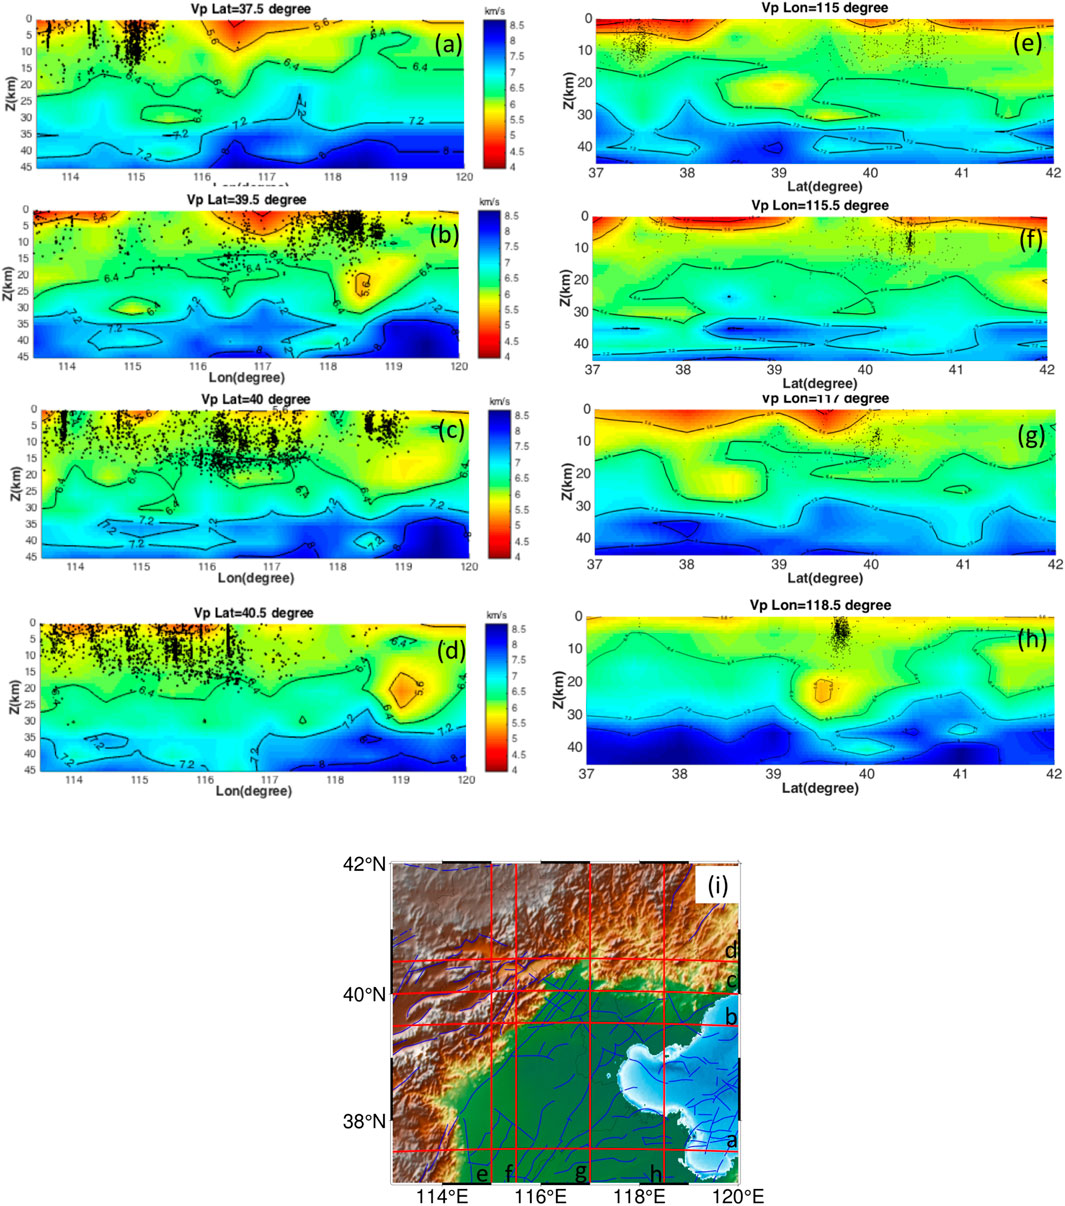
FIGURE 8. (A–H) Eight vertical cross-sections of P-wave velocity images. Blue and red colors denote high and low velocities, respectively. Black dots indicate the relocated seismicity. The locations of the profiles are shown as solid red lines in (I). The solid blue curve in (I) indicates the major active faults.
According to the principle of double-difference seismic tomography (tomoDD) (Zhang and Thurber, 2003), the exact location of seismic events is inverted along with the inversion of the seismic wave velocity structure, which gives an advantage over the previous double-difference seismic localization method (hypoDD) (Waldhauser and Ellsworth, 2000), which relies on the one-dimensional seismic wave velocity structure to invert the accurate location of earthquakes; after all, according to Figure 8, vertical cross-sections of P-wave velocity images and P-wave velocity structure at each depth slice, we know that the subsurface in North China has an unusually complex seismic wave velocity distribution, especially in the Tangshan earthquake zone, Zhangjiakou-Bohai earthquake zone, and Xingtai northeast-oriented earthquake zone. It is difficult to invert the accurate locations of earthquakes in these regions using only one-dimensional seismic wave velocity structures. This can also be seen by the change in the root-mean-square (RMS) residuals of the seismic wave arrival times, which were reduced from 0.8918 to 0.3094s for the selected 8,059 earthquakes after 10 iterations. The variance is reduced by up to 89.57%. Figure 9 (approach from Thurber et al. (2009)) shows the distribution of the travel time residuals before (top of Figure 9) and after (bottom of Figure 9) the inversion, with more than 95% of the rays having residuals less than 0.5 s after the inversion. We can clearly see that, after the inversion, the localization results are more reliable and the model resolution is more refined.
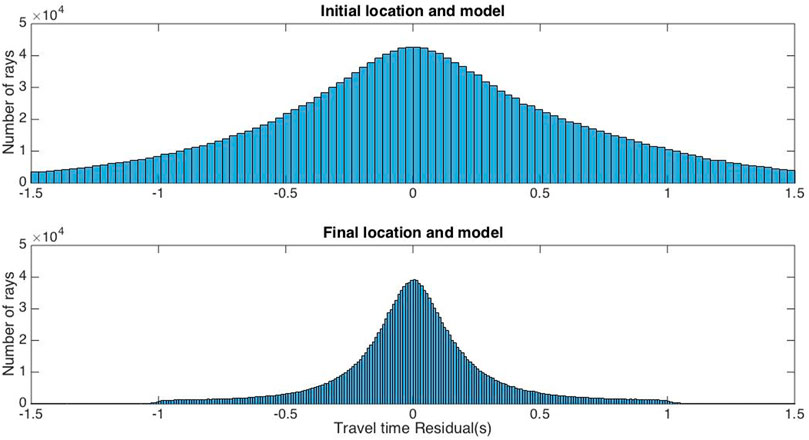
FIGURE 9. Residual misfit improvement. Compilation of the overall number of earthquakes with root-mean-square misfit in bins with widths of 0.15s, comparing (top) the starting 1D model to (bottom) the final 3D model.
Figure 10 shows the three views of the relocation (the red circle in Figures 10A,B and Figure 10E) and the initial CENC catalog (the blue circle in Figure 10A, Figure 10C, and Figure 10F) of epicenters. Note that the initial CENC catalog is based on 1D velocity models; therefore, the determination of the earthquake source location (longitude, latitude, and depth) is not accurate, especially the determination of the source depth, which has a very large deviation, as can be seen in Figure 10C and Figure 10F, both of which show an obvious distribution of the source like a knife cut, which is obviously not in accordance with the actual occurrence of natural earthquakes. However, if we look at the depth distribution of the earthquake sources obtained by our inversion of the 3D seismic P-wave velocity model (Figures 10B,E), we can see that not only is the distribution more sharpening, but it also fits well with the surface topography. Moreover, the average value of the error after relocation is 532.3 m in the east–west direction, 538.8 m in the north–south direction, and 939.3 m in the depth direction; compared with Yu et al. (2010)’s results, the errors in the east–west, north–south, and depth directions are reduced by 46.77, 51.02, and 37.38%, respectively.
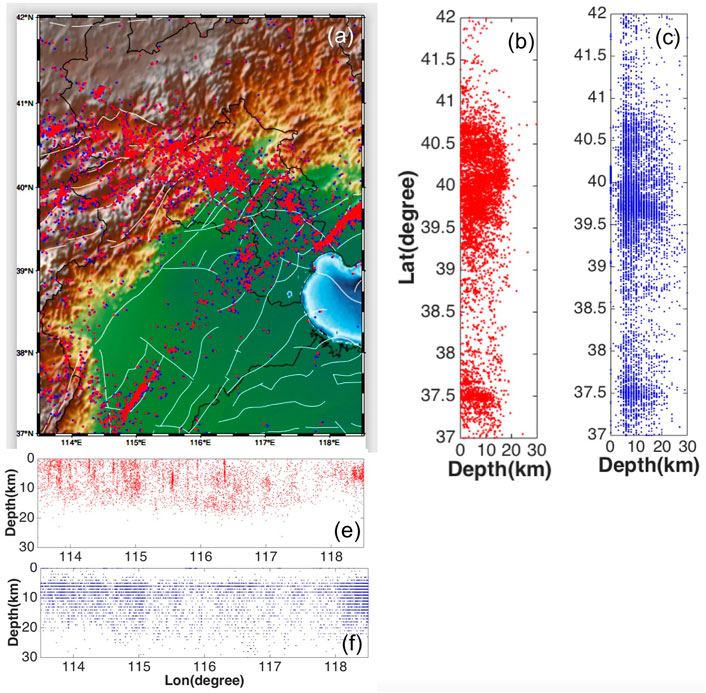
FIGURE 10. Three views of the relocation (the red solid dots in (A), (B), and (E)) and initial location (the blue solid dots in (A), (C), and (F)) of epicenters.
Earlier tomographic studies either used a small number of local or teleseismic data for this region, so their results have a lower resolution (e.g., Jin et al., 1980; Shedlock and Roecker, 1987; Zhu et al., 1990) and their models are limited to a shallower depth (e.g., Sun and Liu, 1995; Yu et al., 2003), or used a large number of local and regional data, but the spatial resolution of the lower crustal image is still limited due to the use of the first arrivals alone (e.g., Huang and Zhao, 2004; Qi et al., 2006). Even some researchers used both P and PmP data to determine the detailed structure in North China (Lei et. al., 2008); unfortunately, the accurate location of seismic events and the velocity structure of seismic waves in the region are not simultaneously inverted, so it is not possible to gain insight into the mechanism of earthquake occurrence in the region and to predict future earthquake trends (Lei et al., 2008). Although Yu et al. (2010) have used the tomoDD program to simultaneously invert the velocity structure of seismic waves and the precise location of seismic events in the region, their checkerboard resolution test results showed that the results were more reliable only for the depth above 15 km below ground, so they could only explain the mechanism of previous earthquakes in the region and also could not make a judgment on the trend of future earthquakes. We note that, in Figures 8B,H, a narrow, nearly vertical, low-velocity anomaly extending from 20 km below ground to 25 km below ground is evident below the Tangshan area, and 5–7 km above this anomaly is the area where aftershocks from the 28th July 1976 Tangshan 7.8 magnitude earthquake gathered. Then, how this anomaly was formed? There are so many scientists who have studied it. They believe that the long-term influence of the fluids on the seismogenic layer would change the structural and compositional evolution of fault zones, reduce the medium strength of fault zones, and alter the local stress regime (Sibson, 1992; Hickman et al., 1995). The concentration of stresses on certain portion of the fault zone would lead to the mechanical failure and the earthquake occurrence. Fluids in the fractured rock matrix in the source area of the 1995 Kobe earthquake (Zhao et al., 1996) were considered to be related to the dehydration of the subducting Philippine Sea slab under SW Japan (Zhao et al., 2002; Salah and Zhao, 2003). In eastern China, low-velocity anomalies under the source area of the Tangshan earthquake could be caused by the deep fluids, which would be associated with the deep dehydration of the Pacific slab that is stagnant in the mantle transition zone (e.g., Fukao et al., 1992; Zhao and Lei, 2004; Lei and Zhao, 2005; 2006a; Huang and Zhao, 2006; Lei et al., 2008). We can boldly speculate that this narrow, low-velocity anomaly 20–25 km beneath Tangshan is also due to the formation of the Pacific plate during its subduction to the Eurasian plate due to being blocked later (before blocking, it is the process of releasing the energy of the violent interaction between the Pacific and Eurasian plates, during which the 1976 Tangshan 7.8 magnitude earthquake occurred), as also shown in the study by Wang et al. (2016). The 1976 Tangshan 7.8 earthquake occurred in a place with a small geothermal gradient, which also confirms that this narrow anomaly is most likely a remnant from the subduction of the Pacific plate to the Eurasian plate. Combined with the situation of the Kobe earthquake in Japan in 1995, we can boldly predict that this long and narrow anomaly will continue to erode the subsurface structure in the future and even restart the process of subduction of the Pacific plate to the Eurasian plate in the Tangshan area, thus triggering a powerful earthquake no less than the Tangshan earthquake.
As for the earthquakes in the northeastern region of Xingtai and those in the Bohai seismic zone of Zhangjiakou except Tangshan, according to the results in Figures 6A–C and Figures 8A–F, they basically occurred at the junction of the high-speed zone of seismic waves and the low-velocity zone, reflecting also the changes in the surface geological structure, and analyzing from the source depth, they are also in the same range as historical earthquakes, so we can boldly predict that it will be difficult to have new destructive earthquakes in these regions in the next few decades that exceed the 1966 Xingtai 7.2 earthquake and the 1998 6.2 magnitude earthquake. These understandings are consistent with the results of Xieet al. (2019) on the seismicity in the Beijing–Tianjin–Hebei region, and we both agree that there is a high probability of strong earthquakes in Tangshan in the future, with the difference that they consider the possibility of moderate to strong earthquakes in Xingtai as well, but since they mainly use b-values to conduct statistical studies, not much consideration is given to the source distribution and tectonic changes in the earth’s crust and upper mantle. Therefore, we have more confidence in the inverse results of our study.
The 3D velocity structure of seismic P-waves and high-precision earthquake relocations in North China were both inverted by using the seismic data recorded by the National Earthquake Data Center of China from 2008 to 2017 through the double-difference tomography (tomoDD) method. And the results show the following:
1) The vast majority of earthquakes in North China occurred at the junction of the low-velocity zone (depression zone) and the high-velocity zone (uplift zone or uplift zone), which fit well with the geological structure of the upper crust, such as the northeast Xingtai seismic zone and the Zhangjiakou-Bohai seismic zone (except for the Tangshan seismic zone). Coupled with the fact that the earthquakes in these areas in recent years have occurred at the superior source depths of historical earthquakes, we believe that it is highly unlikely that another earthquake of the magnitude of 7.2 in Xingtai in 1966 and 6.2 in Zhangjiakou North in 1998 will occur in these areas in the near future.
2) It is worth noting that there is a narrow low-velocity anomaly perpendicular to the surface at 20–25 km in the Tangshan area. The formation of this low-velocity zone is most likely due to the remnants of the delayed subduction of the Pacific plate to the Eurasian plate, and in the context of the Kobe earthquake in Japan, we believe that this anomaly will continue to erode the Tangshan subsurface structure and may cause strong earthquakes in the future. It is worthy of continuous attention.
3) In our future work, we will collect the seismic S-wave data passing under the Tangshan area, recruit colleagues in seismic subsurface fluids, geochemistry, and earthquake geology to join the group, and conduct a comprehensive study of the narrow seismic wave velocity anomaly in the Tangshan area, so that we can trace the inflammation and lesioning process of this anomaly, which will not only provide support and guarantee for the cause of earthquake prevention and mitigation but also contribute to the cause of real-time seismology. We hope to contribute to the development of real-time seismology.
Publicly available datasets were analyzed in this study. These data can be found here: http://data.earthquake.cn.
The first author BW is a doctoral student in the University of Chinese Academy of Sciences. He was responsible for the main work of this paper, such as proposing the viewpoint, implementing the algorithm, data processing, data analysis, picture drawing, deriving the conclusion, and discussing the results. The second author MT was responsible for data processing, data analysis, and picture drawing.
This work was supported by the National Natural Science Foundation of China (Grant No. 41474068), the Fundamental Research Funds for the Central Universities. (Grant No. ZY20160213) and Maintenance of short-period dense seismic instrumentation in Baiyun Ebo mining area (Grant No. 2020006).
The authors declare that the research was conducted in the absence of any commercial or financial relationships that could be construed as a potential conflict of interest.
All claims expressed in this article are solely those of the authors and do not necessarily represent those of their affiliated organizations, or those of the publisher, the editors, and the reviewers. Any product that may be evaluated in this article, or claim that may be made by its manufacturer, is not guaranteed or endorsed by the publisher.
We give acknowledgment for data support from the “China Earthquake Networks Center, National Earthquake Data Center (http://data.earthquake.cn).”
Deng, J. F., Mo, X. X., Zhao, H. L., Wu, Z. X., Luo, Z. H., and Su, S. G. (2004). A New Model for the Dynamic Evolution of Chinese Lithosphere: 'continental Roots-Plume Tectonics'. Earth-Science Rev. 65, 223–275. doi:10.1016/j.earscirev.2003.08.001
Eberhart-Phillips, D. (1986). Three-dimensional Velocity Structure in Northern California Coast Ranges from Inversion of Local Earthquake Arrival Times. Bull. Seismol. Soc. Am. 76, 1025–1052.
Fitch, T. J., and Muirhead, K. J. (1974). Depths to Larger Earthquakes Associated with Crustal Loading. Geophys J. R.Astr.Soc. 37, 285–296. doi:10.1111/j.1365-246x.1974.tb01239.x
Fukao, Y., Obayashi, M., Inoue, H., and Nenbai, M. (1992). Subducting Slabs Stagnant in the Mantle Transition Zone. J. Geophys. Res. 97, 4809–4822. doi:10.1029/91jb02749
Got, J.-L., Fréchet, J., and Klein, F. W. (1994). Deep Fault Plane Geometry Inferred from Multiplet Relative Relocation beneath the South Flank of Kilaueaflank of Kilauea. J. Geophys. Res. 99 (15), 15375. doi:10.1029/94JB00577
Griffin, W. L., Andi, Z., O'Reilly, S. Y., and Ryan, C. G. (1998). “Phanerozoic Evolution of the Lithosphere beneath the Sino-Korean Craton,” in Mantle Dynamics and Plate Interactions in East Asia. Geodyn. Ser. Editor M. Flower, S. L. Chung, and C. H. Lo, (Washington, DC, AGU), 107–126. doi:10.1029/gd027p0107
Hickman, S., Sibson, R., and Bruhn, R. (1995). Introduction to Special Section: Mechanical Involvement of Fluids in Faulting. J. Geophys. Res. 100, 12831–12840. doi:10.1029/95jb01121
Hu, Z. M., Wang, F. Y., Liu, M. J., Hua, X. S., and Deng, X. H. (2008). Inversion of the Velocity Structure of the Upper Crust in the Capital Circle Using Pg Wave Travel Time. North China Earthq. Sci. 26, 1–6. (in Chinese). doi:10.3969/j.issn.1003-1375.2008.02.001
Huang, J., and Zhao, D. (2004). Crustal Heterogeneity and Seismotectonics of the Region Around Beijing, china. Tectonophysics 385, 159–180. doi:10.1016/j.tecto.2004.04.024
Huang, J., and Zhao, D. (2006). High-resolution Mantle Tomography of China and Surrounding Regions. J. Geophys. Res. 111. doi:10.1029/2005JB004066
Huang, J., and Zhao, D. (2009). Seismic Imaging of the Crust and Upper Mantle under Beijing and Surrounding Regions. Phys. Earth Planet. Interiors 173, 330–348. doi:10.1016/j.pepi.2009.01.015
Humphreys, E., and Clayton, R. W. (1988). Adaptation of Back Projection Tomography to Seismic Travel Time Problems. J. Geophys. Res. 93, 1073–1085. doi:10.1029/jb093ib02p01073
Inoue, H., Fukao, Y., Tanabe, K., and Ogata, Y. (1990). Whole Mantle P-Wave Travel Time Tomography. Phys. Earth Planet. Interiors 59, 294–328. doi:10.1016/0031-9201(90)90236-q
Jackson, J., and Fitch, T. J. (1979). Seismotectonic Implications of Relocated Aftershock Sequences in Iran and Turkey. Geophys. J. Int. 57, 209–229. doi:10.1111/j.1365-246X.1979.tb03781.x
Jin, A. S., Liu, F. T., and Sun, Y. Z. (1980). Three Dimensional P Velocity Structure of the Crust and Upper Mantle under Beijing Region. Acta Geophys. Sin. 23, 172–182. (in Chinese).
Le Pichon, X. (1968). Sea-floor Spreading and Continental Drift. J. Geophys. Res. 73, 3661–3697. doi:10.1029/JB073i012p03661
Lei, J., Xie, F., Lan, C., Xing, C., and Ma, S. (2008). Seismic Images under the Beijing Region Inferred from P and PmP Data. Phys. Earth Planet. Interiors 168, 134–146. doi:10.1016/j.pepi.2008.06.005
Lei, J., and Zhao, D. (2005). P-Wave Tomography and Origin of the Changbai Intraplate Volcano in Northeast Asia. Tectonophysics 397, 281–295. doi:10.1016/j.tecto.2004.12.009
Li, H. G., Wang, L. Y., Sun, G., Zhang, H. X., and Li, W. H. (2015). Seismicity Characterized by Relocation of Small to Moderate Earthquakes in North China. Earthquake 35, 28–37. (in Chinese).
Liu, D., Y., Nutman, A., P., Compston, W., Wu, J. S., and Shen, Q. H. (1992). Remnants of ≥3800 Ma Crust in the Chinese Part of the Sino-Korean Craton. Geology 20, 339–342. doi:10.1130/0091-7613(1992)020<0339:ROMCIT>2.3.CO;2
Liu, G. (1987). The Cenozoic Rift System of the North China Plain and the Deep Internal Process. Tectonophysics 133, 277–285. doi:10.1016/0040-1951(87)90270-8
Ma, X. Y., Liu, G. D., and Su, J. (1984). The Structure and Dynamics of the Continental Lithosphere in North-Northeast china. Ann. Geophys. 2 (6), 611–620.
Mckenzie, D. P., and Parker, R. L. (1967). The North Pacific: an Example of Tectonics on a Sphere. Nature 216, 1276–1280. doi:10.1038/2161276a0
Morgan, W. J. (1968). Rises, Trenches, Great Faults, and Crustal Blocks. J. Geophys. Res. 73, 1959–1982. doi:10.1029/jb073i006p01959
Pei, S., Zhao, J., Sun, Y., Xu, Z., Wang, S., Liu, H., et al. (2007). Upper Mantle Seismic Velocities and Anisotropy in China Determined through Pn and Sn Tomography. J. Geophys. Res. 112, B05312. doi:10.1029/2006JB004409
Qi, C., Zhao, D., Chen, Y., Chen, Q., and Wang, B. (2006). P- and S-Wave Velocity Structure and its Relationship to Strong Earthquakes in the Chinese Capital Region. Chin. J. Geophys 49, 805–815. (in Chinese).
Ren, J., Tamaki, K., Li, S., and Junxia, Z. (2002). Late Mesozoic and Cenozoic Rifting and its Dynamic Setting in Eastern china and Adjacent Areas. Tectonophysics 344, 175–205. doi:10.1016/S0040-1951(01)00271-2
Salah, M. K., and Zhao, D. (2003). 3-D Seismic Structure of Kii Peninsula in Southwest Japan: Evidence for Slab Dehydration in the Forearc. Tectonophysics 364, 191–213. doi:10.1016/s0040-1951(03)00059-3
Shedlock, K. M., and Roecker, S. W. (1987). Elastic Wave Velocity Structure of the Crust and Upper Mantle beneath the North China Basin. J. Geophys. Res. 92, 9327–9350. doi:10.1029/jb092ib09p09327
Sibson, R. H. (1992). Implications of Fault-Valve Behaviour for Rupture Nucleation and Recurrence. Tectonophysics 211, 283–293. doi:10.1016/0040-1951(92)90065-e
Spencer, C., and Gubbins, D. (1980). Travel-time Inversion for Simultaneous Earthquake Location and Velocity Structure Determination in Laterally Varying Media. Geophys. J. Int. 63, 95–116. doi:10.1111/j.1365-246x.1980.tb02612.x
Sun, R., and Liu, F. (1995). Crust Structure and Strong Earthquakes in Beijing, Tianjin and Tangshan Area. I. P-Wave Velocity Structure. Chin. J. Geophys 38, 599–607. (in Chinese).
Thurber, C. H. (1992). Hypocenter-velocity Structure Coupling in Local Earthquake Tomography. Phys. Earth Planet. Interiors 75, 55–62. doi:10.1016/0031-9201(92)90117-E
Thurber, C., Zhang, H., Brocher, T., and Langenheim, V. (2009). Regional Three-Dimensional Seismic Velocity Model of the Crust and Uppermost Mantle of Northern California. J. Geophys. Res. 114, B01304. doi:10.1029/2008JB005766
Tian, Y., Zhao, D., Sun, R., and Teng, J. (2009). Seismic Imaging of the Crust and Upper Mantle beneath the North china Craton. Phys. Earth Planet. Interiors 172, 169–182. doi:10.1016/j.pepi.2008.09.002
Waldhauser, F., and Ellsworth, W. L. (2000). A Double-Difference Earthquake Location Algorithm: Method and Application to the Northern Hayward Fault, California. Bull. Seismol. Soc. Am. 90, 1353–1368. doi:10.1785/0120000006
Wang, J., Li, C. F., Lei, J. S., and Zhang, G. W. (2016). Relationship between Seismicity and Crustal Thermal Structure in North Chin. Acta Seismol. Sin. 38, 618–631. (in Chinese). doi:10.1l939/jass.2016.04008
Xie, Z. J., Lv, Y. J., and Fang, Y. (2019). Research on the Seismic Activity of the Beijing-Tianjin-Hebei Region. Prog. Geophys. 34, 0961–0968. (in Chinese). doi:10.6038/pg2019AA0624
Xu, Y.-G. (2001). Thermo-tectonic Destruction of the Archaean Lithospheric Keel beneath the Sino-Korean Craton in china: Evidence, Timing and Mechanism. Phys. Chem. Earth, Part A Solid Earth Geodesy 26, 747–757. doi:10.1016/s1464-1895(01)00124-7
Ye, H., Shedlock, K. M., Hellinger, S. J., and Sclater, J. G. (1985). The North China Basin: an Example of a Cenozoic Rifted Intraplate Basin. Tectonics 4, 153–169. doi:10.1029/tc004i002p00153
Ye, H., Zhang, B., and Mao, F. (1987). The Cenozoic Tectonic Evolution of the Great North China: Two Types of Rifting and Crustal Necking in the Great North China and Their Tectonic Implications. Tectonophysics 133, 217–227. doi:10.1016/0040-1951(87)90265-4
Yu, X.-w., Chen, Y.-t., and Wang, P.-d. (2003). Three-dimensional P Velocity Structure in Beijing Area. Acta seimol. Sin. 16, 1–15. doi:10.3321/j.issn:0253-3782.2003.01.00110.1007/s11589-003-0001-1
Yu, X. W., Chen, Y. T., and Zhang, H. (2010). Three Dimensional Crustal P—Wave Velocity Structure and Seismicity Analysis in Beijing Tianjin Tangshan Region. Chin. Geophys. 53, 1817. (in Chinese). doi:10.3969/j.issn.00015733.2010.08007
Zhang, G., Lei, J., Xie, F., Guo, Y., and Lan, C. (2011). Precise Relocation of Small Earthquakes Occurred in North china and its Tectonic Implication. Acta Seismol. Sin. 33, 699–714. (in Chinese). doi:10.3969/j.issn.0253-3782.2011.06.001
Zhang, H., and Thurber, C. (2003). Double-difference Tomography: the Method and its Application to the Hayward Fault, california. Bull. Seismol. Soc. Am. 93, 1875–1889. doi:10.1785/0120020190
Zhao, D., Kanamori, H., Negishi, H., and Wiens, D. (1996). Tomography of the Source Area of the 1995 Kobe Earthquake: Evidence for Fluids at the Hypocenter? Science 274, 1891–1894. doi:10.1126/science.274.5294.1891
Zhao, D., Hasegawa, A., and Horiuchi, S. (1992). Tomographic Imaging of P and S Wave Velocity Structure beneath Northeastern Japan. J. Geophys. Res. 97, 19909–19928.
Zhao, D., and Lei, J. (2004). Seismic Ray Path Variations in a 3D Global Velocity Model. Phys. Earth Planet. Interiors 141, 153–166. doi:10.1016/j.pepi.2003.11.010
Zhao, D., Mishra, O. P., and Sanda, R. (2002). Influence of Fluids and Magma on Earthquakes: Seismological Evidence. Phys. Earth Planet. Interiors 132, 249–267. doi:10.1016/s0031-9201(02)00082-1
Zhu, A. L., Xu, X. W., Hu, P., Zhou, Y. S., Lin, Y. W., Chen, G. H., et al. (2005). Relocation of Small Earthquakes in Beijing Area and its Implication to Seismotectonics. Geol. Rev. 51, 268–274. (in Chinese).
Zhu, A., Xiwei, Xu., Ping, H. U., Zhou, Y., Lin, Y., Chen, G., et al. (2005). Relocation of Small Earthquakes in Beijing Area and its Implication to Seismotectonics. Geol. Rev. 51, 268–274. doi:10.16509/j.georeview.2005.03.009
Keywords: 3D velocity structure, P-wave velocity, crustal velocity structure, double-difference seismic tomography method, North China Craton, earthquake relocation
Citation: Wu B and Ma T (2022) Seismic Tomography and Earthquake Relocation in North China Craton From 2008 to 2017. Front. Earth Sci. 10:912341. doi: 10.3389/feart.2022.912341
Received: 05 April 2022; Accepted: 20 June 2022;
Published: 22 July 2022.
Edited by:
Mourad Bezzeghoud, Escola de Ciência e Tecnologia, Universidade de Évora, PortugalReviewed by:
Alexey Lyubushin, Institute of Physics of the Earth (RAS), RussiaCopyright © 2022 Wu and Ma. This is an open-access article distributed under the terms of the Creative Commons Attribution License (CC BY). The use, distribution or reproduction in other forums is permitted, provided the original author(s) and the copyright owner(s) are credited and that the original publication in this journal is cited, in accordance with accepted academic practice. No use, distribution or reproduction is permitted which does not comply with these terms.
*Correspondence: Bateer Wu, d2J0ZUBjaWRwLmVkdS5jbg==
Disclaimer: All claims expressed in this article are solely those of the authors and do not necessarily represent those of their affiliated organizations, or those of the publisher, the editors and the reviewers. Any product that may be evaluated in this article or claim that may be made by its manufacturer is not guaranteed or endorsed by the publisher.
Research integrity at Frontiers

Learn more about the work of our research integrity team to safeguard the quality of each article we publish.