 Hongjing Shi
 Pengtai Li
94% of researchers rate our articles as excellent or good
Learn more about the work of our research integrity team to safeguard the quality of each article we publish.
Find out more
ORIGINAL RESEARCH article
Front. Earth Sci., 07 September 2022
Sec. Economic Geology
Volume 10 - 2022 | https://doi.org/10.3389/feart.2022.911646
This article is part of the Research TopicAdvances in Reservoir Modeling and SimulationView all 12 articles
Based on the panel data of Jinzhou, Panjin, Songyuan, Daqing, Yangzhou, Dongying and other 20 oil and gas resource-based cities from 2010 to 2018, combined with DEA-SBM model and Malmquist-Luenberger index, using DEA-SOLVERPro 5.0 and MaxDEA software. This paper evaluates the green growth efficiency of oil and gas resource-based cities from static and dynamic perspectives.The results show that the average static efficiency of green growth of the main oil and gas resource-based cities in China does not reach 1, there is efficiency loss, and it does not reach Pareto optimum.The static efficiency of green growth of the eastern oil and gas resource-based cities is higher than that of other regions, which is in line with the law of the Environmental Kuznets Curve. The environment has been improved. More than half of the oil and gas resource-based cities have a dynamic efficiency value of green growth greater than 1, and the development trend of green growth is better.
Since the founding of the People’s Republic of China in 1949, a number of oil and gas resource-based cities have been established relying on oil and gas resources, which has provided tremendous dynamic support for the economic development of the Republic. These oil and gas resource-based cities are inevitably trapped in development dilemma because of the imbalance of industrial structure and the reduction of resources, so it is very important to explore a new economic growth model for oil and gas resource-based cities. Therefore, economic green growth is an inevitable choice for oil and gas resource-based cities in the new era. What is the efficiency of green economic growth in oil and gas resource-based cities? Which indicators can be used to evaluate the green growth efficiency of oil and gas resource-based cities? Starting from these two problems, combing the literature on the efficiency evaluation of green growth at home and abroad, this paper constructs the evaluation index system of green growth of oil and gas resource-based cities, based on the panel data of 20 oil and gas resource-based cities such as Jinzhou, Panjin, Songyuan, Daqing, Yangzhou and Dongying from 2010 to 2018, using MaxDEA software. Based on DEA-SBM model and Malmquist-Luenberger index, this paper evaluates the green growth efficiency of oil and gas resource-based cities from static and dynamic perspectives.
At present, there are relatively few literatures on the green growth efficiency of oil and gas resource-based cities in academia, and most of them study the green growth efficiency of a specific region or province. In 1991, Hall constructed a green growth evaluation index system with two dimensions of green status and green policy, and used it to evaluate the environmental quality status of the United States (Hall and Kerr, 1991), which opened the prelude of quantitative analysis of regional green growth efficiency evaluation in academia. Beginning in 2010, China’s Green Development Index, co-authored by Beijing Normal University, Southwest University of Finance and Economics and the National Bureau of Statistics, is the first edition of China’s Green Development Index framework, which provides more than 60 indicators for the three dimensions of economic growth greening, resource and environment carrying potential and government policy support. It can be used to calculate the annual green index of provinces and municipalities in China.In 2013, Qian Zhengming and other scholars used the input-output theory to calculate the green growth efficiency of each province in China. The selected input indicators are labor, capital and energy, the expected output is GDP, and the unexpected output is the emission of three wastes. They divided China into three regions: the eastern region, the central region and the western region, and compared the green growth efficiency of the three regions (Qian and Liu, 2013). In 2014, Vlontzos et al. Based on the data from 2001 to 2008, used the non-radial DEA method to evaluate the energy and environmental efficiency of EU member States, and compared the impact of environmental protection on environmental efficiency (Vlontzos et al., 2014). In 2015, Wu Chunyou’s team at Dalian University of Technology measured the green growth efficiency of G20 countries (Wang and Wu, 2015). In 2017, Moutinho et al. Evaluated the eco-efficiency of 26 countries by using DEA model based on output-oriented variable scale and immutable scale model (Xu et al., 2018). In 2016, Guo Lingling and others constructed China’s green growth evaluation index system, which selected 19 indicators in five aspects of nature, resources, economy, policy and quality of life (Guo et al., 2016). In 2017, Wen Chaoxiang and other scholars based on the 1999-2012 provincial panel data, with the help of SBM model, evaluated the green development efficiency of each province in China, and found that the green development efficiency of each province in China is uneven, the gap is obvious, and the gap shows an upward trend over time (Yang and Wen, 2017). Many experts and scholars have made great contributions to measuring the green growth efficiency of individual provinces and cities. In 2016, Zhang Huan and others measured the green development level of cities in Hubei Province (Zhang et al., 2016). In 2017, Feng Zhijun and others measured the level of green growth in Guangdong Province (Xu et al., 2019). In 2009, Ouyang Zhiyun and others measured the green development level of 286 cities in China (Ouyang et al., 2009). In 2018, Wu Chuanqing measured the green development efficiency of major cities in the Yangtze River Economic Belt (Wu and Song, 2018).
Experts and scholars at home and abroad have done a lot of work on the efficiency evaluation of green growth, and DEA (Data Envelopment Analysis) is the most commonly used method to evaluate the efficiency of green growth for specific objectives, because there are differences in the research objects and their backgrounds, and there is no unified evaluation index system at present. The most accurate and scientific index system should be constructed according to the attributes of the research object and its background.In addition, when domestic and foreign scholars study the efficiency of green growth, they mostly choose various countries, provinces or an economic belt, lacking more in-depth subdivision research, such as the efficiency of green growth of oil and gas resource-based cities, so this paper aims at oil and gas resource-based cities, referring to the evaluation methods and indicators selected by previous scholars. It aims to establish a more scientific evaluation system to study the green growth efficiency of oil and gas resource-based cities.
In the long river of exploring the efficiency evaluation of green growth, scholars have used a variety of efficiency evaluation methods, of which the most common six methods are: data envelopment analysis, comprehensive index method, fuzzy comprehensive evaluation method, TOPSIS analysis, grey relational analysis and analytic hierarchy process. A comparison of the six methods is shown in Table 1.
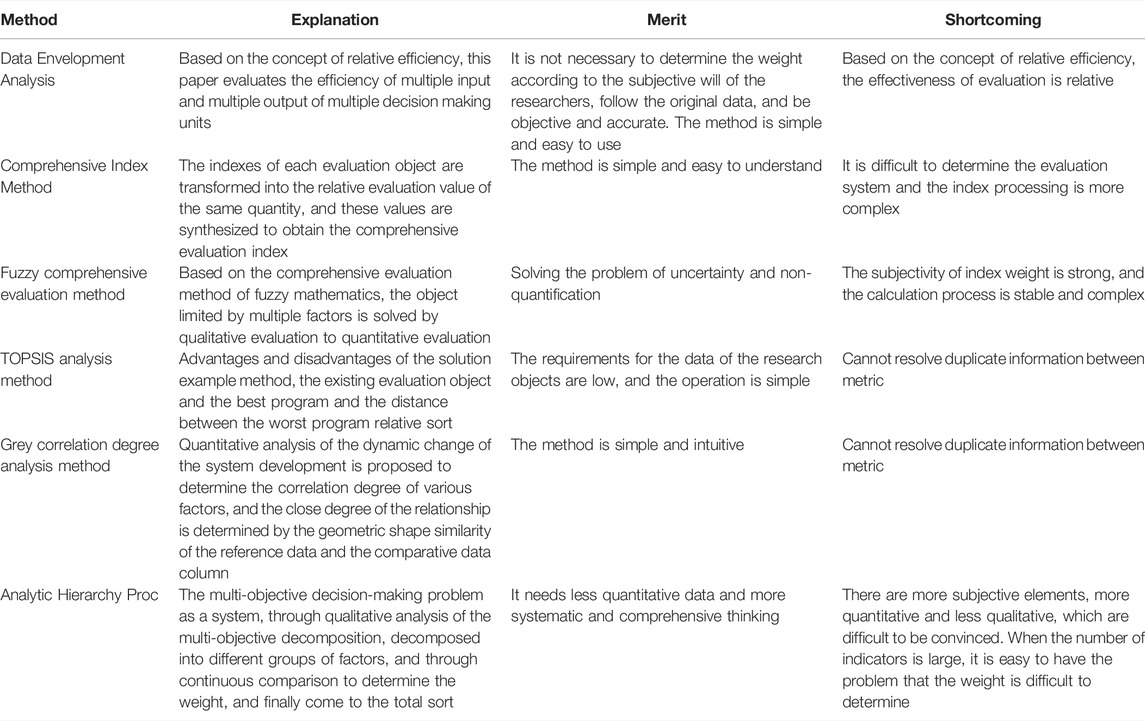
TABLE 1. Comparison of evaluation and analysis method.
This paper evaluates the green growth efficiency of 20 oil and gas resource-based cities, and the sample size is relatively large, which is aimed at the efficiency evaluation of 20 decision-making units, multi-input and multi-output. Therefore, this paper chooses DEA to evaluate the green growth efficiency of oil and gas resource-based cities.
In 2001, in order to solve the problem of angle assumption, Tone put forward DEA-SBM model, which is based on Pareto-Koopmans economic theory, and introduced slack variable into DEA model, which makes it unnecessary to assume that input and output change in the same direction and different outputs change in the same direction when measuring efficiency. Therefore, DEA-SBM model is a non-radial non-angle efficiency evaluation model, which can be used to evaluate the efficiency of decision making units containing undesirable output. The model is as follows.
In the formula (1), ρ denotes the target efficiency value of the decision-making unit, ρ∈[0,1], when ρ = 1, the decision-making unit is completely effective, as long as ρ≠1, the efficiency loss of the decision-making unit exists, the closer ρ is to 0, the more the efficiency loss of the decision making unit exists, and the larger the improvement space is.ztk represents the weight coefficient, the number of factor inputs is represented by N, M represents the number of expected outputs, and I represents the number of non-expected outputs.sxn is the slack variable of the input factor.sym is the slack variable of the expected output. spi represents the slack variable of the undesired output. The xi’kn and yt’kmrespectively represent two different types of outputs of the k’decision-making unit at t'. Thebt’ki represents the investment of the decision making unit k' at time t'.
When evaluating the static efficiency of a specific time node with undesirable output in a DMU, DEA-SBM model can effectively measure the utilization degree of input factors in the DMU. However, when evaluating the vertical change of DMU efficiency, that is, considering the time factor, we need to use the dynamic efficiency evaluation method to analyze the trend, causes and potential of efficiency growth.The Malmquist index proposed by Swedish economist Sten Malmquist in 1953 is recognized and used by most scholars. Compared with other dynamic efficiency analysis methods, the combination of Malmquist index and DEA model has significant advantages. In the process of dynamic efficiency evaluation, the traditional Malmquist index also has some drawbacks, it ignores the undesirable output. So in 1997, Chungetal and other scholars proposed Malmquist—Luenberger index (ML) model, which introduced the directional distance function into the Malmquist index to solve the problem of undesirable output. The directional distance function is as follows:
In the formula (2), g represents a direction vector, gt=(y,-bt), in the formula, y and b are respectively used to represent the expected output and the unexpected output, and the minus sign represents a direction, which means that the directions of the expected output and the unexpected output are opposite. βrepresents the state of complete efficiency, that is, there is the maximum expected output and the minimum unexpected output.
The functional expression of Talmudist-Gutenberg index is as follows:
There are three cases, namely ML > 1,ML = 1 and ML < 1,ML > 1, it shows that the static efficiency of green growth shows an upward trend. If ML = 1, it shows that the efficiency of green growth has no obvious trend. If ML < 1, the efficiency of green growth shows a downward trend. The ML index can be decomposed into EFFch and TEch, EFFch represents the technical efficiency change index, TEch represents the technical progress index, and the judgment criteria of the two values are consistent with those of the ml index. The decomposition function is as follows:
In order to evaluate the green growth efficiency of major oil and gas resource-based cities in China, 20 oil and gas resource-based cities in China were selected as the research objects, and the DEA-SBM model was used to evaluate the static efficiency of green growth of oil and gas-based cities. Combined with Malmquist-Luenberger index, this paper evaluates the dynamic efficiency of green growth of oil and gas resource-based cities.
Drawing on the green growth evaluation indicators of OECD (OECD, 2011), World Bank (World Bank, 2012), UNEP (UNEP, 2012), Chinese Academy of Sciences (Research Group of Sustainable Development Strategy of Chinese Academy of Sciences, 2011) and Beijing Normal University (Beijing Normal University Scientific Development Concept and Economic Sustainable Development Research Base and etc, 2012) and other authoritative institutions, this paper collates a large number of relevant literatures on green growth evaluation indicators. For example, Qu Ying used pollution emissions, energy consumption and labor input and other input indicators to measure the green growth efficiency of pollution-intensive industries in Liaoning Province (Qu et al., 2017). When Jiao Linlin and others measure the green growth efficiency of coastal cities, the input indicators are labor input, total energy consumption, pollutant emissions and CO2 emissions, and the output indicators are regional GDP (Xu et al., 2020). Under the guidance of these institutions’ green growth evaluation index and these literatures, considering the characteristics of oil and gas resource-based cities, this paper finally determines GDP, the number of employees, industrial electricity, industrial wastewater emissions, industrial sulfur dioxide emissions, total fixed assets investment and science and technology expenditure as the evaluation index system of this paper.Labor input, capital input, energy input and technology input are taken as input indicators, and the expected output is GDP. Considering the characteristics of large pollutant emissions in oil and gas resource-based cities, industrial pollutants are taken as non-expected output, and the evaluation index system is shown in Table 2.
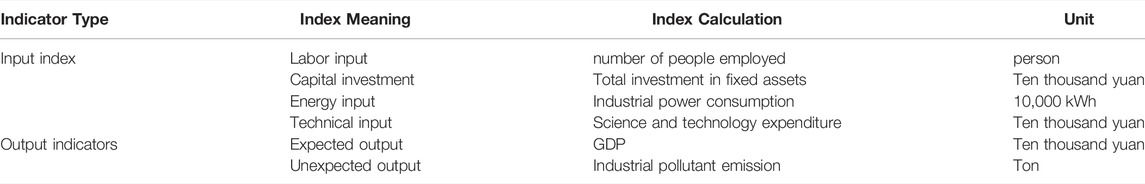
TABLE 2. Evaluation index system of green growth efficiency of oil and gas resource-based cities.
Oil and gas resource-based cities are not only an important energy base in China, but also an important pillar of China’s urban economy. Considering the distribution of oil and gas resource-based cities and the availability of data, this paper selects 20 typical oil and gas resource-based cities as the research object. They are: Cangzhou, Ordos, Jinzhou, Panjin, Songyuan, Daqing, Yangzhou, Dongying, Binzhou, Puyang, Nanyang, Jingzhou, Hengyang, Zhanjiang, Suining, Yan’an, Yulin, Jiuquan, Qingyang and Karamay.According to the geographical location and economic development of these cities, they can be divided into three regions. According to the experience of predecessors, this paper divides Jinzhou City and Panjin City of Liaoning Province into the eastern region, Daqing City of Heilongjiang Province and Songyuan City of Jilin Province into the central region, the specific division is: The oil and gas resource-based cities in the eastern region include Dongying, Yangzhou, Panjin, Cangzhou, Zhanjiang, Jinzhou and Binzhou, the oil and gas resource-based cities in the central region include Daqing, Songyuan, Puyang, Nanyang, Jingzhou, Hengyang and Ordos, and the oil and gas resource-oriented cities in the western region include Qingyang, Jiuquan, Yan’an, Yulin, Karamay and Suining.This paper studies the green growth efficiency of oil and gas resource-based cities based on the data from 2010 to 2018. The data mainly come from China Urban Statistical Yearbook, China Environmental Statistical Yearbook, China Energy Statistical Yearbook and China Science and Technology Statistics Yearbook.
In the course of the study, because of the existence of undesirable environmental pollutants, this paper chooses DEA-SBM model to evaluate the green growth efficiency of oil and gas resource-based cities, but wants to explore the dynamic changes of green growth efficiency of oil and gas resource-based CIT ies vertically and conduct more in-depth research. A combination of the DEA-SBM model and the Malmquist-Luenberger index is required.
According to the DEA-SBM model, the static efficiency of green growth of 20 oil and gas resource-based cities is evaluated by using DEA-SOLVERPro5.0 software, and the evaluation results are shown in Table 3.

TABLE 3. Static efficiency evaluation results of green growth of Oil and gas resource-based cities.
As shown in Table 3, the average static efficiency of 20 oil and gas resource-based cities is Yangzhou, Binzhou, Ordos, Zhanjiang, Dongying, Jingzhou, Daqing, Cangzhou, Yulin, Hengyang, Jinzhou, Songyuan, Karamay, Suining, Puyang, Jiuquan, Yan’an, Panjin, Nanyang and Qingyang from large to small. The average static efficiency of green growth of all oil and gas resource-based cities does not reach 1,It shows that there are efficiency losses in the green growth of various oil and gas resource-based cities in 2010–2018, but the efficiency value of some cities in some years, such as Zhanjiang in 2010–2013, Yangzhou, Ordos, Binzhou, Zhanjiang and Dongying in 2018, has reached 1, indicating that these cities have reached Pareto optimal state and achieved green economic growth in these years, But there are also cities like Qingyang with extremely low efficiency of green economic growth.In order to better compare the green growth efficiency of oil and gas resource-based cities in various regions, the static efficiency evaluation results of green growth of oil and gas resource-based cities in different regions are sorted out according to the data in Table 3, as shown in Table 4.
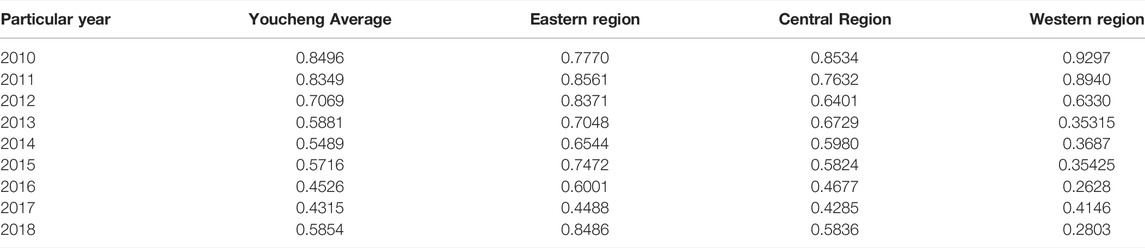
TABLE 4. Static efficiency evaluation results of green growth of oil and gas resource-based cities in different regions.
In order to more intuitively reflect the comparison of the static efficiency of green growth in different regions and their respective development trends, the static efficiency comparison chart of green growth in different regions is drawn according to Table 4, as shown in Figure 1.
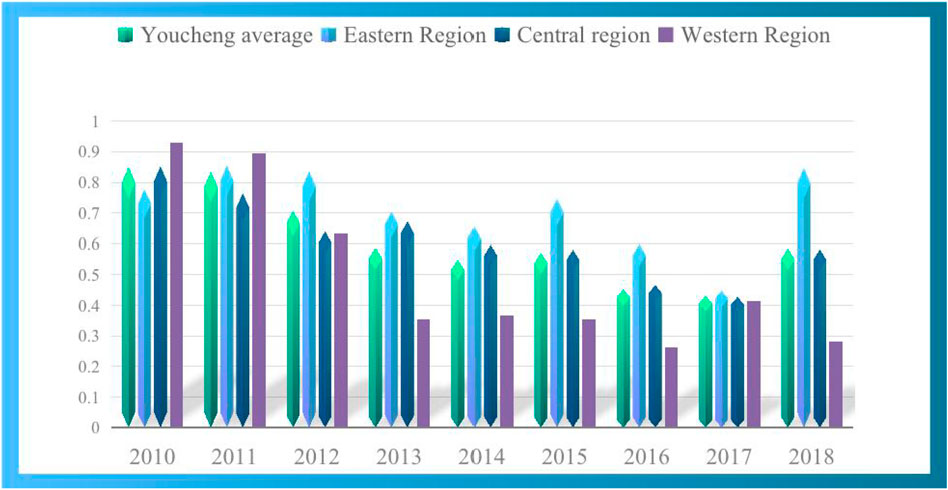
FIGURE 1. Comparison of static efficiency of green growth in different regions.
Since 2010, under the premise of the steady improvement of green growth efficiency in China, the static efficiency of green growth of oil and gas resource-based cities has generally shown a downward trend, which also shows that the green growth of oil and gas resource-based cities in China is not ideal. Among all the oil and gas resource-based cities, Yangzhou’s green growth static efficiency ranks first, the green growth efficiency value is greater than 0.5, and the average green growth efficiency is 0.8,783, which indicates that compared with other oil and gas resource-based cities, Yangzhou’s economic development model is relatively healthy and its resource allocation is relatively reasonable.However, from the perspective of efficiency, green growth still has efficiency loss. The average static efficiency of green growth in Jiuquan, Yan’an, Panjin, Nanyang, Qingyang and other cities is less than 0.5, the economic development model is extremely unhealthy, the input factors of production have not been ideal output, there are waste of resources, environmental pollution and other factors that damage green growth in the region.From the perspective of spatial dimension, the static efficiency of green growth of oil and gas resource-based cities in the eastern region is higher than that of other regions, which is in line with the law of environmental Kuznets curve. After economic development to a certain extent, the degree of environmental pollution has been gradually alleviated, and the environmental quality has been improved. The static efficiency value of green growth of oil and gas resource-based cities in central and western regions is the largest in 2010, and after 2010, the static efficiency of green growth has a significant downward trend. The overall water level of the western, central and eastern regions and oil and gas resource-based cities showed a straight downward trend, and the green growth efficiency did not reach 1. It shows that the green growth of all oil and gas resource-based cities has efficiency loss and does not reach the Pareto optimal state, which further illustrates that the green growth of 20 oil and gas resource-based cities in the past nine years is not optimistic, and there are problems such as slow economic development, waste of resources, environmental pollution and so on. How to improve the green growth efficiency of oil and gas resource-based cities has become a difficult problem that the government of oil and gas resource-based cities has to face and solve.
The static evaluation results show that the static efficiency of green growth of oil and gas resource-based cities is generally low. Combined with DEA-SBM model and Malmquist-Luenberger index, the dynamic efficiency of green growth of 20 oil and gas resource-based cities from 2010 to 2018 is evaluated and analyzed by using MaxDEA software. Because the dynamic efficiency of green growth is a dynamic evaluation of the efficiency of green growth, only eight periods can be evaluated in the nine-year period. The evaluation results are shown in Tables 5, 6.
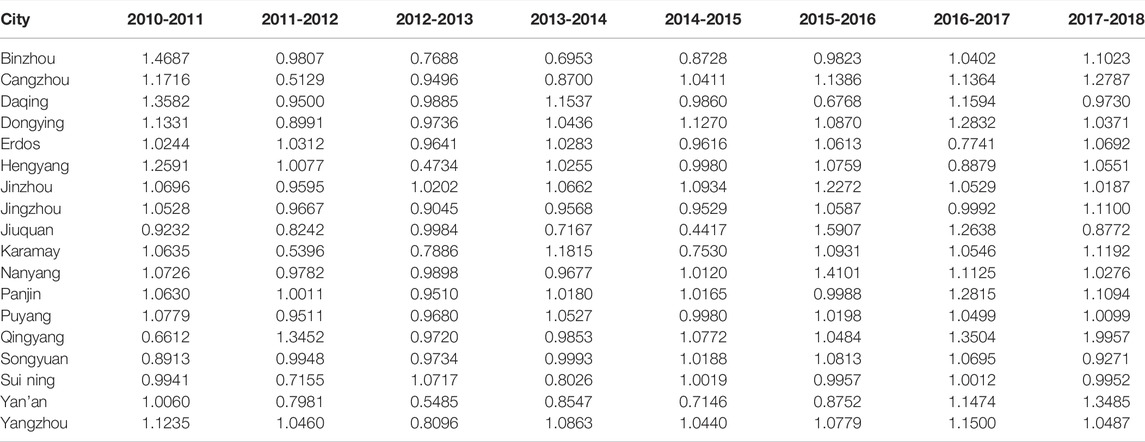
TABLE 5. Evaluation results of green dynamic growth efficiency.
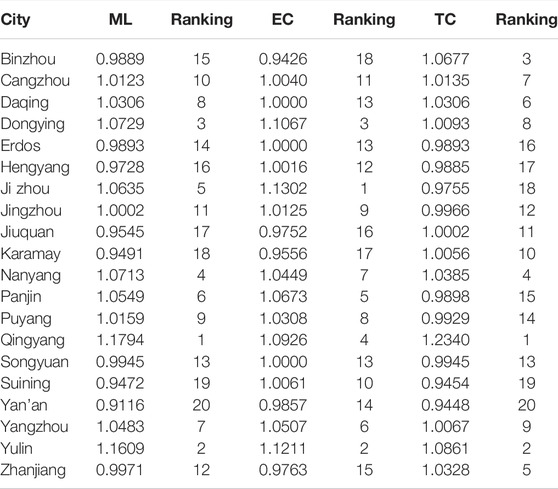
TABLE 6. Decomposition results of green total factor growth efficiency of Oil and gas resource-based cities.
The evaluation results show that more than half (11) of the oil and gas resource-based cities have a green dynamic growth rate ML value greater than 1, including Cangzhou, Daqing, Dongying, Jinzhou, Jingzhou, Nanyang, Panjin, Puyang, Qingyang, Yangzhou and Yulin, and their green growth is on the rise. The green growth momentum of Qingyang, Yulin and Dongying is remarkable. The ML values of Binzhou, Ordos, Hengyang, Jiuquan, Karamay, Songyuan, Suining, Yan’an and Zhanjiang are less than 1, and the green growth is in a downward trend.In order to better understand the green growth efficiency of oil and gas resource-based cities, this paper decomposes the total elements of green growth into green growth technology index (EC) and green growth technology progress index (TC), as shown in Table 6.
The evaluation result of green dynamic growth efficiency reflects the development trend of green growth of oil and gas resource-based cities. When the dynamic evaluation result ML > 1, the green growth efficiency of oil and gas resource-based cities shows an upward trend during the evaluation period. If ML < 1, it indicates that the green growth efficiency of oil and gas resource-based cities shows a downward trend during the evaluation period. If ML = 1, It means that the green growth efficiency of oil and gas resource-based cities has not changed significantly during the evaluation period.In order to conduct a more in-depth study on the green growth of oil and gas resource-based cities, the green total factor growth efficiency can be decomposed into TC and EC indexes. TC is the index of green technological progress, which represents how technological progress affects the efficiency of green growth of oil and gas resource-based cities. EC is a green technology efficiency index, which represents how the comprehensive factors such as the proficiency of technology users and market environment affect the green growth efficiency of oil and gas resource-based cities when technology remains stable. In the research literature at home and abroad, many scholars mentioned that TC and EC change in the same direction. The static efficiency of green growth indicates the allocation ability of resources within the region when the technology is stable, in contrast, the efficiency of green dynamic growth indicates whether the region has the ability to improve efficiency when the technology is improved, and it also becomes the basis of how the static efficiency of green growth changes. Comparing the static efficiency of green growth and the value of green total factor productivity, this paper analyzes the growth state and growth potential of green economy from static and dynamic perspectives. The results show that, compared with the ranking of static efficiency of green growth, there is no obvious positive and negative relationship between them. For example, Qingyang’s green total factor productivity ranks first, while the static efficiency of green growth is the last, which shows that although the current level of green growth in Qingyang is low, it has good development potential.
It can be seen from Table 6 that the analysis of the green technology progress index of oil and gas resource-based cities shows that the values of the green technology progress index of oil and gas resource-based cities from 2010 to 2018 are greater than 0.9 and approximate to 1, indicating that green technology progress can promote the efficiency of green growth. The analysis of the green technical efficiency index of oil and gas resource-based cities shows that the technical efficiency values of 11 oil and gas resource-based cities, such as Daqing, Binzhou, Cangzhou and Dongying, are all greater than 1, which shows that green technology can improve the efficiency of green growth.By comparing with the green total factor growth efficiency index ranking, this paper analyzes the impact of the two indexes on the green growth efficiency of oil and gas resource-based cities, among which Yan’an and Suining have the lowest ml value, which is less than 1, Qingyang TC index ranks first, and EC index is 1.0926.For cities with higher ml value, TC is the power source to maintain efficiency improvement, while for cities with higher EC ranking, the value of TC is not necessarily large. To sum up, at present, the greater factor to improve the efficiency of green growth of oil and gas resource-based cities is the progress of green technology, although the efficiency of green technology can also play a certain role, but relatively limited.
Based on the panel data of SBM model and Malmquist-Luenberger index, this paper evaluates the green growth efficiency of major oil and gas resource-based cities in China, and draws the following conclusions.
1) Using the non-radial non-angle DEA-SBM model, from the static point of view of China’s oil and gas resource-based cities 2010–2018 green growth efficiency evaluation. The evaluation results show that the average static efficiency of the 20 oil and gas resource-based cities ranks in the following order: Yangzhou, Binzhou, Ordos, Zhanjiang, Dongying, Jingzhou, Daqing, Cangzhou, Yulin, Hengyang, Jinzhou, Songyuan, Karamay, Suining, Puyang, Jiuquan, Yan’an, Panjin, Nanyang and Qingyang. They did not reach 1 and did not reach Pareto optimality. It shows that the present situation of green growth of oil and gas resource-based cities is not ideal, the input of production factors does not achieve the desired effect, while the economy is backward, the waste of resources is serious, the environmental situation is not optimistic, and the coordinated development of economy, resources and environment can not be realized.From the perspective of spatial dimension, the static efficiency of green growth of oil and gas resource-based cities in the eastern region is higher than that of other regions, which is in line with the law of environmental Kuznets curve. The economic development level of oil and gas resource-based cities in the eastern region is higher, and the degree of environmental pollution is gradually improved.
2) Based on DEA-SBM model and Malmquist-Luenberger index, this paper evaluates the green growth efficiency of oil and gas resource-based cities in China from 2010 to 2018 from the dynamic perspective. The evaluation results show that more than half of the oil and gas resource-based cities have green growth total factor productivity ml value greater than 1. Specifically, Cangzhou, Daqing, Dongying, Jinzhou, Jingzhou, Nanyang, Panjin, Puyang, Qingyang, Yangzhou and Yulin are in an upward trend of green growth, among which Qingyang, Yulin and Dongying are the most significant.The ml value of Binzhou, Ordos, Hengyang, Jiuquan, Karamay, Songyuan, Suining, Yan’an and Zhanjiang is less than 1, the green growth is in a downward trend, and the efficiency of green growth has great room for improvement. The green total factor growth efficiency of oil and gas resource-based cities is different. The green technological progress has a greater impact on the green growth efficiency of oil and gas resource-based cities, while the green technological efficiency has a smaller impact.
The original contributions presented in the study are included in the article/Supplementary material, further inquiries can be directed to the corresponding author.
All authors listed have made a substantial, direct, and intellectual contribution to the work and approved it for publication.
Daqing City Philosophy and social science planning project, Award Numbers: DSGB2022119 and DSGB2021004.
The authors declare that the research was conducted in the absence of any commercial or financial relationships that could be construed as a potential conflict of interest.
All claims expressed in this article are solely those of the authors and do not necessarily represent those of their affiliated organizations, or those of the publisher, the editors and the reviewers. Any product that may be evaluated in this article, or claim that may be made by its manufacturer, is not guaranteed or endorsed by the publisher.
We appreciate the financial support provided by National Social Science Foundation of China, Grant/Award Number: 19BJY068.
Beijing Normal University Scientific Development Concept and Economic Sustainable Development Research Base, etc (2012). China Green Index Annual Report-Regional Comparison[M]. Beijing: Beijing Normal University Press.
Guo, L., Lu, X., Wu, C., and Qu, Y. (2016). Research on the Construction of China's Green Growth Evaluation Index System[J]. Sci. Res. Manag. (6), 141–150. doi:10.19571/j.cnki.1000-2995.2016.06.017
Hall, B., and Kerr, M. (1991). 1991-1992 Green Index:A State-By-State Guide to the Nation’s Environmental Health. Washington, USA: Island Press, 11–25.
Ouyang, Z., Zhao, J., and Gui, Z. (2009). Evaluation of Green Development of Chinese Cities[J]. China Population·Resources Environ. 019 (005), 11–15. doi:10.3969/j.issn.1002-2104.2009.05.003
Qian, Z., and Liu, X. (2013). Analysis of Regional Differences and Influencing Factors of China's Green Economic Efficiency[J]. China Popul. Resour. Environ. 23 (7), 104–109. doi:10.3969/j.issn.1002-2104.2013.07.016
Qu, Y., Liu, W., and Zhou, W. (2017). Research on Green Growth Efficiency Measurement of Pollution-Intensive Industries in Liaoning Province[J]. Sci. Technol. Manag. 19 (01), 1–7. doi:10.16315/j.stm.2017.01.001
Research Group of Sustainable Development Strategy of Chinese Academy of Sciences (2011). China Sustainable Development Strategy Report: Achieving Green Economic Transition [M]. Beijing, China: Science Press.
Vlontzos, G., Niavis, S., and Manos, B. (2014). A DEA Approach for Estimating the Agricultural Energy and Environmental Efficiency of EU Countries. Renew. Sustain. Energy Rev. 40, 91–96. doi:10.1016/j.rser.2014.07.153
Wang, X., and Wu, C. (2015). International Comparison of Energy Eco-Efficiency from the Perspective of "Greening"——An Empirical Test Based on Panel Data of "Group of Twenty[J]. Technoeconomics 034 (007), 70–77. doi:10.3969/j.issn.1002-980X.2015.07.011
World Bank (2012). Inclusive Green Growth:The Pathway to Sustainable Development [R]. Washington, USA: World Bank.
Wu, C., and Song, X. (2018). Influencing factors and efficiency evaluation of urban green development in the Yangtze River Economic Belt[J]. Learn. Pract. (4), 5–13.
Xu, J., Chen, Z., and Li, R. (2020). Impacts of pore size distribution on gas injection in intraformational water zones in oil sands reservoirs. Oil Gas. Sci. Technol. - Rev. IFP Energies Nouv. 75, 75. doi:10.2516/ogst/2020047
Xu, J., Wu, K., Li, R., Li, Z., Li, J., Xu, Q., et al. (2018). Real gas transport in shale matrix with fractal structures. Fuel 219, 353–363. doi:10.1016/j.fuel.2018.01.114
Xu, J., Wu, K., Li, R., Li, Z., Li, J., Xu, Q., et al. (2019). Nanoscale pore size distribution effects on gas production from fractal shale rocks. Fractals 27 (08), 1950142. doi:10.1142/s0218348x19501421
Yang, Z., and Wen, C. (2017). Evaluation of China's green development efficiency and regional differences [J]. Econ. Geogr. 037 (003), 10–18. doi:10.15957/j.cnki.jjdl.2017.03.002
Keywords: oil and gas resource-based city, green growth, efficiency evaluation, SBM model, malmquist-luenberger index
Citation: Shi H, Li P, Wei J and Shi S (2022) Green Growth Efficiency Evaluation of Major Domestic Oil-Gas Resource-Based Cities——Based on Panel Data of SBM Model and Malmquist-Luenberger Index. Front. Earth Sci. 10:911646. doi: 10.3389/feart.2022.911646
Received: 02 April 2022; Accepted: 05 May 2022;
Published: 07 September 2022.
Edited by:
Jinze Xu, University of Calgary, CanadaReviewed by:
Liangbin Dou, Xi’an Shiyou University, ChinaCopyright © 2022 Shi, Li, Wei and Shi. This is an open-access article distributed under the terms of the Creative Commons Attribution License (CC BY). The use, distribution or reproduction in other forums is permitted, provided the original author(s) and the copyright owner(s) are credited and that the original publication in this journal is cited, in accordance with accepted academic practice. No use, distribution or reproduction is permitted which does not comply with these terms.
*Correspondence: Pengtai Li, ZHFsaXBlbmd0YWlAMTYzLmNvbQ==
Disclaimer: All claims expressed in this article are solely those of the authors and do not necessarily represent those of their affiliated organizations, or those of the publisher, the editors and the reviewers. Any product that may be evaluated in this article or claim that may be made by its manufacturer is not guaranteed or endorsed by the publisher.
Research integrity at Frontiers
Learn more about the work of our research integrity team to safeguard the quality of each article we publish.