 Haiyun Bi
 Lin Shi
 Dongli Zhang
 Hui Peng
 Jingjun Yang
 Zicheng You
 Xin Sun
- 1State Key Laboratory of Earthquake Dynamics, Institute of Geology, Beijing, China
- 2Guangdong Provincial Key Laboratory of Geodynamics and Geohazards, School of Earth Sciences and Engineering, Sun Yat-Sen University, Guangzhou, China
- 3Southern Marine Science and Engineering Guangdong Laboratory (Zhuhai), Zhuhai, China
Fault scarps preserve important information about past earthquakes on a fault, and thus can be applied to investigate the fault slip histories and rupture patterns. In this study, the morphology of fault scarps was used to constrain the paleoseismicity of the Wulashan Piedmont Fault located on the northern margin of the Ordos Block based on high-resolution LiDAR topography. We constructed the vertical displacement distribution of the fault through measuring the heights of a large number of scarp profiles extracted on different geomorphic surfaces along the fault. Through statistical analysis of the dense collection of vertical displacement dataset, a total of seven paleoseismic events were identified which followed a characteristic slip pattern with an average slip of ∼1.0 m. We further detected slope breaks in the fault scarp morphology to quantify the number of paleoearthquakes that occurred on the scarps, and discriminated at least five individual surface-breaking events. Both the number and slip of paleoearthquakes recognized from the morphology of fault scarps were in good agreement with previous paleoseismic trenching records. Based on the empirical scaling relationship between moment magnitude and rupture parameters, a moment magnitude of Mw 6.7–7.5 was determined for the paleoearthquakes occurred on the fault. With the fault slip rate derived by previous studies, we estimated an average recurrence interval of 1.3–1.8 kyr for the paleoseismic events, which is very close to the elapsed time since the most recent earthquake, indicating a high potential seismic hazard on the Wulashan Piedmont Fault.
1 Introduction
Investigating the slip histories and rupture patterns of past earthquakes helps to estimate the size and timing of future earthquakes on the fault, which is of great significance for seismic hazard assessment (Zielke et al., 2015). Historical documents or instrumental datasets provide only short and incomplete records of past earthquakes (McCalpin, 2009), and many devastating earthquakes have been demonstrated to occur on faults with no records of large historical events (Fu et al., 2004; Kaneda et al., 2008; Liu-Zeng et al., 2009). Paleoseismic trenching can provide detailed information about the time and magnitude of paleoearthquakes, but is greatly limited by geomorphic conditions and few selected excavation sites (Ewiak et al., 2015; Hodge et al., 2020). The occurrence of surface-rupturing earthquakes results in a variety of geomorphic features along the fault, such as fault scarps, and the offsets of rivers, ridges, and terrace risers (Wallace, 1968; Sieh, 1978; Avouac and Peltzer, 1993; Burbank and Anderson, 2009; Scharer et al., 2014; Xue et al., 2021). These geomorphic records can offer us important insights into the rupture histories of past events, including their rupture extent as well as surface slip distribution along the fault strike (McGill and Sieh, 1991; Zielke et al., 2010; Klinger et al., 2011; Zielke et al., 2012; Manighetti et al., 2015; Bi et al., 2018; Wei et al., 2019; Bi et al., 2020; Wei et al., 2021).
Among the geomorphic records of surface-rupturing earthquakes, the fault scarps have been demonstrated to preserve valuable information about past earthquakes (Wallace, 1977; Avouac and Peltzer, 1993; McCalpin, 2009). By measuring the heights of fault scarps, we can constrain the vertical displacement distribution of the faulting events (Middleton et al., 2016; Bi et al., 2018; Johnson et al., 2018; Wei et al., 2019; Bi et al., 2020; Pucci, et al., 2021; Wei et al., 2021). Moreover, the shape of a scarp can be applied to estimate the age of a single-event scarp based on the scarp degradation model (Wallace, 1977; Bucknam and Anderson, 1979; Nash, 1980; Andrews and Hanks, 1985; Arrowsmith et al., 1998; Kokkalas and Koukouvelas, 2005), and the gradient changes (i.e., slope breaks) in the morphology of a scarp may indicate the number of surface-rupturing events on a fault (Wallace, 1980; Avouac and Peltzer, 1993; Carretier et al., 2002; Ewiak et al., 2015; Wei et al., 2019; Rao et al., 2020; Wei et al., 2021). To analyze the morphological characteristics of the fault scarps, topographic profiles of the scarps are particularly useful. In earlier studies, the topographic profiles were mainly derived through field mapping, which is labor-intensive and time-consuming, thus greatly limiting the number and distribution of the topographic profiles (Avouac and Peltzer, 1993; Carretier et al., 2002; Ewiak et al., 2015). In recent years, high-resolution topographic datasets can be acquired by the Light Detection and Ranging (LiDAR) technology (Hudnut et al., 2002; Cunningham et al., 2006; Arrowsmith and Zielke, 2009; Zielke et al., 2010, 2012). Due to the ability to penetrate vegetation, the LiDAR technology can generate high-resolution “bare-earth” topography of the fault zone, which enables us to analyze and measure the morphological characteristics of the fault scarps in great detail (Johnson et al., 2018; Wei et al., 2019, 2021).
The Hetao Basin is located at the northern margin of the Ordos Block in North China (Ma and Wu, 1987; Zhang et al., 1998). The basin is controlled by a series of active normal faults bounding the northern margin of the basin along the piedmonts of the Lang Shan (Shan means mountain in Chinese), Serteng Shan, Wula Shan, and Daqing Shan from west to east, respectively (Chen, 2002; Ran et al., 2002, 2003; Yang et al., 2002, 2003; Chen et al., 2003; Rao et al., 2016, 2020; Dong et al., 2018; He et al., 2018). Among them, the Wulashan Piedmont Fault is a major active normal fault on the northern margin of the Hetao Basin. Four trenches have been excavated at different sites on the fault to investigate its rupturing histories (Chen, 2002; Ran et al., 2003). However, limited by the low accuracy of early dating methods and the sparse trenching sites, the paleoseismic results may have large uncertainties. Thus, it is necessary to further investigate the earthquake rupturing histories on this fault to assess the potential seismic hazard in the Hetao Basin area. Long-term activities of the normal faults have produced fault scarps with different heights on the northern region of the Hetao Basin. Since being adjacent to the Wulan Buh and Kubuqi deserts, this region has a semi-arid to arid climate with little precipitation and very sparse vegetation cover. Moreover, human modification and destruction of the landforms is also very limited in this area due to the sparse population (Rao et al., 2020). For the above reasons, fault scarps have been well preserved at the northern margin of the Hetao Basin, making it an ideal place to study the fault slipping histories through morphological analysis of the fault scarps.
In this study, high-resolution LiDAR topography were acquired along the Wulashan Piedmont Fault. On the basis of the LiDAR-derived topography, we tried to investigate the paleoseismicity of the fault from the morphology of fault scarps. A large set of scarp profiles were extracted to reconstruct the vertical displacement distribution along the fault, and well-preserved fault scarps were also selected to quantify the number of paleoearthquakes through identifying the slope breaks in the fault scarp morphology. The slip histories inferred from the morphology of fault scarps were then compared with the findings from previous paleoseismic investigations. Based on the derived rupture parameters and fault slip rate determined by previous studies, we estimated the moment magnitude and recurrence interval of large surface-rupturing events occurred on the Wulashan Piedmont Fault.
2 Geological Background
The Ordos Block is a tectonically-stable block suited in North China. Four Cenozoic basins have developed around this block, including the Hetao, Shanxi, Weihe, and Yinchuan Basins (Figure 1A) (Ma and Wu, 1987; Zhang et al., 1998). Several devastating historical earthquakes have occurred around the Ordos Block, e.g., the 1303 M 8 Hongdong earthquake in the Shanxi Basin (Xu et al., 1993, 2018), the 1556 M 8.5 Huaxian earthquake in the Weihe Basin (Zhang et al., 1995; Feng et al., 2020), and the 1739 M 8 Yinchuan-Pingluo earthquake in the Yinchuan Basin (Deng and Liao, 1996; Middleton et al., 2016), while no large-magnitude earthquakes have been recorded in the Hetao Basin. However, paleoseismic investigations demonstrated several Pleistocene to Holocene surface-rupturing events in the Hetao Basin. (Chen, 2002; Ran et al., 2002, 2003; Yang et al., 2002, 2003; Chen et al., 2003; Rao et al., 2016; Dong et al., 2018; He et al., 2018). To the north, the basin is bounded by a series of mountain belts, including the Lang Shan, Serteng Shan, Wula Shan, and Daqing Shan, and major active structures have developed along the piedmonts of these mountain ranges (Figure 1B).
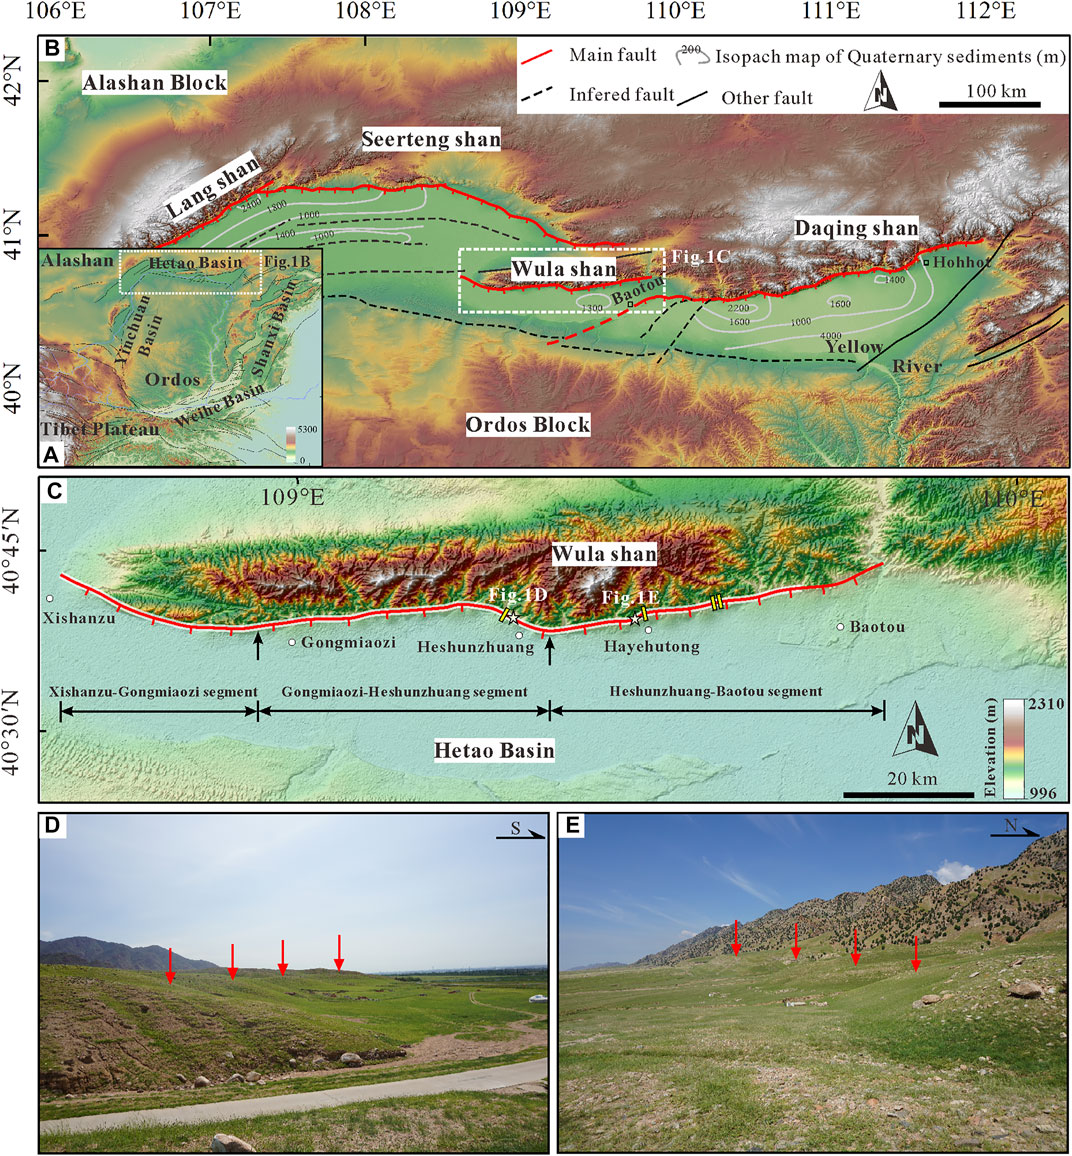
FIGURE 1. (A) Location of the Hetao Basin which is suited at the northern margin of the Ordos Block. (B) Distribution of major active structures in the Hetao Basin. The fault traces are modified from previous studies (Chen, 2002; Ran et al., 2003; Dong et al., 2018; He et al., 2018; Rao et al., 2020). (C) Geometry of the Wulashan Piedmont Fault. The black arrows mark the two bedrock bulges which have divided the fault into three individual segments. The yellow squares indicate previous paleoseismic trenching sites of Chen (2002) and Ran et al. (2003). The white swath denotes the coverage of the LiDAR topography. (D) and (E) show field photos of fault scarps developed along the Wulashan Piedmont Fault.
The Wulashan Piedmont Fault is a major normal fault at the northern margin of the Hetao Basin. The fault starts from Xishanzui in the west, and then goes through Gongmiaozi, Heshunzhuang, and Hayehutong, and finally ends near Baotou in the east. It dips southward and generally strikes E-W, with a total length of 110 km. Controlled by this fault, the Wula Shan is more than 1,000 m above the ground surface, and the thickness of the Cenozoic sediments is up to 5,100 m in the basin (Chen, 2002). According to the fault trace geometry, Chen (2002) divided the fault into three segments, i.e., the Xishanzui-Gongmiaozi segment, the Gongmiaozi-Heshunzhuang segment, and the Heshunzhuang-Baotou segment, which are separated by two broad and gentle bedrock bulges (Figure 1C). To investigate the paleoseismicity of the Wulashan Piedmont Fault, a total of four paleoseismic trenches have been excavated at different sites along the fault (Chen, 2002; Ran et al., 2003). Due to the long-term activity of the Wulashan Piedmont Fault, fault scarps with different heights have developed along the fault strike, which have been well preserved owing to the arid climate and limited human destruction in this region (Figures 1D,E).
3 Data and Methods
3.1 LiDAR Topography
To accurately analyze and measure the morphology of fault scarps, an airborne LiDAR survey was conducted along the Wulashan Piedmont Fault in August 2019. The topography were collected by a Riegl VUX-1LR airborne LiDAR system carried on a DM-150W fixed-wing unmanned aerial vehicle (UAV). The UAV flew at about 400 m above the ground surface. The scanning angle is ±70° and the scanning overlap is set to 50%. The pulse-shot frequency of the LiDAR system is 200 kHz. In order to improve the UAV positioning accuracy during the LiDAR survey, a total of five Trimble GPS base-stations were deployed every ∼20 km along the fault strike to work with the onboard GPS synergistically. The coverage of the LiDAR topography is about ∼1 km wide across the fault trace and ∼90 km long along the fault trace (Figure 1C). The average point density is about 4 points/m2, and in some local areas the point density can even reach 10 points/m2. To acquire a bare-earth DEM, the LiDAR points were grouped into different categories. Vegetation points were removed and only the ground points were left to generate the DEM. Due to the arid climate, the vegetation cover is very sparse in this area, so the ground points occupy nearly 90% of the total LiDAR points. By gridding the ground points, a 0.5-m-resolution bare-earth DEM was finally generated for the different segments of the Wulashan Piedmont Fault (Figure 2). To evaluate the precision of the LiDAR topography, a total of 30 check points were measured using a ground Trimble GPS system. A comparison between the LiDAR and ground GPS coordinates of the check points demonstrates that the vertical precision of the LiDAR topography is greater than 10 cm.
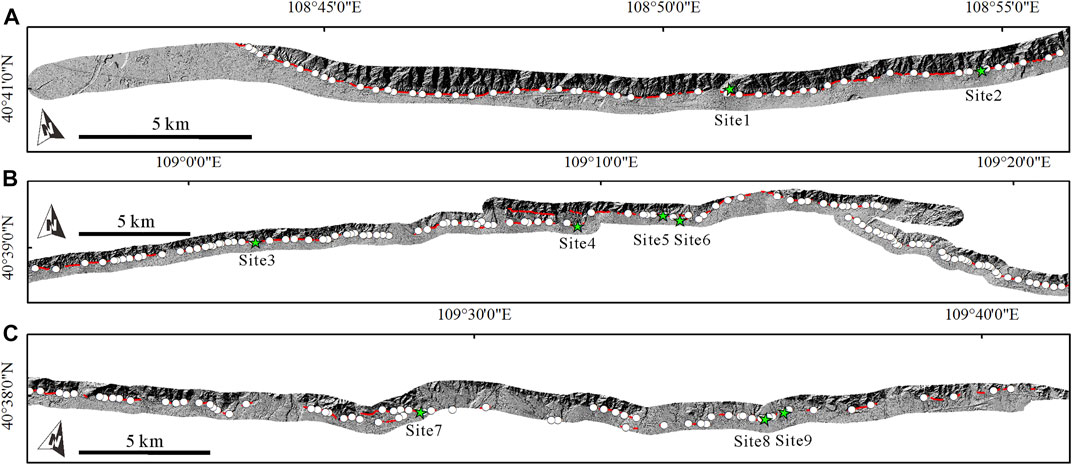
FIGURE 2. (A), (B), and (C) show the LiDAR topography of the Xishanzui-Gongmiaozi segment, the Gongmiaozi-Heshunzhuang segment, and the Heshunzhuang-Baotou segment of the Wulashan Piedmont Fault, respectively. The red lines denote the mapped fault traces. The white circles mark the locations of all vertical displacement measurements, and the green stars indicate the selected nine study sites where fault scarps have been well preserved.
3.2 Fault Scarp Morphology
Before faulting, the original surface generally displays a constant slope angle. Then a surface-rupturing earthquake occurred, leading to the offset of the surface and the formation of a single-event fault scarp. The morphology of the scarp is controlled by many factors, mainly including the faulting mechanics and the properties of the faulted materials (Wallace, 1977). Typically, a single-event fault scarp consists of a free face whose gradient is greater than that of the original surface. Once a fault scarp has been formed, it will suffer from constant degradation process in the following hundreds or even thousands of years which can be divided into two phases. During the initial gravitational phase, the free face will collapse under the effect of gravity and forms a debris wedge at the base of the scarp, resulting in a gravity-controlled face at the repose angle of the material, usually between 30° and 35° (Wallace, 1977; Bucknam and Anderson, 1979; Avouac and Peltzer, 1993). Following this relatively rapid phase, the scarp will experience a much slower diffusive erosion phase mainly due to the processes of water erosion or wash (Wallace, 1977). Such processes will gradually smooth out the angularities of the crest and base of the scarp and make the scarp become more and more rounded, resulting in a Gaussian smoothing of the slope profile (Wallace, 1977; Avouac and Peltzer, 1993). When a successive new event dislocates this pre-existing single-event scarp, the above-mentioned processes will repeat again, resulting in a multi-event composite scarp. However, the scarp morphology of the previous event may be preserved (case A) or not (case B) when this new event occurs, which mainly depends on whether the degradation processes following the new event reset the scarp morphology or not (Wei, et al., 2019). In case A, the successive events did not reset the scarp morphology and the morphological features inherited from the previous events were fully or partly preserved in the scarp, resulting in a slope profile with multiple Gaussian curves, each of which may indicate an individual faulting event. While in case B, the erosion processes after each surface-rupturing event erased most memories of the previous events in the fault scarp morphology. Thus, the resulting morphology of a multi-event scarp is similar to that of a single-event scarp, and the scarp profile will capture only the most recent event. The detailed morphological characteristics and evolutionary processes of single-event fault scarp and multi-event fault scarp can be seen in Figure 3.
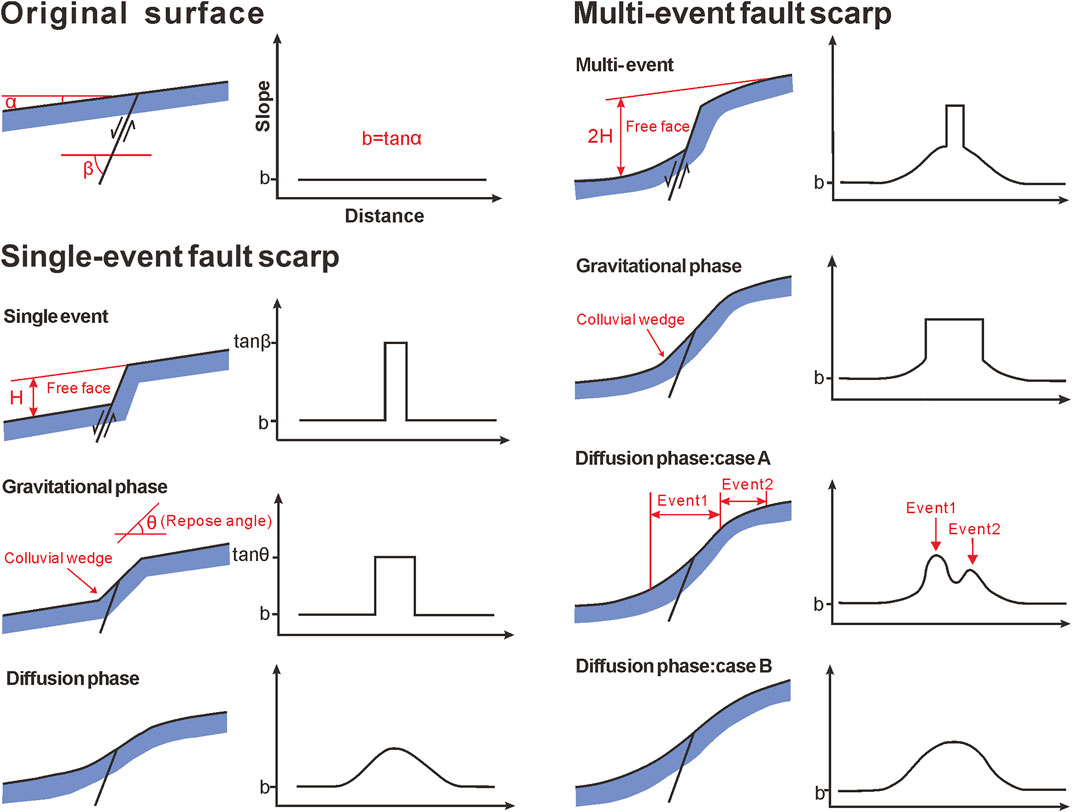
FIGURE 3. Morphological characteristics and evolutionary processes of single-event fault scarp and multi-event fault scarp (modified from Avouac and Peltzer, 1993; Rao et al., 2020).
3.3 Measuring Height of the Scarp
The high-resolution LiDAR topography provides detailed information of the landforms in the fault zone. On the basis of the LiDAR-DEM and its derivatives, e.g., slope and hillshade maps with various illumination angles, we mapped the fault traces and displaced landforms using the ESRI ArcGIS software. The LiDAR topography enables us to extract a large number of scarp-perpendicular topographic profiles along the fault strike, which has saved us from labor-intensive field mapping. Based on these extracted topographic profiles, we can measure the heights of the scarps to constrain the vertical displacement distribution along the Wulashan Piedmont Fault. To eliminate high-frequency variations caused by small-scale surface texture, swath topographic profiles were extracted perpendicular to the local fault scarp along the fault strike. When extracting the profiles, we should keep away from the sites that have suffered from serious degradation or erosion process, and vegetation and gullies should also be avoided. The length of the profiles ranges from tens of meters to hundreds of meters to ensure that the far-field slopes of the original upper and lower surfaces can be well captured. Furthermore, if the profile has a large difference in the slope of the up-fault and down-fault surfaces (generally larger than 5°), it should be discarded. Since in this case, the surface on either side of the scarp may have suffered from serious degradation or erosion process, and the extracted topographic profile can no longer well represent the original surface of the fault scarp. To determine the vertical displacement, the heights of the hanging wall and footwall surfaces on each side of the scarp were fitted by two separate lines with a least squares regression. The vertical separation between the two lines at the center point of the scarp was measured as the vertical displacement (Figure 4A) (Hanks et al., 1984; Avouac and Peltzer, 1993; Wei et al., 2019). The error of linear regression was considered as the uncertainty of the vertical displacement measurement (Middleton et al., 2016; Bi et al., 2018, 2020).
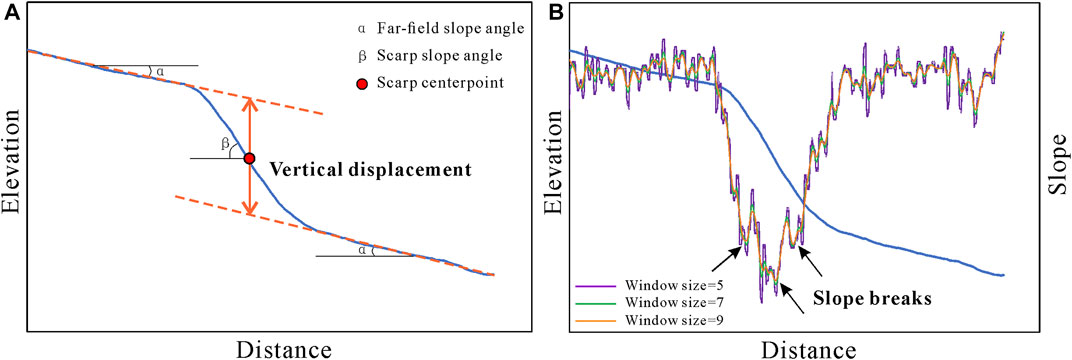
FIGURE 4. (A) Measurement of vertical displacement from the extracted topographic profile. (B) Identification of slope breaks in the gradient profile which is calculated with a sliding window of different size.
3.4 Identifying Slope Breaks of the Scarp
According to the morphological evolution models of fault scarps (Figure 3), multiple surface ruptures on composite scarps may be identified by changes in scarp gradient, marked by slope breaks in the scarp profile (Wallace, 1980; Avouac and Peltzer, 1993; Carretier et al., 2002; Ewiak et al., 2015; Wei et al., 2019; Hodge et al., 2020). Thus, based on the scarp profiles, we can detect slope breaks in the scarp morphology to constrain the number of paleoearthquakes along the Wulashan Piedmont Fault. On the basis of detailed mapping of the landforms, a total of nine study sites were selected along the fault where well-preserved single or composite fault scarps can be found (the locations of the nine sites are indicated in Figure 2). Swath topographic profiles (40 topographic profiles at an interval of 0.5 m) were extracted perpendicular to the local fault scarp for each site. Following many prior studies (Ewiak et al., 2015; Wei et al., 2019), a sliding window approach was employed to calculate the gradient (i.e., the first derivative) along the extracted topographic profile. In each sliding window, all the elevation data within the window are fitted by a polynomial regression model which is then differentiated to calculate the gradient. Choosing a suitable window size is the key to accurately identifying the gradient changes on a scarp. Slight gradient variations can be captured with smaller window size while larger window size can reduce the noises (Figure 4B) (Ewiak et al., 2015). After repeated trials, a window size of 9 was applied in our study. Generally, the slope breaks in the scarp profiles are marked by steep troughs in the calculated gradient profile (Figure 4B). For each extracted scarp profile in the swath, we first identified the locations of the crest and base of the scarp, and the segment between them was thus defined as the scrap range. Then, the troughs in the slope profile were searched in this scarp range and the positions (i.e., distance along the fault strike) of all searched troughs were recorded. Through statistical analysis of the recorded positions in all scarp profiles in the swath, we can acquire the probability density distribution of the positions of all searched slope breaks. The number of the peaks of this distribution may thus represent the number of slope breaks, that is, the number of surface-rupturing events recorded by the fault scarp.
4 Results
4.1 Morphological Characteristics of Fault Scarps
The high-resolution LiDAR topography enables us to investigate the morphological characteristics of the fault scarps in great detail. Generally, the fault scarps along the Wulashan Piedmont Fault display a complex morphology produced by more than one surface-rupturing events. Two examples of composite fault scarp profiles are presented in Figure 5. It can be observed that the scarps are characterized by the combination of several different debris slopes in their morphology which can be used as the indicators for multiple faulting events (Wallace, 1977; Ewiak et al., 2015; Wei et al., 2019). Free faces created by the most recent event have not been observed on the scarp profiles, and the maximum slope angles of the scarps are generally<30° which is smaller than the commonly observed angles of repose (34°–37°) on other faults (Wallace, 1977; Bucknam and Anderson, 1979), indicating that the fault scarps have evolved from the initial gravitational phase into the diffusive erosion phase. This low-angle (<30°) scarp slopes are also consistent with previous paleoseismic investigation results, that is the most recent surface-faulting event occurred about ∼1,655 years BP on the Wulashan Piedmont Fault (Chen, 2002; Ran et al., 2003).
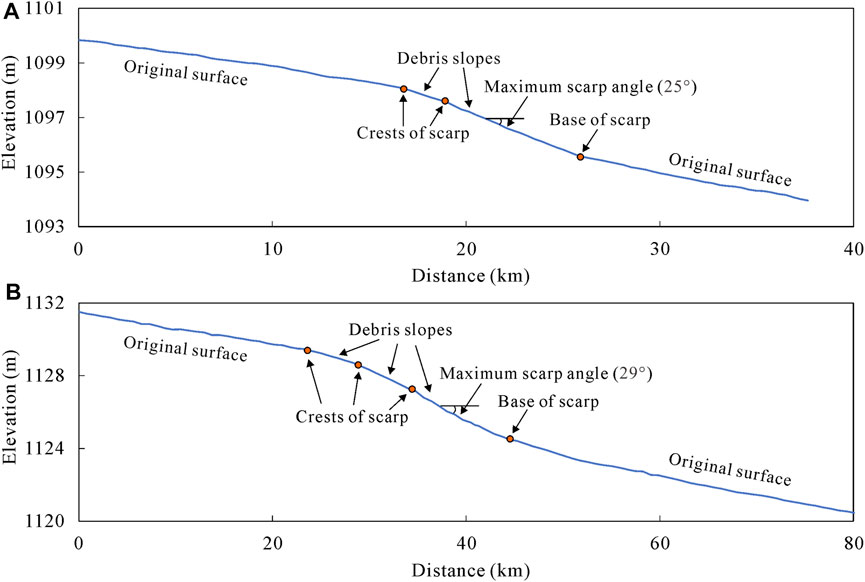
FIGURE 5. (A) and (B) show two examples of composite fault scarp profiles at the Wulashan Piedmont Fault which are characterized by the combination of several different debris slopes in their morphology.
4.2 Vertical Displacements of Fault Scarps
Through measuring the heights of fault scarps, we finally obtained a total of 243 vertical displacements along the Wulashan Piedmont Fault. All vertical displacements, distance along the fault, and measurement errors are presented in Supplementary Table S1 of the Supplementary Material. The vertical displacements are of different amount, ranging from ∼1 to ∼70 m along the fault strike. Such large variations in the scarp heights indicate that this dataset includes both single-event coseismic displacements and multi-event cumulative displacements. Figure 6 presents the distribution of all vertical displacements against their distance along the fault strike. We can see that the number of the displacements generally decreases with the increase of the displacement amount. This is mainly resulted from the steady erosion and degradation processes of the landforms, making the older geomorphic surfaces generally less well preserved along the fault. To study the activity of the Wulashan Piedmont Fault, Chen (2002) measured the heights of fault scarps and acquired a total of 38 vertical displacements in the field. To evaluate the reliability of the vertical displacements measured in our study, we compared our measurements with the field measurements obtained by Chen (2002) at 28 sites (Figure 7). It can be observed that the vertical displacements acquired in our study show good consistence with previous field measurements, presenting a nearly 1:1 fit with a slope of 0.99 and a correlation coefficient of 0.96.
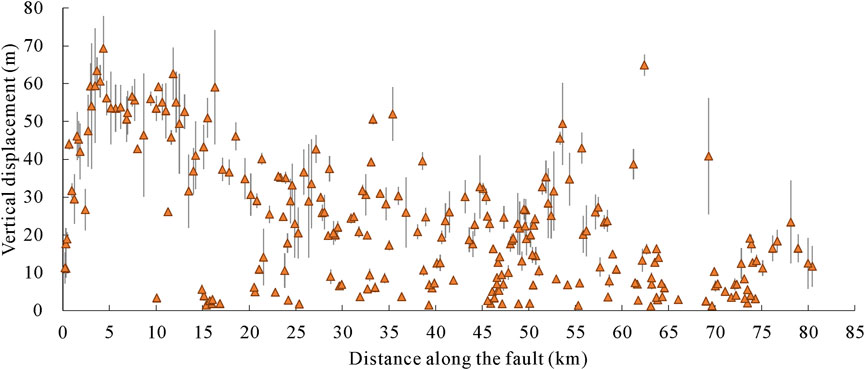
FIGURE 6. Distribution of all vertical displacement measurements against their distance along the fault strike.
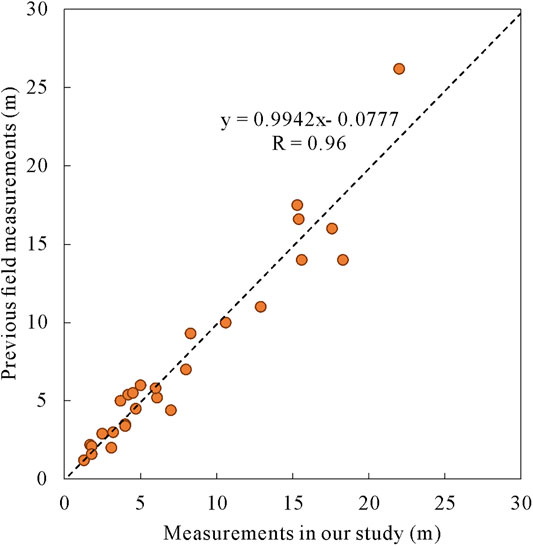
FIGURE 7. Scatter diagram displaying the comparison between vertical displacement measurements in our study with previous field measurements of Chen (2002).
4.3 COPD of Vertical Displacements
Similar to many previous studies, we used a statistical method to analyze the large number of displacement measurements with different uncertainties (McGill and Sieh, 1991; Zielke et al., 2010, 2012; Klinger et al., 2011; Manighetti et al., 2015; Haddon et al., 2016; Bi et al., 2018, 2020). Each displacement is represented by a Gaussian probability distribution function (PDF), with the measured displacement value and its corresponding uncertainty as the mean (μ) and standard deviation (σ) of the Gaussian PDF, respectively. Adding up the PDFs of all displacements forms the cumulative offset probability density (COPD) (McGill and Sieh, 1991) which is always employed to identify individual earthquakes. Since geomorphic surfaces formed in the same period have been displaced by the same number of events, they always appear as clusters of similar displacements, leading to several separated peaks in the COPD plot. The first smallest COPD peak is usually interpreted as the coseismic slip of the most recent event, while the successive larger peaks may represent the cumulative slip due to two or more preceding earthquakes (McGill and Sieh, 1991; Zielke et al., 2010, 2012; Klinger et al., 2011; Manighetti et al., 2015; Haddon et al., 2016; Bi et al., 2018, 2020).
Considering that the older geomorphic surfaces have experienced a longer period of erosion and degradation processes, the larger displacements will have larger uncertainties. Therefore, only the displacements in the range of 0–8 m were statistically analyzed in our study. Furthermore, since different segment may have different rupture behavior, the COPD was calculated separately on each individual segment. It should be noted that the Xishanzui-Gongmiaozi segment mainly consists of bedrock fault scarps, and very few small displacements have been preserved on this segment. Thus the COPD plots were derived only for the Gongmiaozi-Heshunzhuang segment (Figure 8) and the Heshunzhuang-Baotou segment (Figure 9). The COPD curve consists of several peak shapes. The peak values represent the most frequent cumulative displacements of the faulting events, while the width of the peak shape reflects both the measurement uncertainty and the variation of displacement along the fault strike. In our study, a Gaussian PDF was used to fit each peak shape, and the mean (μ) and the half-width (σ) of the Gaussian PDF was considered as the peak value and its corresponding uncertainty. A total of seven prominent peaks can be identified from the COPD curve on the Gongmiaozi-Heshunzhuang segment, which are centered at 1.3 ± 0.3 m, 2.0 ± 0.4 m, 2.7 ± 0.3 m, 3.7 ± 0.3 m, 5.0 ± 0.4 m, 6.1 ± 0.5 m, and 6.9 ± 0.5 m, respectively. The COPD curve also displays seven noticeable peaks on the Heshunzhuang-Baotou segment, at 1.2 ± 0.2 m, 2.0 ± 0.5 m, 2.9 ± 0.4 m, 3.8 ± 0.3 m, 5.0 ± 0.4 m, 6.0 ± 0.5 m, and 7.0 ± 0.5, respectively. Zielke et al. (2015) proposed a Monte-Carlo method to determine the mean slip of each event while considering all derived COPD peak values and their corresponding uncertainties. Following this approach, we derived seven successive events with repeated slip of 1.0 ± 0.5 m for both the two segments.
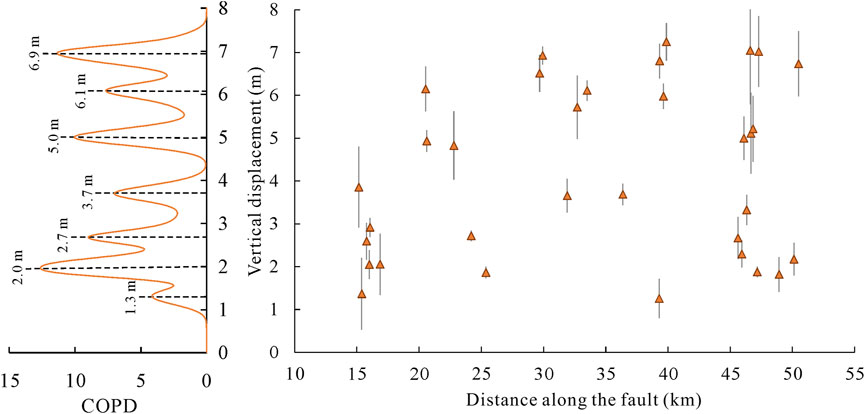
FIGURE 8. Statistical analysis of the vertical displacements on the Gongmiaozi-Heshunzhuang segment in the range of 0–8 m. Each displacement is represented by a Gaussian PDF. Adding up the PDFs of all displacements forms the COPD curve which generally shows several peak shapes, and each peak may indicate an individual earthquake.
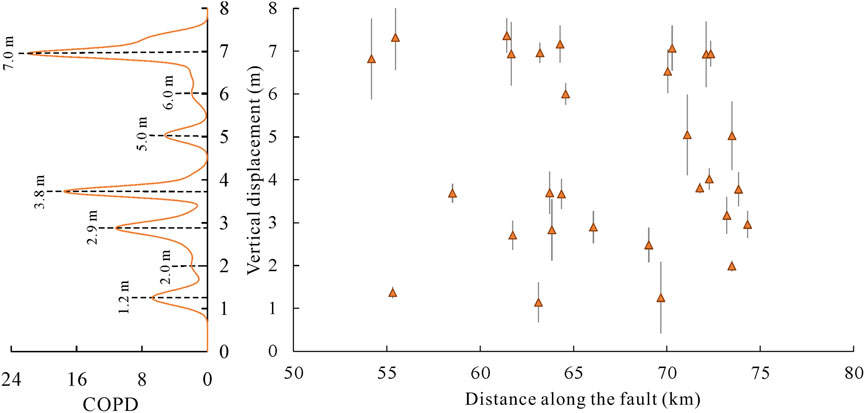
FIGURE 9. Statistical analysis of the vertical displacements on the Heshunzhuang-Baotou segment in the range of 0–8 m. Each displacement is represented by a Gaussian PDF. Adding up the PDFs of all displacements forms the COPD curve which generally shows several peak shapes, and each peak may indicate an individual earthquake.
4.4 Slope Breaks of Fault Scarps
A total of nine study sites were selected on different segments of the Wulashan Piedmont Fault where single-event fault scarps or multi-event composite scarps had been well preserved. The locations of the nines sites were indicated in Figure 2. Through morphological analysis of the scarp profiles at the nine sites, several slope breaks have been identified that indicate multiple surface-faulting events (Figures 10–12). The number of slope breaks ranges from one to five at each site, depending on the location of the fault scarp. Generally, the number of slope breaks identified from the scarp is positively correlated with the height of the scarp. This is in accordance with expectation, since the scarps with larger heights are generally located on older geomorphic surfaces which have experienced more surface-rupturing events. By comprehensively analyzing the slope breaks at the nine sites, we found that the average heights of the fault scarps with one to five breaks are 1.2, 2.0, 3.1, 5.5, and 6.5 m, respectively, which is generally in good agreement with the peak values of the COPD plot. Furthermore, among the nine study sites, two sites (sites 7 and 8) are suited very close to paleoseismic trenches excavated by previous studies (Chen, 2002; Ran et al., 2003). Thus, the number of events recognized from the fault scarp morphology can be compared with previous paleoseismic trenching records. The site 7 is located beside the Hayehutong trench which has revealed three paleoearthquakes. However, Chen (2002) reported that the paleoseismic events recorded by this trench were incomplete, since the total displacement of the three events exposed from the trench is much smaller than the height of the fault scarp where the trench has been excavated. A total of five slope breaks have been detected from the scarp profiles at site 7, indicating at least five surface-rupturing events, which can thus be a good complement to the paleoseismic trenching records. Moreover, the site 8 is suited on the left side of the Hademenjinkuang trench which exposed a total of four paleoseismic events. The scarp profiles at site 8 also show four obvious slope breaks, which is in good consistence with the four events recorded in the paleoseismic trench.
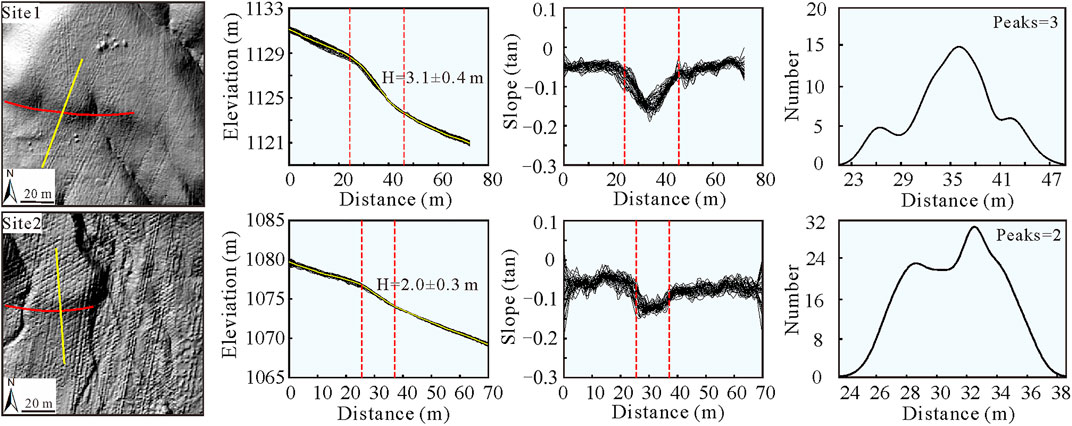
FIGURE 10. Identification of slope breaks in the scarp profiles at two sites on the Xishanzui-Gongmiaozi segment. The first column displays the LiDAR-DEM at each site, and the red and yellow lines represent the fault trace and extracted topographic profile, respectively. In the second column, the black lines indicate the extracted swath topographic profiles (40 topographic profiles at an interval of 0.5 m), and the yellow line denotes the averaged topographic profile, while the red dashed lines mark the scarp range. In the third column, the black lines indicate the calculated swath slope profiles. In the fourth column, the black line denotes the probability density distribution of the positions of all searched slope breaks in the swath slope profiles, and the number of peaks represent the number of slope breaks, that is the number of surface-rupturing events.
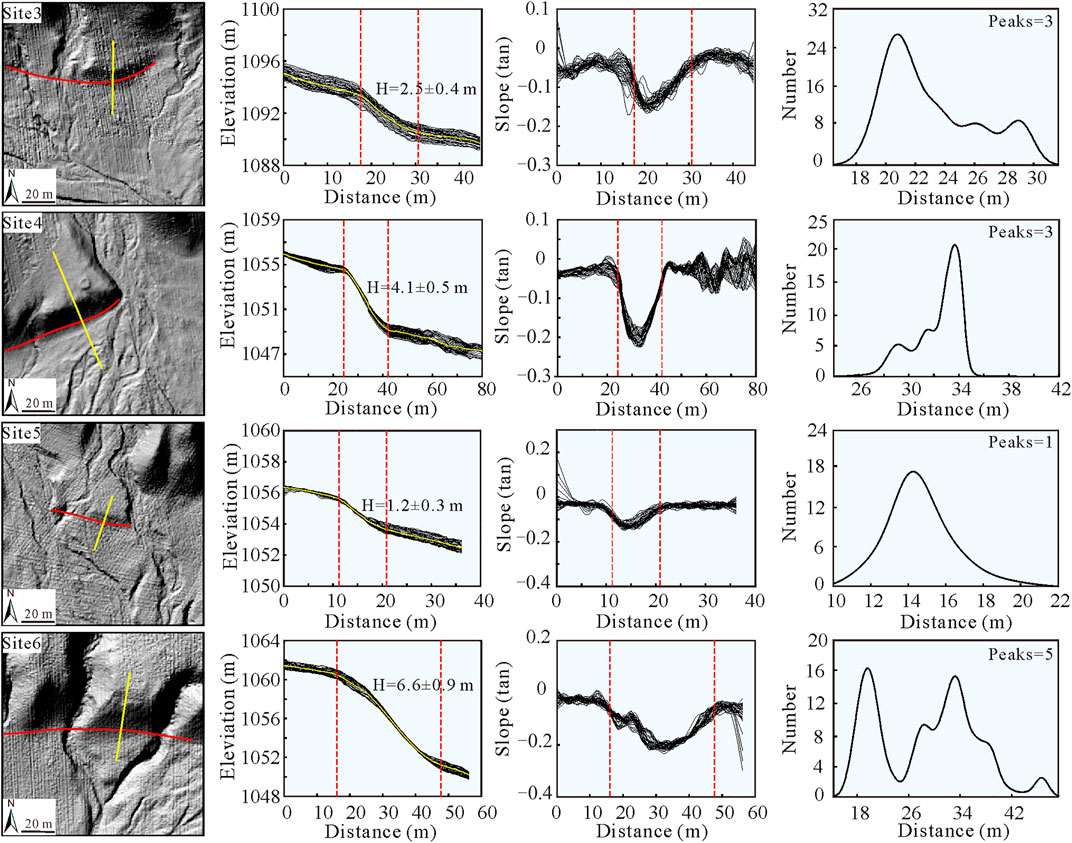
FIGURE 11. Identification of slope breaks in the scarp profiles at four sites on the Gongmiaozi-Heshunzhuang segment. The first column displays the LiDAR-DEM at each site, and the red and yellow lines represent the fault trace and extracted topographic profile, respectively. In the second column, the black lines indicate the extracted swath topographic profiles (40 topographic profiles at an interval of 0.5 m), and the yellow line denotes the averaged topographic profile, while the red dashed lines mark the scarp range. In the third column, the black lines indicate the calculated swath slope profiles. In the fourth column, the black line denotes the probability density distribution of the positions of all searched slope breaks in the swath slope profiles, and the number of peaks represent the number of slope breaks, that is the number of surface-rupturing events.
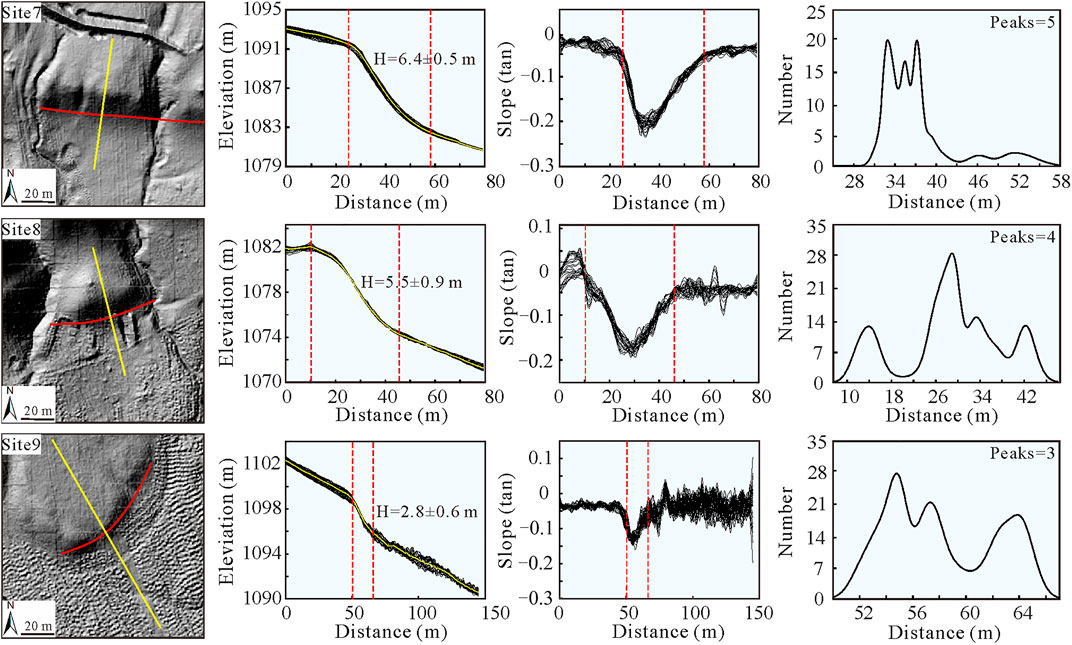
FIGURE 12. Identification of slope breaks in the scarp profiles at three sites on the Heshunzhuang-Baotou segment. The first column displays the LiDAR-DEM at each site, and the red and yellow lines represent the fault trace and extracted topographic profile, respectively. In the second column, the black lines indicate the extracted swath topographic profiles (40 topographic profiles at an interval of 0.5 m), and the yellow line denotes the averaged topographic profile, while the red dashed lines mark the scarp range. In the third column, the black lines indicate the calculated swath slope profiles. In the fourth column, the black line denotes the probability density distribution of the positions of all searched slope breaks in the swath slope profiles, and the number of peaks represent the number of slope breaks, that is the number of surface-rupturing events.
5 Discussion
5.1 Paleoseismicity of the Wulashan Piedmont Fault
By constraining the paleoseismicity of a fault, we are able to gain important insights into the rupture histories and recurrence patterns of past events occurred on the fault, which provides valuable information on the future behavior of the fault (Zielke et al., 2015). Recently, a few studies have investigated the fault rupture histories through identifying the COPD peaks of a dense collection of displacement dataset along the fault (Zielke et al., 2010, 2012; Klinger et al., 2011; Manighetti et al., 2015; Haddon et al., 2016; Bi et al., 2018, 2020). Similar to these prior works, we reconstructed the vertical displacement distribution of the Wulashan Piedmont Fault through measuring the heights of a large number of fault scarp profiles extracted on different geomorphic surfaces along the fault strike. By statistical analysis of the vertical displacements on the Gongmiaozi-Heshunzhuang segment and the Heshunzhuang-Baotou segment respectively, we found that the COPD plot presents seven pronounced peaks on both segments, which are separated by a similar slip increment of ∼1 m. This slip increment is also very close to the first smallest peak value which is always interpreted as the coseismic slip of the most recent earthquake. Therefore, we infer that at least seven paleoearthquakes have occurred on the Wulashan Piedmont Fault, following a characteristic slip pattern. Since the COPD peak values on both segments are very similar, the seven events may have broken the two segments together, producing a cascade rupture between the two segments. By applying the Monte Carlo method proposed by Zielke et al. (2015), we derived the average slip of the seven paleoseismic events to be 1.0 ± 0.5 m. This derived average slip is in good agreement with the coseismic slip of 1.2–2.4 m determined by previous paleoseismic investigation (Chen, 2002). Besides the heights of the fault scarp, the scarp shape also preserves valuable information about the history of a fault, and has been employed to identify individual earthquakes through detecting the gradient changes (slope breaks) in the scarp profiles on many faults (Wallace, 1980; Avouac and Peltzer, 1993; Carretier et al., 2002; Ewiak et al., 2015; Wei et al., 2019, 2021; Rao et al., 2020). Through morphological analysis of the scarp profiles extracted at nine sites along the Wulashan Piedmont Fault, we found that the scarp with a height of ∼1.2 m displays only one slope break, which may represent the coseismic slip produced by the most recent earthquake. While five slope breaks have been identified from the fault scarps with a height of ∼6.5 m, indicating at least five faulting events. We further comprehensively compared the slope breaks at the nine sites and found that the fault scarps with one to five breaks have an average height of 1.2, 2.0, 3.1, 5.5, and 6.5 m, respectively, generally in good consistence with the peak values of the COPD plot. These derived slope breaks suggest that at least five surface-rupturing events have occurred on the Wulashan Piedmont Fault. There are two events that have not been recorded by the fault scarp morphology, which however have been recognized from the COPD plot of the vertical displacements of fault scarps. Moreover, previous paleoseismic excavations also demonstrated that at least six paleoearthquakes had happened on the Wulashan Piedmont Fault since the Holocene, and these earthquakes have followed a quasi-periodic recurrence model with similar recurrence intervals (Ran et al., 2003), which is in good agreement with the paleoseismicity constrained from the morphology of fault scarps. Based on these above results, we demonstrate that both the vertical displacements of fault scarps and the slope breaks in the scarp morphology can be applied to quantify the number and slip of paleoseismic events. However, we should emphasize the importance of integrating the morphological analysis results of fault scarps with the findings from the paleoseismic trenches. They can provide good validation and supplement for each other to acquire more complete and reliable fault rupturing histories, especially on faults with complex fault geometries or slip histories (Ewiak et al., 2015).
5.2 Seismic Risk on the Wulashan Piedmont Fault
Knowledge of the magnitude and recurrence interval of past earthquakes can help us estimate the probability and severity of future potential events on the fault, thus greatly benefiting seismic hazard assessment (McCalpin, 2009). From the COPD peaks of the vertical displacements measured from the fault scarps along the fault strike, we determine that at least seven paleoearthquakes have ruptured the Wulashan Piedmont Fault, with an average slip of 1.0 ± 0.5 m. Supposing an average fault dip of ∼50° acquired from field observations (Chen, 2002) and considering the uncertainty of the average slip, the average slip of the paleoseismic events on the fault plane at the surface was estimated to be 0.7–2.0 m. Through analyzing the source parameters of a large number of historical earthquakes worldwide, Wells and Coppersmith (1994) established an empirical relationship between the moment magnitude Mw and the average displacement (AD) as following:
6 Conclusion
This study constrained the paleoseismicity of the Wulashan Piedmont Fault suited at the northern margin of the Ordos Block through morphological analysis of the fault scarps. Based on high-resolution LiDAR topography, a large number of vertical displacements were measured from the fault scarps to constrain the vertical displacement distribution along the fault. Well-preserved fault scarps were also selected to quantify the number of surface-rupturing events through detecting the number of slope breaks in the fault scarp morphology. Both the COPD peaks of the vertical displacements and the slope breaks in the scarp profiles demonstrate that at least seven paleoseismic events have ruptured the Wulashan Piedmont Fault. These events displayed a very similar slip of ∼1.0 m, and thus may have followed a characteristic slip pattern. Through comparison with previous paleoseismic investigations, it was found that the events identified from the morphological analysis of fault scarps are in good consistence with those revealed from paleoseismic trenches. By applying empirical scaling relationships between moment magnitude and rupture parameters, we estimated a possible moment magnitude of Mw 6.7–7.5 for the paleoearthquakes occurred on the fault. Based on the fault slip rate determined in previous studies and the coseismic slip derived from the fault scarp morphology, we estimated the average recurrence interval for large earthquakes to be 1.3–1.8 kyr on the fault. Considering that the elapsed time since the most recent event is very close to the estimated average recurrence interval, there may be a high potential seismic risk on the Wulashan Piedmont Fault.
This study has demonstrated the applicability of the fault scarp serving as a geomorphic marker to quantify both the number and slip of past earthquakes on a fault based on high-resolution topography, which can provide a good complement to the paleoseismic trenching records. However, it should be noted that since this method relies on the preservation of subtle morphological features inherited from previous events, it is more applicable in arid and semi-arid areas with low erosion rates. If a composite fault scarp has suffered sufficient erosion after a seismic event, it would gradually evolve into a single-event fault scarp shape. In this case, discriminating individual surface-breaking events from the scarp morphology would be difficult. Furthermore, though the fault scarp morphology can be applied to constrain the rupturing histories of a fault, the morphological records should be compared with the events recorded in paleoseismic trenches to avoid overrepresentation or underrepresentation of the paleoearthquakes. Combining both the morphological records of fault scarps and paleoseismic trenching results can lead to a more comprehensive understanding of the fault slip histories and rupture patterns, and thus a better assessment of potential seismic hazard on the fault.
Data Availability Statement
The original contributions presented in the study are included in the article/Supplementary Material, further inquiries can be directed to the corresponding author.
Author Contributions
HB is responsible for making the research plan and writing the manuscript. LS is responsible for processing data and doing experiments. HP, JY, ZY, and XS are responsible for field investigation. DZ is responsible for professional guidance.
Funding
This research was funded by the National Key Research and Development Program of China (2017YFC1500101), the National Natural Science Foundation of China (41972228, 42174062), the Guangdong Province Introduced Innovative R&D Team of Geological Processes and Natural Disasters around the South China Sea (2016ZT06N331).
Conflict of Interest
The reviewer (JR) declared a shared affiliation with the authors (HB, ZY) to the handling editor at the time of review.
The authors declare that the research was conducted in the absence of any commercial or financial relationships that could be construed as a potential conflict of interest.
Publisher’s Note
All claims expressed in this article are solely those of the authors and do not necessarily represent those of their affiliated organizations, or those of the publisher, the editors and the reviewers. Any product that may be evaluated in this article, or claim that may be made by its manufacturer, is not guaranteed or endorsed by the publisher.
Supplementary Material
The Supplementary Material for this article can be found online at: https://www.frontiersin.org/articles/10.3389/feart.2022.911173/full#supplementary-material
References
Andrews, D. J., and Hanks, T. C. (1985). Scarp Degraded by Linear Diffusion: Inverse Solution for Age. J. Geophys. Res. 90 (B12), 10193–10208. doi:10.1029/jb090ib12p10193
Arrowsmith, J. R., and Zielke, O. (2009). Tectonic Geomorphology of the San Andreas Fault Zone from High Resolution Topography: an Example from the Cholame Segment. Geomorphology 113 (1), 70–81. doi:10.1016/j.geomorph.2009.01.002
Arrowsmith, J. R., Rhodes, D. D., and Pollard, D. D. (1998). Morphologic Dating of Scarps Formed by Repeated Slip Events along the San Andreas Fault, Carrizo Plain, California. J. Geophys. Res. 103 (B5), 10141–10160. doi:10.1029/98jb00505
Avouac, J.-P., and Peltzer, G. (1993). Active Tectonics in Southern Xinjiang, China: Analysis of Terrace Riser and Normal Fault Scarp Degradation along the Hotan-Qira Fault System. J. Geophys. Res. 98 (B12), 21773–21807. doi:10.1029/93jb02172
Bi, H., Zheng, W., Ge, W., Zhang, P., Zeng, J., and Yu, J. (2018). Constraining the Distribution of Vertical Slip on the South Heli Shan Fault (Northeastern Tibet) from High-Resolution Topographic Data. J. Geophys. Res. Solid Earth 123 (3), 2484–2501. doi:10.1002/2017jb014901
Bi, H., Zheng, W., Lei, Q., Zeng, J., Zhang, P., and Chen, G. (2020). Surface Slip Distribution along the West Helanshan Fault, Northern China, and its Implications for Fault Behavior. J. Geophys. Res. Solid Earth 125 (7), e2020JB019983. doi:10.1029/2020jb019983
Bucknam, R. C., and Anderson, R. E. (1979). Estimation of Fault-Scarp Ages from a Scarp-Height-Slope-Angle Relationship. Geol 7 (1), 11–14. doi:10.1130/0091-7613(1979)7<11:eofafa>2.0.co;2
Carretier, S., Ritz, J.-F., Jackson, J., and Bayasgalan, A. (2002). Morphological Dating of Cumulative Reverse Fault Scarps: Examples from the Gurvan Bogd Fault System, Mongolia. Geophys. J. Int. 148 (2), 256–277. doi:10.1046/j.1365-246x.2002.01007.x
Chen, L., Ran, Y., and Chang, Z. (2003). Characteristics of Late Quaternary Faulting and Paleoseismic Events on the East of Delingshan Segment of the Sertengshan Piedmont Fault (In Chinese). Seismol. Geol. 25 (4), 555–565.
Chen, L. (2002). Paleoearthquakes, the Law of Strong Earthquake Recurrence and Potential Sites for the Occurrence of Future Strong Earthquakes in the Hetao Fault-Depression Zone. Beijing: Institute of Geology,China Earthquake Administration, 49–67. In Chinese.
Cunningham, D., Grebby, S., Tansey, K., Gosar, A., and Kastelic, V. (2006). Application of Airborne LiDAR to Mapping Seismogenic Faults in Forested Mountainous Terrain, Southeastern Alps, Slovenia. Geophys. Res. Lett. 33 (20). doi:10.1029/2006gl027014
Deng, Q., and Liao, Y. (1996). Paleoseismology along the Range-Front Fault of Helan Mountains, North Central China. J. Geophys. Res. 101 (B3), 5873–5893. doi:10.1029/95jb01814
Dong, S., Zhang, P., Zheng, W., Yu, Z., Lei, Q., Yang, H., et al. (2018). Paleoseismic Observations along the Langshan Range-Front Fault, Hetao Basin, China: Tectonic and Seismic Implications. Tectonophysics 730, 63–80. doi:10.1016/j.tecto.2018.02.012
Ewiak, O., Victor, P., and Oncken, O. (2015). Investigating multiple fault rupture at the Salar del Carmen segment of the Atacama Fault System (northern Chile): Fault scarp morphology and knickpoint analysis. Tectonics 34 (2), 187–212. doi:10.1002/2014tc003599
Feng, X., Ma, J., Zhou, Y., England, P., Parsons, B., Rizza, M. A., et al. (2020). Geomorphology and Paleoseismology of the Weinan Fault, Shaanxi, Central China, and the Source of the 1556 Huaxian Earthquake. J. Geophys. Res. Solid Earth 125 (12), e2019JB017848. doi:10.1029/2019jb017848
Fu, B., Ninomiya, Y., Lei, X., Toda, S., and Awata, Y. (2004). Mapping Active Fault Associated with the 2003 Mw 6.6 Bam (SE Iran) Earthquake with ASTER 3D Images. Remote Sens. Environ. 92 (2), 153–157. doi:10.1016/j.rse.2004.05.019
Haddon, E. K., Amos, C. B., Zielke, O., Jayko, A. S., and Bürgmann, R. (2016). Surface Slip during Large Owens Valley Earthquakes. Geochem. Geophys. Geosyst. 17 (6), 2239–2269. doi:10.1002/2015gc006033
Hanks, T. C., Bucknam, R. C., Lajoie, K. R., and Wallace, R. E. (1984). Modification of Wave-Cut and Faulting-Controlled Landforms. J. Geophys. Res. 89 (B7), 5771–5790. doi:10.1029/jb089ib07p05771
He, Z., Ma, B., Long, J., Wang, J., and Zhang, H. (2018). New Progress in Paleoearthquake Studies of the East Sertengshan Piedmont Fault, Inner Mongolia, China. J. Earth Sci. 29 (2), 441–451. doi:10.1007/s12583-017-0937-z
Hodge, M., Biggs, J., Fagereng, Å., Mdala, H., Wedmore, L. N. J., and Williams, J. N. (2020). Evidence from High-Resolution Topography for Multiple Earthquakes on High Slip-To-Length Fault Scarps: The Bilila-Mtakataka Fault, Malawi. Tectonics 39 (2), e2019TC005933. doi:10.1029/2019tc005933
Hudnut, K. W., Borsa, A., Glennie, C., and Minster, J. B. (2002). High-resolution Topography along Surface Rupture of the 16 October 1999 Hector Mine, California, Earthquake (Mw 7.1) from Airborne Laser Swath Mapping. Bull. Seismol. Soc. Am. 92 (4), 1570–1576. doi:10.1785/0120000934
Johnson, K. L., Nissen, E., and Lajoie, L. (2018). Surface Rupture Morphology and Vertical Slip Distribution of the 1959 M W 7.2 Hebgen Lake (Montana) Earthquake from Airborne Lidar Topography. J. Geophys. Res. Solid Earth 123 (9), 8229–8248. doi:10.1029/2017jb015039
Kaneda, H., Nakata, T., Tsutsumi, H., Kondo, H., Sugito, N., Awata, Y., et al. (2008). Surface Rupture of the 2005 Kashmir, Pakistan, Earthquake and its Active Tectonic Implications. Bull. Seismol. Soc. Am. 98 (2), 521–557. doi:10.1785/0120070073
Klinger, Y., Etchebes, M., Tapponnier, P., and Narteau, C. (2011). Characteristic Slip for Five Great Earthquakes along the Fuyun Fault in China. Nat. Geosci. 4 (6), 389–392. doi:10.1038/ngeo1158
Kokkalas, S., and Koukouvelas, I. K. (2005). Fault-scarp Degradation Modeling in Central Greece: the Kaparelli and Eliki Faults (Gulf of Corinth) as a Case Study. J. Geodyn. 40 (2-3), 200–215. doi:10.1016/j.jog.2005.07.006
Liu-Zeng, J., Zhang, Z., Wen, L., Tapponnier, P., Sun, J., Xing, X., et al. (2009). Co-seismic Ruptures of the 12 May 2008, Ms 8.0 Wenchuan Earthquake, Sichuan: East-West Crustal Shortening on Oblique, Parallel Thrusts along the Eastern Edge of Tibet. Earth Planet. Sci. Lett. 286 (3-4), 355–370. doi:10.1016/j.epsl.2009.07.017
Ma, X., and Wu, D. (1987). Cenozoic Extensional Tectonics in China. Tectonophysics 133 (3-4), 243–255. doi:10.1016/0040-1951(87)90268-x
Manighetti, I., Perrin, C., Dominguez, S., Garambois, S., Gaudemer, Y., Malavieille, J., et al. (2015). Recovering Paleoearthquake Slip Record in a Highly Dynamic Alluvial and Tectonic Region (Hope Fault, New Zealand) from Airborne Lidar. J. Geophys. Res. Solid Earth 120 (6), 4484–4509. doi:10.1002/2014jb011787
McGill, S. F., and Sieh, K. (1991). Surficial Offsets on the Central and Eastern Garlock Fault Associated with Prehistoric Earthquakes. J. Geophys. Res. 96 (B13), 21597–21621. doi:10.1029/91jb02030
Middleton, T. A., Walker, R. T., Parsons, B., Lei, Q., Zhou, Y., and Ren, Z. (2016). A Major, Intraplate, Normal-Faulting Earthquake: The 1739 Yinchuan Event in Northern China. J. Geophys. Res. Solid Earth 121 (1), 293–320. doi:10.1002/2015jb012355
Nash, D. B. (1980). Morphologic Dating of Degraded Normal Fault Scarps. J. Geol. 88 (3), 353–360. doi:10.1086/628513
Pucci, S., Pizzimenti, L., Civico, R., Villani, F., Brunori, C. A., and Pantosti, D. (2021). High resolution morphometric analysis of the Cordone del Vettore normal fault scarp (2016 central Italy seismic sequence): Insights into age, earthquake recurrence and throw rates. Geomorphology 388, 107784. doi:10.1016/j.geomorph.2021.107784
Ran, Y., Zhang, P., Hu, B., and Guo, W. (2002). Paleoseismic Activity on the Hohhot Segment of Daqingshan Piedmont Fault in the Late Quaternary History (In Chinese). Earthq. Res. China 18 (1), 15–27.
Ran, Y., Chen, L., Yang, X., and Han, Z. (2003). Recurrence Characteristics of Late-Quaternary Strong Earthquakes on the Major Active Faults along the Northern Border of Ordos Block (In Chinese). Sci. China Ser. D Earth Sci. 46 (2), 189–200.
Rao, G., Chen, P., Hu, J., Yu, Y., and Qiu, J. (2016). Timing of Holocene Paleo-Earthquakes along the Langshan Piedmont Fault in the Western Hetao Graben, North China: Implications for Seismic Risk. Tectonophysics 677-678, 115–124. doi:10.1016/j.tecto.2016.03.035
Rao, G., He, C., Chen, H., Yang, X., Shi, X., Chen, P., et al. (2020). Use of Small Unmanned Aerial Vehicle (sUAV)-Acquired Topography for Identifying and Characterizing Active Normal Faults along the Seerteng Shan, North China. Geomorphology 359, 107168. doi:10.1016/j.geomorph.2020.107168
Scharer, K. M., Salisbury, J. B., Arrowsmith, J. R., and Rockwell, T. K. (2014). Southern San Andreas Fault Evaluation Field Activity: Approaches to Measuring Small Geomorphic Offsets-Challenges and Recommendations for Active Fault Studies. Seismol. Res. Lett. 85 (1), 68–76. doi:10.1785/0220130108
Sieh, K. E. (1978). Slip along the San Andreas Fault Associated with the Great 1857 Earthquake. Bull. Seismol. Soc. Am. 68 (5), 1421–1448.
Wallace, R. E. (1968). “Notes on Stream Channels Offset by the San Andreas Fault, Southern Coast Ranges, California,” in Proceedings of the Conference on Geologic Problems of the San Andreas Fault System (Stanford University Publication), 6–21. Geological Sciences.11
Wallace, R. E. (1977). Profiles and Ages of Young Fault Scarps, North-Central Nevada. Geol. Soc. Am. Bull. 88 (9), 1267–1281. doi:10.1130/0016-7606(1977)88<1267:paaoyf>2.0.co;2
Wallace, R. E. (1980). Degradation of the Hebgen Lake Fault Scarps of 1959. Geology 8 (5), 225–229. doi:10.1130/0091-7613(1980)8<225:dothlf>2.0.co;2
Wei, Z., He, H., Su, P., Zhuang, Q., and Sun, W. (2019). Investigating Paleoseismicity Using Fault Scarp Morphology of the Dushanzi Reverse Fault in the Northern Tian Shan, China. Geomorphology 327, 542–553. doi:10.1016/j.geomorph.2018.11.025
Wei, Z., He, H., Lei, Q., Sun, W., and Liang, Z. (2021). Constraining Coseismic Earthquake Slip Using Structure from Motion from Fault Scarp Mapping (East Helanshan Fault, China). Geomorphology 375, 107552. doi:10.1016/j.geomorph.2020.107552
Wells, D. L., and Coppersmith, K. J. (1994). New Empirical Relationships Among Magnitude, Rupture Length, Rupture Width, Rupture Area, and Surface Displacement. Bull. Seismol. Soc. Am. 84 (4), 974–1002.
Wesnousky, S. G. (2008). Displacement and Geometrical Characteristics of Earthquake Surface Ruptures: Issues and Implications for Seismic-Hazard Analysis and the Process of Earthquake Rupture. Bull. Seismol. Soc. Am. 98 (4), 1609–1632. doi:10.1785/0120070111
Xu, X., Ma, X., and Deng, Q. (1993). Neotectonic Activity along the Shanxi Rift System, China. Tectonophysics 219 (4), 305–325. doi:10.1016/0040-1951(93)90180-r
Xu, Y., He, H., Deng, Q., Allen, M. B., Sun, H., and Bi, L. (2018). The CE 1303 Hongdong Earthquake and the Huoshan Piedmont Fault, Shanxi Graben: Implications for Magnitude Limits of Normal Fault Earthquakes. J. Geophys. Res. Solid Earth 123 (4), 3098–3121. doi:10.1002/2017jb014928
Xue, Y., Kong, F., Li, S., Zhang, Q., Qiu, D., Su, M., et al. (2021). China Starts the World’s Hardest “Sky-High Road” Project: Challenges and Countermeasures for Sichuan-Tibet Railway. Innovation 2 (2), 100105. doi:10.1016/j.xinn.2021.100105
Yang, X., Ran, Y., Hu, B., and Guo, W. (2002). Active Fault and Paleoearthquakes of the Piedmont Fault (Wuju-Mengkou-Dongfeng Village) for Serteng Mountains, Inner Mongolia (In Chinese). Earthq. Res. China 18 (2), 127–140.
Yang, X., Ran, Y., Hu, B., and Guo, W. (2003). Paleoseismic Activity on Wujiahe Segment of Sertengshan Piedmont Fault, Inner Mongolia (In Chinese). Acta Seismol. Sin. 25 (1), 62–71.
Zhang, A., Yang, Z., Zhong, J., and Mi, F. (1995). Characteristics of Late Quaternary Activity along the Southern Border Fault Zone of Weihe Graben Basin. Quat. Int. 25, 25–31. doi:10.1016/1040-6182(94)p3715-k
Zhang, Y. Q., Mercier, J. L., and Vergély, P. (1998). Extension in the Graben Systems Around the Ordos (China), and its Contribution to the Extrusion Tectonics of South China with Respect to Gobi-Mongolia. Tectonophysics 285 (1-2), 41–75. doi:10.1016/s0040-1951(97)00170-4
Zielke, O., Arrowsmith, J. R., Ludwig, L. G., and Akçiz, S. O. (2010). Slip in the 1857 and Earlier Large Earthquakes along the Carrizo Plain, San Andreas Fault. Science 327 (5969), 1119–1122. doi:10.1126/science.1182781
Zielke, O., Arrowsmith, J. R., Grant Ludwig, L., and Akciz, S. O. (2012). High-resolution Topography-Derived Offsets along the 1857 Fort Tejon Earthquake Rupture Trace, San Andreas Fault. Bull. Seismol. Soc. Am. 102 (3), 1135–1154. doi:10.1785/0120110230
Keywords: fault scarp, vertical displacement, scarp morphology, paleoseismicity, the wulashan piedmont fault
Citation: Bi H, Shi L, Zhang D, Peng H, Yang J, You Z and Sun X (2022) Constraining Paleoseismicity of the Wulashan Piedmont Fault on the Northern Margin of the Ordos Block From Fault Scarp Morphology. Front. Earth Sci. 10:911173. doi: 10.3389/feart.2022.911173
Received: 02 April 2022; Accepted: 25 May 2022;
Published: 14 June 2022.
Edited by:
Daoyang Yuan, School of Earth Sciences, Lanzhou University, ChinaReviewed by:
Junjie Ren, China Earthquake Administration, ChinaXuhua Shi, Zhejiang University, China
Copyright © 2022 Bi, Shi, Zhang, Peng, Yang, You and Sun. This is an open-access article distributed under the terms of the Creative Commons Attribution License (CC BY). The use, distribution or reproduction in other forums is permitted, provided the original author(s) and the copyright owner(s) are credited and that the original publication in this journal is cited, in accordance with accepted academic practice. No use, distribution or reproduction is permitted which does not comply with these terms.
*Correspondence: Haiyun Bi, YmloYWl5dW5AaWVzLmFjLmNu