 Pranjal Dwivedi
 Kathrin Schilling
 Naomi Wasserman3
 Celine Pallud
- 1Department of Environmental Science, Policy and Management, University of California, Berkeley, Berkeley, CA, United States
- 2Department of Environmental Health Sciences, Columbia University Mailman School of Public Health, New York, NY, United States
- 3Department of Geology, University of Illinois at Urbana-Champaign, Champaign, IL, United States
- 4Department of Environmental Science, Policy and Management, College of Natural Resources, University of California, Berkeley, Berkeley, CA, United States
Redox reactions control the mobility and bioavailability of selenium (Se) in biogeochemical systems, both modern and ancient. Se isotope ratio measurements (e.g., 82Se/76Se) have been developed to enhance understanding of biogeochemical transformations and transport of Se. Stable isotope ratios of many elements are known to be powerful indicators of redox reactions, and shifts in 82Se/76Se have been observed for Se reduction reactions. However, Se isotope shifts caused by naturally relevant oxidation reactions have not been published. Here, we report Se isotope fractionation factors for oxidation of Se(IV) by birnessite. Experiments were conducted at pH = 4.0 and 5.5, with two types of birnessite of contrasting composition at two concentrations of suspended birnessite. The results are consistent with a single 82Se/76Se fractionation factor, for all times during all experiments, of 0.99767 (±0.0035 2 s.d.). Expressed as ε, the fractionation is 2.33‰ (±0.08‰).
Introduction
Selenium (Se) is a redox-sensitive element and plays a dual role in the modern environment as an essential micronutrient (Huawei, 2009) and a contaminant detrimental to aquatic wildlife (Ohlendorf et al., 1990; Schuler et al., 1990). It also serves as a paleoredox proxy (Schirmer et al., 2014; Kipp et al., 2020; Stüeken and Kipp, 2020). In nature, it exists in four oxidation states (+6, +4, 0, −2), each displaying different solubility and sorption characteristics. Under oxic and mildly reducing conditions, Se occurs as soluble oxyanions, Se(VI) (as selenate; SeO4−2) and Se(IV) (as SeO3−2 and HSeO3−). Under reducing conditions elemental Se (Se(0)) and selenide (-II) are thermodynamically stable species which are sparingly soluble in typical soil and groundwater systems. Adsorption of Se(IV) onto metal oxide surfaces is much stronger than that of Se(VI); Se(IV) forms strong inner-sphere complexes (Catalano et al., 2006) while Se(VI) is bonded via weaker outer-sphere complexes and some inner-sphere complexes under some conditions (Peak and Sparks, 2002).
In the global Se cycle, oxidation plays a central role in the dissolution of Se(-II)-bearing minerals and elemental Se as well as in the release of soluble Se oxyanions that are transferred from continental to marine reservoirs (Nriagu, 1989; Haygarth, 1994; White and Dubrovsky, 1994; Fernández-Martínez and Charlet, 2009). Although oxidation has been a major Se mobilizing process throughout geologic time (Masscheleyn et al., 1990; Plant et al., 2005) and is an important process controlling fluxes in modern environments, there are gaps in our understanding of reaction rates and mechanisms with environmentally relevant mineral oxides.
The fate of Se is strongly influenced by surface reactive mineral phases (Scott and Morgan, 1996). Mn oxides play important roles in soils and sediments due to their ubiquity, with concentrations in the range of 0.02–10 g/kg (Essington, 2003), and narrow Eh-pH stability field (Tournassat et al., 2002). Birnessite (δ-MnO2) is an important redox-sensitive Mn oxide (Scott and Morgan, 1996) commonly found in soils and sediments (Banerjee and Nesbitt, 2000). Birnessite has been shown to adsorb and oxidize cobalt(II) (Crowther, Dillard, & Murray, 1983), chromium(III) (Fendorf, 1995), and arsenic(III) (Scott & Morgan, 1995) and is also a known oxidant and adsorbent for Se(IV) (Scott and Morgan, 1996). To date, limited research has explored interactions between Se and birnessite in environmentally relevant settings. Scott and Morgan (1996) showed that Se(IV) oxidation on δ-MnO2 surfaces was directly facilitated by electron transfer from Se(IV) to Mn(IV). The chemical reaction between Se(IV) and birnessite leads to the reductive dissolution of the mineral surface and subsequent production of Mn(II) following the reaction: (Eq. 1)
Measurements of stable Se isotope ratios (e.g., 82Se/76Se; other ratios have also been used) have been developed as a means to improve understanding of Se biogeochemical transformations that control the mobility and bioavailability of Se in modern environments (Clark and Johnson, 2010; Zhu et al., 2014; Schilling et al., 2015), and a means to extract information about ancient redox conditions from rocks (e.g.,Mitchell et al., 2012; Mitchell et al., 2016; Kipp et al., 2017; Kipp et al., 2020). Laboratory studies have investigated Se isotope fractionation induced by reduction, volatilization, and adsorption of Se, and it has been observed in both theoretical and empirical studies that Se isotopes are highly sensitive to redox reactions (Herbel et al., 2000; Johnson and Bullen, 2004; Li and Lui, 2011; Schilling et al., 2011; Mitchell et al., 2012; Schilling et al., 2020; Xu et al., 2020; Xu et al., 2021). Reduction reactions, which tend to immobilize aqueous Se, have been relatively well studied (Herbel et al., 2000; Johnson and Bullen, 2004; Mitchell et al., 2016; Shrimpton et al., 2015; Schilling et al., 2020). However, Se isotopic fractionation induced during oxidation is almost completely unexplored (Johnson et al., 1999; Wasserman et al., 2021), and this limits our ability to interpret Se isotope data for natural settings.
Here, we investigate the reaction of Se(IV) with birnessite and the effect of surface properties including morphology and crystallinity. We conducted a series of batch experiments 1) with birnessite synthesized by different methods 2) varying amount of birnessite, and 3) at two different pH conditions. We measured aqueous Se(IV), Se(VI), Mn(II) concentrations, and 82Se/76Se produced via reaction of Se(IV) with birnessite at pH 4 and 5.5, birnessite concentrations of 0.24 and 0.48 g L−1 (Table 1). We varied pH conditions, birnessite type, and birnessite concentrations because these parameters have previously been shown to influence reaction kinetics (Scott and Morgan, 1996; Wang and Giammar, 2015) due to the difference between the point of zero charge (pzc) of the mineral surface and sorption affinity pH of the solution, which directly influences the sorption of ionic species involved in the reaction. All tested parameters are relevant when interpreting the fate of Se oxyanions in aquatic systems, where mixed reactive Mn oxides are abundant (Post, 1999; Tebo et al., 2004). The experiments were designed to yield Se isotope fractionation factors for Se(IV) oxidation by birnessite, in order to improve the interpretation of Se isotope data from systems with fluctuating redox conditions (e.g., shallow aquifers or seasonal fluctuations of the water table) or spatial redox contrasts (e.g., oxidative terrestrial weathering combined with reductive marine deposition). We are aware of the narrow pH range represented by our experiments, however Scott and Morgan (1996) did not observe significant oxidation and adsorption at pH 7, therefore our experiments are representative of low pH conditions which are environmentally relevant for Se(IV) adsorption and oxidation.
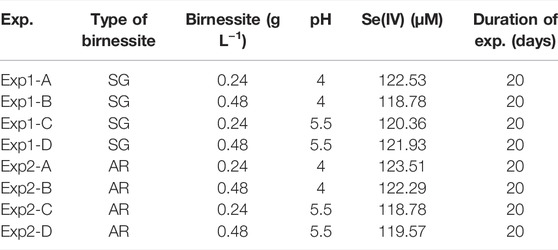
TABLE 1. List of experimental conditions with concentrations at t=01.
Methods
Birnessite Synthesis and Characterization
The specific surface area (SSA) of the particular mineral has been shown to play a major role in determining the kinetics of oxidative reactions (Villalobos et al., 2014). Additionally, the internal structure and the Mn+3/Mn+4 ratio, both of which determine the overall charge of the interlayer and its reactivity, vary across mineral morphologies (Feng et al., 1999). The morphologies of synthesized minerals often vary based on the synthesis method. Mn oxides synthesized by additional calcination are more crystalline (Subramanian et al., 2014; Augustin et al., 2015) than oxides prepared from other methods, such as precipitation and sol-gel/solvothermal syntheses (Handel et al., 2013). Most studies have used acid-synthesized birnessite for their experiments with low SSA between 19 and 33 m2/g (Scott and Morgan, 1996; Manning et al., 2002; Power et al., 2005; Villalobos et al., 2014). Only a study by Lafferty et al. (2010) reported high SSA of 274 m2/g for acid-synthesized birnessite. In order to compare birnessites with different specific surface area (SSA) and crystallinity, we synthesized birnessite using two different methods (Mckenzie, 1971; Ching et al., 1995; Scott and Morgan, 1996; Handel et al., 2013). The first method, referred to as the acid-reduction (AR) method (McKenzie, 1971; Scott and Morgan, 1996), involves the reduction of potassium permanganate (KMnO4) using hydrochloric acid (HCl). More specifically, 50 ml of 2 M HCl was added slowly over 3 h to 500 ml of aqueous 1 M KmnO4. The solution was constantly stirred while the temperature was maintained at 60°C. Formed birnessite, visible as brown precipitate, was then collected and centrifuged at 1670 rcf for 15 min and washed with 18.2 MΩ Milli-Q water until the conductivity of the supernatant was less than 10 µS. The precipitate was then dried at 35°C for 48 h before calcination at 400°C for 60 h in a ceramic crucible inside a muffle furnace. The residue was then centrifuged, washed and dried as described above, to obtain the final AR birnessite.
The second method, referred to as sol-gel (SG) method (Händel et al., 2013), also involves KmnO4 reduction, but is referred in the literature as a soft chemistry method (Ching et al., 1995). One milliliter of 50% sodium-lactate solution was added to 100 ml of 63.3 mM aqueous KmnO4. This solution was stirred for 2 h at room temperature until the purple color disappeared and a precipitate formed. The precipitate was collected and centrifuge-washed at 1670 rcf for 15 min with 18.2 MΩ Milli-Q water until the conductivity of the supernatant was less than 10 µS. The precipitate was then freeze-dried for 48 h. We refer to the birnessite created via the sol-gel method as SG-birnessite.
Bulk solid phase mineralogy of the two types of birnessite before and after the batch experiments was determined using powder X-ray diffraction (XRD). XRD analyses were carried out using MicroSTAR-H APEX II diffractometer equipped with a Cu-Kα radiation source (40 kV, 40 mA). Spectra were determined spanning 2θ values from 3 to 80° with step sizes of 0.01° and 90 s. Crystal morphology and particle size estimates were imaged using scanning electron microscopy (SEM, Zeiss Evo-10 Variable Vacuum) with energy dispersive detector (EDS) with 3 mg of carbon-coated solids mounted on adhesive tape.
Fourier-transform infrared (FTIR) spectra were obtained using a Nicolet 6700 (Thermo Scientific) in the 4000–400 cm−1 range by mixing a small amount of birnessite in 18.2 MΩ Milli-Q water. The final spectra were obtained by subtracting the spectra for water from the slurry and baseline correction. The surface area of the two birnessite types was determined using BET (Brunauer, Emmett, and Teller) (Brunauer et al., 1938). The powdered samples were dried at 100°C overnight, then placed into 9 mm glass cells and outgassed under vacuum for 2–3 h at 150°C to remove any moisture or gasses adsorbed onto the mineral surfaces. The sample cell was stabilized at liquid nitrogen temperature (77.350 K) and measured for BET surface area under nitrogen atmosphere. Multiple-point BET surface area measurements (corresponding to P/Po ratios of 0.050, 0.075, 0.100, 0.150, 0.200, 0.250 and 0.300) were performed for each sample to determine its specific surface area using an Autosorb AS-1 (Quantachrome Instruments, Boynton Beach, FL, United States).
The average oxidation state of Mn in the synthesized birnessite was determined following a method by Kijima et al. (2001). Briefly, 0.1 g of birnessite was reacted with 10 ml of 1 M sulfuric acid (H2SO4) and 5 ml of 0.5 M sodium oxalate (Na2C2O4) at 60°C. The excess oxalate was reduced by adding dropwise 0.02 M KmnO4 until a steady pink color appeared. Then a subsample was taken and the concentration of Mn(II) was determined by Inductively Coupled Plasma Optical Emission Spectroscopy (PerkinElmer 5300 DV ICP–OES) in normal mode, with a detection limit of 0.5 μM. The average oxidation state (AOS) of Mn was calculated using the formula: (Eq. 2)
where the net reducing equivalents per gram birnessite was determined as equivalent of oxalate used for dissolving birnessite (Murray et al., 1984). [Mn]Tot is the total amount of Mn per gram of birnessite.
Batch Experiments
Duplicate anoxic batch experiments, following Scott and Morgan (1996), were performed with the two types of birnessite. In acid-washed serum bottles, 0.03 or 0.06 g dry weight (±0.003 g) birnessite were added to 122.5 ml of 1 mM NaCl obtaining final birnessite of 0.24 and 0.48 g L−1 in solution. The solution was then degassed with N2 gas for 3 h before the bottles were transferred into an anaerobic glove box. Then 2.5 ml of a 5.8 mM Se(IV) stock solution, prepared by dissolving 100.4 mg of Na2SeO3 in DDI and making up the volume to 1 L, was added and the pH adjusted to 4 or 5.5 with 1 M NaOH or 1 M HCl. Scott and Morgan (1996) carried out experiments at pHs 4, 5, and 7 and did not find considerable oxidation and adsorption at pH 7 therefore this experiment focussed on lower pHs. The initial Se(IV) concentration for all experiments was 120 μM. The solution was allowed to equilibrate for 2 h. The batch reactors were then consistently stirred during the experiment with a rotary shaker at 45 rpm and kept at constant temperature of 25°C. The pH of the batch solution was monitored throughout the experiment with Vernier electrodes and adjusted if needed by addition of 0.1 M HCl or 0.1 M NaOH to maintain a constant pH. The batch reactors were subsampled at 0, 2, 4, 6, 8, 12, and 24 h and then once per day for a total of 14 days and 20 time points. For each sampling point, two 1 ml subsamples were withdrawn and filtered through 0.22 μm nitrocellulose filters and made up to 10 ml with 2% HNO3 for elemental analysis.
Chemical Analyses
Total Se and Mn concentrations were determined using a PerkinElmer 5300 DV ICP–OES. Total Se was determined using the ICP–OES operating in regular mode (detection limit of 0.05 μM) and Se(IV) concentrations were measured using ICP–OES coupled to a hydride-generation (HG) setup (detection limit of 0.1 μM). This setup is based on the phase separator setup described by Bosnak and Davidowski (2004) and with flow rates as used by Brooks (1991) in Manifold 2 (HG–ICP–OES). A sample injection time of 120 s before optical emission reading and a rinse time of at least 30 s with an additional 100 s following samples exceeding 1.9 mmol L−1 were used due to a significant memory effect. Elemental and speciation standards were prepared from certified reference stock solutions (LGC Standards, Teddington, United Kingdom) in a matching matrix to the measured samples. All Se(IV) concentrations measured in samples were corrected from trace concentrations in the input solutions [approximately 0.2 μM of Se(IV) and Se(VI)] (Kausch et al., 2012). Selenate concentrations were determined using ICP-OES after separation of Se(IV) from Se(VI) using anion exchange columns (Schilling et al., 2015). Two milliliters of sample was loaded onto a chromatography column filled with 1 ml of BioRad® AG1-X8 anion exchange resin. Se(IV) was eluted from the column by 0.1 M HCl while Se(VI) was retained. Se(VI) was then eluted with 5 M HCl and measured using ICP-OES in regular mode.
Se Isotope Analysis
Selenium isotope analysis was carried out on Se(VI) extracted from sample solutions. Samples for isotope analysis were filtered through 0.22 μm nitrocellulose filters and made up to volume in a 1 M HCl matrix. Aliquots were collected with a total Se mass of 50–100 ng from each sample. Then, an appropriate amount of double spike solution (see below) was added so that the ratio of spiked 77Se to natural 78Se in the sample was close to 2:1. After addition of the spike and overnight equilibration of the spike with the solution, Se(VI) was isolated from samples using the ion exchange method described above. The samples were eluted from the columns by 5 M HCl. To convert Se(VI) to Se(IV), the samples were heated in a hot block held at 120°C for 1 h. After cooling to room temperature, the solutions were diluted to 2 M HCl. Standard and blank solutions were prepared following the same procedure together with the samples.
Selenium isotope ratios were determined with a Multicollector Inductively Coupled Plasma Mass Spectrometer (MC-ICPMS) (Nu Plasma HR, Nu Instruments; Wrexham, United Kingdom). Selenium was introduced into the instrument via a custom-built hydride generator (Zhu et al., 2008). Sample Se was introduced into the mass spectrometer as H2Se evolved via reaction with a 0.2% NaBH4 solution in a continuous flow hydride generator. The double spike (74Se + 77Se) method was used to correct for instrumental mass bias and any isotopic fractionation occurring during sample preparation or hydride generation (Johnson et al., 1999) with mass spectrometry proceeding according to the method described by numerous studies (Zhu et al., 2008; Zhu et al., 2014; Schilling et al., 2015; Mitchell et al., 2016). The ratios of 74Se/78Se, 76Se/78Se, 77Se/78Se, and 82Se/78Se were measured simultaneously in Faraday detectors with a minimum of 30 integrations of 5s each. Isobaric interference from germanium (Ge) was determined by measurement of Ge using an ion-counting detector and calculation of 74Ge and 76Ge using mass bias-corrected natural Ge isotope ratios. Interferences from ArAr at masses 76 and 78 were determined by measuring mass 80 intensity, subtracting the 80Se intensity to obtain the ArAr intensity and calculating the corresponding mass 76 and 78 isotopomers using mass bias-corrected natural Ar isotopes ratios. Interferences from Kr and ArCl were subtracted using on-mass zero measurements. The 82Se/76Se and 82Se/78Se of each sample or standard were extracted from the interference-corrected Se isotope ratios measured on the sample-spike mixture via an iterative data reduction calculation that determines and corrects mass bias, mathematically removes the spike from the mixture, and calculates the final results (Johnson et al., 1999). The external precision was ±0.2‰ (2 s.e) based on 10 pairs of duplicate samples.
All isotope data are reported using the δ notation to express 82Se/76Se relative to the standard NIST 3149 SRM: (Eq. 3)
Isotopic Fractionation and Rayleigh Distillation Model
The magnitude and direction of kinetic isotope effects are described by the isotope fractionation factor α (Eq. 4)
where Rproduct and Rreactant refer to the isotope ratio of the incremental, or instantaneous, product and the reactant, respectively. Expressing the magnitude of fractionation in per mil terms provides a more easily grasped measure of fractionation, and thus we use ε, in addition to α, to quantify isotopic fractionation: (Eq. 5)
ε is useful because it is very close to the δ82/76Se difference between the reactant and the instantaneous (incremental) reaction product: (Eq. 6)
Se isotopic compositions were measured on dissolved Se(VI) only, in order to focus analytical effort on the data that would most efficiently quantify the isotopic fractionation. The δ82/76Se values of dissolved Se(IV) could have been used to obtain a second, independent determination of ε in, but this would have required much longer experiments and double the analytical effort to obtain a redundant result. Fractionation factors were extracted from the δ82/76Se values of aqueous Se(VI) using a Rayleigh distillation model. The δ82/76Se values of an accumulated reaction product are given by (Eq. 7)
where δacc.product is the δ82/76Se value of the measured (accumulated) Se(VI) in solution at some time after the reaction has started, δ0 is that of the initial Se(IV) reactant pool before any reaction has occurred, and f is the fraction of the initial Se(IV) remaining at the time of sampling. Equation 7 was then fitted to isotope data provided in Tables 2, 3 using a least-squares minimization approach and the line of best-fit is plotted alongside the datapoints in Figure 1.
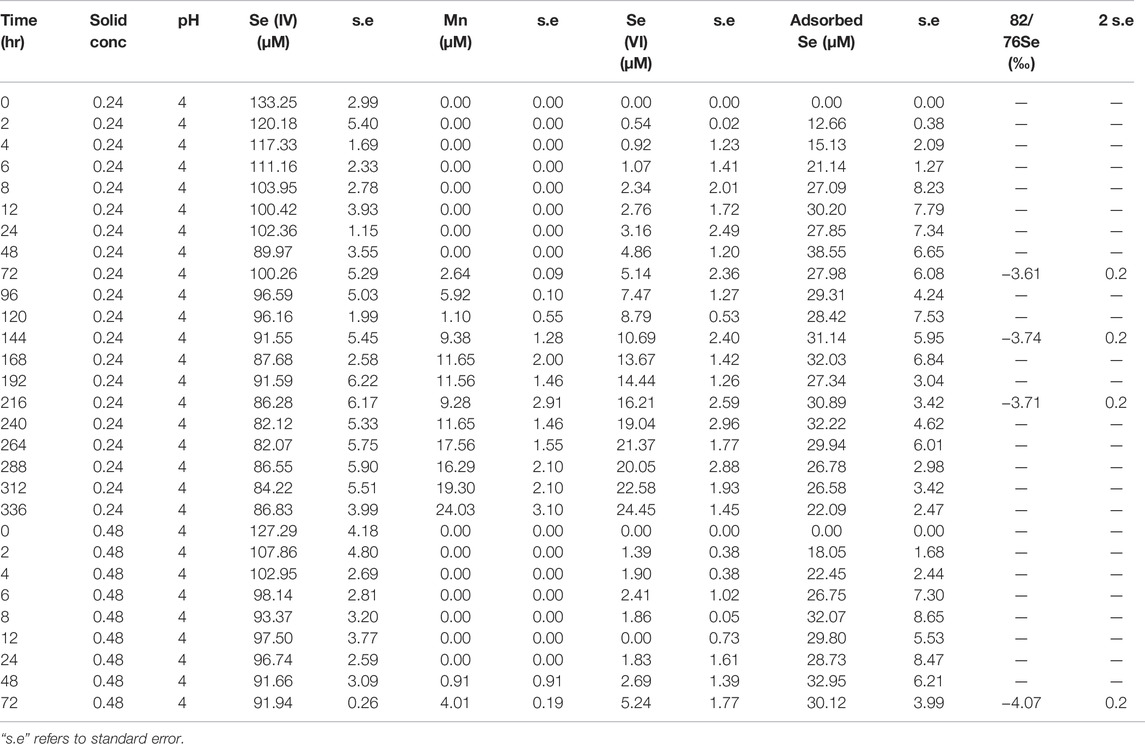
TABLE 2. Concentration and isotope data for experiments carried out with AR birnessite.
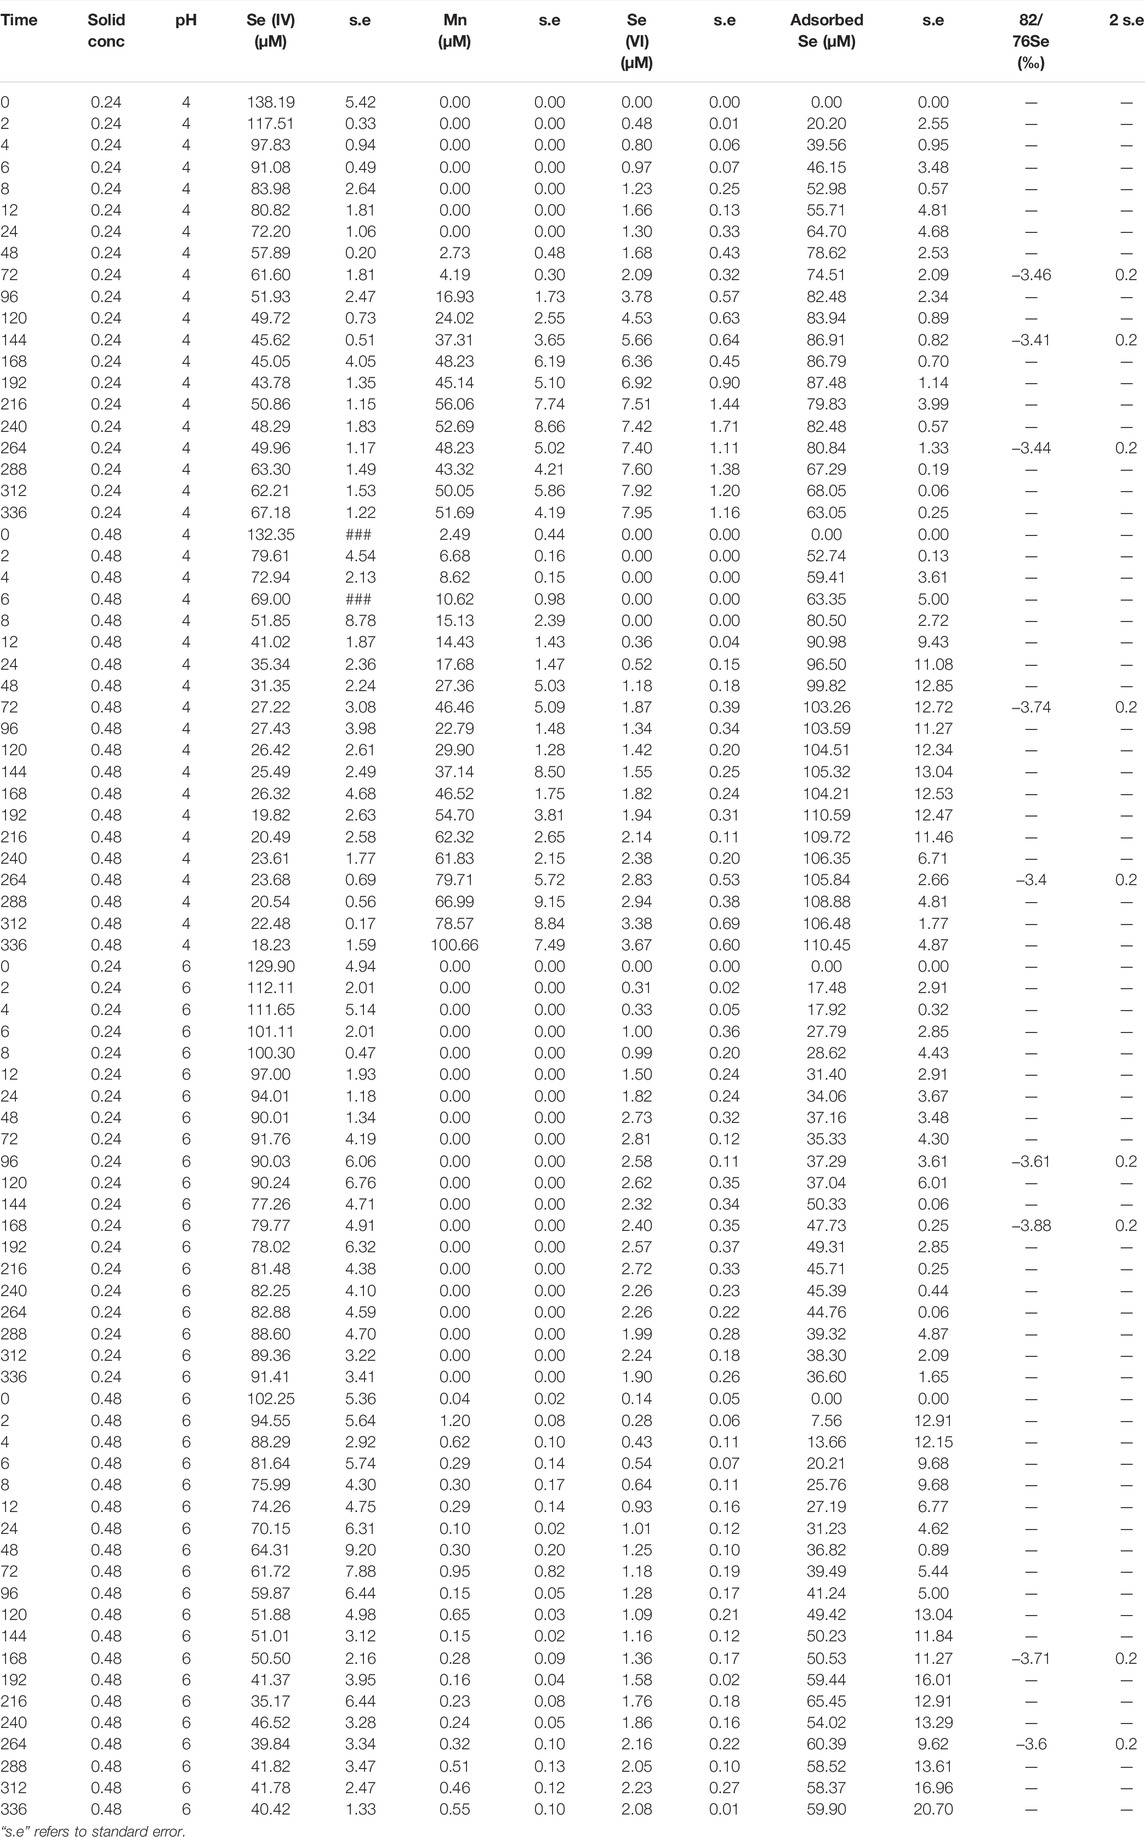
TABLE 3. Concentration and isotope data for experiments carried out with SG birnessite.
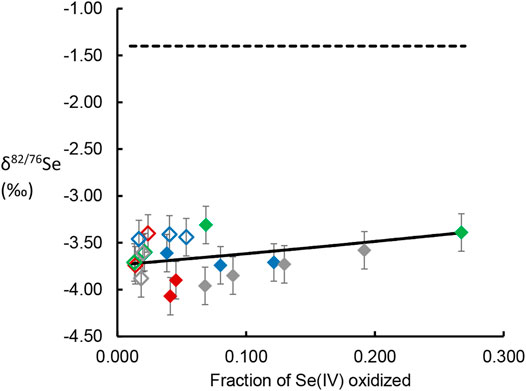
FIGURE 1. δ82/76Se values of dissolved Se(VI) generated by oxidation of Se(IV) by birnessite, plotted versus the fraction of the initial Se(IV) oxidized and released into solution. Data point colors follow the scheme used in Figures 4, 5, with red dots representing experimental conditions represented by orange. Closed symbols represent AR birnessite experiments; open symbol represent SG birnessite experiments. Dotted line gives the δ82/76Se value of the Se(IV) reactant stock solution. Solid line gives the line for a Rayleigh distillation model fit to the data across all experimental conditions.
Results
Birnessite Characterization
SEM images showed distinct morphological differences between the two types of birnessite (Figure 2). However, both types were compositionally similar, with Mn content ranging from 55 to 67 wt%, O of 25–35 wt%, and K of 3–7 wt% (Table 4). These are consistent with values reported in mineral databases (“Birnessite Mineral Data, 2019” Web Mineral). The SSA for the SG birnessite was 134.32 m2 g−1 (±8.27 m2 g−1), which is much greater than AR birnessite with SSA of 82.5 m2 g−1.
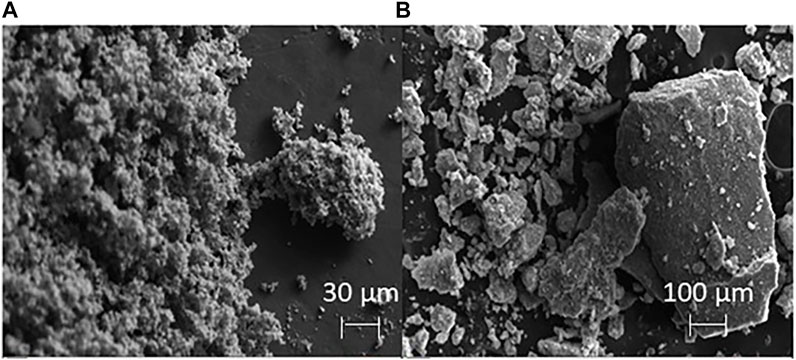
FIGURE 2. SEM images of the synthesized birnessite using the AR method (A, scale bar is 30 μm), and the SG method (B, scale bar is 100 μm).
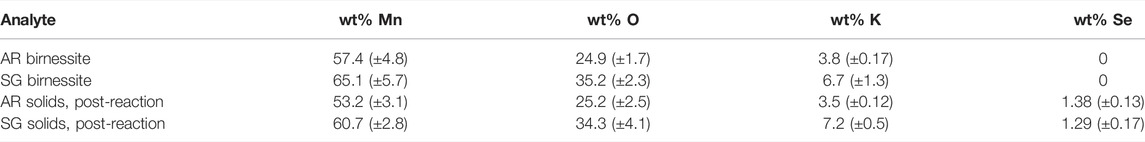
TABLE 4. Elemental composition of the two birnessite types (AR= acid-reduction, SG= sol-gel) and the solid particles collected after the experiments have elapsed.2
The XRD patterns for the two types of birnessite are shown in Figure 3. Both birnessites contain the dominant characteristic K-birnessite reflections at 2θ angles of 12.56 (1), 25.42(2), 38.82(3), and 51.25°(4), and corresponding d-spacings of 7.14 Å, 3.63 Å, 2.41 Å, 1.81 Å respectively (Post & Veblen, 1990). However, the presence of other peaks (1′-6′) points to the mixed nature of the synthesized oxides (Birkner and Navrotsky, 2017). Cheney et al. (2009) investigated the effect of Hoffmeister anions (Cl−, SO42−, and ClO4 −) during the synthesis of birnessite nanostructures and found significant quantities of cryptomelane (K(Mn4+,Mn2+)8O16 ) mixed with the birnessite, and significant contractions in crystal size. This can explain the higher presence of cryptomelane phases in the AR birnessite XRD spectra compared to SG birnessite. XRD spectra of two different cryptomelane samples reveal that peaks 1′-6′ are representative of cryptomelane phases in the synthesized oxide (Post et al., 1982; Vicat et al., 1986).The software linked with MicroSTAR-H APEX II instrument identified birnessite and cryptomelane as the two major phases present in the oxide as well. There is also a significant difference in the intensities of the diffraction peaks, with SG birnessite being more reflective, presumably due to its higher crystalline nature compared to the AR birnessite (Figure 3).
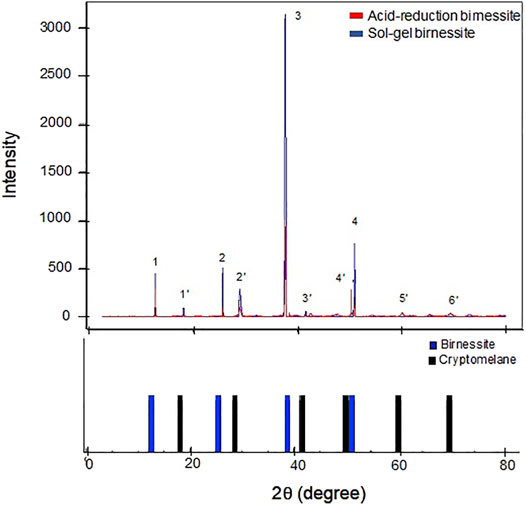
FIGURE 3. XRD spectra for the two birnessite types used in the experiment (upper panel). Lower panel represents the characteristic peaks of birnessite (blue) and cryptomelane (black) from the American Mineralogist crystal structure database (Downs and Hall-Wallace, 2003).
FTIR spectra of the two types of birnessite (Figure 4) are consistent with those seen for K-birnessites (Potter and Rossman, 1979; Ling et al., 2017). Hydroxide ion and a less-ordered water of crystallization produces the two peaks in the 4000–1400 cm−1 region, whereas the absorbance in the 650–400 cm−1 represents Mn-O bonds (Potter and Rossman, 1979).
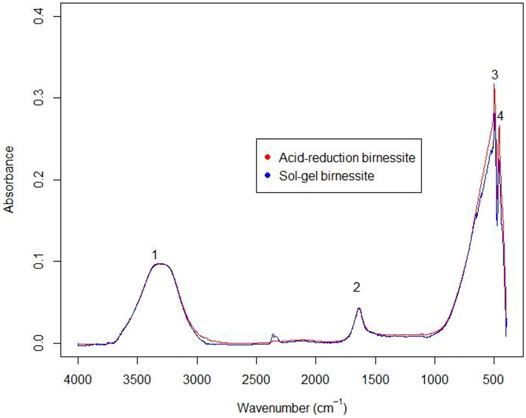
FIGURE 4. FTIR spectra for the two birnessites used in the experiment.
The average oxidation state for the AR birnessite was 3.28 ± 0.08, compared to 3.45 ± 0.05 for the SG birnessite.
Se Species Concentrations
Dissolved Se(IV) and Se(VI) concentrations are presented in Figures 5, 6 and Tables 3, 4. For all experiments we observed removal of dissolved Se(IV). A sharp decrease in Se(IV) concentrations by 30–85% occurred within the first 12 h for all experiments (Figure 6). The decrease was generally stronger in the experiments containing the SG birnessite. After 12 h, in most experiments, Se(IV) concentration in solution continued to decrease, but at a slower rate. In the SG birnessite experiments with lower masses of birnessite, slight increases in dissolved Se(IV) occurred after 200 h. Se(IV) concentrations varied by about a factor of two for experiments with SG birnessite at different solid concentrations for the same pH after the first 48 h, compared to 1.2 for experiments with AR birnessite. It was also notable that experiments with birnessite concentration of 0.48 g L1 at pH 5.5 had similar concentration profiles to experiments carried out with a birnessite concentration of 0.24 g L−1 at pH 4.
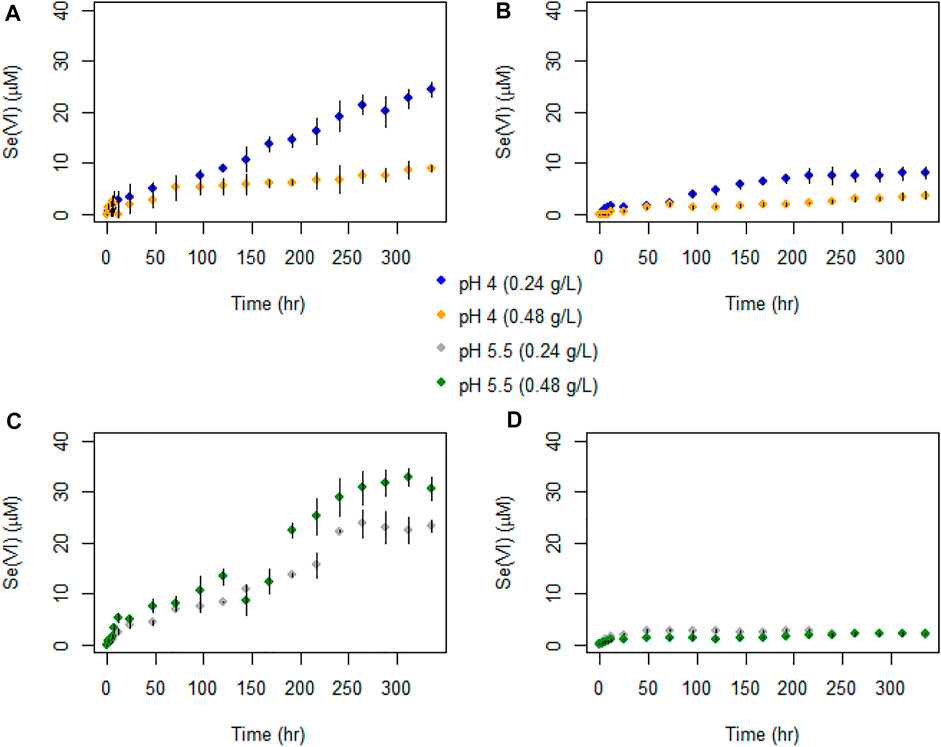
FIGURE 5. Temporal evolution of Se(VI) concentrations in batch experiments with (A) AR birnessite at pH 4, (B) SG birnessite at pH 4, (C) AR birnessite at pH 5.5, and (D) SG birnessite at pH 5.5. All experiments were performed at 25°C with an initial Se(IV) of 120 μM. Error bars represent standard deviations for concentrations measured in duplicates.
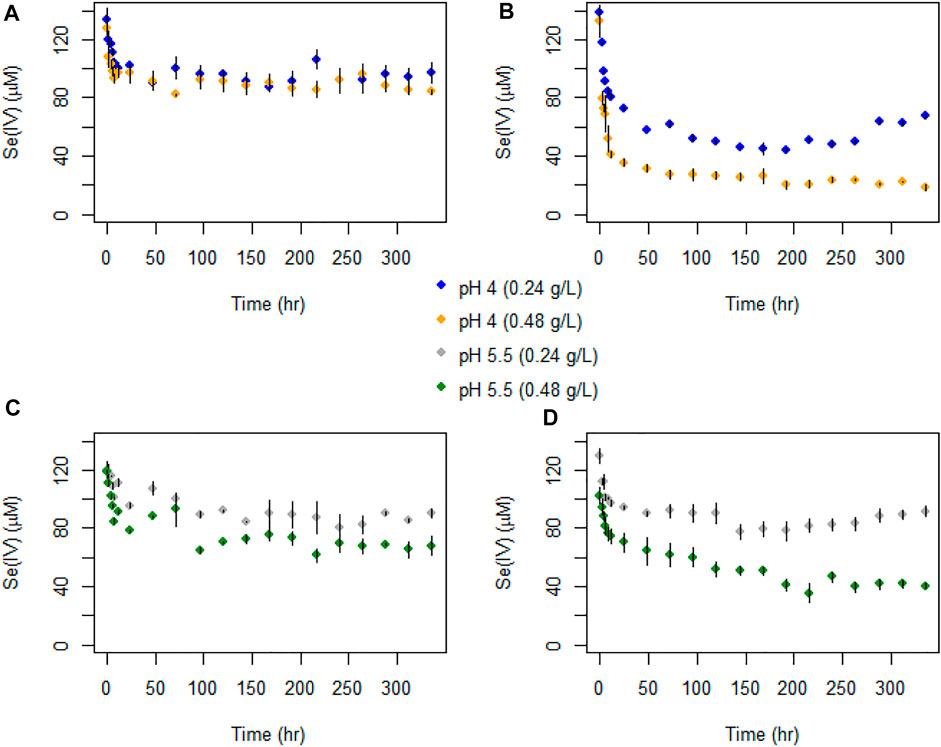
FIGURE 6. Temporal evolution of Se(IV) concentrations in batch experiments with (A) AR birnessite at pH 4, (B) SG birnessite at pH 4, (C) AR birnessite at pH 5.5, and (D) SG birnessite at pH 5.5. All experiments were performed at 25°C with an initial Se(IV) concentration of 120 μM. Error bars represent SDs for concentrations measured in duplicates.
The temporal evolution in Se(IV) concentrations was similar to total Se, with an initial fast decrease followed by a stabilization or slow decrease in concentrations. A sharper decline in Se(IV) concentrations was observed for the SG birnessite compared to the AR birnessite (Figure 6). Se(IV) depletion rates for the SG birnessite ranged from 11.9 μM h−1 at pH 4 and 0.48 g L−1 solids to 2.1 μM h−1 at pH 5.5 and 0.24 g L−1. For experiments with AR birnessite, the rates ranged from 5.6 μM h−1 to 0.87 μM h−1.
Selenate concentrations did not exceed 35 μM across all experiments (Figure 5) which is about 30% of the initial Se(IV) concentration. We observed a faster initial production of Se(VI) in the first 48 h of the experiments, after which concentrations oscillated and stabilized for experiments with SG birnessite whereas they continued to increase linearly for AR birnessite. Higher Se(VI) concentrations of 30–35 μM were observed for experiments at pH 5.5 for AR birnessite, whereas concentrations reached 25 µM for experiments at pH 4 and a higher solid concentration. For SG birnessite, Se(VI) stabilized around 3 μM at pH 5.5 across both solid concentrations, whereas concentrations peaked and stabilized around 10 μM at pH 4. Given that there is an initial decrease in Se(IV) concentrations (Figure 6) without a corresponding increase in Se(VI) concentrations, adsorption seems to dominate in the first 24 h with oxidation being dominant after that.
Figure 7 shows that Mn(II) was only detected for experiments carried out at pH 4, with no Mn detected at pH 5.5. Despite the initial rapid decrease in Se(IV) concentrations, we observed no corresponding increase in aqueous Mn(II). For pH 4 experiments with 0.48 g L−1 birnessite, aqueous Mn(II) reached maximum concentrations of 42 and 103 μM for AR and SG birnessite, respectively. In comparison, in experiments with 0.24 g L−1 birnessite, aqueous Mn(II) ranged between 24 and 48 μM.
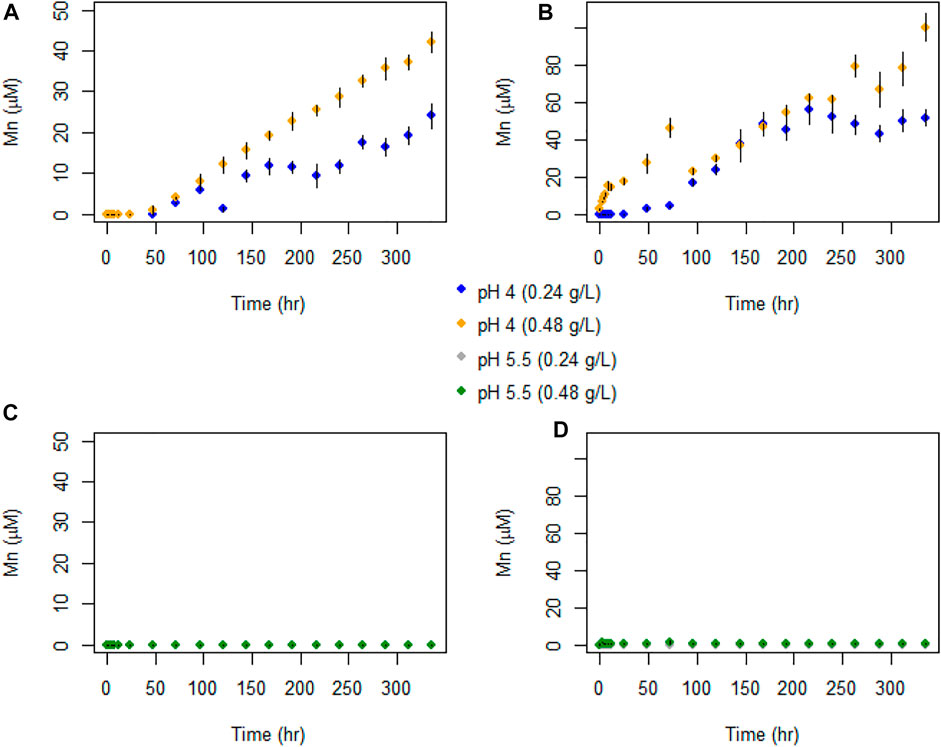
FIGURE 7. Temporal evolution of Mn(II) concentrations in batch experiments with (A) AR birnessite at pH 4, (B) SG birnessite at pH 4), (C) AR birnessite at pH 5.5, and (D) SG birnessite at pH 5.5. All experiments were performed at 25°C with an initial Se(IV) of 120 μM. Error bars represent SDs for concentrations measured in duplicates.
Incorportation of Se Into Solids
Figures 8, 9 shows an SEM image of Se associated with the birnessite surface collected at the end of batch experiments with acid-reduction birnessite and associated EDS spectrum. The precipitate was washed with de-ionized water to remove the residue from the fluid from the batch experiments. The light spot corresponds to adsorbed Se, which is based on the principle that heavier atoms with larger radii reflect more electrons on excitation, leading to more backscatter and lighter colors. These spots were observed at multiple points on the mineral surface. At the end of the experiments, the collected precipitates contained 1.76 ± 0.23 wt% Se at pH 4 and 1.12 ± 0.15 wt% Se at pH 5.5. At low solid concentration experiments (0.24 g L−1), AR birnessite had 0.75 ± 0.13 wt% Se, compared to 1.06 ± 0.27 wt% Se at pH 5.5 and 1.54 ± 0.36 wt% Se at pH 4.0 for SG synthesized birnessite. These values agree with Se(IV) profiles for reaction conditions with higher solid concentrations where a greater decrease in Se(IV) concentrations is observed. Based on the EDS measurements, adsorbed Se concentrations range between 0.72 and 0.4 μmol Se, and these values correspond well with the decrease in Se(IV) concentrations observed across reaction conditions with starting concentrations ranging from 1.3 to 1.1 μmol Se (Figure 6).
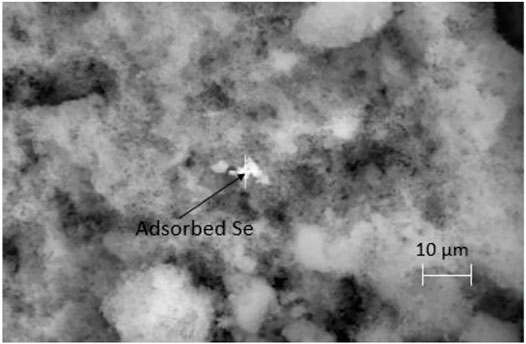
FIGURE 8. SEM image of the precipitate collected at the end of the experiment carried out at pH 4 with 0.24 g L−1 AR birnessite. Adsorbed Se is identified in a single bright spot here, however lighter spots in the vicinity were also shown to have significant but lower amounts of Se by weight.
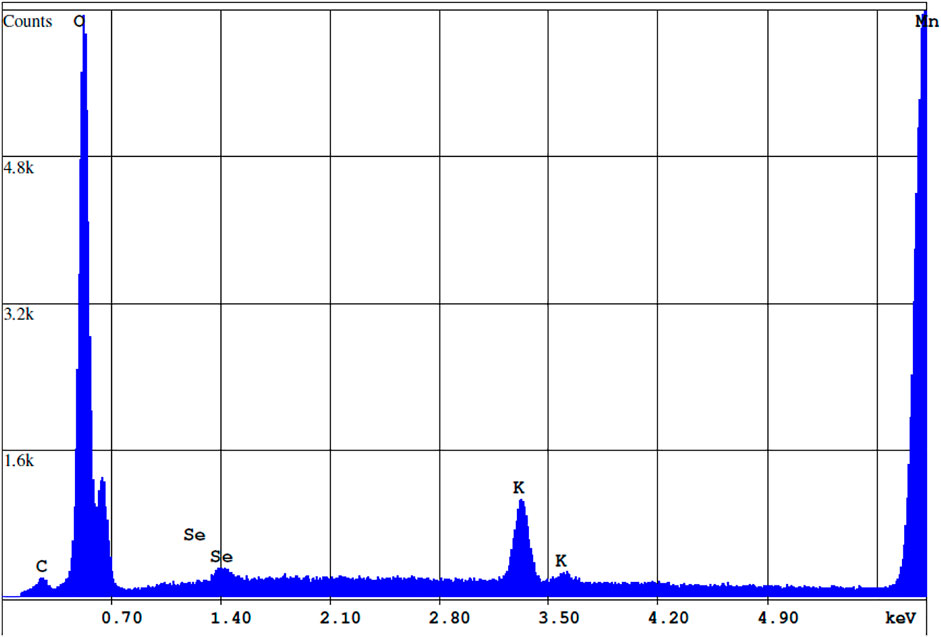
FIGURE 9. EDS spectrum of the precipitate cross-section highlighted in Figure 8. Concentrations of Mn, Se, O, and K are 66.22, 1.2, 29.38, and 3.21% by weight respectively.
Se Isotope Results
The measured δ82/76Se values in the dissolved Se(VI) are presented in Tables 2, 3 and Figure 1. The produced Se(VI) was always enriched in the lighter isotope (isotopically “light”) relative to the Se(IV) used to make up the initial solution, with the difference ranging from −1.91‰ to −2.56‰. This indicates that Se(IV) oxidation involves mass-dependent isotopic fractionation; the reaction proceeds faster for lighter isotopes. Precise quantification of this fractionation, obtained by fitting isotope data to the Rayleigh distillation model equation using a minimization of squared residuals (Eq. 7), revealed fractionation factors (α; Eq. 4) of 0.99757 (±0.005, 2 s.d.) for the AR birnessite experiments and 0.99781 (±0.0063, 2 s.d.) for the SG birnessite experiments (Figure 1). Significant overlap of the uncertainty envelopes of these values indicate that they are not significantly different. When results from all experiments are fit to a single Rayleigh model, the resulting fractionation factor is 0.99767 (±0.0035 2 s.d.). Expressed as ε, the fractionation is 2.33‰.
The magnitude of isotopic fractionation is not sensitive to pH or the mass loading of birnessite in the experiments: Deviations of δ82/76Se measurements from the best-fit Rayleigh model show no significant correlation with either of these variables.
Discussion
Aqueous Concentrations and Reaction Mechanisms
The experiments conducted with AR birnessite were modelled after those of Scott and Morgan (1996), and the changes in Se(IV) and Se(VI) concentrations (Figures 5, 6) were roughly similar. The fraction of Se(IV) adsorbed in the early stages of the experiments and the rate of Se(VI) production roughly matched those observed in Scott and Morgan (1996). The SG birnessite generally exhibited somewhat greater adsorption than the AR birnessite, as would be expected given the 60% greater BET surface area of the SG birnessite. The much slower Se(VI) production observed with the SG birnessite, and the slowing of the rate during the experiments, likely results from differences in its oxidation state. AR-birnessite is known to be a stronger and faster oxidant due to higher concentrations of active Mn(III) present in its structure (Qiu et al., 2011). The difference in oxidation rate, and possible difference in kinetic mechanism between the AR and SG birnessite are helpful in our study: We expect that the structure of birnessite varies in nature, and therefore, determining the effects of some of this variation on the Se isotopic fractionation increases the applicability of the results.
The strong adsorption of Se(IV) in the first hours of all our experiments is consistent with the literature on Se(IV) adsorption (Balistrieri and Chao, 1990; Peak and Sparks, 2002; Catalano et al., 2006). Differences in Se(IV) adsorption between the two forms of birnessite can be explained by differences in average oxidation state (Wang et al., 2012); sorption is expected to be greater for SG birnessite with a higher AOS (3.45). Wang et al. (2012) found that a decrease in AOS indicated the presence of Mn(III) in inter-layer sites, which limits the sorption sites available for Se(IV) to only edge sites.
Adsorption of Se(VI) cannot be determined directly from our data. However, adsorption of Se(VI) onto oxide surfaces is known to be much weaker than that of Se(IV), and Balistrieri and Chao (1990) found no detectable adsorption of Se(VI) in an experiment at pH 5.0 with 0.3 g/L vernadite (Mn4+,Fe3+,Ca,Na)(O,OH)2 · nH2O) , and at pH = 4.2 with 0.03 g/L vernadite, in 0.1 M KCl solutions. They attributed this to the negative surface charge of vernadite. The results should apply to birnessite, which is nearly identical in its structure and characteristics. However, the lower chloride concentration (1 mM) in our experiments could allow for more Se(VI) adsorption owing to the lesser competition for surface sites. Also, the presence of a small amount of cryptomelane, which is positively charged at pH 4 and 5.5 (Lu et al., 2007), could have caused some adsorption of selenate in our experiments. Assuming selenate adsorption onto cryptomelane is similar to that onto iron oxides and hydroxides (Peak and Sparks, 2002), the adsorption would be stronger at pH 4 than at pH 5.5. Overall, we assume that some adsorption of selenate occurred in our experiments, but Se(VI) adsorption was much weaker than that of Se(IV) and thus most of the Se(VI) generated by oxidation was released quickly into solution.
The increasing Mn concentrations in the pH 4 experiments probably reflects production of soluble Mn(II) by reduction of Mn(III, IV) as it oxidized Se(IV), combined with some degree of proton-induced dissolution that would be confirmed by blank experiments with no Se(IV). Assuming the dissolved Mn is truly Mn(II) which was originally present as Mn(IV), one Mn(II) should be produced for each Se(VI) produced. In the pH 4 experiments, aqueous Mn concentrations were greater than or equal to the aqueous Se(VI) concentrations. In the pH 4 SG birnessite experiments, aqueous Mn/aqueous Se(VI) ratios in the later stages of the lower and higher birnessite mass experiments, were roughly 6 and 25 respectively. Higher Mn(II) concentrations at pH 4 could be explained by the slow dissolution of birnessite due to the protonation of the metal oxide surface (pKsp = 15.62) (Banerjee & Nesbitt, 2000; Nordstrom & Kirk, 2001). Mn(III), produced by the dissolution of birnessite in solution, disproportionates to form Mn(II) and Mn(IV) (insoluble), which could explain the apparent presence of Mn(II) in excess of the amount needed to generate the observed Se(VI) concentrations. For AR-birnessite experiments, the aqueous Mn concentrations indicate that approximately 1% of the birnessite, by mass, dissolved, whereas for SG experiments it was 2%. However, it is clear that Se(IV) oxidation occurred and the experiments yield a clear and consistent quantification of Se isotope fractionation.
In the pH 5.5 experiments, aqueous Mn concentrations remained very low (<1 μM) at all times. This stark difference is probably caused by adsorption of Mn(II). Birnessite has a low point zero charge (pzc), which ranges from 1 to 2 (Tripathy et al., 2001). As pH of the solution increases, the surface negative charge on the oxide surface increases and this would cause Mn(II) to be adsorbed more strongly at pH 5.5 than pH 4.0.
Isotopic Fractionation
The Se isotopic fractionation observed in our experiments results from mass-dependent kinetic isotope effects caused by changes in the local bonding environment of Se as it is transformed from Se(IV) to Se(VI). Tan et al. (2020) have established that Se isotope exchange between aqueous Se(IV) and Se(VI) is extremely slow; isotopic equilibrium is achieved only after 1000s of years. This fact, combined with the fact that our experiments do not approach chemical equilibrium, requires that the observed Se isotope fractionation is rationalized using a kinetic framework. In the simplest case, kinetic isotope effects arise from the fact that bonds involving lighter isotopes have higher zero-point energies than those involving heavier isotopes (Schauble, 2004). Consequently, bonds involving lighter isotopes are more easily broken, and in a single-step reaction with no back reaction, lighter isotopes react at a faster rate.
However, Se(IV) oxidation by birnessite is not a simple, single-step reaction. The overall chemical reaction consists of a chain of multiple steps, with ephemeral intermediate products and potential back-reaction across some steps. According to Scott and Morgan (1996), the first step involves the formation of a surface complex between the Se(IV) and Mn(IV) on the oxide surface. The rate limiting step is the transfer of electrons from Se(IV) to Mn(IV), resulting in the formation of Mn(II) and Se(VI), followed by desorption of the surface-bound oxidized anion and reduced metal ion. According to kinetic isotopic fractionation theory, the fractionation produced by the overall reaction depends not only on the fractionation induced by each reaction step, but also on the kinetic characteristics of that step and the others in the chain (Rees, 1973; Schauble, 2004). Despite the net forward direction of the reaction, rapid back-reaction at one or more individual steps may occur. This promotes an approach to isotopic equilibrium between the product and reactant of any such step. Accordingly, each step may impart a characteristic kinetic isotope effect if it is a dominantly forward-reacting step or, at the other extreme, equilibrium isotope fractionation between the reactant and product.
The concept of a “rate-limiting step” from kinetic theory (Atkins.and de Paula, 2008) is crucial here: the step with the least favorable kinetics (i.e., the greatest activation energy) is the reaction “bottleneck,” and Se atoms that progress beyond this step have very little chance of back-reacting across it. As a result, isotopic fractionation occurring in subsequent steps can have no effect on the isotopic fractionation of the overall reaction; this is because all the Se reaching those steps proceeds to the end of the reaction chain. This leads to a general rule: the isotopic fractionation of the complete reaction is the sum of the fractionations for each step up to, and including, the rate limiting step, with later steps not contributing to the overall isotopic fractionation even if they induce large kinetic isotope effects. This rule and more complex models of reaction chains have been applied to S and C isotope fractionation for many years (Rees, 1973; Canfield, 2001; Hayes, 2001; Brunner and Bernasconi, 2005; Johnston et al., 2007; Bradley et al., 2016).
In the specific case of Se(IV) oxidation by birnessite, steps involving electron transfers and coordination changes have the potential to fractionate Se isotopes strongly, due to the large changes in the chemical bonds. In these steps, the products involve Se in a higher valence and/or with shorter, stiffer bonds. If the steps are close to equilibrium, or have rapid back-reaction, then their products will tend to be enriched in heavier isotopes relative to their reactants. On the other hand, it is also possible that simple kinetic isotope effects, with lighter isotopes reacting faster than heavier ones, may be generated by one or more reactions steps in the chain. Thus, kinetic fractionation theory allows the product for the overall reaction to be either isotopically lighter or heavy.
The negative δ82/76Se shift observed in our experiments suggests that the major bonding changes involved in the oxidation reaction do not dominate the kinetic isotope fractionation of the overall reaction. Se(VI)-Se(IV) redox reactions have the potential to induce δ82/76Se shifts of several per mil (Johnson and Bullen, 2004; Li and Liu, 2011). The electron transfer and coordination change steps may induce large fractionations when their effects are manifested, but for an oxidation reaction, the product should be isotopically heavy. In the present study, the product was isotopically light and the magnitude was relatively small, suggesting that the rate-limiting step was prior to the electron transfer and coordination change steps. One possible contributor to the observed fractionation is the Se(IV) adsorption step. Xu et al. (2020) reported that, at pH 5, adsorption of Se(IV) onto Fe oxides and β-MnO2 (pyrolusite) resulted in an equilibrium fractionation of −0.9 to −1.2‰ (adsorbed Se(IV) was enriched in lighter isotopes) that was approached within several hours. In our experiments, the time scale for Se(IV) oxidation was long, and thus adsorbed Se(IV) was likely close to isotopic equilibrium with aqueous Se(IV) and may have been shifted toward lower δ82/76Se. This step could have provided some of the δ82/76Se shift observed for the overall Se(IV) oxidation reaction. The Xu et al. (2020) results do not apply directly to our experiments, as β-MnO2 differs from birnessite, but the Se(IV) adsorption step is likely a partial driver of the observed δ82/76Se shift.
As is common in studies of kinetic isotope effects, we lack detailed knowledge regarding the reaction mechanism and the rate-limiting step; it is therefore difficult to rationalize fully the direction and magnitude of the observed Se isotope fractionation. Furthermore, it is difficult to predict how much the Se isotope fractionation may vary across the range of conditions under which we may wish to apply these results. It is possible that the conditions in some natural settings (e.g., pH, aqueous matrix, and characteristics of the birnessite) could change the rate-limiting step of the reaction or otherwise alter the kinetics in a way that would change the isotopic fractionation significantly. Further experiments over a wider range of solution compositions, birnessite composition and structure, and pH would be helpful in this regard. Experiments with birnessite-bearing natural soils and field-collected waters might also be helpful. However, the fact that our results did not differ between two forms of birnessite with strongly contrasting Se(IV) oxidation kinetics, and also did not differ from pH 4 to pH 5.5, suggests that the Se isotopic fractionation is controlled by some invariant reaction characteristics that may apply to a wide range of conditions.
A previous study determined the Se isotope fractionation induced by a different Se(IV) oxidation mechanism. Johnson and, Bullen, (2004) oxidized Se(IV) with H2O2 in a 0.8 M NaOH solution and found no detectable Se isotope fractionation at the 0.2‰ level. This reaction is clearly not relevant in natural settings, and it is not surprising that the isotopic fractionation differed from that observed in our experiments, given the very different chemical reaction involved.
Environmental Implications
Selenium isotope fractionation induced by reduction of Se(VI) to Se(IV) has been studied well, as it is helpful to develop Se isotopes as indicators of Se immobilization via reduction. However, in many Se-contaminated settings, modern weathering settings, or in ancient settings relevant to paleoredox studies, Se(IV) oxidation may be the dominant process, or both oxidation and reduction may occur in a single setting. At weathering conditions, oxidation of solid, Se-bearing phases such as sulphide minerals and organic matter, without any back-reduction, should tend to produce Se that is isotopically similar to the solid phases. This is because of fundamental mass-balance considerations related to the fact that weathering reactions can only access Se atoms available on surfaces, and each successive layer of solid must be removed before the next layer can be exposed (Wang et al., 2015). According to the results of the present study, the released Se(IV) could be partially oxidized to produce isotopically light Se(VI). Since Se(VI) is highly mobile, whereas Se(IV) is likely to adsorb onto solid surfaces, Se mobilized by weathering may be isotopically light. However, if partial reduction of aqueous Se(VI) or Se(IV) occurred, it would tend to drive those species toward isotopically heavy compositions (Wasserman et al., 2021). Overall, the isotopic fractionation observed in this study provides an improved understanding of Se isotope dynamics in weathering systems.
In some systems, redox cycling of Se may occur in response to seasonal changes (e.g., wet season anoxia in soils and/or aquifers) or the presence of both oxidizing and reducing zones. Schilling et al. (2015) generated δ82/76Se data for soils, sequential extracts of soils, and irrigation water in a Se-contaminated field site in the Punjab, India. A clear pattern was observed, whereby deeper soils had lower δ82/76Se values relative to those of the top 10 cm. This suggests that mobile Se(VI) transported downward from the Se-rich upper soils was isotopically light, which in turn could occur only as a result of some process involving Se isotope fractionation as immobile Se was oxidized to form Se(VI). The authors suggested that Se(IV) oxidation was a likely driver of this pattern. The results of the present study support this interpretation.
More broadly, we assert that our improved knowledge of Se isotope shifts expected in the many groundwater and soil systems that contain coexisting Se(IV) and birnessite aids in the use of δ82/76Se data as a powerful complement to the more commonly used Se concentration data. Redox cycling of Se is complex and it is often difficult to untangle coupled redox and transport processes. δ82/76Se measurements provide more direct indicators of redox reaction, as compared to concentration data, and improve insights into these complex systems. The present study provides an important parameter need to interpret those data, in modern systems as well as in rocks used to infer redox conditions in ancient environments.
Data Availability Statement
The original contributions presented in the study are included in the article/Supplementary Material, further inquiries can be directed to the corresponding author.
Author Contributions
PD, KS, NW, TJ, and CP contributed equally to the final version of the manuscript.
Conflict of Interest
The authors declare that the research was conducted in the absence of any commercial or financial relationships that could be construed as a potential conflict of interest.
Publisher’s Note
All claims expressed in this article are solely those of the authors and do not necessarily represent those of their affiliated organizations, or those of the publisher, the editors and the reviewers. Any product that may be evaluated in this article, or claim that may be made by its manufacturer, is not guaranteed or endorsed by the publisher.
Acknowledgments
This material is based upon work supported by the National Science Foundation (NSF) under EAR 15-29830. The authors thank Tim Teague at the Department of Earth and Planetary Science (UC Berkeley) for use of the Zeiss EVO-10 Variable Vacuum SEM.
References
Atkins, P. W., and de Paula, J. (2008). Physical Chemistry. Encycl. Earth Sci. Ser. 555, 10642. doi:10.5005/jp/books/10642_2
Balistrieri, L. S., and Chao, T. T. (1990). Adsorption of Selenium by Amorphous Iron Oxyhydroxide and Manganese Dioxide. Geochimica Cosmochimica Acta 54 (3), 739–751. doi:10.1016/0016-7037(90)90369-V
Birkner, N., and Navrotsky, A. (2017). Thermodynamics of Manganese Oxides: Sodium, Potassium, and Calcium Birnessite and Cryptomelane. Proc. Natl. Acad. Sci. U.S.A. 114 (7), E1046–E1053. doi:10.1073/pnas.1620427114
Birnessite Mineral Data (2019). Available at: http://www.webmineral.com/data/Birnessite.shtml#.XeB3t-hKi00 (Accessed at September 5, 2021)
Bradley, A. S., Leavitt, W. D., Schmidt, M., Knoll, A. H., Girguis, P. R., and Johnston, D. T. (2016). Patterns of Sulfur Isotope Fractionation during Microbial Sulfate Reduction. Geobiology 14 (1), 91–101. doi:10.1111/gbi.12149
Brunauer, S., Emmett, P. H., and Teller, E. (1938). Adsorption of Gases in Multimolecular Layers. J. Am. Chem. Soc. 60 (2), 309–319. doi:10.1021/ja01269a023
Brunner, B., and Bernasconi, S. M. (2005). A Revised Isotope Fractionation Model for Dissimilatory Sulfate Reduction in Sulfate Reducing Bacteria. Geochimica Cosmochimica Acta 69 (20), 4759–4771. doi:10.1016/j.gca.2005.04.015
Canfield, D. E. (2001). Biogeochemistry of Sulfur Isotopes. Rev. Mineralogy Geochem. 43 (1), 607–636. doi:10.2138/gsrmg.43.1.607
Catalano, J. G., Zhang, Z., Fenter, P., and Bedzyk, M. J. (2006). Inner-sphere Adsorption Geometry of Se(IV) at the Hematite (100)-water Interface. J. Colloid Interface Sci. 297 (2), 665–671. doi:10.1016/j.jcis.2005.11.026
Cheney, M. A., Jose, R., Banerjee, A., Bhowmik, P. K., Qian, S., and Okoh, J. M. (2009). Synthesis and Characterization of Birnessite and Cryptomelane Nanostructures in Presence of Hoffmeister Anions. J. Nanomater. 2009, 1–8. doi:10.1155/2009/940462
Ching, S., Landrigan, J. A., Jorgensen, M. L., Duan, N., Suib, S. L., and O’Young, C. L. (1995). Sol-gel Synthesis of Birnessite from KMnO4 and Simple Sugars. Chem. Mat. 7 (9), 1604–1606. doi:10.1021/cm00057a003
Clark, S. K., and Johnson, T. M. (2010). Selenium Stable Isotope Investigation into Selenium Biogeochemical Cycling in a Lacustrine Environment: Sweitzer Lake, Colorado. J. Environ. Qual. 39 (6), 2200–2210. doi:10.2134/JEQ2009.0380
Crowther, D. L., Dillard, J. G., and Murray, J. W. (1983). The Mechanisms of Co(II) Oxidation on Synthetic Birnessite. Geochimica Cosmochimica Acta 47 (8), 1399–1403. doi:10.1016/0016-7037(83)90298-3
Downs, R. T., and Hall-Wallace, M. (2006). American Mineralogist Crystal Structure Database. Choice Rev. Online 43, 43Sup–0302. doi:10.5860/choice.43sup-0302
Essington, M. E. (2003). Soil and Water Chemistry. Boca Raton, Florida, United States: CRC Press. doi:10.1201/b12397
Fendorf, S. E. (1995). Surface Reactions of Chromium in Soils and Waters. Geoderma 67 (1–2), 55–71. doi:10.1016/0016-7061(94)00062-F
Feng, Q., Kanoh, H., and Ooi, K. (1999). Manganese Oxide Porous Crystals. J. Mat. Chem. 9, 319–333. doi:10.1039/a805369c
Fernández-Martínez, A., and Charlet, L. (2009). Selenium Environmental Cycling and Bioavailability: A Structural Chemist Point of View. Rev. Environ. Sci. Biotechnol. 8, 81–110. doi:10.1007/s11157-009-9145-3
Händel, M., Rennert, T., and Totsche, K. U. (2013). A Simple Method to Synthesize Birnessite at Ambient Pressure and Temperature. Geoderma 193-194, 117–121. doi:10.1016/j.geoderma.2012.09.002
Hayes, J. M. (2001). Fractionation of Carbon and Hydrogen Isotopes in Biosynthetic Processes. Rev. Mineralogy Geochem. 43 (1), 225–277. doi:10.2138/gsrmg.43.1.225
Johnson, T. M., and Bullen, T. D. (2004). Mass-dependent Fractionation of Selenium and Chromium Isotopes in Low-Temperature Environments. Rev. Mineralogy Geochem. 55 (1), 289–317. doi:10.2138/gsrmg.55.1.289
Johnson, T. M., Herbel, M. J., Bullen, T. D., and Zawislanski, P. T. (1999). Selenium Isotope Ratios as Indicators of Selenium Sources and Oxyanion Reduction. Geochimica Cosmochimica Acta 63 (18), 2775–2783. doi:10.1016/S0016-7037(99)00279-3
Johnston, D. T., Farquhar, J., and Canfield, D. E. (2007). Sulfur Isotope Insights into Microbial Sulfate Reduction: When Microbes Meet Models. Geochimica Cosmochimica Acta 71 (16), 3929–3947. doi:10.1016/j.gca.2007.05.008
Kausch, M., Ng, P., Ha, J., and Pallud, C. (2012). Soil-Aggregate-Scale Heterogeneity in Microbial Selenium Reduction. Vadose Zone J. 11 (2), 101–112. doi:10.2136/vzj2011.0101
Kipp, M. A., Algeo, T. J., Stüeken, E. E., and Buick, R. (2020). Basinal Hydrographic and Redox Controls on Selenium Enrichment and Isotopic Composition in Paleozoic Black Shales. Geochimica Cosmochimica Acta 287, 229–250. doi:10.1016/j.gca.2019.12.016
Kipp, M. A., Stüeken, E. E., Bekker, A., and Buick, R. (2017).Selenium Isotopes Record Extensive Marine Suboxia during the Great Oxidation Event. Proc. Natl. Acad. Sci. U.S.A., 114 (5), 875–880. doi:10.1073/PNAS.1615867114/SUPPL_FILE/PNAS.1615867114.SD01
Lafferty, B. J., Ginder-Vogel, M., and Sparks, D. L. (2010). Arsenite Oxidation by a Poorly Crystalline Manganese-Oxide 1. Stirred-Flow Experiments. Environ. Sci. Technol. 44 (22), 8460–8466. doi:10.1021/es102013p
Li, X., and Liu, Y. (2011). Equilibrium Se Isotope Fractionation Parameters: A First-Principles Study. Earth Planet. Sci. Lett. 304 (1–2), 113–120. doi:10.1016/j.epsl.2011.01.022
Ling, F. T., Post, J. E., Heaney, P. J., Kubicki, J. D., and Santelli, C. M. (2017). Fourier-transform Infrared Spectroscopy (FTIR) Analysis of Triclinic and Hexagonal Birnessites. Spectrochimica Acta Part A Mol. Biomol. Spectrosc. 178, 32–46. doi:10.1016/j.saa.2017.01.032
Lu, A., Gao, X., Wang, C., Gao, Y., Zheng, D., Chen, T., et al. (2007). Natural Cryptomelane and its Potential Application in the Adsorption of Heavy Metal Cadmium. J. Mineralogical Petrological Sci. 102 (4), 217–225. doi:10.2465/jmps.060412
Manning, B. A., Fendorf, S. E., Bostick, B., and Suarez, D. L. (2002). Arsenic(III) Oxidation and Arsenic(V) Adsorption Reactions on Synthetic Birnessite. Environ. Sci. Technol. 36 (5), 976–981. doi:10.1021/es0110170
McKenzie, R. M. (1971). The Synthesis of Birnessite, Cryptomelane, and Some Other Oxides and Hydroxides of Manganese. Mineral. Mag. 38, 493–502. doi:10.1180/minmag.1971.038.296.12
Mitchell, K., Mansoor, S. Z., Mason, P. R. D., Johnson, T. M., and Van Cappellen, P. (2016). Geological Evolution of the Marine Selenium Cycle: Insights from the Bulk Shale δ82/76Se Record and Isotope Mass Balance Modeling. Earth Planet. Sci. Lett. 441, 178–187. doi:10.1016/J.EPSL.2016.02.030
Mitchell, K., Mason, P. R. D., Van Cappellen, P., Johnson, T. M., Gill, B. C., Owens, J. D., et al. (2012). Selenium as Paleo-Oceanographic Proxy: A First Assessment. Geochimica Cosmochimica Acta 89, 302–317. doi:10.1016/J.GCA.2012.03.038
Murray, J.W., Balistrieri, L.S., and Paul, B. (1984). The oxidation state of manganese in marine sediments and ferromanganese nodules. Geochimica et Cosmochimica Acta. 48, 1237–1247.
Ohlendorf, H. M., Hothem, R. L., Bunck, C. M., and Marois, K. C. (1990). Bioaccumulation of Selenium in Birds at Kesterson Reservoir, California. Arch. Environ. Contam. Toxicol. 19, 495–507. doi:10.1007/BF01059067
Peak, D., and Sparks, D. L. (2002). Mechanisms of Selenate Adsorption on Iron Oxides and Hydroxides. Environ. Sci. Technol. 36 (7), 1460–1466. doi:10.1021/es0156643
Post, J. E., and Veblen, D. R. (1990). Crystal Structure Determinations of Synthetic Sodium, Magnesium, and Potassium Birnessite Using TEM and the Rietveld Method. Am. Mineralogist 75, 477
Post, J. E. (1999). Manganese Oxide Minerals: Crystal Structures and Economic and Environmental Significance. Proc. Natl. Acad. Sci. U.S.A. 96 (7), 3447–3454. doi:10.1073/pnas.96.7.3447
Post, J. E., Von Dreele, R. B., and Buseck, P. R. (1982). Symmetry and Cation Displacements in Hollandites: Structure Refinements of Hollandite, Cryptomelane and Priderite. Acta Crystallogr. Sect. B 38 (4), 1056–1065. doi:10.1107/s0567740882004968
Potter, R. M., and Rossman, G. R. (1979). The Tetravalent Manganese Oxides: Identification, Hydration, and Structural Relationships by Infrared Spectroscopy. Am. Mineralogist 64, 1199
Power, L. E., Arai, Y., and Sparks, D. L. (2005). Zinc Adsorption Effects on Arsenite Oxidation Kinetics at the Birnessite−Water Interface. Environ. Sci. Technol. 39 (1), 181–187. doi:10.1021/es049922i
Qiu, G., Li, Q., Yu, Y., Feng, X., Tan, W., and Liu, F. (2011). Oxidation Behavior and Kinetics of Sulfide by Synthesized Manganese Oxide Minerals. J. Soils Sediments 11 (8), 1323–1333. doi:10.1007/s11368-011-0381-0
Rees, C. E. (1973). A Steady-State Model for Sulphur Isotope Fractionation in Bacterial Reduction Processes. Geochimica Cosmochimica Acta 37 (5), 1141–1162. doi:10.1016/0016-7037(73)90052-5
Schauble, E. A. (2004). Applying Stable Isotope Fractionation Theory to New Systems. Rev. Mineralogy Geochem. 55 (1), 65–111. doi:10.2138/GSRMG.55.1.65
Schilling, K., Basu, A., Wanner, C., Sanford, R. A., Pallud, C., Johnson, T. M., et al. (2020). Mass-dependent Selenium Isotopic Fractionation during Microbial Reduction of Seleno-Oxyanions by Phylogenetically Diverse Bacteria. Geochimica Cosmochimica Acta 276, 274–288. doi:10.1016/j.gca.2020.02.036
Schilling, K., Johnson, T. M., Dhillon, K. S., and Mason, P. R. D. (2015). Fate of Selenium in Soils at a Seleniferous Site Recorded by High Precision Se Isotope Measurements. Environ. Sci. Technol. 49 (16), 9690–9698. doi:10.1021/ACS.EST.5B00477/SUPPL_FILE/ES5B00477_SI_001.PDF
Schilling, K., Johnson, T. M., and Wilcke, W. (2011). Isotope Fractionation of Selenium during Fungal Biomethylation by Alternaria Alternata. Environ. Sci. Technol. 45 (7), 2670–2676. doi:10.1021/es102926p
Schirmer, T., Koschinsky, A., and Bau, M. (2014). The Ratio of Tellurium and Selenium in Geological Material as a Possible Paleo-Redox Proxy. Chem. Geol. 376, 44–51. doi:10.1016/j.chemgeo.2014.03.005
Schuler, C. A., Anthony, R. G., and Ohlendorf, H. M. (1990). Selenium in Wetlands and Waterfowl Foods at Kesterson Reservoir, California, 1984. Arch. Environ. Contam. Toxicol. 19 (6), 845–853. doi:10.1007/BF01055049
Scott, M. J., and Morgan, J. J. (1995). Reactions at Oxide Surfaces. 1. Oxidation of As(III) by Synthetic Birnessite. Environ. Sci. Technol. 29 (8), 1898–1905. doi:10.1021/es00008a006
Scott, M. J., and Morgan, J. J. (1996). Reactions at Oxide Surfaces. 2. Oxidation of Se(IV) by Synthetic Birnessite. Environ. Sci. Technol. 30 (6), 1990–1996. doi:10.1021/es950741d
Shrimpton, H. K., Blowes, D. W., and Ptacek, C. J. (2015).Fractionation of Selenium during Selenate Reduction by Granular Zerovalent Iron. Environ. Sci. Technol., 49(19), 11688–11696. doi:10.1021/ACS.EST.5B01074/SUPPL_FILE/ES5B01074_SI_001
Stüeken, E. E., and Kipp, M. A. (2020). Selenium Isotope Paleobiogeochemistry. United Kingdom: Cambridge. doi:10.1017/9781108782203
Tebo, B. M., Bargar, J. R., Clement, B. G., Dick, G. J., Murray, K. J., Parker, D., et al. (2004). Biogenic Manganese Oxides: Properties and Mechanisms of Formation. Annu. Rev. Earth Planet. Sci. 32 (1), 287–328. doi:10.1146/annurev.earth.32.101802.120213
Tripathy, S. S., Kanungo, S. B., and Mishra, S. K. (2001). The Electrical Double Layer at Hydrous Manganese Dioxide/Electrolyte Interface. J. Colloid Interface Sci. 241 (1), 112–119. doi:10.1006/JCIS.2001.7722
Vicat, J., Fanchon, E., Strobel, P., and Tran Qui, D. (1986). The Structure of K1.33Mn8O16 and Cation Ordering in Hollandite-type Structures. Acta Crystallogr. Sect. B 42 (2), 162–167. doi:10.1107/S0108768186098415
Villalobos, M., Escobar-Quiroz, I. N., and Salazar-Camacho, C. (2014). The Influence of Particle Size and Structure on the Sorption and Oxidation Behavior of Birnessite: I. Adsorption of As(V) and Oxidation of As(III). Geochimica Cosmochimica Acta 125, 564–581. doi:10.1016/j.gca.2013.10.029
Wang, X., Johnson, T. M., and Lundstrom, C. C. (2015). Low Temperature Equilibrium Isotope Fractionation and Isotope Exchange Kinetics between U(IV) and U(VI). Geochimica Cosmochimica Acta 158, 262–275. doi:10.1016/J.GCA.2015.03.006
Wang, Y., Feng, X., Villalobos, M., Tan, W., and Liu, F. (2012). Sorption Behavior of Heavy Metals on Birnessite: Relationship with its Mn Average Oxidation State and Implications for Types of Sorption Sites. Chem. Geol. 292-293, 25–34. doi:10.1016/j.chemgeo.2011.11.001
Wang, Z., and Giammar, D. E. (2015). Metal Contaminant Oxidation Mediated by Manganese Redox Cycling in Subsurface Environment. ACS Symp. Ser. 1197, 29–50. doi:10.1021/bk-2015-1197.ch002
Wasserman, N. L., Schilling, K., Johnson, T. M., and Pallud, C. (2021). Selenium Isotope Shifts during the Oxidation of Selenide-Bearing Minerals. ACS Earth Space Chem. 5 (5), 1140–1149. doi:10.1021/ACSEARTHSPACECHEM.1C00036/SUPPL_FILE/SP1C00036_SI_001.PDF
Xu, W., Qin, H.-B., Zhu, J.-M., Johnson, T. M., Tan, D., Liu, C., et al. (2021). Selenium Isotope Fractionation during Adsorption onto Montmorillonite and Kaolinite. Appl. Clay Sci. 211, 106189. doi:10.1016/J.CLAY.2021.106189
Xu, W., Zhu, J.-M., Johnson, T. M., Wang, X., Lin, Z.-Q., Tan, D., et al. (2020). Selenium Isotope Fractionation during Adsorption by Fe, Mn and Al Oxides. Geochimica Cosmochimica Acta 272, 121–136. doi:10.1016/j.gca.2020.01.001
Zeng, H. (2009). Selenium as an Essential Micronutrient: Roles in Cell Cycle and Apoptosis. Molecules 14 (3), 1263–1278. doi:10.3390/molecules14031263
Zhu, J.-M., Johnson, T. M., Clark, S. K., and Zhu, X.-K. (2008). High Precision Measurement of Selenium Isotopic Composition by Hydride Generation Multiple Collector Inductively Coupled Plasma Mass Spectrometry with a 74Se-77Se Double Spike. Chin. J. Anal. Chem. 36 (10), 1385–1390. doi:10.1016/S1872-2040(08)60075-4
Keywords: isotope geochemistry, manganese oxides, Rayleigh fractionation, selenium oxidation, paleoredox
Citation: Dwivedi P, Schilling K, Wasserman N, Johnson TM and Pallud C (2022) Oxidation of Dissolved Tetravalent Selenium by Birnessite: Se Isotope Fractionation and the Effects of pH and Birnessite Structure. Front. Earth Sci. 10:909900. doi: 10.3389/feart.2022.909900
Received: 31 March 2022; Accepted: 30 May 2022;
Published: 06 July 2022.
Edited by:
Wang Zheng, Tianjin University, ChinaReviewed by:
Xinming Chen, Shanghai Jiao Tong University, ChinaEva Stüeken, University of St Andrews, United Kingdom
Copyright © 2022 Dwivedi, Schilling, Wasserman, Johnson and Pallud. This is an open-access article distributed under the terms of the Creative Commons Attribution License (CC BY). The use, distribution or reproduction in other forums is permitted, provided the original author(s) and the copyright owner(s) are credited and that the original publication in this journal is cited, in accordance with accepted academic practice. No use, distribution or reproduction is permitted which does not comply with these terms.
*Correspondence: Pranjal Dwivedi, cHJhbmphbF9kd2l2ZWRpQGJlcmtlbGV5LmVkdQ==