 Tianlong Wang
 Congxin Chen1,2
 Kaizong Xia
94% of researchers rate our articles as excellent or good
Learn more about the work of our research integrity team to safeguard the quality of each article we publish.
Find out more
ORIGINAL RESEARCH article
Front. Earth Sci., 10 May 2022
Sec. Geohazards and Georisks
Volume 10 - 2022 | https://doi.org/10.3389/feart.2022.909466
This article is part of the Research TopicGeological Disasters in Deep Engineering Mechanism, Warning and Risk mitigationView all 39 articles
When sublevel caving is used in metal mines, the stress state in the rock mass that initially existed around the mined-out area will be destroyed. This will lead to the rock strata deforming and moving and also, potentially, to large-scale collapse and cracking of the ground surface. Such ground surface deformation can cause significant damage to buildings and other structures. Therefore, it is very important to study the mechanism responsible for this ground surface deformation so that methods can be devised to protect the mine’s production facilities as well as the property and safety of nearby residents. In this study, the mechanism responsible for the surface deformation of the hanging wall in the eastern part of the Jinshandian iron mine was investigated by analyzing monitoring data collected in situ on the surface (from 2008 to 2020) and other related information (occurrence of surface cracking and collapse and geological conditions). The results show that the ground surface deformation can be divided into four stages (initial, creep, slow, and accelerating deformation stages). A flexural toppling failure model is proposed to account for the surface deformation. The model suggests that large-scale deformation of the ground surface at the hanging wall occurs due to the combined effect of in situ ground stress, occurrence of steep dip discontinuities and faults, the dips and strikes of the two parallel orebodies, and underground mining activity. Furthermore, the surface deformation can be divided into six regions corresponding to caved, rapidly-accelerating deformation, slowly-accelerating deformation, acceptable deformation, slight deformation, and no deformation zones. In the rapidly-accelerating deformation zone, the ratio of the horizontal to vertical displacement is greater than 1 and some major cracks can be found. Large-scale cracks begin to form when the horizontal velocity of the ground surface is greater than 1 mm/day.
In China, the number of open-pit mines is decreasing and more metal mining is taking place deep underground. Sublevel caving is one of the most widely used mining methods employed in such mines. However, as the orebodies are mined out using this method, the rock strata begin to deform and this deformation gradually spreads to the surface. On reaching the surface, the deformation may cause a significant amount of damage to the buildings and structures erected there. Therefore, the deformation not only affects the safety of the underground mining activity but also threatens the safety of the mine’s production facilities and the nearby residents. The geological disasters (ground surface collapse and cracking) often occur in the mining area, because of the deep underground mining activities. What is worse, sometimes rockburst is found in deep underground (Feng et al., 2015; Feng et al., 2020). Consequently, it is imperative that the mechanism driving the surface deformation induced by underground mining is understood in great detail. Much research has been carried out on surface deformation using a variety of approaches including theoretical analysis, physical modeling experiments, numerical simulation, and in situ monitoring.
Hoek (1974) used a limit equilibrium approach to analyze the failure of the rock masses in the hanging wall. Lupo (1996a) has carried a lot of research on metal mines and suggested that the ground surface deformation can be divided into three zones: a caved zone, large-scale surface cracking zone, and a continuous surface subsidence zone. Lupo (1996b) also pointed out that shear failure is the dominant failure mechanism in the footwall, while a combination of shear and toppling failure occurs in the hanging wall. Lupo (1997) subsequently introduced an analytical model that combines a limit equilibrium approach for the hanging wall and footwall with a Coulomb-type surface-traction force to represent the caved rock. Svartsjaern (2019) used conceptual models to refine calibrated models detailing the damage development process and failure mechanisms acting. Physical modeling experiments have been used to predict the ranges of collapse pits and figure out the mechanism responsible for surface collapse (Wu et al., 2009; Wang et al., 2019). Also, many scholars have used numerical simulation to study metal mines/tunnels. For example, codes PHASE2 (Villegas and Nordlund, 2008a; Blachowski and Ellefmo, 2012), FLAC3D (Parmar et al., 2019), PFC2D (Villegas and Nordlund, 2008b; Svartsjaern and Saiang, 2017), UDEC (Pinheiro et al., 2015; Svartsjaern et al., 2016), 3DEC (Wang et al., 2012) and FEM/DEM-DFN (Vyazmensky, 2008) have been used to study break and limit angles, ground surface subsidence, caved rock zone deformation, and failure mechanisms in discontinuous rock masses. Finite-difference continuum damage mechanics approach was used to study roof caving (Eremin et al., 2020).
Many scholars have also studied surface deformation by directly monitoring it in situ. For example, time–displacement, time–inverse velocity, and time–velocity curves were generated and used to analyze the ground surface deformation at the Kiirunavaara mine in Sweden at different mining stages (Villegas and Nordlund, 2012). Xia et al. (2016a), Xia et al. (2016b), Xia et al. (2019b) extensively studied the ground deformation, movement, and collapse mechanism at the Chengchao iron mine in China based on deformation data monitored in situ and field investigations. Studies centered on the Jinchuan Nickel Mine in China found that the horizontal displacement of the underground roadway was larger than its vertical displacement and that the maximum cumulative vertical displacement at the hanging wall surface was smaller than that at the footwall. In the mining area, almost all of the plane displacement vectors were found to point towards the mined-out area. Moreover, three failure mechanisms were suggested to be involved: double-sided embedded-beam deformation, fault activation, and cantilever-articulated rock beam failure (Ma et al., 2012; Ma et al., 2013; Zhao et al., 2013; Ma et al., 2015; Ding et al., 2018; Lu et al., 2018). Xia Y. et al. (2018) have also used a combination of techniques (D-InSAR and GIS) to identify the scope of illegal underground mines. LiDAR mapping and geological penetration radar (GPR) were used to analyze roof damage (Evanek et al., 2021; Li et al., 2021).
According to the scholar’s research, few of them study the mechanism of ground surface deformation, with consideration of geological condition (such as steeply dipping discontinuities and faults), especially the unique geological condition like Jinshandian Iron Mine. The geological conditions in the eastern part of the Jinshandian mine in China are complicated. There are discontinuities with steep dip angles, four faults distributed in the area with east–west strikes, and two orebodies that are essentially parallel. There are also a large number of buildings and structures on the surface in the hanging wall region. The surface first collapsed in 2008 near a private mining site (site no. 3) and a further surface collapse occurred in 2013. Since October 2016, the underground roadway has become damaged due to the ground pressure in the hanging wall which has also led to large-scale collapse and cracking, both underground and on the surface (Yang, 2019). The deformation of the surface has also resulted in buildings and other structures suffering from subsidence, becoming inclined and cracked. However, there is a lack of research on the characteristics of surface deformation and deformation mechanisms in metal mines with steeply dipping discontinuities and two parallel orebodies. In this study, the mechanism underpinning the surface deformation of the hanging wall is elucidated based on surface deformation data collected over a period of 13 years. The results can be used to help guide subsequent underground mining work and relocate residents on the surface in a safe and timely manner. The result can be a refence to the underground metal mines which have the similar engineering geology condition.
The Jinshandian iron mine is located near Jinshandian town, which is 30 km southwest of Huangshi in Hubei province, China. The eastern area is taken to lie between exploratory lines nos. 25 and 43. Its east–west extension corresponds to nearly 1,000 m and its north–south extension is 990 m. Mining started at the –270 m level (altitude, the sea level is 0). There are two main orebodies present (‘Fe I’ and ‘Fe II’) that are separated by a 50–150 m thick rock wall.
The lithographic forms most widely distributed in the eastern part of the Jinshandian iron mine are hornstone, marble, magmatic (mainly diorite), orebody, and fault (Figure 1). The hornstone (labeled A in Figure 2) can be subdivided according to its distance from the orebody. Type A1 hornstone (located far from the orebody) shows good quality, whereas type A2 hornstone (close to the orebody) has poor quality. Marble is labeled using the letter B, while the magmatic rocks are labeled C. The latter can also be subdivided into types C1 (rocks that are far away from the orebody and have good quality) and C2 (rocks that are close to the orebody and show poor quality). The orebodies (D) can also be divided into two types: D1 (block structure; good condition) and D2 (powdery structure; poor condition). In terms of rock mass quality, the lithography can be ranked from good to poor as follows: C1 > A1 ≥ C2 > A2 ≥ B > D1 > D2.
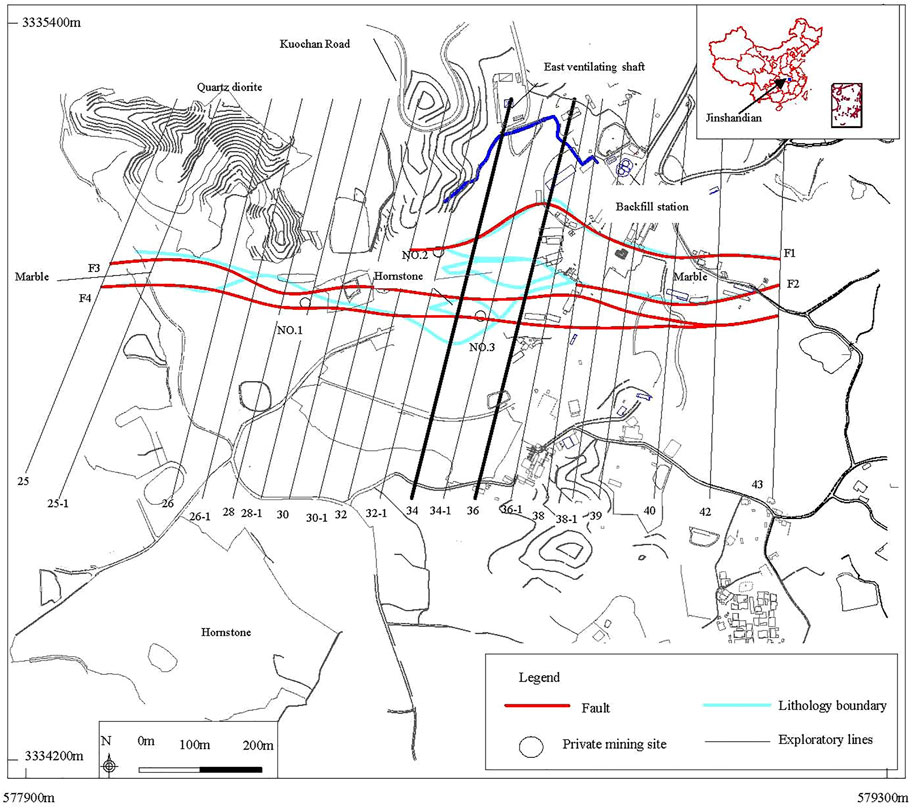
FIGURE 1. Lithology, faults, and private mining sites in the study area.
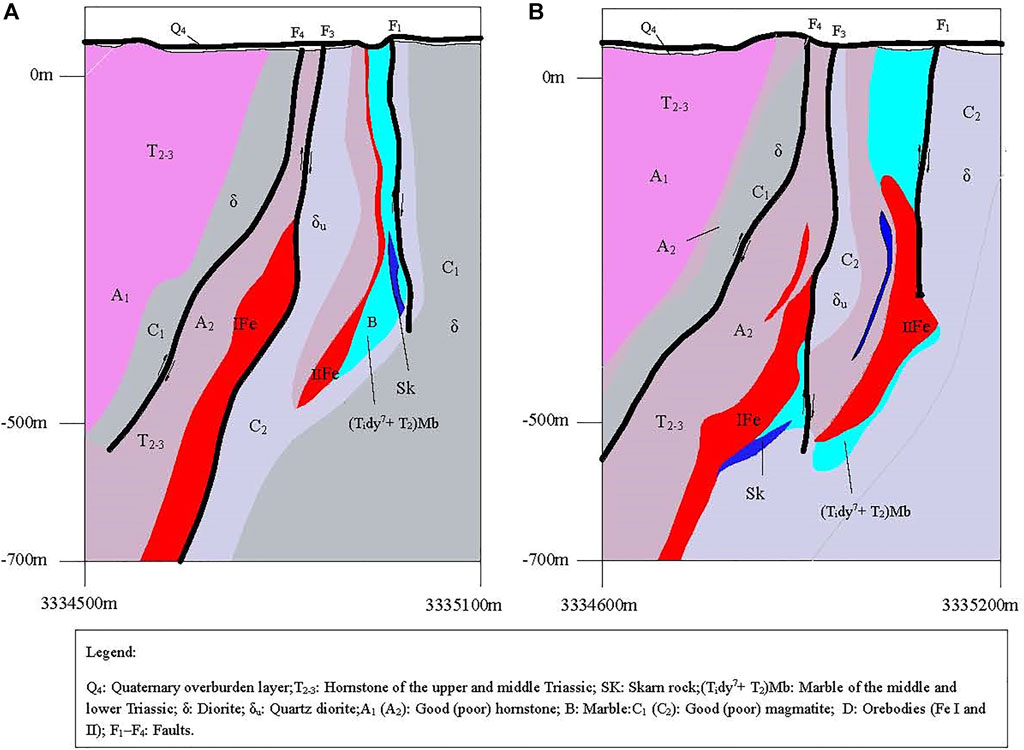
FIGURE 2. Geological sections along exploratory lines 34 and 36. (A) Exploratory line 34. (B) Exploratory line 36.
An in situ geological investigation was carried out on the ground surface and –340, –354, –368, –382, and –396 m levels in July 2018.
The discontinuities in the hanging wall were then classified. It can be seen that there are three main groups of dominating discontinuities in the hornstone (Table 1).
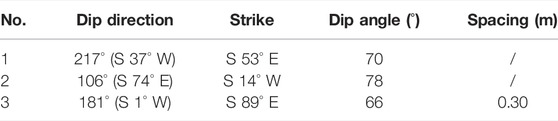
TABLE 1. Major discontinuities in the hanging wall.
The mining area is crossed by four parallel fault zones with east–west strikes in plane projection. In addition, the upper parts of the faults tend to be steeper than their lower parts when viewed in cross-section along exploratory lines (as shown in Figure 1). Some specific observations can also be made:
1) Fault F1 extends eastwards from exploratory line 32. It is about 1,500 m in length and 15–35 m wide. It has a dip direction that ranges from 160° to 200° and a dip angle of 60°–75°.
2) Fault F2 extends eastwards from exploratory line 38 and its length is about 1,200 m. Its dip direction ranges from 180° to 190° and its dip angle is 55°–85°.
3) Fault F3 lies between exploratory lines 25 and 43 with a width that ranges from 15 to 35 m. It dips to the south and has a dip angle that ranges from 55° to 87°.
4) Fault F4 is roughly parallel to F3 and runs 25–150 m to the south of it. It also dips to the south. Its dip angle is in the range from 55° to 85° and its width is 10–35 m. F3 and F4 coalesce near exploratory line 42, forming a 100-m wide fault zone on the surface.
The stress relief method, which is based on elastic mechanics theory, was used to measure the level of in situ ground stress. The rock mass is assumed to be an infinite elastic body. Any boreholes in the rock will thus be elastically deformed by the initial ground stress. Therefore, the stress state in the plane perpendicular to a borehole axis can be calculated by measuring the deformation (change in diameter) of the borehole during the stress relief process. Stress tests were carried out in situ in December 2019 in the –410 and –500 m levels. The results obtained are shown in Table 2.
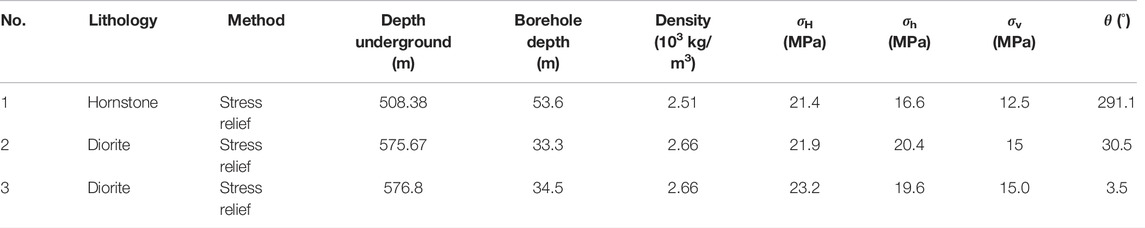
TABLE 2. In situ ground stress levels (December 2019). The principal stress is specified via three components: σH (maximum horizontal stress), σh (horizontal intermediate stress) and σv (minimum vertical stress). The angle θ is the angle between the horizontal principal stress and north direction.
There are two main orebodies (Fe I and Fe II) in the eastern part of the Jinshandian iron mine that are parallel to each other. Between Fe I and Fe II, there is a rock wall composed of hornstone and quartz diorite with a thickness of 50–150 m. Fe I is 1,320 m long from east to west (stretching from exploratory line 23 to exploratory line 43). Fe II has a length of about 1,020 m (stretching from exploratory line 26 to exploratory line 43). Fe II lies to the north of Fe I and the two orebodies are imbricated when viewed in cross-section.
In September 2005, the roof of the –270 m level began to cave. Orebody Fe I was mined from north to south, while orebody Fe II was mined from south to north. Due to relocation problems on the surface, mining work had to be suspended from early April 2009 to the end of February 2012. Mining resumed in early March 2012. Due to the COVID-19 pandemic, mining work had to be stopped on January 18, 2020; it subsequently resumed on March 21, 2020. See Table 3.
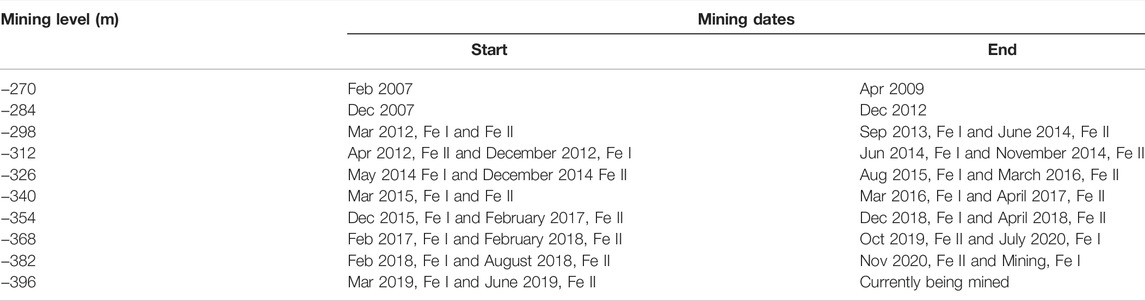
TABLE 3. Mining situation.
Mining work is now taking place in the –382 and –396 m levels. The partly situation with respect to mined-out areas is shown in Figure 3.
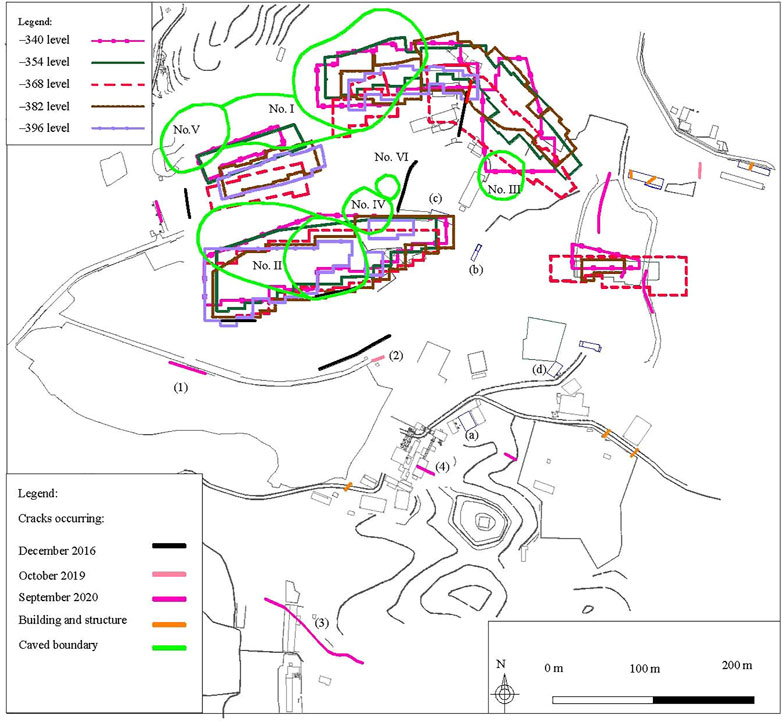
FIGURE 3. Planar projection of the collapse pits and cracks.
In addition, as parts of the orebodies were quite near the surface (some were even directly exposed on the surface), many private mining sites were set up. Among them, there are three main sites of interest (labeled site nos. 1, 2 and 3 in Figure 1). It is understood that the mining depth of these private mining sites is about –160 m and the amount of stoping ore involved is about 2 million tons. Much of the important information about the locations and shapes of the mined-out areas formed underground at these sites is unknown. However, the mining-out of these shallow orebodies was found to have a significant impact on the deformation of the surface, leading to collapse at several places near the private sites when the mining activity began.
In April 2007, the ground surface collapsed at the no. 2 private mining site near exploratory line 36 (collapse pit no. Ⅰ). The area affected measured ∼250 m2 and three nearby houses were cracked and deformed. In September 2008, a second collapse occurred near the no. 3 private site (in the courtyard of a food company) affecting an area of ∼620 m2 (collapse pit no. Ⅱ). The evolution of the surface collapse and cracking processes in this region is shown in Figure 3 and Figure 4.

FIGURE 4. Aerial photographs of the mined-out area (main image captured in May 2020).
In February and May 2013, the surfaces near collapse pits II and I collapsed again (respectively). Thereafter, the two collapsed areas continued to extend outwards in all directions. In November 2013, a new collapse pit with an area of ∼300 m2 appeared on the surface just south of collapse pit II which gradually merged into one collapse pit with pit no. II.
In April 2017, a collapse pit with a diameter about 6 m and depth of about 3 m appeared next to the railway between exploratory lines 38 and 38-1 (collapse pit no. Ⅲ). This pit was funnel-shaped and left part of the railway hanging in the air. Due to the scale of the collapse, the railway became severely deformed and was demolished after it was found to be unusable.
In April 2018, a larger funnel-shaped collapse pit (diameter ∼20 m) appeared between exploratory lines 34-1 and 36 (collapse pit no. IV). By June 2018, the collapse pit had expanded slightly and deepened, and there were also many cracks visible in the ground nearby.
In November 2018, another funnel-shaped collapse pit (collapse pit no. V) appeared 150 m west of collapse pit I between exploratory lines 30-1 and 32. The diameter of this pit was ∼18 m and its depth was ∼10 m.
In June 2019, a pit with a depth of ∼5 m and diameter ∼5 m (collapse pit no. Ⅵ) appeared to the east of collapse pit no. IV. In the same month, a large number of collapse pits formed to the east of collapse pit no. II. One particular collapse pit, referred to as a ‘pit-in-pit’, measured ∼10 m (diameter) by ∼7 m (depth).
By the beginning of 2007, the area of the ground affected by surface collapse and cracking had expanded in all directions as the mining activity proceeded. As a result, the buildings and structures on the surface had been seriously damaged. Aerial photographs of the mining area taken in 2020 (Figure 3) clearly show the pattern in the surface deformation and damage caused by the underground mining activity. The scope of the surface collapse was investigated via in situ field investigation, three-dimensional (3D) laser scanning, and aerial photography, giving the results shown in Figure 4.
It can be seen that four of the collapse pits lie above orebody Fe I (nos. Ⅱ–Ⅳ and Ⅵ). The current area of collapsed ground associated with these pits is ∼15,800 m2. The surface subsidence in the region was originally caused by the private mining sites which led to funnel-shaped collapse pits nos. I and II being formed near the nos. 2 and 3 private mines. As the underground mining commenced, the scope of the collapse continued to increase in extent. When the mining was suspended, the collapse of the pits continued to extend slowly due to the creep characteristics of the rock masses. Then, when the mining was restarted in March 2012, the collapsed area extended further still. After October 2016, the underground roadways in the hanging wall were destroyed by underground pressure (Yang, 2019) which led to large-scale deformation of the surface. From April 2017 to June 2019, the collapse of pits nos. Ⅲ, Ⅳ, Ⅴ, and Ⅵ occurred sequentially in that order. At present, the deformation of collapse pits nos. II, III, IV, and VI above orebody Fe Ⅰ continues to increase. The rock mass of roof was fractured which influenced by F4 and F3 fault, and steeply dipping discontinuities. After the roof collapsed, chimney caving emerged above the mined-out area. In effect, by June 2019, the caving of the deep rock mass propagated to the ground surface forming a large-scale area of deformation above the mined-out area.
An investigation of the surface cracking (from 2016 to 2020) and damage to buildings and structures (investigation made in December 2020) was made in the hanging wall (see Figure 3 for details). Due to the effect of the underground mining, a large number of cracks had appeared on the surface. Before 2016, there were clearly more cracks in the footwall than the hanging wall. Xia et al. (2019a) explained this by suggesting that the footwall rock mass had undergone slipping–toppling failure. After October 2016, the cracks in the hanging wall had gradually increased.
The cracks around the collapse pits are essentially parallel to their boundaries and have the same strike as orebody Fe I. The cracks that are far away from the collapse pits are essentially parallel to the strikes of the discontinuities. For example, cracks (1), (3), and (4) are consistent with the first group of discontinuities in Table 1 and crack (2) is consistent with the second group of discontinuities.
Due to the deformation and destruction of the ground surface in the hanging wall, the buildings and structures have become cracked and show signs of subsidence. The buildings close to the collapsed pits have become strongly inclined and subsided and the displacement in the vertical direction is greater than that in the horizontal direction—for example, (b) and (c). A certain distance from the collapse pits, cracking and horizontal movement can be seen to occur in buildings that have good integrity [for example, the building (a) in the concrete frame structure]. Other buildings with poor integrity have also cracked but the dip direction of these cracks deviate from those of the collapse pit, as shown by the (d) in Figure 3.
Affected by the steeply dipping discontinuities, cracks around the collapse pits are essentially parallel to the boundaries of the pits, while the cracks far away from the pits are consistent with the strikes of the discontinuities.
The horizontal and vertical deformation of the ground surface in the hanging wall region was studied based on the monitored GPS and level data. Some of the monitoring points used are shown in Figure 5.
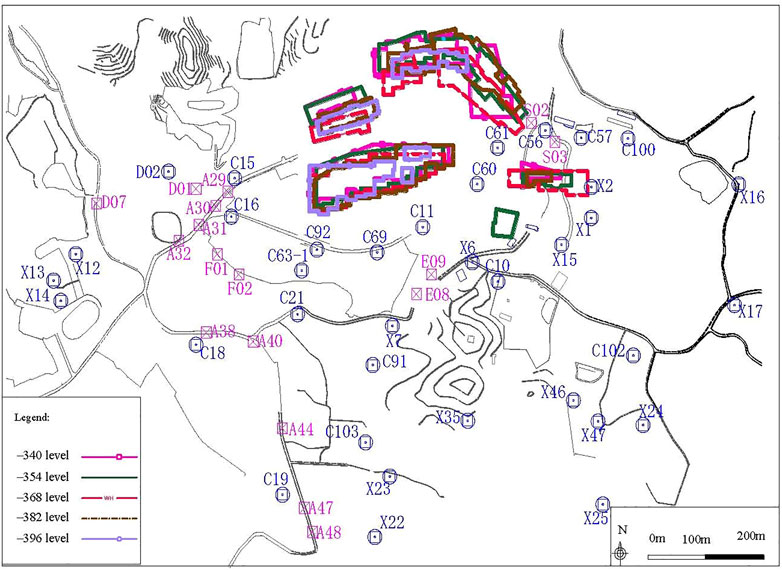
FIGURE 5. Locations of some of the GPS (in blue) and level (in magenta) monitoring points used.
A GPS technique was used to monitor the horizontal displacement. HiPer II and V receivers (manufactured by Topcon) and the Sheshan coordinate system were used. The radius of the ellipsoid used is 6,378,245 m, the reciprocal of curvature is 298.3, the central meridian is 114° E, and the offset value is 500,000 m. The 3D coordinates of the two reference points employed are G1 (3,335,533.049 m, 578,779.2745 m, 110.59958 m) and G2 (3,335,331.055 m, 579,266.8118 m, 47.42427 m). The position coordinates of the monitoring points can be calculated using the GPS receivers and two known reference points.
Two methods can be used to monitor the vertical displacement. One is based on GPS measurement. These measurements can be made simultaneously with the horizontal displacement measurements (using the same monitoring points). The other method involves level monitoring. In this work, Leica DNA03 digital levels were employed.
A number of monitoring points in the hanging wall were selected to determine the characteristics of the surface deformation (36 GPS and 18 level monitoring points). The monitoring data were then used to construct displacement–time and velocity–time curves. In addition, the data can be used to elucidate further deformation parameters at each monitoring point (cumulative horizontal and vertical displacements, ratio of horizontal to vertical displacement, and horizontal and vertical deformation velocities).
The horizontal displacement–time curves obtained at the various monitoring points present different deformation characteristics and can be divided into five types. The first type is generally found at points that lie close to the mined-out areas, e.g., points C10, C11, C15, C21, C56, C57, C60, C61, and C63-1. At these points, the displacement curves generally exhibited three inflection points which occurred around March 2009, February 2012, and October 2016 (Figure 6). At monitoring point C15, however, the third inflection point appeared to occur later, around October 2017. It shows that the deformation produced by the initial mining activity was quite small before March 2009. The surface deformation increased slowly thereafter due to the suspension of mining from April 2009 to February 2012. The deformation slowly increased from March 2012 onwards due to the resumption of the mining activity. Around October 2016, the deformation rate increased sharply. At point C15, however, the deformation increased only slowly after October 2017, and the cumulative horizontal displacement appeared to stabilize at around 63 cm now.
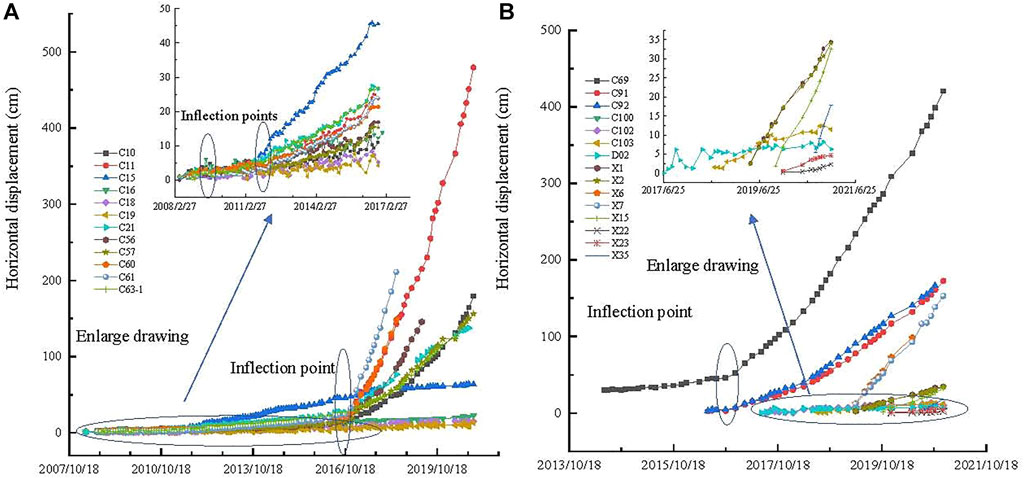
FIGURE 6. Horizontal displacement–time curves (A) With two and three inflection points. (B) With one inflection point.
The second type of displacement curve has just two inflection points—March 2009 and February 2012—as found at points C16, C18, and C19 for example (see Figure 6 for details). The third type of curve has just one inflection point which occurred around October 2016, e.g., points C69, C91, and C92. The fourth type of curve has no inflection points, the displacement generally increasing linearly in time, e.g., C100, C102, C103, D02, X1, X2, X6, X7, X15, X22, X23, and X35 (where the displacement of X1, X2, X6, X7, X15, and X35 appear to be larger and faster than the others). The fifth type of curve corresponds to data that undergoes small fluctuations, e.g., X12, X13, X14, X16, X17, X24, X25, X46, and X47.
In order to better understand the surface deformation data recorded at the monitoring points during different mining periods, the first type of deformation curve with three inflection points is divided into four stages: Period 1 (P1) from 2008/5/5 to 2009/3/23; Period 2 (P2) from 2009/3/23 to 2012/2/25; Period 3 (P3) from 2012/2/25 to 2016/10/18; and Period 4 (P4) from 2016/10/18 to 2020/12/22. These divisions are also used when considering other GPS and level monitoring points. The cumulative horizontal displacements (until December 2020) in the first three types of displacement curve lie in the ranges 62.96–479.5 cm, 13.89–22.72 cm, and 172.74–420.40 cm, respectively. Those in the last two types lie in the ranges 2.28–152.95 cm and 0.5–2.84 cm, respectively. The point that exhibited the largest horizontal displacement is C11 where the maximum displacement reaches 479.5 cm.
For a given monitoring point, the horizontal displacement gradually increased as the mining activity proceeded. Also, the deformation suffered over a given period of time gradually increases the closer the point is to the void boundary. Apart from the boundary points X14, X17, X24, and X25, the horizontal displacement vectors were measured at each GPS monitoring location points towards the mined-out areas. The main deformation seemed to occur after October 2016. For example, the horizontal deformation at C11 during P4 exceeded 450 cm, which is 19 times larger than the sum of P1, P2 and P3.
The vertical displacement–time curves presented here are based on the level monitoring data recorded. Two types of curves are found (Figure 7). The first type features 4 inflection points (around September 2008, May 2010, February 2012, and October 2016) as found at points A29, A30, F02, E08, E09, S02, and S03. In September 2008, collapse pit no. II was formed. There was a lot of rain from March to May 2010 but the vertical displacement changed very little around June 2010. The vertical displacements of the monitoring points range from –11.32 to –165.22 cm (the largest displacement occurring at S02).
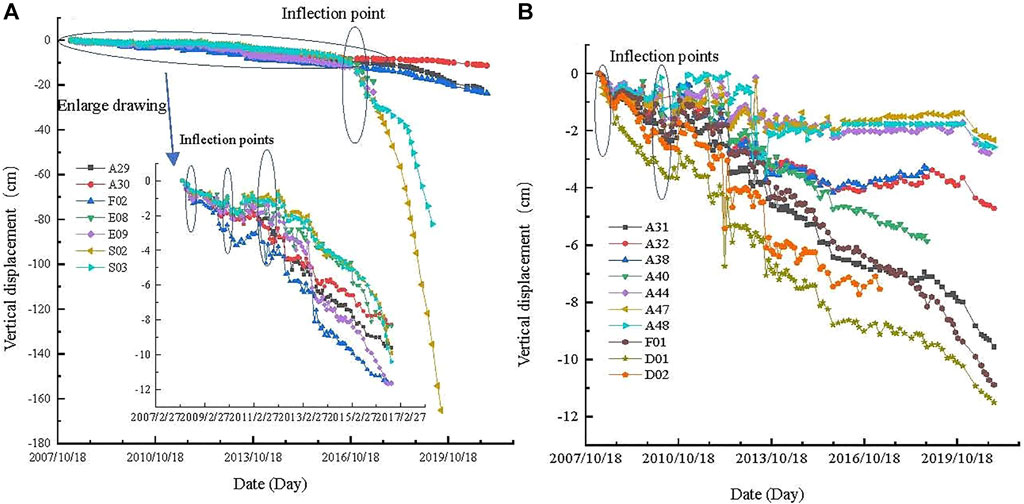
FIGURE 7. Vertical displacement–time curves (A) With four inflection points. (B) With two inflection points.
The data recorded at points A31, A32, A38, A40, A44, A47, A48, F01, D01, and D02, however, exhibit two inflection points (around September 2008 and May 2010) and the displacements (until December 2020) range from –1.47 to –11.5 cm.
As can be seen, some points (C10, C11, C56, C57, C60, C61, C63-1, C69, C91, C92, X6, and X7) experienced large vertical displacements (until December 2020) that range from –71.51 to –378.25 cm. Point C69 suffered the largest change (–315.74 cm) in P4, which is more than 5 times larger than P3. The vertical displacements (until December 2020) of points C15, C16, C18, C19, C21, C100, X1, X2, X13, X15, and X35 fall in the range –11.84 to –45.76 cm. In contrast, the vertical displacements measured at C102, C103, D02, X12, X14, X16, X17, X22, X23, X24, X25, X46, and X47 are rather small (between –0.4 and –8.92 cm). For a given monitoring point, the vertical displacement tends to increase as the mining activity becomes deeper. In addition, the closer the monitoring point is to the mined-out areas, the greater the deformation suffered over a certain period of time.
The influence that the mining activity has on the ground surface is also reflected in the rate at which the deformation of the ground surface changes. Therefore, the data were used to construct horizontal and vertical velocity–time curves, as shown in Figure 8 and Figure 9.
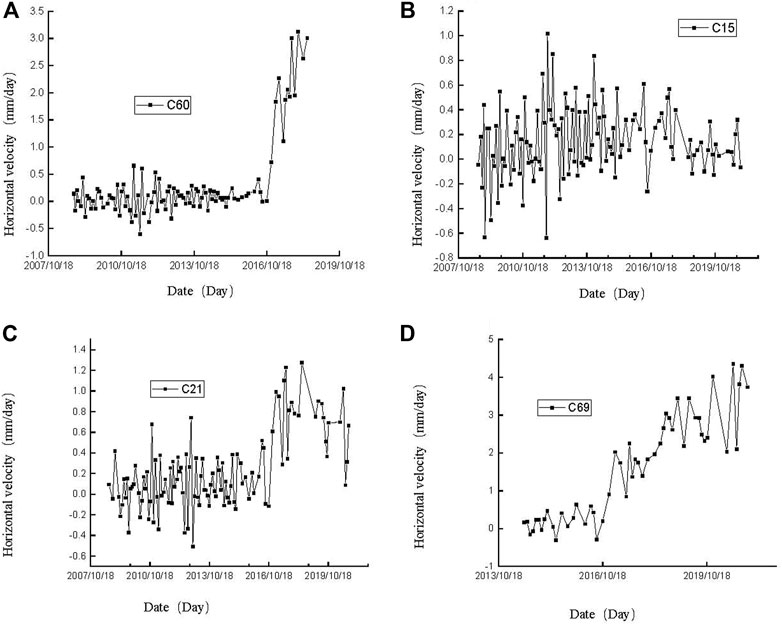
FIGURE 8. Horizontal velocity–time curves (A) C60; (B) C15; (C) C21; (D) C69.
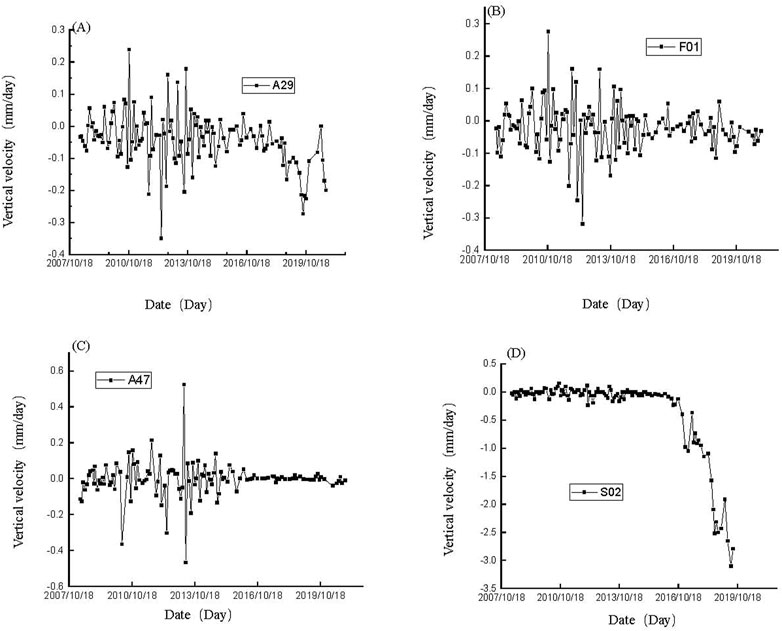
FIGURE 9. Vertical velocity–time curves (A) A29; (B) F01; (C) A47; (D) S02.
The horizontal velocity–time curves (constructed using the GPS monitoring data) illustrate the 6 kinds of horizontal velocity variation found in the area. The first type is exemplified by points such as C10, C11, C56, C57, C60, C61, and C63-1. Here, the horizontal velocity undergoes large fluctuations at first but the amplitudes of the fluctuations become smaller as times passes. After a while, the velocity increased rapidly in a linear manner (starting around October 2016). At C11, for example, the horizontal velocity had reached 9.5 mm/day by August 2019.
The second type of behavior was found at C15, C16, and C18. Here, the horizontal velocity fluctuated sharply at first but this fluctuation decreased in significance as time progresses. That is, the velocity–time curve constantly fluctuated but the amplitude of the fluctuation became relatively small after October 2016. The third type was observed at points such as C21. The curve fluctuated at first, then increased linearly around October 2016, and continued to fluctuate after April 2017.
The fourth type of horizontal velocity curve (e.g., C69, C91 and C92) fluctuates steadily at first and then more rapidly after October 2016. In the fifth type of curve (e.g., X1, X2, X6, X7, X15, X35, C100, C102, C103, D02, and D07) it was fairly linear. The behavior was established after October 2016 and fluctuated steadily at a certain velocity (although the velocities at points X6, X7, and X35 are higher than the others). The sixth type of curve involved constant fluctuation—C19 and other monitoring points were included in this type.
The horizontal velocities at points C10, C11, C56, C60, C61, C69, C91, C92, X6, X7, and X35 are all greater than 1 mm/day in the P4. In fact, the velocities in this interval fall in the range 1.10–3.07 mm/day. On the other hand, their velocities (except for X6, X7 and X35) in P3 lie in the range 0.05–0.54 mm/day. The velocities of points X1, X2, X15, C21, C57, and C63-1 range from 0.55 to 0.92 mm/day in the interval P4. The horizontal velocities at points C15, C16, C18, C19, D02, C100, C102, and C103 are all very small in P4 (ranging from 0.06 to 0.24 mm/day and increasing slowly). The horizontal velocities of the other monitoring points in P4 range from 0.02 to 0.21 mm/day. For the displacement-time curves with four stages, most of the horizontal velocities obey the following rule: P4 > P3 > P1 > P2.
Vertical velocity–time curves were also drawn using the level monitoring data. There were four kinds of types classified and summarized. At point A29, the vertical velocity fluctuates at first but an obvious change occurs around October 2016. Points A30, A31, A32, A38, A40, A44, F01, F02, D01, and D02 essentially appeared to be in a constant state of fluctuation. However, the amplitude of the fluctuations was large at first but then became smaller with a demarcation point around July 2014. Points A47 and A48 fluctuated at first and the amplitude of the fluctuation appeared to increase linearly. However, the velocity was basically zero after July 2014 implying that these points essentially stopped moving up/down. Points S02, S03, E08, and E09 had vertical velocities that fluctuated strongly at first and then showed an obvious inflection point around October 2016 after which the downward velocity increased sharply.
The vertical velocities of points C10, C11, C56, C57, C60, C61, C63-1, C69, C91, C92, X6, X7, and X35 are in the range –0.18 to –2.8 mm/day during the interval P4. Moreover, the velocity of point C61 in P4 is 26 times larger than that in P3. Apart from points X46 and X47, the other GPS monitoring points have velocities ranging from –0.02 to –0.33 mm/day. The vertical velocities of S02, S03, E08, and E09 during P4 are in the range from –0.3 to –1.53 mm/day. The velocities of the rest of the level monitoring points are between 0 and –0.06 mm/day.
The velocity–time curves all fluctuate to some degree. Such fluctuations were studied by Ma et al. (2007). When underground mining is carried out, strain energy accumulates in the rock strata. When this energy exceeds a certain critical threshold, the energy is released and the velocity of the rock mass will increase. As the stored energy is subsequently dissipated, the velocity of the rock mass will decrease.
The monitoring results presented here allow the following conclusions to be drawn. The horizontal displacement–time curves (from May 2008 to December 2020) that have three inflection points can be divided into four stages: P1, P2, P3, and P4. P1 corresponds to the initial deformation stage. In this stage, both the displacement and velocities are small with some fluctuation. The deformation is small and mainly caused by the private mining activity. P2 is the ‘creep’ deformation stage and is caused by the creeping movement of the rock. There is a small increase in deformation at this stage. Therefore, the displacement and velocity are again small but occur at a rate that is greater than that in the P1 stage. P3 is a slow deformation stage in which the deformation increases steadily at a certain rate. Finally, P4 is the accelerating deformation stage in which there is a significant increase in the rate of horizontal and vertical deformation. Almost all of the monitoring points that have four stages are such that their horizontal velocities show the same rule: P4 > P3 > P1 > P2.
Depend on the GPS monitoring points, the horizontal displacement velocity of C60, C61, C11, C92, are larger than 1 mm/day. At the meantime, many major cracks are found there, like crack (1) to crack (4). Especially C92, it was close to crack (1) which emerged on September 2020, and the horizontal displacement velocity of C92 was 1.43 mm/day. So did the crack (2) which was found on October 2019, and the horizontal displacement velocity of GPS points C11 and C69 was 3.48 mm/day and 2.40 mm/day. Depend on the horizontal displacement velocity of GPS monitoring points close to major crack, we get the conclusion that major cracks on the surface will emerge when horizontal velocities exceed 1 mm/day.
Most of the monitoring points have horizontal to vertical displacement (H/V) ratios that increase the further the point is away from the void boundary. According to our statistical analysis, 26 of the 36 GPS monitoring points have H/V values that are greater than 1 until December 2020. This shows that the current surface deformation process is dominated by horizontal displacement.
According to the displacement–time curves, displacement velocity–time curves, and ratio of horizontal to vertical displacement, a conclusion can be got, that is the horizontal displacement plays an important role in ground surface deformation. This is mainly affected by in situ ground stress, and steeply dipping discontinuities. When the orebody is mined in the deep, the in situ ground stress is released which cause the rock column cut by steeply dipping discontinuities to topple. Disturbed by the rock mass F4 fault start to slip, the failure of F4 fault and rock mass gradually spreads to the surface in months.
Many researchers have used physical models to study the mechanism responsible for the ground surface deformation in the Jinshandian iron mine region (Cai et al., 2006; Chen, 2006; Ren et al., 2010). Xia K. et al. (2018) pointed out that the majority of the deformation above the mined-out area was gradually spreading upwards from the deep regions to the surface. Yang (2019), based on the results of in situ field investigations, deformation and microseismic monitoring experiments, and theoretical analysis, managed to explain why ground pressure had been produced in the haulageway of the mining level after October 2016. Moreover, the work of Brady and Brown (2006) and Xia et al. (2016a), Xia et al. (2016b) showed that it was mainly toppling failure occurring in the metal mine. Also, Du et al. (2020a) and (2020b) did lots of study on rock failure depend on acoustic emission.
The discontinuities in the rock mass are steeply dipping in the eastern part of the Jinshandian mine. The first group of discontinuities cut the hanging wall of the rock mass into column-shaped blocks. In addition, the rock masses surrounding the mined-out area are of relatively poor quality. As the underground mining activity proceeds, the initial stress in the rock is released after the rock mass near the void is disturbed. This caused the forces acting on the opposite sides of the columnar rock masses to become unbalanced. When the tensile strength of a column is reached, it will be subjected to flexural toppling failure. Failure occurs on the side of the rock column near the void. As a result, a large amount of caved rock will be created that will fall into the void. As the mining activity moved to greater depths, the upper part of fault F4 slipped and caved, further damaging the rock columns. The scope of the caved rock masses is also extended (see Figure 10 for details).
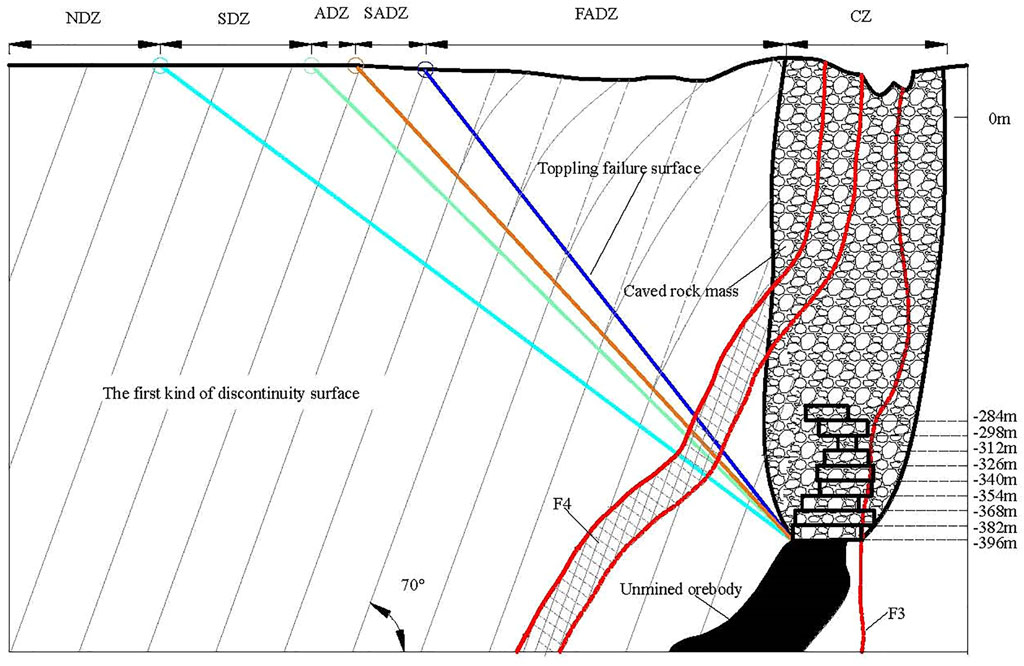
FIGURE 10. Schematic diagram showing the deformation mechanism in the deep rock strata.
The deformation of the hanging wall can now be seen to be highly significant. The deformation is closely related to the dips and strikes of the orebodies in the mining area, the distributions of the discontinuities and faults, and the direction of the initial ground stress. The two orebodies are parallel to each other and have strikes in nearly east–west directions and dip towards the south. In addition, four faults are distributed around the orebodies with east–west strikes which means the quality of the rock masses around the orebodies is poor. The steeply dipping discontinuities play a crucial role in the surface deformation. Also, the initial ground stress is oriented in a nearly north–south direction. After the underground orebody is mined out, the initial stress is released and the rock mass and roof near the mined-out area are destroyed due to the in situ ground stress, pressure from the overlying rock masses, and the effect of gravity on them. When a large amount of orebody has been mined, the deformation in the deep rock strata gradually spreads to the surface. This, in turn, leads to subsidence and horizontal movement of the ground surface and hence damage and destruction of buildings and other structures thereon.
Lupo (1996a), Fu et al. (2015), Xia et al. (2020), and Pang et al. (2020) have carried out a great deal of research on surface deformation zones. In this paper, the surface deformation in the hanging wall is divided into six zones based on the results of our GPS and level monitoring data, the cracks observed in the Jinshandian surface and its state of collapse, and the results of other studies. Here, we refer to the zones as: (i) the caved zone (CZ), (ii) fast-accelerating deformation zone (FADZ), (iii) slowly-accelerating deformation zone (SADZ), (iv) acceptable deformation zone (ADZ), (v) slight deformation zone (SDZ), and (vi) no deformation zone (NDZ). The suggested boundaries of these zones are shown in Figure 11.
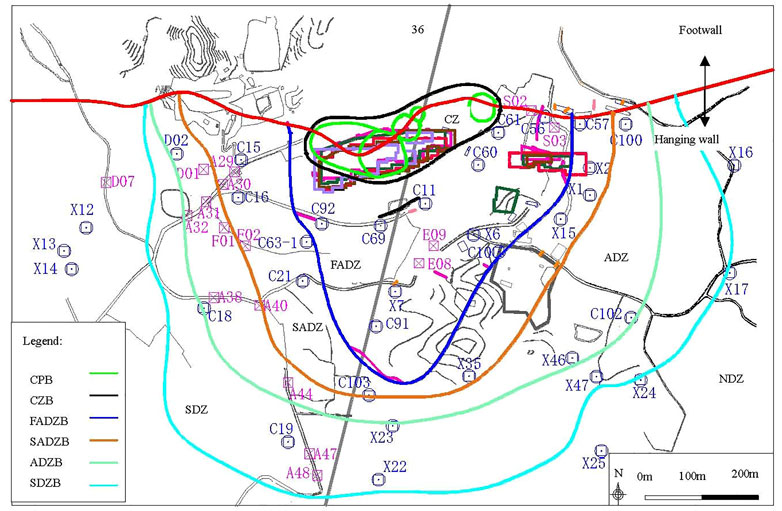
FIGURE 11. The zones formed on the ground surface.
The CZ, which is located directly above the void, may contain a large amount of caved rock (which moved to the mined-out area under the action of its own gravity). After a certain amount of time, the deformation gradually spreads to the surface, causing the surface to collapse and crack. On the surface near the collapsed pit, there are a lot of large cracks and the soil layer is very soft. The CZ boundary (CZB) is based on the topographic map generated by 3D laser scanning and other observation methods (aerial drone photography, GPS and level monitoring, and field investigation). The CZB lies about 5 m away from the collapsed pit boundary (CPB) and a large number of tension cracks are visible on the surface which are quite deep and have strikes parallel to the CPB. Due to the large deformation encountered in the CZ, no monitoring points are set up inside it in the interest of safety. As found previously by Lupo (1997), the CZ is dominated by vertical deformation.
The columnar rock masses in the FADZ undergo flexural toppling (towards the void side) due to the subsidence and horizontal movement of the rock masses in the CZ. The numerous failing rock columns lead to the formation of a slip surface. The failed rock masses are relatively broken and will readily move to the mined-out area along the sliding surface along with the caved rock masses in the CZ. In the FADZ, the buildings are sinking heavily and the surface cracks are large. The monitoring points in this area exhibit obvious signs of accelerated deformation. At the same time, it can be seen that the H/V ratios of the GPS monitoring points in this area are all greater than 1 and their horizontal velocities are greater than 1 mm/day. The FADZ boundary (FADZB) is determined by the locations of the major cracks on the surface and the coordinates of the GPS monitoring points whose horizontal velocities exceed 1 mm/day.
In the SADZ, there are a few cracks on the ground surface and the deformation is mainly that caused by the flexural toppling failure of the rock masses. The SADZ boundary (SADZB) is drawn according to the horizontal displacement field derived from the GPS monitoring data. A critical strain value of 6 mm/m (0.006) is used to define the boundary based on Chinese specification (The Coal Industry Bureau of the People’s Republic of China, 2017).
Pang et al. (2020) has carried out a lot of research on ADZs. In the ADZ, there is movement and deformation of the ground surface but cracks do not form. However, a few cracks can be found on the buildings and other structures. The rock mass below this zone is disturbed and the displacement–time curves of the monitoring points on the surface show a fluctuating and increasing trend. The ADZ boundary (ADZB) is drawn, based on the horizontal displacement field, using a critical strain value of 2 mm/m (0.002).
In the SDZ, there is only slight movement of the ground surface and the underground rock mass is subject to minimal disturbance. As a result, the deformations of the monitoring points in the zone fluctuate. Using the horizontal displacement field, the SDZ boundary (SDZB) is drawn with a 1 cm displacement boundary contour curve in consideration of measurement errors.
In the NDZ, the underground rock mass and the surface are not deformed at all. The monitoring points exhibit small fluctuations due to measurement errors.
The zones and zone boundaries outlined above change dynamically as the underground mining activity deepens.
Based on the monitoring data, some conclusions can be drawn as follows, the result in this paper can be a refence to the metal mines which have the similar engineering geology condition.
1) The cracks around the collapse pits are essentially parallel to the boundaries of the pits and the cracks far away from the pits are essentially consistent with the strikes of the discontinuities. The closer one is to the mined-out area, the more severe the damage observed in buildings and structures.
2) The horizontal displacement–time curves exhibit five types of behavior. Curves with three inflection points can be divided into four stages: initial deformation stage, creep deformation stage, slow deformation stage, and accelerating deformation stage. Currently, the horizontal to vertical displacement ratio is greater than 1, indicating that the horizontal displacement is playing the dominant role in the surface deformation.
3) The failure mechanism acting in the hanging wall is flexural toppling of rock column and slipping of F4 fault. The large deformation in the hanging wall is due to the combined effect of in situ horizontal ground stress, steeply dipping discontinuities and faults, the dip directions and strikes of two parallel orebodies, and the underground mining activity. The deformation in the deep rock strata gradually spreads to the surface which causes the crack and damage on the ground surface and buildings.
4) The surface deformation can be divided into six zones (CZ, FADZ, SADZ, ADZ, SDZ, and NDZ). The caved zone boundary extends 5 m beyond the collapse pit. The boundary of the fast-accelerating deformation zone is determined by the occurrence of major cracks and surface points with horizontal velocities >1 mm/day. The slowly-accelerating deformation zone, acceptable deformation zone, and slight deformation zone boundaries can be defined in a similar way (corresponding to horizontal deformations of 6 mm/m (0.006), 2 mm/m (0.002), and 1 cm displacement, respectively). Moreover, the data indicate that large-scale cracks will emerge when the horizontal velocity of the ground surface exceeds 1 mm/day.
The original contributions presented in the study are included in the article/Supplementary Material, further inquiries can be directed to the corresponding author.
TW: Conceptualization, Methodology, Investigation, Writing—original draft, Writing—review and editing. CC: Supervision, Conceptualization, Resources, Project administration. KX: Conceptualization, Investigation, Methodology, Writing—review and editing. CZ: Investigation, Methodology. YW: Investigation. XL: Investigation.
Financial support for this work was provided by the Young Scholar Fund of National Natural Science Foundation of China (Grant no. 42002292).
The authors declare that the research was conducted in the absence of any commercial or financial relationships that could be construed as a potential conflict of interest.
All claims expressed in this article are solely those of the authors and do not necessarily represent those of their affiliated organizations, or those of the publisher, the editors and the reviewers. Any product that may be evaluated in this article, or claim that may be made by its manufacturer, is not guaranteed or endorsed by the publisher.
We are very grateful for the Foundation’s continuous support and also to our colleagues for their valuable help with this research.
Blachowski, J., and Ellefmo, S. (2012). Numerical Modelling of Rock Mass Deformation in Sublevel Caving Mining System. Acta Geodyn. Geomater. 9 (3), 379–388. doi:10.3969/j.issn.1673-193X.2006.05.003
Brady, B. H. G., and Brown, E. T. (2006). Rock Mechanics for Underground Mining. Third ed. Berlin: Springer.
Cai, S. J., Chen, Q. Y., and Ming, S. X. (2006). Study on Subsidence Prediction of Underground Mining of Parallel Ore Bodies in Jinshandian Mine by Physical Modeling. J. Saf. Sci. Technol. 2 (5), 13–19. (in Chinese). doi:10.3969/j.issn.1673-193X.2006.05.003
Chen, Q. Y. (2006). Research on Strata Movement in Sub-Level Caving for Parallel Ore Bodies in Jinshandian Iron Ore Mine. Ph. D. Thesis. Beijing, China: University of Science and Technology Beijing.
Ding, K., Ma, F., Guo, J., Zhao, H., Lu, R., and Liu, F. (2018). Investigation of the Mechanism of Roof Caving in the Jinchuan Nickel Mine, China. Rock Mech. Rock Eng. 51 (4), 1215–1226. doi:10.1007/s00603-017-1374-0
Du, K., Yang, C., Su, R., Tao, M., and Wang, S. (2020a). Failure properties of cubic granite, marble, and sands sandstone specimens under true triaxial stress. Int. J. Rock. Mech. Min. Sci. 130, 104309. doi:10.1016/j.ijrmms.2020.104309
Du, K., Li, X., Tao, M., and Wang, S. (2020b). Experimental study on acoustic emission (AE) characteristics and crack classification during rock fracture in several basic lab tests. Int. J. Rock. Mech. Min. Sci. 133, 104411. doi:10.1016/j.ijrmms.2020.104411
Eremin, M., Esterhuizen, G., and Smolin, I. (2020). Numerical Simulation of Roof Cavings in Several Kuzbass Mines Using Finite-Difference Continuum Damage Mechanics Approach. Int. J. Min. Sci. Technol. 30, 157–166. doi:10.1016/j.ijmst.2020.01.006
Evanek, N., Slaker, B., Iannacchione, A., and Miller, T. (2021). LiDAR Mapping of Ground Damage in a Heading Re-orientation Case Study. Int. J. Min. Sci. Technol. 31, 67–74. doi:10.1016/j.ijmst.2020.12.018
Feng, G., Chen, B., Xiao, Y., Jiang, Q., Li, P., Zheng, H., et al. (2022). Microseismic characteristics of rockburst development in deep TBM tunnels with alternating soft‐hard strata and application to rockburst warning: A case study of the Neelum‐Jhelum hydropower project. Tunn. Undergr. Sp. Tech. 122, 104398. doi:10.1016/j.tust.2022.104398
Feng, G., Feng, X., Chen, B., Xiao, Y., and Yu, Y. (2015). A microseismic method for dynamic warning of rockburst development processes in tunnels. Rock Mechanics and Rock Engineering. Int. J. Min. Sci. Technol. 48(5), 2061–2076. doi:10.1007/s00603-014-0689-3
Fu, H., Chen, C. X., Xia, K. Z., and Deng, Y. Y. (2015). Analysis of Rock Deformation Caused by Underground Mining of Metal Mines. Chin. J. Rock Mech. Eng. 34 (9), 1859–1868. (in Chinese). doi:10.13722/j.cnki.jrme.2014.1303
Hoek, E. (1974). Progressive Caving Induced by Mining an Inclined Orebody. Trans. Instn Min. Metall. 83, A133–A139.
Li, Y., Ren, Y., Peng, S. S., Cheng, H., Wang, N., and Luo, J. (2021). Measurement of Overburden Failure Zones in Close-Multiple Coal Seams Mining. Int. J. Min. Sci. Technol. 31, 43–50. doi:10.1016/j.ijmst.2020.12.009
Lu, R., Ma, F. S., Guo, J., and Zhao, H. J. (2018). Analysis and Monitoring of Roadway Deformation Mechanisms in Nickel Mine, China. Concurr. Comput. Pract. Exper 31 (10), e4832. doi:10.1002/cpe.4832
Lupo, J. F. (1996b). Evaluation of Deformations Resulting from Mass Mining of an Inclined Orebody. Ph. D. Thesis. Golden, CO: Colorado School of Mines.
Lupo, J. F. (1996a). Large-Scale Surface Disturbances Resulting from Underground Mass Mining. Int. J. Rock Mech. Min. Sci. 35 (4), 399.
Lupo, J. F. (1997). Progressive Failure of Hanging Wall and Footwall Kiirunavaara Mine, Sweden. Int. J. Rock Mech. Min. Sci. 34 (3-4), 684. doi:10.1016/s1365-1609(97)00277-3
Ma, F.-S., Deng, Q.-H., Cunningham, D., Yuan, R.-M., and Zhao, H.-J. (2013). Vertical Shaft Collapse at the Jinchuan Nickel Mine, Gansu Province, China: Analysis of Contributing Factors and Causal Mechanisms. Environ. Earth Sci. 69 (1), 21–28. doi:10.1007/s12665-012-1930-6
Ma, F. S., Yuan, R. M., Deng, Q. H., Li, G. Q., Zhao, H. J., Ding, D. M., et al. (2007). GPS Monitoring of Ground Movement and Mechanism of Underground Mining Influence in Jinchuan Mine. J. Eng. Geol. 15 (S2), 84–97. (in Chinese).
Ma, F., Zhao, H., Yuan, R., and Guo, J. (2015). Ground Movement Resulting from Underground Backfill Mining in a Nickel Mine (Gansu Province, China). Nat. Hazards 77 (3), 1475–1490. doi:10.1007/s11069-014-1513-9
Ma, F., Zhao, H., Zhang, Y., Guo, J., Wei, A., Wu, Z., et al. (2012). GPS Monitoring and Analysis of Ground Movement and Deformation Induced by Transition from Open-Pit to Underground Mining. J. Rock Mech. Geotechnical Eng. 4 (1), 82–87. doi:10.3724/sp.j.1235.2012.00082
Pang, H. S., Chen, C. X., Xia, K. Z., and Zhang, C. Q. (2020). Study on the Methodology for Determining the Ground accepTABLE Deformation Limit in Sublevel Caving Mining Based on Monitoring Data. Chin. J. Rock Mech. Eng. 39 (4), 736–748. (in Chinese). doi:10.13722/j.cnki.jrme.2019.0966
Parmar, H., Bafghi, Y. A., and Najafi, M. (2019). Impact of Ground Surface Subsidence Due to Underground Mining on Surface Infrastructure: The Case of the Anomaly No. 12 Sechahun, Iran. Environ. Earth Sci. 78, 409. doi:10.1007/s12665-019-8424-8
Pinheiro, A. L., Lana, M. S., and Sobreira, F. G. (2015). Use of the Distinct Element Method to Study Flexural Toppling at the Pico Mine, Brazil. Bull. Eng. Geol. Environ. 74 (4), 1177–1186. doi:10.1007/s10064-014-0713-6
Ren, W., Guo, C., Peng, Z., and Wang, Y. (2010). Model Experimental Research on Deformation and Subsidence Characteristics of Ground and Wall Rock Due to Mining under Thick Overlying Terrane. Int. J. Rock Mech. Min. Sci. 47 (4), 614–624. doi:10.1016/j.ijrmms.2009.12.012
Svartsjaern, M. (2019). A Prognosis Methodology for Underground Infrastructure Damage in Sublevel Cave Mining. Rock Mech. Rock Eng. 52, 247–263. doi:10.1007/s00603-018-1464-7
Svartsjaern, M., and Saiang, D. (2017). Discrete Element Modelling of Footwall Rock Mass Damage Induced by Sub-Level Caving at the Kiirunavaara Mine. Minerals 7, 109. doi:10.3390/min7070109
Svartsjaern, M., Saiang, D., Nordlund, E., and Eitzenberger, A. (2016). Conceptual Numerical Modeling of Large-Scale Footwall Behavior at the Kiirunavaara Mine, and Implications for Deformation Monitoring. Rock Mech. Rock Eng. 49, 943–960. doi:10.1007/s00603-015-0750-x
The Coal Industry Bureau of the People’s Republic of China (2017). Regulations of Buildings, Water, Railway and Coal Pillar Set for Roadway and Coal Mining. Beijing: Coal Industry Press. (in Chinese).
Villegas, T., and Nordlund, E. (2008a). “Numerical Analysis of the Hangingwall Failure at the Kiirunavaara Mine,” in Proceedings of MassMin 2008, The 5th International Conference and Exhibition on Mass Mining, 9-11 June 2008. (Lulea, Sweden: Lulea University of Technology), 867–876.
Villegas, T., and Nordlund, E. (2008b). “Numerical Simulation of the Hangingwall Subsidence Using PFC2D,” in Proceedings of MassMin 2008, The 5th International Conference and Exhibition on Mass Mining, 9-11 June 2008. (Lulea, Sweden: Lulea University of Technology), 907–916.
Villegas, T., and Nordlund, E. (2012). Time-Dependent Movements of the Hangingwall at the Kiirunavaara Mine. Int. J. Min. Reclam. Environ. 26 (2), 119–133. doi:10.1080/17480930.2011.552287
Vyazmensky, A. (2008). Numerical Modelling of Surface Subsidence Associated with Block Cave Mining Using a Finite Element/Discrete Element Approach. PhD thesis. Vancouver, Canada: Simon Fraser University.
Wang, F., Jiang, B., Chen, S., and Ren, M. (2019). Surface Collapse Control under Thick Unconsolidated Layers by Backfilling Strip Mining in Coal Mines. Int. J. Rock Mech. Min. Sci. 113, 268–277. doi:10.1016/j.ijrmms.2018.11.006
Wang, X., Kulatilake, P. H. S. W., and Song, W.-D. (2012). Stability Investigations Around a Mine Tunnel through Three-Dimensional Discontinuum and Continuum Stress Analyses. Tunn. Undergr. Sp. Tech. 32, 98–112. doi:10.1016/j.tust.2012.06.003
Wu, X., Jiang, X.-W., Chen, Y.-F., Tian, H., and Xu, N.-X. (2009). The Influences of Mining Subsidence on the Ecological Environment and Public Infrastructure: a Case Study at the Haolaigou Iron Ore Mine in Baotou, China. Environ. Earth Sci. 59 (4), 803–810. doi:10.1007/s12665-009-0076-7
Xia, K., Chen, C., Deng, Y., Xiao, G., Zheng, Y., Liu, X., et al. (2018). In Situ monitoring and Analysis of the Mining-Induced Deep Ground Movement in a Metal Mine. Int. J. Rock Mech. Min. Sci. 109, 32–51. doi:10.1016/j.ijrmms.2018.06.014
Xia, K., Chen, C., Fu, H., Pan, Y., and Deng, Y. (2016b). Mining-induced Ground Deformation in Tectonic Stress Metal Mines: A Case Study. Eng. Geol. 210, 212–230. doi:10.1016/j.enggeo.2016.06.018
Xia, K., Chen, C., Liu, X., Fu, H., Pan, Y., and Deng, Y. (2016a). Mining-Induced Ground Movement in Tectonic Stress Metal Mines: A Case Study. Bull. Eng. Geol. Environ. 75 (3), 1089–1115. doi:10.1007/s10064-016-0886-2
Xia, K., Chen, C., Lu, Z., Yang, K., Zheng, Y., Pang, H., et al. (2019a). Investigation of the Ground Movement Due to Underground Mining at the Jinshandian Iron Mine in China. Environ. Earth Sci. 78, 715. doi:10.1007/s12665-019-8753-7
Xia, K., Chen, C., Yang, K., Zhang, H., and Pang, H. (2020). A Case Study on the Characteristics of Footwall Ground Deformation and Movement and Their Mechanisms. Nat. Hazards 104, 1039–1077. doi:10.1007/s11069-020-04204-4
Xia, K., Chen, C., Zheng, Y., Zhang, H., Liu, X., Deng, Y., et al. (2019b). Engineering Geology and Ground Collapse Mechanism in the Chengchao Iron-Ore Mine in China. Eng. Geol. 249, 129–147. doi:10.1016/j.enggeo.2018.12.028
Xia, Y., Wang, Y., Du, S., Liu, X., and Zhou, H. (2018). Integration of D-InSAR and GIS Technology for Identifying Illegal Underground Mining in Yangquan District, Shanxi Province, China. Environ. Earth Sci. 77 (8), 319. doi:10.1007/s12665-018-7488-1
Yang, K. Y. (2019). Study on Ground Pressure Activity Law of a Metal Mine Adopted Non-pillar Sublevel Caving Method. Ph. D. Thesis. Wuhan: Institute of Rock and Soil Mechanics, Chinese Academy of Sciences.
Keywords: metal mine, underground mining, hanging wall, in situ monitoring data, discontinuities and faults, ground surface deformation
Citation: Wang T, Chen C, Xia K, Zhang C, Wang Y and Liu X (2022) Ground Surface Deformation in the Hanging Wall of the Jinshandian Underground Iron Mine in China. Front. Earth Sci. 10:909466. doi: 10.3389/feart.2022.909466
Received: 31 March 2022; Accepted: 26 April 2022;
Published: 10 May 2022.
Edited by:
Shibing Huang, Wuhan University of Science and Technology, ChinaReviewed by:
Yingjie Xia, Dalian University of Technology, ChinaCopyright © 2022 Wang, Chen, Xia, Zhang, Wang and Liu. This is an open-access article distributed under the terms of the Creative Commons Attribution License (CC BY). The use, distribution or reproduction in other forums is permitted, provided the original author(s) and the copyright owner(s) are credited and that the original publication in this journal is cited, in accordance with accepted academic practice. No use, distribution or reproduction is permitted which does not comply with these terms.
*Correspondence: Kaizong Xia, a3p4aWFAd2hyc20uYWMuY24=
Disclaimer: All claims expressed in this article are solely those of the authors and do not necessarily represent those of their affiliated organizations, or those of the publisher, the editors and the reviewers. Any product that may be evaluated in this article or claim that may be made by its manufacturer is not guaranteed or endorsed by the publisher.
Research integrity at Frontiers
Learn more about the work of our research integrity team to safeguard the quality of each article we publish.