
94% of researchers rate our articles as excellent or good
Learn more about the work of our research integrity team to safeguard the quality of each article we publish.
Find out more
ORIGINAL RESEARCH article
Front. Earth Sci., 23 June 2022
Sec. Geohazards and Georisks
Volume 10 - 2022 | https://doi.org/10.3389/feart.2022.908351
This article is part of the Research TopicSediment Dynamics and Geohazards in Estuaries and DeltasView all 14 articles
 Shibing Zhu
1
Shibing Zhu
1
 Yining Chen
2
Yining Chen
2
 Weibing Yan
3
Weibing Yan
3
 Fei Xing
4*
Fei Xing
4*
 Renzhi Li
4
Renzhi Li
4
 Mingliang Li
1
Mingliang Li
1
 Benwei Shi
4
Benwei Shi
4
 Ya Ping Wang
1,4*
Ya Ping Wang
1,4*Tidal flat system is composed of multiple sub-scale geomorphological units. We found a new mesoscale geomorphological unit on sand-mud mixed intertidal zone along China coast, which was defined as hummocky patches. Hummock patches are most developed in middle tidal flat, with horizontal magnitude of 10–20 m and vertical magnitude of ∼15 cm. Hummocky patches significantly influence local sediment transport, thus affect morphological evolution of tidal flats. In order to understand the formation and development mechanisms of hummocky patches, we collected hydrodynamics, topography, sediment properties, and substrate erosion thresholds data through an in-situ field observation covering a spring-neap tidal cycle over an accretional intertidal flat in Jiangsu, China. We found that sediment characteristics including sorting coefficient (σ: measuring the uniformity of sediment particles) and silt/clay/organic matter/water content are essentially different between hummocky patches and nearby seabed, which leads to spatially varied substrate erosion resistance. The measured erosion thresholds for patches are two times higher comparing to surrounding seabed sediment, which provides foundation for the formation of hummocky patches. Under the impact of periodical tidal currents and waves, surrounding seabed experiences considerably more erosion than patch area, which finally develops to hummocky patches. Therefore, hydrodynamic forces drive the formation and development of patches. The erosion resistance of patches decreases vertically from seabed surface to sublayer, causing initial erosion in the lower sublayer, followed by a mass collapse of the seabed surface layer. Hummocky patches are commonly found in middle tidal zone and their sizes decrease to the shore as tidal currents and waves attenuate with shoreward propagation. Hummocky patches have distinct seasonal variations, which only appear in summer and autumn when wind waves are comparatively lower than winter and spring. We infer the reason is that the strong hydrodynamics caused by winter storms cause larger bottom shear stress than the erosion threshold of hummocky patches, leading to destruction of hummocky patches and a smooth tidal flat surface. This study shed new insight on the knowledge of mesoscale geomorphological units and their formation and development in intertidal flats, which provides crucial information for developing more realistic tidal flat sediment transport and morphological models.
Tidal flats form in coastal areas with strong tidal forces and abundant supply of fine-grained sediments. It is an important buffer against typhoons, storm surges, and other natural disasters in coastal areas, and an essential reserve land resource (Wang et al., 2012; Kirwan and Megonigal, 2013; Walstra et al., 2015). However, tidal flats all over the world are experiencing decreased accretion rate or even changing from accretion to erosion due to human activities, sea-level rise, and decrease in riverine sediment supply in recent decades (Syvitski et al., 2005). Tidal flat protection has become an important aspect in making sustainable regional development strategy, which requires further understanding of tidal flat evolution and their controlling factors (Tessler et al., 2015).
Various geomorphological units with different spatial scales constitute tidal flat geomorphological features (Figure 1A). The characteristics of these geomorphological units are the most intuitive expression of tidal flat morphology, which provides critical clues to understand tidal flat evolution (Wang et al., 2006). The geomorphologic units of tidal flats can be classified as macroscale, mesoscale, and microscale units, according to their magnitudes. Macroscale geomorphological units of tidal flats indicate morphological patterns controlling the entire flat system, such as profile geometry, e.g., convex and concave profile morphology (Gao, 2009; Zhou et al., 2016), and zonation of flat sediments (Roberts et al., 2000; Zhang et al., 2018). Mesoscale geomorphological units refer to those features with the length of 1–10 m, including scarps occurring at the boundaries between flat and vegetation (salt marsh plants and mangroves), ridges (Weill et al., 2010; Weill et al., 2012), sand waves (Allen, 1980; Besio et al., 2006), and waterways (Weimer et al., 1982; Pieterse et al., 2016), as well as tidal creeks (Blanton et al., 2002). Microscale geomorphological units, which generally less than 1 m, include flat surface cracks (Gardel et al., 2009), sand grains (Harms, 1969), linear scour pits (Sumer et al., 2001), biological holes (Takeuchi and Tamaki, 2014), and flat surface uplift caused by fish or large burrowing, which usually located in the low tidal zone (Dott and Bourgeois, 1982). Mechanisms controlling the genesis and development of these geomorphological units have been well studied (Gao, 2019).
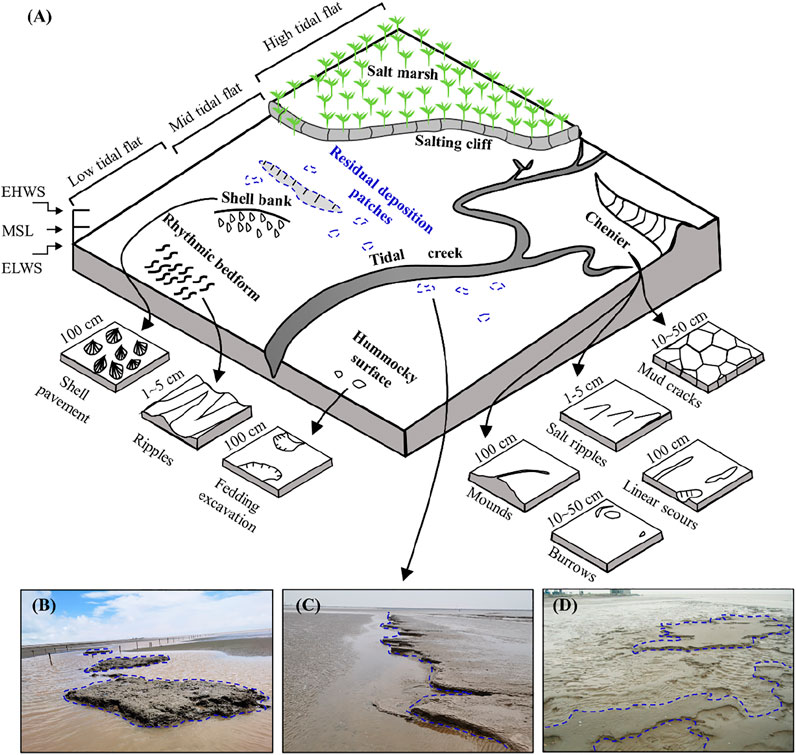
FIGURE 1. Generalized geomorphology of tidal flats. (A) Macroscale geomorphology of tidal flat and morphological characteristics of mesoscale and microscale geomorphology units. (B–D) Photos of intertidal hummocky patches taken in three major tidal flat areas in China: (B) The tidal flat in the Yangtze River Delta, photographed in August 2021; (C) Tidal flat in Dafeng along Jiangsu coast, photographed in May 2021; (D) Tidal flat in the Yellow River Delta, photographed in July 2008.
Other than these features, we discovered a new mesoscale geomorphological unit, which is defined as hummocky patches, mostly occurring in intertidal zone with diverse sediment composition (Figure 1). Generally, hummocks refer to undulating relief with alternating convex and concave topography, which have distinctive spatial distribution patterns: vary from transversely or radially aligned ridges, ripples or hummocks, to almost uniformly, tightly packed hummocks (Robinson et al., 2015). Hummocky landform is seen on most sub-aerial and sub-marine environments on Earth and other planets, whose formation are mainly controlled by the following factors: accumulation of organic matter (Hughes and Barber, 2004), differential erosion by flowing water (Dawkins, 1939), frost heave (Grab, 1997), etc. The patches that we found on tidal flats have similar characteristics as other hummocky landforms, so we defined them as hummocky patches.
Hummocky patches with varying sizes and irregular shapes have been observed in several tidal flat systems along China coast (Figures 1B–D), shown as elevated mounds and ridges which typically less than 1 m in height and more than 10 m in length, composed of chaotic assemblages of hillocks and depressions of variable sizes and shapes in the intertidal zones. On tidal flats, where topography is usually featured with very gentle slope and uniform surface, the presence of such patches is very distinctive and significantly influence the morphological and ecological evolution of tidal flats and correlated wetland systems. However, studies of these hummocks are still rare as they are not as widely distributed as other geomorphological units. There are some studies mentioned similar patches, but these patches are usually limited in both distribution area and magnitude comparing to hummocky patches. These small patches are stated to form by biological effects, or spatial variations of sediment substrate, without accounting for the importance of dynamics in their formation processes. From the biological point of view, former studies show that microphytobenthos such as diatoms can stabilize sediment by secreting extracellular polymeric substances (EPS) during locomotion (Edgar, 1982; Hoagland et al., 1993understanding of the geomorphological), which act to increase the strength of interparticle bonding (Chenu and Guerif, 1991; Perkins et al., 2004; Gerbersdorf et al., 2008). These temporally and spatially heterogeneous diatom biofilms can form hummocky shaped diatom mats on intertidal flats (Boer, 1981; Grant et al., 1986; Underwood and Paterson, 1993). The magnitude of these diatom mats is usually limited to be 1–50 cm in magnitude and 0.5–3 cm in depth. From sediment substrate point of view, former studies show that sediment with different physical and chemical properties, such as water content, organic matter content, sand-silt proportion, significantly influence soil erosion resistance and thus play a dominant role in shaping geomorphology of tidal flats (Tolhurst et al., 2000b; Defew et al., 2002; Amos et al., 2004). But these studies did not explain how the spatial variations of substrate properties interact with understanding of the geomorphological geomorphology. As a specific tidal flat geomorphological features, hummocky patches are formed under the interactions of base sediment type, wave and tidal forces, biogenic activities and sediment supply (Meckel, 1975; Semeniuk, 1981). Therefore, in this study, we try to study the properties and formation mechanism of hummocky patches from a dynamic point of view based on long-term field measurement data.
A systematic understanding of the geomorphological behaviors of tidal flats requires better knowledge about physical processes involved, performance of geomorphological modelling techniques, interactions between substrate stability and geomorphology, and biological influences on bed composition in the different geomorphic units (French et al., 2016). At present, most sediment transport models ignore the spatial and temporal variabilities of sediment properties by applying empirical values (Black et al., 2002; Lundkvist et al., 2007), which may cause significant uncertainty on modeled sediment transport flux and predicted morphology (Murray et al., 2008). The most important reason to exclude mesoscale and microscale sediment properties in model is that there is very few information on the high-resolution soil erosion threshold data on tidal flats.
In this work, we study hummocky patches in tidal flat systems from the perspective of sediment dynamics with long-term measurement data. The main objective is to investigate the formation, distribution, and development mechanisms of patches in intertidal flats and the influence of biological activities on morphological evolution, based on 16 days of observation throughout a neap-spring tide cycle, including records of hydrodynamics, sediment transport, and morphology. Our analyses based on these detailed and systematic long-term data not only broadens our knowledge on the geomorphology of tidal flat systems, but also provides crucial clues for the development of more realistic models that can highly improve the predictive accuracy of sediment transport and morphological changes on tidal flats.
The study area is located along Jiangsu coast, China, on the west of the South Yellow Sea, and the north of the radial sand ridge system, between the Yangtze River Delta and the Abandoned Yellow River Delta (Figure 2A). Abundant sediment from the sand ridge system, Yangtze and Yellow River deltas, and strong tidal forces formed wide tidal flats along the Jiangsu coast with a fast progradation rate (Wang et al., 2012). The strata are composed of Tertiary and Quaternary sediments. Hydrodynamics in this area is mainly controlled by the interactions of the advancing tidal waves from the East China Sea and the rotating tidal waves from the Yellow Sea, and their shallow-water tidal components, forming semidiurnal tides with an average tidal range of 3.68 m, which belongs to mesotidal conditions (Li et al., 2007). The average wind speed is 4–5 m/s throughout the year, and the wind direction is dominated by NNE and ENE. Sheltered by the radial sand ridge system (Figure 2A), the maximum significant wave height in the study area is less than 2 m, and 85% of waves are less than 1 m (Jia et al., 2005).
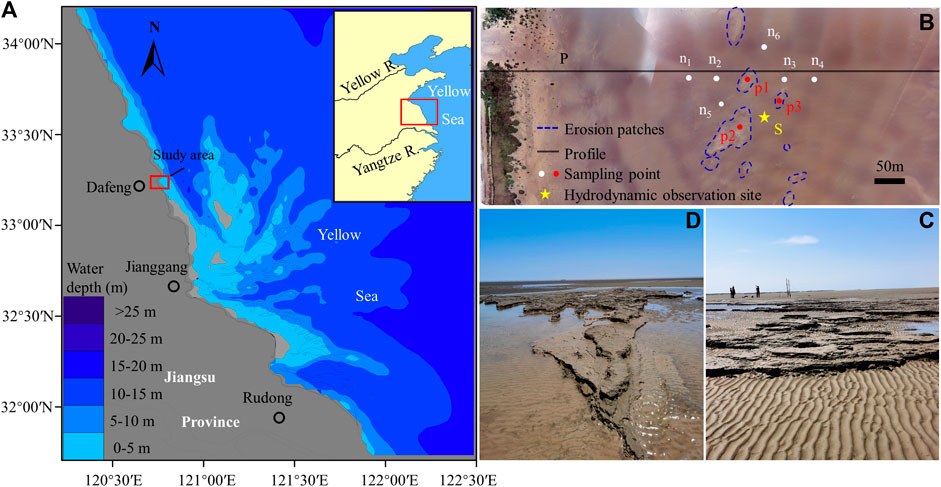
FIGURE 2. Location of the study area and observation sites (red box). (A) Maps showing the study area located at Dafeng, Jiangsu, China. (B) Topographic map of the tidal flat taken by unmanned aerial vehicles, showing hummocky patches (bright color circled by a blue dash line), measuring profile P, sampling points n1–n6 (white dots on the tidal flat surfaces), p1–p3 (red filled dots on patches) and hydrodynamic observation site (S). A sediment core with a length of 30 cm was taken at sampling point p1. (C) and (D) show the morphological characteristics of hummocky patches (bright color circled by a blue dash line) distributed in the intertidal zone.
The intertidal flat in our study area is a muddy flat with wide and smooth surface. Tidal creeks are less developed in this area. The intertidal flat is divided into three zones from land to sea based on elevation: 1) High tidal flat, located between mean high-level neap tide to mean high-level spring tide, where bed surface sediment is composed of silt and clayey silt, and seabed surface is covered by horizontal laminae; 2) Middle tidal flat, located between mean low-level neap tide and mean high-level neap tide, where bed surface sediment is composed of silt and fine sand. 3) Low tidal flat, located between mean low-level neap tide to mean low-level spring tide, where bed surface sediment is mainly composed of fine sand (Ke, 1993). Hummocky patches are distributed in high tidal zone and middle tidal zone (Figure 2B), and the magnitude of patches decreases landward. Our statistical analysis shows that patches in middle tidal flat usually present in the form of banded ridges and irregularly hummocky surfaces. The length of ridges exceeds 50 m and the height is about 25 cm. Hummocky patches is characterized by vertical laminae surfaces, whose horizontal scale is between 1–20 m and vertical scale is about 20 cm (Figures 2C,D). Patches in high tidal flat are less noticeable with horizontal scale of less than 5 cm, and vertical scale of less than 10 m. These patches have distinctive seasonal evolution pattern: they occur in summer and autumn but disappear in spring and winter (according to previous long-term field surveys in the study area and consultations with local fishermen).
We organized a field trip from 9th May to 26th May 2021 in the study area to investigate the mechanisms of formation and development of hummocky patches in tidal flat systems. The observation platform (S) was installed among patches to obtain hydrodynamic and sediment dynamic data (Figure 3A): water depth, wave height, and wave period were measured using an SBE 26 plus SEAGAUGE (Sea-Bird Electronics, United States; Washington, United States), and the instrument was set to collect 1,024 samples per burst, with a frequency of 4 Hz over a 256 s period. Three-dimensional turbulent velocity at 15 cm above seabed was monitored using a Vector Acoustic Doppler (ADVs, 6 MHz vector current meter, Nortek AS, Norway) with a burst interval of 5 min in autonomous deployment mode for 256 s at a frequency of 16 Hz. Turbidity at 15 cm above seabed was measured every 5 min using optical backscatter sensors of OBS-3A (D&A Instrument Company, United States) (Figure 3B). A bucket with volume of 50 L was set close to the platform to collect water samples for instrument calibration. At the same time, an anemometer was set up near the shore to record wind speed and direction.
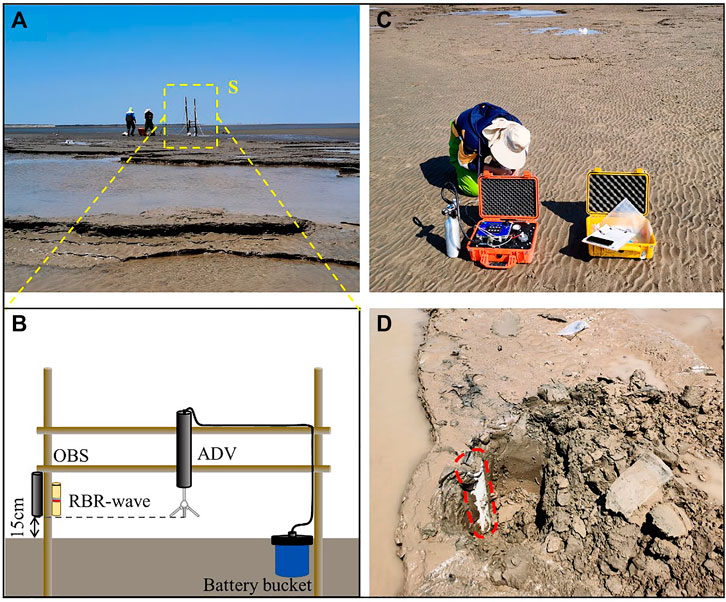
FIGURE 3. Schematic and photograph of the observation platform and instruments deployed during field measurements. (A) Schematic diagram of the observation platform; (B) Photo of the instrument installation, all instrument sensors are deployed at 15 cm above the seabed; (C) Coherent strength meter (CSM) used to estimate seabed critical erosion shear stress; (D) Sediment core collected on a hummocky patch.
An RTK-GPS (Real Time Kinematic, STONEX Company, China) with a benchmark of mean sea level was used to measure elevation along the tidal flat from dyke to the lowest water level of the maximum spring tide, and the distance between neighboring points was approximately 5 m. Denser measurements (every 1 m) were carried out where surface topography changes sharply to obtain more detailed information on tidal flat profile. In addition, different sedimentary zones and boundaries of hummocky patches were recorded to better depict the geomorphological characteristics of tidal flats in the study area.
Sediment samples were collected and erosion thresholds were measured on hummocky patches and their surrounding flat surfaces. We collected three samples on patches (p1, p2, and p3) and six samples on the surrounding flat, which includes two landward samples (n1 and n2), two seaward samples (n3 and n4), one southwestward sample (n5) and one northeastward sample (n6). The distance between two adjacent points is approximately 30 m. The intensive sample points ensured we can depict changes of sediment properties in hummocky patch area. Surface sediment samples were collected at the nine points, and the critical erosion thresholds (kPa) of sediment were measured by a coherent strength meter (CSM, Partrac Ltd., UK) (Figure 3C), which was then converted into critical erosion shear stress (N/m2). At the same time, a 30 cm sediment core was collected at p1 to analyze sediment properties along the vertical profile of a hummocky patch (Figure 3D).
The sediment core collected at station p1 was cut along a vertical profile using a core cutter made by GeoTek Company of the United Kingdom, and then sediment samples were taken with a 2 cm interval along the core (e.g., 0–2 cm, 2–4 cm, and 28–30 cm). In total, 15 samples were taken from the core, and nine sediment samples were collected at surrounding hummocky patch surface and smooth flat surface. All sediment samples were analyzed in the laboratory.
Particle size of 24 sediment samples was analyzed using a Mastersizer 2000 laser granulometer (Malvern Instruments Ltd.; measuring range of 0.02–2,000 μm; particle size resolution of 0.01 φ, reproducibility error of <3%). Sand (medium grain size (d50) > 64 μm), silt (d50: 4–64 μm), and clay (d50 < 4 μm) proportion were calculated based on the grain size analysis. Sorting coefficient of sediment (σ) was calculated by the Collias moment method with statistical significance (Zhu et al., 2019).
Sediment samples were weighed and then dried at 50°C for 48 h in oven until their weights were stable. Water content (W) was determined as the ratio of wet mass minus dry mass to the total mass of sediment samples (Taki, 2000).
Total Organic Carbon (TOC) of sediment samples were measured with an NCsoil element analyzer (Thermo scientific, United States). Inorganic carbon was first removed by adding HCl to sediment samples, and then these samples were sonicated, dried, freeze-dried, ground, packaged, and tested on the machine (Li et al., 2021).
Water samples collected in field were used in the laboratory to reconstruct suspended sediment concentrations (SSCs, mgL−1) with turbidity data (FTUs). As suspended sediment concentration (FTUs > 1,000) increases, more scattered light is absorbed by sediment before reaching the sensor of instrument. This leads to an increased slope in retrieving SSCs from FTUs (Liu et al., 2006), Therefore, we reconstructed SSCs from FTUs with two separate lines based on FTU values to better represent their relationship (Figure 4).
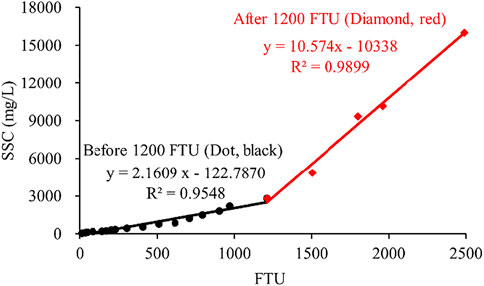
FIGURE 4. Calibration curves used to convert optical turbidity (FTU, recorded by OBS) to suspended sediment concentration (SSC, mg/L). The trend varies significantly from low to high turbidity, according, we classify the data into two groups: the black line shows the calibration curve below 1,250 FTU, and the red line shows the calibration curve above 1,250 FTU.
Tides and waves are the main forces on tidal flats, which control hydrodynamics and sediment transport in tidal flat systems. In our study, wave- and current-induced bed shear stress are calculated separately, and the bed shear stress caused by current-wave interactions are then calculated with a wave-current interaction model.
The wave-induced shear stress is calculated as (Tucker and Pitt, 2001; Green and Coco, 2007):
where
Wave friction coefficient
where
The peak value of wave orbital velocity (
where ω (=π/T) is angular velocity (s−1),
Velocity data are processed by spectral analysis to eliminate the influence of waves on current. The Reynolds stress method is used for calculation (Tucker and Pitt, 2001; Green and Coco, 2007), and the expression is as follows:
where
The shear stress due to combined wave-current interactions is calculated by the Soulsby model (Soulsby and Clarke, 2005). First, the average bed shear stress
Bottom shear stress under combined wave-current interaction
where φ is the angle between wave and tidal current directions (degree).
Critical shear stress for erosion (τce) is an important parameter that determines sediment movement. It is also an important input parameter in numerical modeling of sediment transport because it controls cohesive sediment entrainment (Tolhurst et al., 2000a; Black et al., 2001). Due to environmental complexity and interactions of multiple factors that control sediment erosion (e.g., grain size, clay content, TOC content, and water content), especially for areas with biological activities, the erosion threshold of cohesive sediment cannot be accurately calculated by existing formula. CSM is the state of art instrument to measure critical shear stress for erosion (Vardy et al., 2007).
The operation principle of CSM is that water is driven by air pressure to produce jet flow vertical to bed surface with increasing intensity. Bottom shear stress caused by water flow drives sediments to be eroded and suspended, changing the transmittance in the cabin. Therefore, rapid decline in transmittance indicates that external shear stress generated by the instrument is about the same magnitude of the erosion threshold of sediments at a certain depth (Parchure and Mehta, 1985; Tolhurst et al., 1999). This study defines a decrease in transmittance >5% as the threshold that critical shear stress for erosion is reached (Chen et al., 2012). CSM measurement data are recorded as a series of transmittance percentages and vertical flow jet pressures. The flow jet pressure (P, kPa) corresponding to the sudden change in transmittance is then transformed by a calibration function to obtain the critical erosion shear stress (τce, N/m2) of sediment at the field station.
The length of intertidal zone in our study area is approximately 1,250 m (the width of the tidal flat has significantly decreased due to land reclamation in recent years), and the general slope of the tidal flat is 2.53‰. The tidal flat has a sedimentological zonation pattern (Figure 5): the high flat has a length of ∼170 m (10–180 m from dyke), where benthic animals, such as crabs and worms, are very active. The high flat consists of two different zones. The landward high flat (10–70 m) is occupied with a large number of Spartina alterniflora and the seaward flat (70–180 m) is bare mudflat. Because of the long exposure time, hexagonal cracks are often developed in this zone. The middle tidal flat is mainly mud-sand mixed bare flat located 180–760 m from the dyke, characterized by rapid morphological changes and rough surface. The low tide flat is a fine sand flat (of a distance of 760–1,250 m) located from the low tide level to the high tide level. Sediment is mainly composed of fine sand, with various flow marks and wavelet marks on the surface and staggered bedding development. The majorities of hummocky patches are distributed in the mud-sand mixed flat and mudflat. In the transition zone between middle and low tidal flat (580–680 m from the dyke), hummocky patches are well developed with horizontal magnitude of ∼50 m and vertical magnitude of about 20 cm.
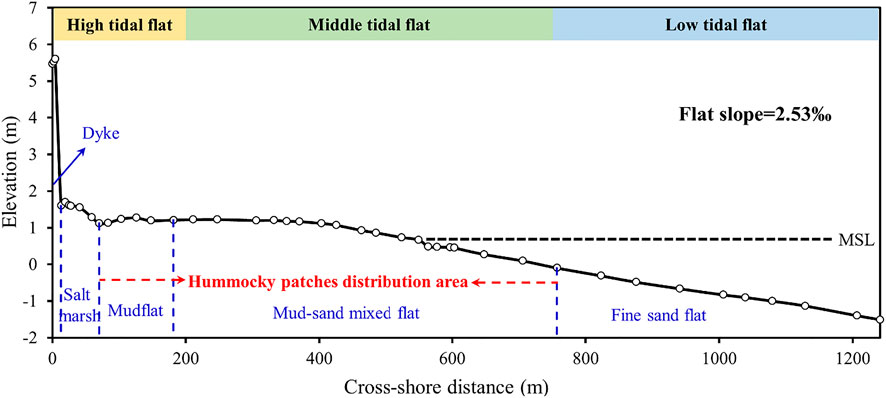
FIGURE 5. Tidal flat cross-section elevation profile and slope based on measurement of RTK-GPS, showing four different sedimentary zones (blue font). Locations of hummocky patches are shown in red font. MSL, mean sea level.
Our hydrodynamic observations among hummocky patches covered 31 tidal cycles in May 2021 (Figures 6A-E). Velocity data from ADV were missing from 15th to 16th May due to instrument fault (Figure 6D). During the observational period, the study area was dominated by northeastern and southeastern winds, with wind speed ranged from 0.1 to 13.1 m/s and mean wind speed of 4.0 m/s (temporal resolution of wind data was 1 min) (Figure 6A). Strong winds were observed from 16 to 17 May, with gust wind higher than 10 m/s. Our observation covered a spring and neap tide cycle, and water depth varied significantly, with tide ranges of approximately 1 m during neap and 1.6 m during spring. The maximum water depths of spring tide and neap tide were 1.66 and 0.94 m, respectively. Strong winds significantly influenced hydrodynamics on the tidal flat, during which the tidal range increased to 1.5 m for one neap tide.
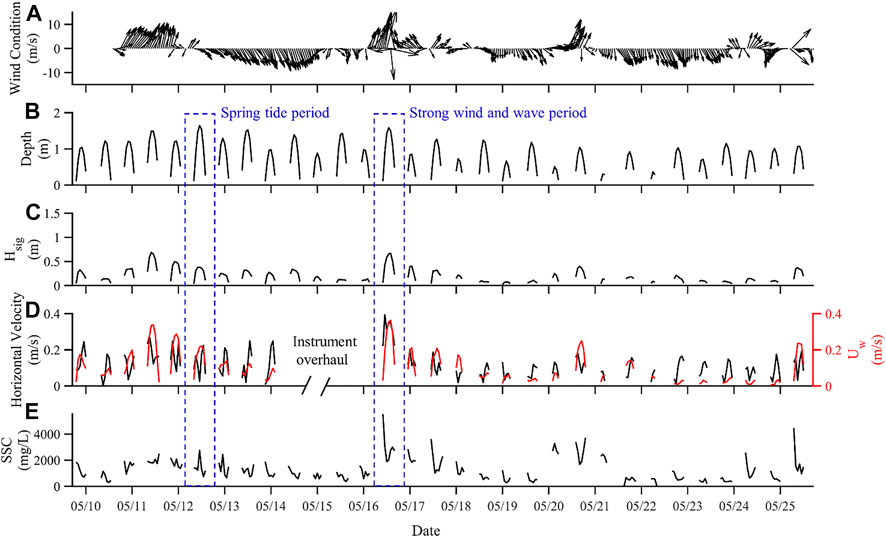
FIGURE 6. Time series of hydrodynamics and suspended sediment concentrations in the study area: (A) wind speed and direction; (B) water depth; (C) significant wave height; (D) current velocity at 15 cm above the bottom (data on 15th May are lacking due to instrument overhaul); (E) suspended sediment concentration (SSC) at the observation site during 10–25 May 2021.
The near bottom hydrodynamics control sediment resuspension, deposition, and seabed shaping. Near-bottom flow velocities measured by ADV (Figure 6D) showed significant fluctuations over time, consistent with tidal phase. Flow velocities during spring tides ranged from 0.05 to 0.25 m/s, which was much larger than that during neap tides (0.03–0.15 m/s, Figure 6D). Strong winds considerably increased current velocity, and the maximum flow velocities (0.38 m/s) observed during the high wind event concurrently with neap tidal condition were larger than the maximum velocity of the spring tide (0.25 m/s).
Our study area is located in coastal shallow water zone, where waves are dominated by wind waves. In addition to wind, depth is another major limit for wave development on tidal flats, so observed waves were higher during spring tides with larger water depth than that during neap tides. During spring tidal condition, significant wave height was about 0.05–0.45 m. Significant wave height gradually decreased from spring tide to neap tide. During the strong wind period, the maximum significant wave height was close to 0.8 m (16th May) (Figure 6C). Wave orbital velocity (Uw) followed the same trend as significant wave height that decreased from spring to neap tides (Figure 6D).
Sediment properties of hummocky patches are quite different from that on surrounding tidal flat (Figure 7). Mud content of sediment on hummocky patches is higher than that on surrounding flat, and grain size (p1–p3) of sediment on hummocky patches [the median grain size of the samples (d50) is 49 μm] is generally smaller than that of the sediment on surrounding tidal flat (n1–n6, the median grain size of these samples is approximately 96 μm). Although all samples have a similar single-peak pattern of grain size distribution, the grain size curves of samples collected from hummocky patches are lower and flatter (the peak is located at 43 μm) than that collected from surrounding flat, which means the composition of sediment on hummocky patches is more diverse than surrounding flat (Figure 7).
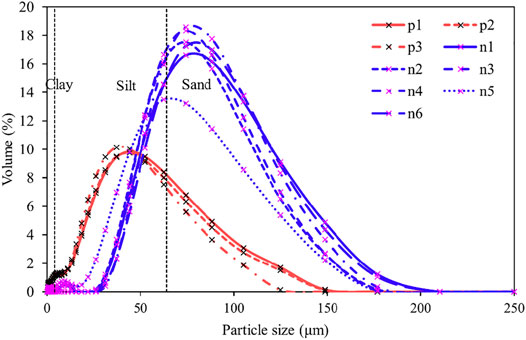
FIGURE 7. Grain size distribution curve of sediment on erosion patterns (red lines) and surrounding tidal flat (blue lines).
The collected nine samples among hummocky patch area are mainly composed of sand (>64 μm) and silt (4–64 μm), the total content of which exceeds 90% (Figure 7). Significant differences are observed between hummocky patches and the surrounding flat. Sediment from hummocky patches is finer, with 81.71 ± 8.32% of silt and 10.05 ± 1.58% of clay. On the other hand, sediment from the surrounding flat has 22.79 ± 3.15% of silt and 1.19 ± 0.65% of clay (Figures 8A,B). Sorting coefficient (σ) of hummocky patches sediment is about 2.5 times higher than that of smooth flat sediment (Figure 8C). Water contents of sediment samples from hummocky patches (9.5 ± 0.25%) are slightly lower than that from surrounding flat (10.53 ± 1.04%) (Figure 8D). Organic matter content and sorting coefficient of sediments from hummocky patches are significantly higher than those from the surrounding flat (approximately 3 times) (Figure 8E). Correspondingly, the erosion threshold of hummocky patches is approximately 2.5 times higher than that of the surrounding flat (Figure 8F).
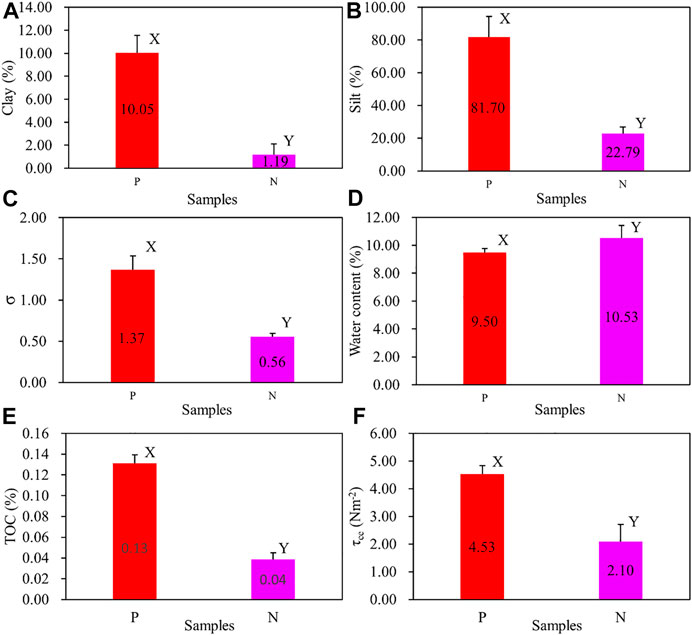
FIGURE 8. Comparison of sediment properties between hummocky patches and surrounding areas. P represents the hummocky patches (red stripes), and N represents the surrounding flat (purple stripes). Error bars show the standard deviation of the EPS content. Letter (X or Y) on top of the bars denotes the results of the tests, indicating that there is a significant difference between sediment from hummocky patches and nearby seabed (p < 0.001).
Sediment properties from the sediment core vary significantly in vertical profile, with 14 cm as a clear boundary between upper and lower layers. The hummocky patches are mainly composed of sand and silt (Figures 9A,D). Sand content tends to decrease from seabed surface to bottom sublayer, while silt content shows the opposite trend. Although clay content is comparatively low throughout the core, it is comparatively higher in the surface layer than that in the sublayer (Figure 9D). The water content of sediments at 0–14 cm from the surface remains relatively stable, which gradually increases and shows more fluctuation from 14 to 30 cm (Figure 9B). Sorting coefficient (σ) describes the extent of variance in particle size distribution in the way that the smaller the coefficient, the lower variance of the particle size, and it acts as a measure of the filling density between the sediments (Le Roux and Rojas, 2007), σ of sediment samples gradually decreases downward from 0 to 14 cm and becomes relatively stable from 14 to 30 cm (Figure 9C). Accordingly, we define the depth of the erosion patch to be ∼14 cm (Figure 9E).
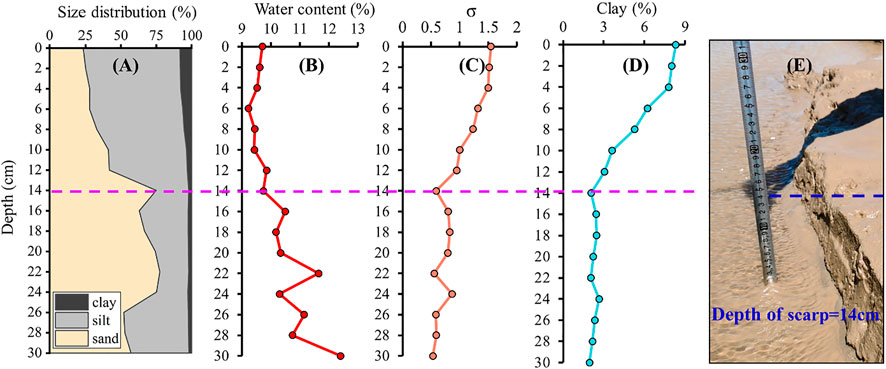
FIGURE 9. Vertical profiles of sediment characteristics on hummocky patches, (A) grain size distribution of sediments, (B) water content, (C) sorting coefficient, (D) clay content, (E) field photo of hummocky patches, photographed on 15th May, showing the depth of erosion patch is around 14 cm (blue dash line). The purple dash line shows the boundary between upper and lower layers with remarkable differences in sediment properties.
Erosion and deposition of substrate sediment directly determine sediment transport and is a crucial factor in the formation of tidal flat geomorphological features (Brand et al., 2010). The erodibility of sediment determines whether and when seabed sediment will be suspended. It is controlled by multiple factors with complex interactions that are still poorly understood (Teisson et al., 1993).
In recent decades, a lot of research has been conducted on the influencing factors of substrate sediment erodibility (Table 1). In accordance with previous research, this study analyzes the spatial distribution of sediment erodibility from the perspective of physical processes and biological effects.
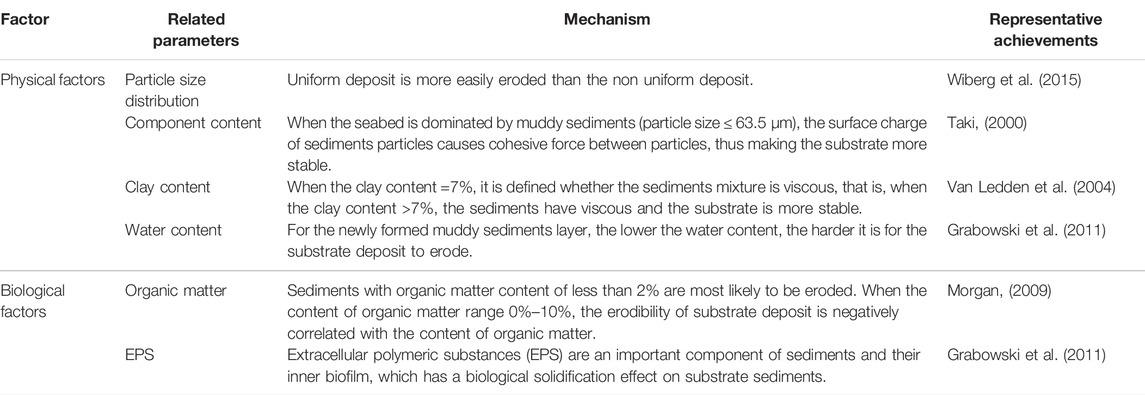
TABLE 1. Relevant research on factors affecting sediment erosion resistance.
Our analysis shows that silt accounts for around 80% of sediments on hummocky patches, while clay accounts for around 10% (>7%, Figures 8A,B). According to previous research (Van Ledden et al., 2004), high content of cohesive sediment on hummocky patches can largely increase the stability of seabed. The sorting coefficient of sediment on hummocky patches is much larger than that on the surrounding flat (approximately 3 times), which indicates that the particle grain size distribution of sediment on hummocky patches is less uniform compared to the surrounding flat. Under this condition, fine sediment particles are filled in the gaps between coarse particles, resulting in a denser sediment mixture and a more stable surface (Rogers and Head, 1961). It has been reported that water content directly affects the mechanical properties of cohesive sediments in the way that water reduces the erosion threshold of sediment (Shi et al., 2018). Water content of sediment samples from hummocky patches is slightly lower than that from nearby seabed sediment, in favor to increase erosion threshold of substrate sediment. Analysis of physical properties of substrate sediment shows that hummocky patches should be more difficult to erode than surrounding areas, consistent with our result from CSM measurement.
Biological impacts on erosion resistance of substrate sediment mainly refer to biological disturbance and biological solidification. Biological disturbance causes a slight change in surface roughness, but its impact on erosion resistance is insignificant. Biological solidification is caused by the extracellular polymeric substances (EPS) secreted by organisms which can largely solidify sediments. Winterwep and Van Kesteren (2004) claimed that biological activity brings to the substrate an abundance of organic matter (quantified by the value of TOC), and many components of organic matter are bio-adhesive. Besides, biological activities also produce a variety of organic debris and organic colloids (EPS) through biological metabolism, which makes sediments more difficult to be eroded. EPS can be secreted by many kinds of organisms which is difficult to quantify, therefore, organic matter content is used to illustrate the influence of biological activities on sediment erodibility (Winterwerp and Van Kesteren, 2004). The TOC content of the substrate sediment from hummocky patches is remarkably higher than that of the surrounding flat (approximately 3 times), which largely increases the erosion threshold of hummocky patches.
The physical characteristics and the influences of biological activities both favor to increase the erosion threshold of sediment on hummocky patches. Under periodical hydrodynamics, sediment that are susceptible to erosion are removed, while sediment that are more resistant to erodibility are kept, which eventually leads to the formation of hummocky patches. Hence, the spatial variations in erosion resistance of substrate sediments provide the fundamental condition for the formation of hummocky patches.
Waves, currents, and their interactions are the dominant forces shaping tidal flat topography. Wave-induced shear stress (τw), flow-induced shear stress (τc), and wave-current combined shear stress (τcw) are used to evaluate the importances of different forces. The shear resistance of sediment shows the susceptibility of sediment to erosion (Shi et al., 2014), which is usually represented by erosion threshold or critical shear stress for erosion (τce). When bed shear stress is lower than this threshold (τcw < τce), no erosion or little erosion occurs, but once it exceeds this value, the amount of erosion increases significantly (Panagiotopoulos et al., 1997; Zhu et al., 2014). Because the duration of in-situ observations is relatively long (16 days), we calculated shear stress caused by currents, waves, and current-wave interactions by averaging shear stress every 12 bursts (1 h) to show the temporal changes of bed shear stress over time. The temporal variations of bed shear stress showed a clear trend with spring-neap tidal cycle, indicating the dominance of bed shear stress by tidal currents. Several peaks appeared over time, in response to storm events (16th May, 20th May, and 25th May). However, the relationship between τce′ (the critical erosion shear stresses of hummocky patches) and τcw was unclear during strong wind periods as the bed shear stress data were averaged hourly (Figures 10A,B). Therefore, we chose two representative time periods (Figures 10C,D), one during a spring tide with low winds and the other during a neap tide but dominated by strong winds and waves, to analyze the detailed hydrodynamics and morphodynamics with burst-averaged shear stress (every 5 min).
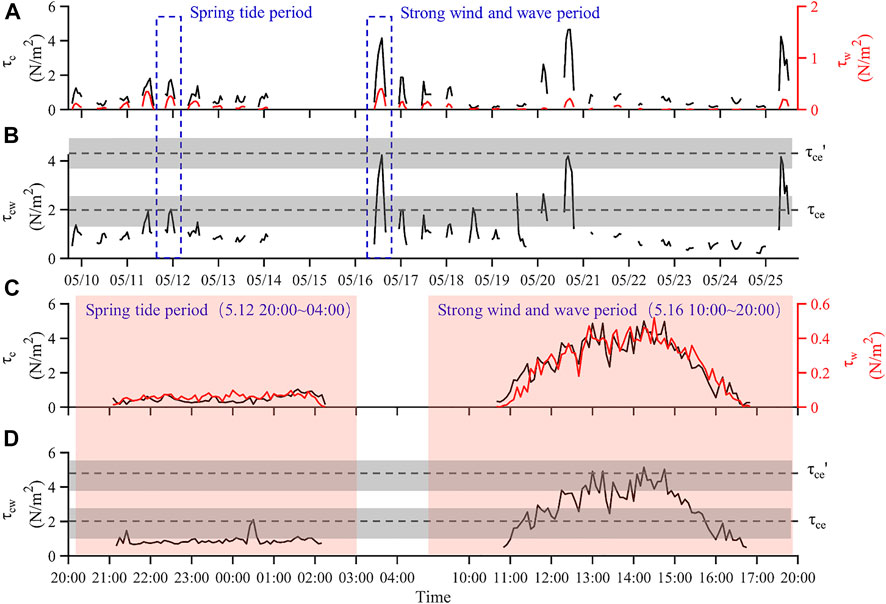
FIGURE 10. Time series of bed shear stress and critical erosion shear stress of substrate. (A) and (B) show the time series of wave-induced shear stress τw, current-induced shear stress τc, and wave-current combined shear stress τcw throughout the whole observation period, (C) and (D) show the time series of wave-induced shear stress τw, current-induced shear stress τc, and wave-current combined shear stress τcw during the spring tides and strong winds, respectively. τce and τce′ are the average values of the critical erosion shear stresses of the smooth flat and hummocky patches, and the gray strips are the range of τce and τce′.
During our observation period, wave-induced shear stress ranged from 0.1 to 0.8 N/m2, and current-induced shear stress ranged from 0.2 to 4.3 N/m2 (Figure 10C). Wave-current combined shear stress τcw ranged from 0.3 to 4.6 N/m2, and the critical shear stresses for erosion of smooth tidal flat (τce) and erosion patches (τce′) are 0.9–2.7 N/m2 and 3.8–5.1 N/m2 (Figure 10D), respectively. Based on our calculation of near-bed shear stress and erosion threshold of bed sediment, three situations occur: 1) τcw < τce, seabed sediment are not eroded. 2) τce < τcw < τce′, high near-bed shear stress causes erosion of tidal flat, but hummocky patches remain steady. It is an important step for the formation of hummocky patches. 3) τcw > τce′, under this condition, both hummocky patches and surrounding flat are eroded, and hummocky patches start to die out. The durations of condition two and three determine the development extent of hummocky patches.
During our 16 days observation, the near-bed shear stress caused by current and waves was less than the erosion threshold of hummocky patches (τcw < τce′) for most of the time (12 days) (Figure 10B), therefore, the geomorphological features of hummocky patches were basically unchanged (the geomorphological changes caused by seabed scouring and siltation in a short period of time can be ignored). Our study shows that tides alone cannot form hummocky patches. Even in the spring tide stage, the near-bed critical shear stress caused by tidal current is less than the erosion threshold of seabed sediment on hummocky patches. During the three strong wind events (16th May, 20th May, and 25th May), the critical shear stress caused by wave-current interactions is high enough to erode sediment from smooth tidal flat surface, but unable to erode sediment from hummocky patches, in favor to the formation of hummocky patches (Figure 10B). The height of hummocky patches is determined by the duration of high shear stress, and soil erodibility of surrounding tidal flat (Amos et al., 1997; Sanford, 2008). Due to the spatial variations in surface sediment erosion resistance, the place where sediment have a smaller erosion threshold are removed during strong wind events. As soil strength increases downward due to soil consolidation, erosion declines downward and stops at a depth where τcw = τce, which determines the height of residual hummocky patches. The maximum height of hummocky patches observed in our study area was approximately 20 cm. Even during the strongest wind event (16th May), the duration when bed shear stress caused by wave-current interactions was larger than the erosion threshold for hummocky patches lasted for less than 2 h (Figure 10D), so no evident elevation changes occurred on hummocky patches. Therefore, we infer that hummocky patches can be preserved under conventional hydrodynamics. In summary, the formation and preservation of patches are highly related to hydrodynamic intensity and duration, which explains the seasonal evolution of patches in tidal flats. Winter time is characterized by frequent high-energy storm events (Chang et al., 2006), which cause resuspension of deposited muds and patches break-up. Hence, hummocky patches on intertidal flat tend to appear under weak dynamic conditions in summer and autumn.
Tidal flat substrate erosion resistance is controlled by multiple factors (e.g., biological effects, sediment properties, chemical factors, etc.) and their interactions, while their importances on determining soil erosion threshold are still unknown (Tolhurst et al., 2002). At present, there is no direct way to calculate critical erosion stress of cohesive sediments with one or more measured parameters. CSM serves as an excellent tool to estimate the erosion thresholds of sediment influenced by complex factors in-situ as it is easy to operate and produces reliable results to estimate critical shear stress for soil erosion. However, as CSM utilizes a water jet vertical to sediment surface to estimate the critical shear stress of sediment layers, it has been argued that CSM cannot measure the realistic horizontal shear stress of soil (Tolhurst et al., 2000a; Grabowski et al., 2010). In addition, no uniform standards exist to convert CSM data into erosion thresholds (Watts et al., 2003). Therefore, the values of critical shear stress estimated from CSM may not be quantitatively accurate. However, multiple former studies have shown that CSM is useful in comparing relative erosion thresholds over different types of beds (Tolhurst et al., 1999; Tolhurst et al., 2006). Other than CSM, erosion threshold of soil can be estimated using mainstream formulas based on sediment parameters (Table 2). Two different formulas were used to calculate the critical erosion thresholds of sediment on hummocky patches and surrounding tidal flat and we found that the calculated values from the formula are much lower than the measured value of CSM (Table 2). The deviation may be related to biological activities as neither of the two formulas taken into account the influence of biological activities on sediment strength. Previous studies have shown that biological activities, such as fecal particle production, and mucus production, can largely change the physical characteristics of surface sediments, thus increasing the erosion threshold of seabed sediment by more than 10 times (Widdows et al., 1998). The maximum values of bed shear stress measured by CSM in other tidal flat areas reach more than 5 N/m2 (Table 2), which are also related to biological activities. Without accounting for biological effects, the erosion thresholds calculated from formulas are much less than the measured bed shear stress caused by wave-current interactions. We infer that the accurate critical erosion shear stress of cohesive sediments with active biological activities can only be obtained by field measurements, therefore, the results from CSM observation are more reliable. Previous studies show that the critical erosion threshold of substrate sediments in the salt marsh zone of this study area ranges from 0.3 to 0.4 N/m2 based on CSM measurement (Chen et al., 2020), much smaller than our results, this may due to the dissipative and trapping effects of salt marsh that allow the settling of fine-grained sediments (sediment fraction is relatively homogeneous), resulting in a small critical erosion threshold.
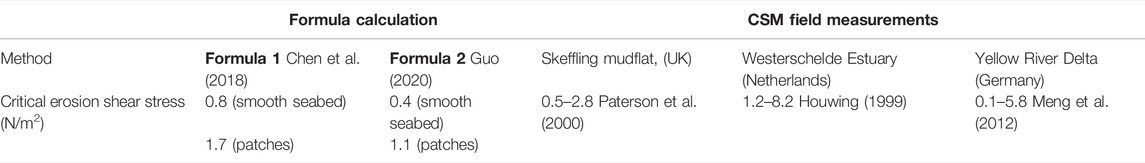
TABLE 2. Substrate erosion thresholds calculated using two different equations based on physical properties of the sediment, compared to that measured with CSM on other tidal flats around the world.
In summary, the above results indicated that the uneven spatial distribution of erosion threshold caused by physical characteristics of sediments and biological activities provide the foundation of patches formation, while hydrodynamics is the crucial driving force in determining the development, distribution, and destruction of hummocky patches (Figure 11).
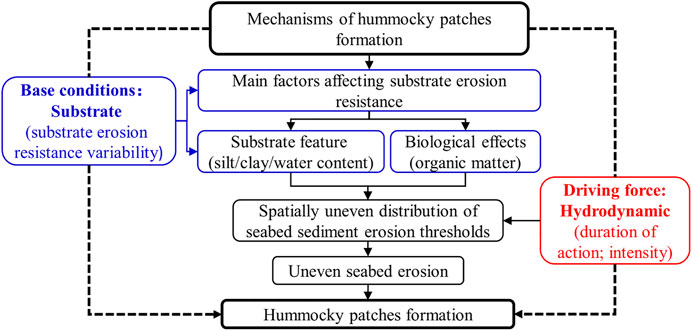
FIGURE 11. Conceptual model of hummocky patches formation mechanism.
Hummocky patches mainly appear in the middle of intertidal zone (middle tidal zone, Figure 12), which is caused by two facts: 1) Biological effects of the middle tidal zone favors the formation and development of hummocky patches. Organic matter produced by biological activities and EPS produced by decomposition highly increases the seabed resistance to erosion. 2) Hydrodynamics are the fundamental reason for the zonation of sediments on flat surfaces, which attenuates from low to high tidal flat (Shi et al., 2014). Accordingly, the contribution of suspended sediment to substrate increases. The surface sediment of the low tidal zone mainly come from bed loads, while the surface sediment of the high tidal zone mainly come from suspended sediment. The middle tide zone is a transitional area where substrate sediment consist of both suspended and bed loads including mud and sand (Yang et al., 2017). The uneven distribution of mud-sand mixed sediment increases soil density and strength, in favor to form hummocky patches. In the low tidal zone, hydrodynamic force is relatively strong where only coarse-grained sediment can be settled, resulting in comparatively uniform fine sand sediment on seabed. In addition, there are few biological activities in the low tidal zone of the intertidal flat. Therefore, the lower tidal flat cannot provide necessary conditions for the formation of hummocky patches (Figure 12D). In the upper part of the tidal flat (high tidal zone), biological activities in favor to form sediment with high resistance to erosion. However, due to the weak hydrodynamic condition, geomorphological features cannot be fully developed, so we observed pitches with a very small erosion depth (approximately 1 cm) in this zone (Figure 12A). Similarly, due to the attenuation of hydrodynamic intensity, the eroded landform cannot be fully developed on the shore side of the middle tidal flat (Figure 12B). Therefore, the lower part of middle tidal zone provides the best conditions for the formation of hummocky patches, where hummocky patches can be fully developed and the geomorphological features are remarkable (Figure 12C).
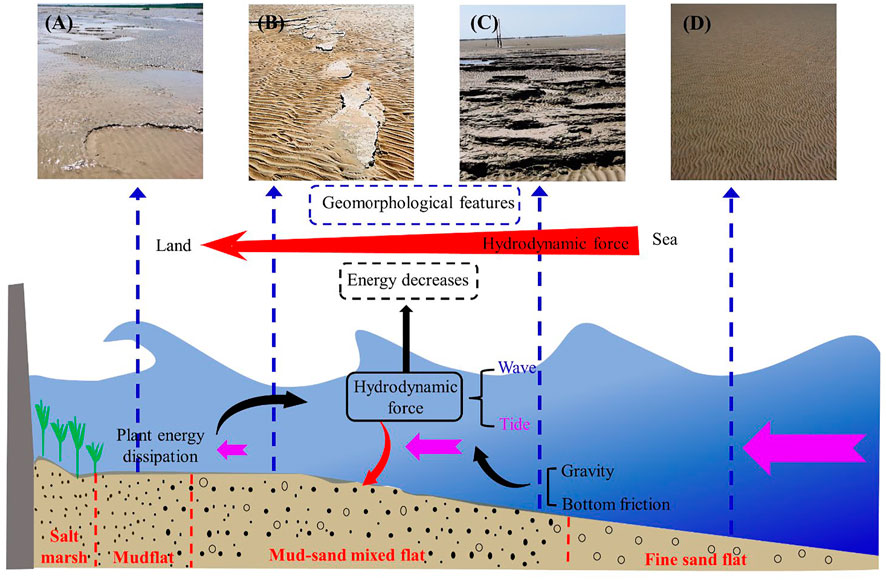
FIGURE 12. Conceptual model of hummocky patches distribution mechanism. The hydrodynamic forces in the tidal flat are mainly tidal currents (pink arrow) and waves. The attenuation of hydrodynamic forces propagating ashore is represented by changes in the size of the tidal current arrow and the shape of the water surface wave. The hydrodynamic forces (red arrow) act on the flat surface and cause the zonation of the tidal flat (red font). (A–D) represent the geomorphological features of the hummocky patches distributed from land to sea in the tidal flat.
The analysis of sediment from sediment cores shows that sediment properties of hummocky patches vary significantly downwards from the surface layer with a clear boundary at around 14 cm (Figure 9), consistent with the height of hummocky patches (14 cm). According to Section 5.1, four sedimentary parameters (σ, clay content, water content, and particle size distribution) are the most important factors affecting erosion resistance of sediments. The vertical variations of these parameters show that erosion resistance is gradually weakened downward (surface sediment is hardest and bottom sediment is the weakest), which determines the development pattern of hummocky patches. Sediment in the lowest part of hummocky patches will be eroded first, while surface sediment which are highly resistant to erosion, are stable over time. This process leads to the hollowing structure of patches. With continuous hollowing of the bottom layer, the upper part of patches that are not easily eroded collapse, usually in the form of blocks, forming uneven surface on hummocky patches. These blocks are difficult to be transported and usually seen at the edge of patches (Figures 13A-C).
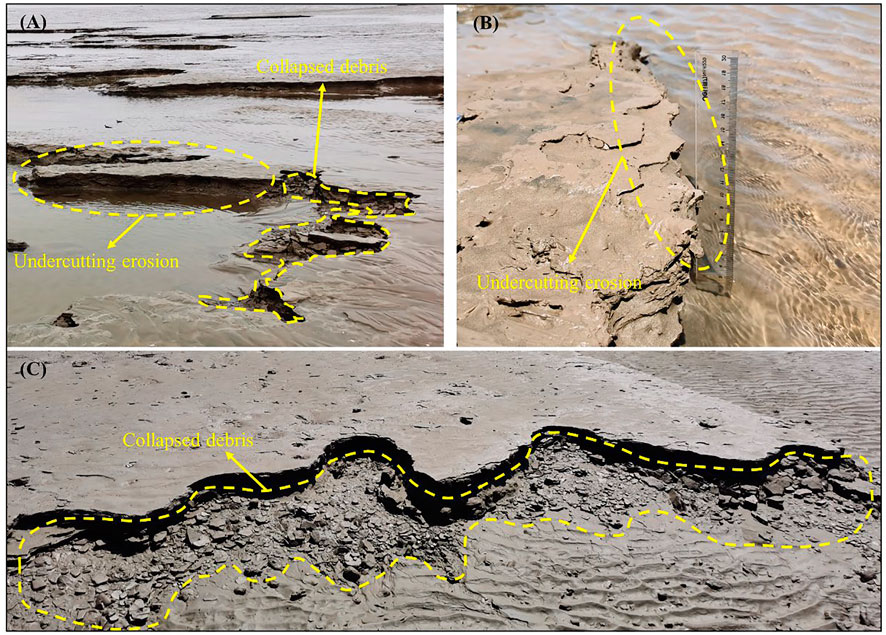
FIGURE 13. Erosion and collapse phenomena appear during the development of hummocky patches. A-C are three well-developed patch units in the middle tidal zone, respectively. A clearly shows the developmental pattern of undercutting erosion and upper sediment debris collapse of the patch; B,C show the undercutting erosion and debris collapse stages of the patch during development, respectively.
One thing worth noting is that there are some inconsistencies between our results and former studies. For example, it has been found that water content largely affects the mechanical properties of cohesive sediments, which is the primary cause for the changes in critical erosion shear stress. However, our results showed that those hummocky patches have a high erosion resistance (2–3 times) compared with the surrounding flat, mainly due to sediment composition and biological effects, while water content was similar between hummocky patches and surrounding flat. We infer that the comparative importance of water content in controlling erosion resistance reduces when there are large spatial variabilities in sediment property and biological activities. The evolution of hummocky patches is the result of long-term mutual coupling of sediment properties and hydrodynamics. During the 16-day observation, hummocky patches survived a spring tide and several wind events, with slight erosion and collapse incidents. Therefore, we did not observe the development and extinction processes of hummocky patches. We planned to investigate the evolution of hummocky patches under a longer time period and extreme dynamic conditions to quantitative evaluate sediment characteristics on critical erosion shear stress under different hydrodynamic conditions (especially extreme events) in our future work.
In this study, we observed a new mesoscale geomorphological unit on sand-mud mixed middle tidal flat zone, which we defined as hummocky patches. We investigated the formation, distribution, and development mechanisms of these hummocky patches from the perspective of sedimentary dynamics with field measurement data. We obtained the following conclusions:
1) The formation, distribution, and development of patches in the tidal flat are mainly influenced by the combination of hydrodynamics, sediment characteristics, and biological effects. The spatial variations in substrate sediment properties, including median grain size, mud content, water content, sorting coefficient, and organic matter content determine erosion threshold of sediment, providing the foundation for the formation of hummocky patches. Among these factors, organic matter content largely reflects the importance of biological activities while other factors are mainly controlled by the hydrodynamic condition of tidal flats. Hummocky patches are characterized with smaller median grain size with diverse sediment composition, higher mud and organic content, comparing to surrounding flat. All these features favor to form higher erosion threshold on hummocky patches. However, water content is similar between hummocky patches and surrounding flat, distinctive from other studies that water content largely controls sediment erosion thresholds on tidal flats. Our results shown that diverse sediment composition and biological activities are two main factors that also significantly affect sediment erosion thresholds, other than water content.
2) Hydrodynamic conditions drive the formation, distribution, and development of hummocky patches. Since the erosion threshold of seabed sediment varies spatially, sediment in areas with smaller erosion threshold are eroded first, while sediment in areas with larger erosion threshold are kept, forming hummocky patches. As soil erosion threshold increases downward due to soil consolidation, the vertical depth of hummocky patches is limited. The maximum depth of hummocky patches observed in this study was 20 cm. In general, the formation of hummocky patches requires a certain extent of hydrodynamic force and substrate soil with large cohesion. The gradual attenuation of hydrodynamic intensity shoreward with increased biological activities result in a higher degree of patch development and more distinguished geomorphic features in the middle tidal flat.
3) Sediment properties along vertical profile of hummocky patches are analyzed, showing a clear boundary at 14 cm from flat surface, which is defined as the depth of the hummocky patch. Mud content and sorting coefficient decreases from surface to bottom, while sediment median grain size and water content increase, indicating a decreasing trend of erosion threshold downward, which controls the extinction pattern of hummocky patches. Due to the small erosion threshold, bottom sediment of patches is weakest and eroded in the first place, while the upper part of the patches is stable over time. The gradual erosion of bottom sediment decreases supporting force for surface sediment on hummocky patches, finally leading to collapse of sediment from surface layer, forming sediment debris.
The original contributions presented in the study are included in the article/Supplementary Material, further inquiries can be directed to the corresponding authors.
The contributions made by each of the authors are listed as follows: 1) YW and FX put forward the idea, designed the experiments and funded the study. 2) SZ processed the main measurements/experiments data and completed the major sections of the manuscript. 3) YC helped making general changes and improvements to the article. 4) WY helped providing partial data and processing data. 5) RL, ML, and BS reviewed this article and made suggestions to improve it.
This study was financially supported by the Jiangsu Special Program for Science and Technology Innovation (JSZRHYKJ202006), the Young Scientists Fund of National Natural Science Foundation of China (42006149), the Open Fund of East China Coastal Field Scientific Observation and Research Station, Ministry of Natural Resources (ORSECCZ2022205), the Program for Scientific Research Start-up Funds of Guangdong Ocean University under contract No. 060302112010, Urban Geological Survey Project of Lianyungang (20170821).
The authors declare that the research was conducted in the absence of any commercial or financial relationships that could be construed as a potential conflict of interest.
All claims expressed in this article are solely those of the authors and do not necessarily represent those of their affiliated organizations, or those of the publisher, the editors and the reviewers. Any product that may be evaluated in this article, or claim that may be made by its manufacturer, is not guaranteed or endorsed by the publisher.
We are also grateful to Dezhi Chen, Chao Gao, Yupeng Pan, Jing Tian, and Jianxiong Sun who participated in the field work.
Allen, J. R. L. (1980). Sand Waves: a Model of Origin and Internal Structure. Sediment. Geol. 26 (4), 281–328. doi:10.1016/0037-0738(80)90022-6
Amos, C. L., Feeney, T., Sutherland, T. F., and Luternauer, J. L. (1997). The Stability of Fine-Grained Sediments from the Fraser River Delta. Estuar. Coast. Shelf Sci. 45 (4), 507–524. doi:10.1006/ecss.1996.0193
Amos, C., Bergamasco, A., Umgiesser, G., Cappucci, S., Cloutier, D., DeNat, L., et al. (2004). The Stability of Tidal Flats in Venice Lagoon—The Results of Iin-Ssitu Measurements Using Two Benthic, Annular Flumes. J. Mar. Syst. 51 (1-4), 211–241. doi:10.1016/j.jmarsys.2004.05.013
Besio, G., Blondeaux, P., and Vittori, G. (2006). On the Formation of Sand Waves and Sand Banks. J. Fluid Mech. 557, 1–27. doi:10.1017/s0022112006009256
Black, K. S., Sun, H., Craig, G., Paterson, D. M., Watson, J., and Tolhurst, T. (2001). Incipient Erosion of Biostabilized Sediments Examined Using Particle-Field Optical Holography. Environ. Sci. Technol. 35 (11), 2275–2281. doi:10.1021/es0014739
Black, K. S., Tolhurst, T. J., Paterson, D. M., and Hagerthey, S. E. (2002). Working with Natural Cohesive Sediments. J. Hydraul. Eng. 128 (1), 2–8. doi:10.1061/(asce)0733-9429(2002)128:1(2)
Blanton, J. O., Lin, G., and Elston, S. A. (2002). Tidal Current Asymmetry in Shallow Estuaries and Tidal Creeks. Cont. Shelf Res. 22 (11-13), 1731–1743. doi:10.1016/s0278-4343(02)00035-3
Boer, P. L. (1981). Mechanical Effects of Micro-organisms on Intertidal Bedform Migration*. Sedimentology 28 (1), 129–132. doi:10.1111/j.1365-3091.1981.tb01670.x
Brand, A., Lacy, J. R., Hsu, K., Hoover, D., Gladding, S., and Stacey, M. T. (2010). Wind‐enhanced Resuspension in the Shallow Waters of South San Francisco Bay: Mechanisms and Potential Implications for Cohesive Sediment Transport. J. Geophys. Res. Oceans 115 (C11). doi:10.1029/2010jc006172
Chang, T. S., Joerdel, O., Flemming, B. W., and Bartholomä, A. (2006). The Role of Particle Aggregation/disaggregation in Muddy Sediment Dynamics and Seasonal Sediment Turnover in a Back-Barrier Tidal Basin, East Frisian Wadden Sea, Southern North Sea. Mar. Geol. 235 (1-4), 49–61. doi:10.1016/j.margeo.2006.10.004
Chen, Y., Thompson, C. E. L., and Collins, M. B. (2012). Saltmarsh Creek Bank Stability: Biostabilisation and Consolidation with Depth. Cont. Shelf Res. 35, 64–74. doi:10.1016/j.csr.2011.12.009
Chen, D., Wang, Y., Melville, B., Huang, H., and Zhang, W. (2018). Unified Formula for Critical Shear Stress for Erosion of Sand, Mud, and Sand-Mud Mixtures. J. Hydraul. Eng. 144 (8), 04018046. doi:10.1061/(asce)hy.1943-7900.0001489
Chen, D., Li, M., Zhang, Y., Zhang, L., Tang, J., Wu, H., et al. (2020). Effects of Diatoms on Erosion and Accretion Processes in Saltmarsh Inferred from Field Observations of Hydrodynamic and Sedimentary Processes. Ecohydrology 13 (8), e2246. doi:10.1002/eco.2246
Chenu, C., and Guérif, J. (1991). Mechanical Strength of Clay Minerals as Influenced by an Adsorbed Polysaccharide. Soil Sci. Soc. Am. J. 55 (4), 1076–1080. doi:10.2136/sssaj1991.03615995005500040030x
Dawkins, C. J. (1939). Tussock Formation by Schoenus Nigricans: the Action of Fire and Water Erosion. J. Ecol. 27 (1), 78–88. doi:10.2307/2256301
Defew, E. C., Tolhurst, T. J., and Paterson, D. M. (2002). Site-specific Features Influence Sediment Stability of Intertidal Flats. Hydrol. Earth Syst. Sci. 6 (6), 971–982. doi:10.5194/hess-6-971-2002
Dott, R. H., and Bourgeois, J. (1982). Hummocky Stratification: Significance of its Variable Bedding Sequences. Geol. Soc. Am. Bull. 93 (8), 663–680. doi:10.1130/0016-7606(1982)93<663:hssoiv>2.0.co;2
Edgar, L. A. (1982). Diatom Locomotion: a Consideration of Movement in a Highly Viscous Situation. Br. Phycol. J. 17 (3), 243–251. doi:10.1080/00071618200650261
French, J., Payo, A., Murray, B., Orford, J., Eliot, M., and Cowell, P. (2016). Appropriate Complexity for the Prediction of Coastal and Estuarine Geomorphic Behaviour at Decadal to Centennial Scales. Geomorphology 256, 3–16. doi:10.1016/j.geomorph.2015.10.005
Gao, S. (2009). Modeling the Preservation Potential of Tidal Flat Sedimentary Records, Jiangsu Coast, Eastern China. Cont. Shelf Res. 29 (16), 1927–1936. doi:10.1016/j.csr.2008.12.010
Gao, S. (2019). “Geomorphology and Sedimentology of Tidal Flats,” in Coastal Wetlands (Elsevier), 359–381. doi:10.1016/b978-0-444-63893-9.00010-1
Gardel, A., Proisy, C., Lesourd, S., Philippe, S., Caillaud, J., Gontharet, S., et al. (2009). A Better Understanding of Mud Cracking Processes Gained from In Situ Measurements on an Intertidal Mudflat in French Guiana. J. Coast. Res. SI (56), 424–428. doi:10.2307/25737611
Gerbersdorf, S. U., Manz, W., and Paterson, D. M. (2008). The Engineering Potential of Natural Benthic Bacterial Assemblages in Terms of the Erosion Resistance of Sediments. FEMS Microbiol. Ecol. 66 (2), 282–294. doi:10.1111/j.1574-6941.2008.00586.x
Grab, S. (1997). Thermal Regime for a Thufa Apex and its Adjoining Depression, Mashai Valley, Lesotho. Permafr. Periglac. Process. 8 (4), 437–445. doi:10.1002/(sici)1099-1530(199710/12)8:4<437::aid-ppp264>3.0.co;2-o
Grabowski, R. C., Droppo, I. G., and Wharton, G. (2010). Estimation of Critical Shear Stress from Cohesive Strength Meter-Derived Erosion Thresholds. Limnol. Ocean. Methods 8 (12), 678–685. doi:10.4319/lom.2010.8.678
Grabowski, R. C., Droppo, I. G., and Wharton, G. (2011). Erodibility of Cohesive Sediment: The Importance of Sediment Properties. Earth-Science Rev. 105 (3-4), 101–120. doi:10.1016/j.earscirev.2011.01.008
Grant, J., Bathmann, U. V., and Mills, E. L. (1986). The Interaction between Benthic Diatom Films and Sediment Transport. Estuar. Coast. Shelf Sci. 23 (2), 225–238. doi:10.1016/0272-7714(86)90056-9
Green, M. O., and Coco, G. (2007). Sediment Transport on an Estuarine Intertidal Flat: Measurements and Conceptual Model of Waves, Rainfall and Exchanges with a Tidal Creek. Estuar. Coast. Shelf Sci. 72 (4), 553–569. doi:10.1016/j.ecss.2006.11.006
Guo, J. (2020). Empirical Model for Shields Diagram and its Applications. J. Hydraul. Eng. 146 (6), 04020038. doi:10.1061/(asce)hy.1943-7900.0001739
Harms, J. C. (1969). Hydraulic Significance of Some Sand Ripples. Geol. Soc. Am. Bull. 80 (3), 363–396. doi:10.1130/0016-7606(1969)80[363:hsossr]2.0.co;2
Hoagland, K. D., Rosowski, J. R., Gretz, M. R., and Roemer, S. C. (1993). Diatom Extracellular Polymeric Substances: Function, Fine Structure, Chemistry, and Physiology. J. Phycol. 29 (5), 537–566. doi:10.1111/j.0022-3646.1993.00537.x
Houwing, E.-J. (1999). Determination of the Critical Erosion Threshold of Cohesive Sediments on Intertidal Mudflats along the Dutch Wadden Sea Coast. Estuar. Coast. Shelf Sci. 49 (4), 545–555. doi:10.1006/ecss.1999.0518
Hughes, P. D. M., and Barber, K. E. (2004). Contrasting Pathways to Ombrotrophy in Three Raised Bogs from Ireland and Cumbria, England. Holocene 14 (1), 65–77. doi:10.1191/0959683604hl690rp
Jia, J., Wang, Y., Gao, S., Wang, A., and Li, Z. (2005). Interpretation of Bed Load Transport and Grain Size Trend Information in Dafeng Tidal Flat, Jiangsu Province. Sci. Bull. 50 (22), 2546–2554. doi:10.3321/j.issn:0023-074X.2005.22.017
Ke, X. (1993). The Ecological System and the Exploitation Mode of Tidal Flat-A Case Study of the Tidal Flat of Dafeng County, Jiangsu Province. J. Nat. Resour. 8 (02), 122–131.
Kirwan, M. L., and Megonigal, J. P. (2013). Tidal Wetland Stability in the Face of Human Impacts and Sea-Level Rise. Nature 504 (7478), 53–60. doi:10.1038/nature12856
Le Roux, J. P., and Rojas, E. M. (2007). Sediment Transport Patterns Determined from Grain Size Parameters: Overview and State of the Art. Sediment. Geol. 202 (3), 473–488. doi:10.1016/j.sedgeo.2007.03.014
Li, Z., Gao, S., and Chen, S. (2007). Characteristics of Tide Induced Bottom Boundary Layers over the Dafeng Intertidal Flats, Jiangsu Province, China. Ocean. Eng. 25, 212–219. doi:10.3969/j.issn.1005-9865.2007.03.008
Li, L., Wang, Y., and Liu, D. (2021). Phytoplankton Shifts in the Central Bohai Sea over the Last 250 Years Reflect Eutrophication and Input from the Yellow River. Ecol. Indic. 126, 107676. doi:10.1016/j.ecolind.2021.107676
Liu, H., He, Q., Wang, Y., and Zhai, X. (2006). OBS Situ Calibration Research in the Turbidity Maximum of the Changjiang Estuary,‚China. J. Sediment Res. 0 (5), 52–58. doi:10.3321/j.issn:0468-155X.2006.05.009
Lundkvist, M., Grue, M., Friend, P. L., and Flindt, M. R. (2007). The Relative Contributions of Physical and Microbiological Factors to Cohesive Sediment Stability. Cont. Shelf Res. 27 (8), 1143–1152. doi:10.1016/j.csr.2006.01.021
Meckel, L. (1975). Holocene Sand Bodies in the Colorado Delta Area. northern Gulf of California: Houston Geological Society.
Meng, X.-m., Jia, Y.-g., Shan, H.-x., Yang, Z.-n., and Zheng, J.-w. (2012). An Experimental Study on Erodibility of Intertidal Sediments in the Yellow River Delta. Int. J. Sediment Res. 27 (2), 240–249. doi:10.1016/s1001-6279(12)60032-8
Murray, A., Knaapen, M., Tal, M., and Kirwan, M. (2008). Biomorphodynamics: Physical‐biological Feedbacks that Shape Landscapes. Water Resour. Res. 44 (11). doi:10.1029/2007wr006410
Panagiotopoulos, I., Voulgaris, G., and Collins, M. B. (1997). The Influence of Clay on the Threshold of Movement of Fine Sandy Beds. Coast. Eng. 32 (1), 19–43. doi:10.1016/s0378-3839(97)00013-6
Parchure, T. M., and Mehta, A. J. (1985). Erosion of Soft Cohesive Sediment Deposits. J. hydraulic Eng. 111 (10), 1308–1326. doi:10.1061/(asce)0733-9429(1985)111:10(1308)
Paterson, D. M., Tolhurst, T. J., Kelly, J. A., Honeywill, C., de Deckere, E. M. G. T., Huet, V., et al. (2000). Variations in Sediment Properties, Skeffling Mudflat, Humber Estuary, UK. Cont. Shelf Res. 20 (10), 1373–1396. doi:10.1016/S0278-4343(00)00028-5
Perkins, R. G., Paterson, D. M., Sun, H., Watson, J., and Player, M. A. (2004). Extracellular Polymeric Substances: Quantification and Use in Erosion Experiments. Cont. Shelf Res. 24 (15), 1623–1635. doi:10.1016/j.csr.2004.06.001
Pieterse, A., Puleo, J. A., and McKenna, T. E. (2016). Hydrodynamics and Sediment Suspension in Shallow Tidal Channels Intersecting a Tidal Flat. Cont. Shelf Res. 119, 40–55. doi:10.1016/j.csr.2016.03.012
Roberts, W., Le Hir, P., and Whitehouse, R. (2000). Investigation Using Simple Mathematical Models of the Effect of Tidal Currents and Waves on the Profile Shape of Intertidal Mudflats. Cont. Shelf Res. 20 (10-11), 1079–1097. doi:10.1016/s0278-4343(00)00013-3
Robinson, T. R., Davies, T. R. H., Reznichenko, N. V., and De Pascale, G. P. (2015). The Extremely Long-Runout Komansu Rock Avalanche in the Trans Alai Range, Pamir Mountains, Southern Kyrgyzstan. Landslides 12 (3), 523–535. doi:10.1007/s10346-014-0492-y
Rogers, J. J., and Head, W. B. (1961). Relationships between Porosity, Median Size, and Sorting Coefficients of Synthetic Sands. J. Sediment. Res. 31 (3), 467–470. doi:10.1306/74d70ba5-2b21-11d7-8648000102c1865d
Sanford, L. P. (2008). Modeling a Dynamically Varying Mixed Sediment Bed with Erosion, Deposition, Bioturbation, Consolidation, and Armoring. Comput. Geosciences 34 (10), 1263–1283. doi:10.1016/j.cageo.2008.02.011
Semeniuk, V. (1981). Long-term Erosion of the Tidal Flats King Sound, North Western Australia. Mar. Geol. 43 (1-2), 21–48. doi:10.1016/0025-3227(81)90127-4
Shi, B. W., Yang, S. L., Wang, Y. P., Yu, Q., and Li, M. L. (2014). Intratidal Erosion and Deposition Rates Inferred from Field Observations of Hydrodynamic and Sedimentary Processes: A Case Study of a Mudflat-Saltmarsh Transition at the Yangtze Delta Front. Cont. Shelf Res. 90, 109–116. doi:10.1016/j.csr.2014.01.019
Shi, B., Wang, Y. P., Wang, L. H., Li, P., Gao, J., Xing, F., et al. (2018). Great Differences in the Critical Erosion Threshold between Surface and Subsurface Sediments: A Field Investigation of an Intertidal Mudflat, Jiangsu, China. Estuar. Coast. Shelf Sci. 206, 76–86. doi:10.1016/j.ecss.2016.11.008
Soulsby, R., and Clarke, S. (2005). Bed Shear-Stress under Combined Waves and Currents on Smooth and Rough Beds (TR 137).
Sumer, B. M., Whitehouse, R. J. S., and Tørum, A. (2001). Scour Around Coastal Structures: a Summary of Recent Research. Coast. Eng. 44 (2), 153–190. doi:10.1016/s0378-3839(01)00024-2
Syvitski, J. P. M., Vörösmarty, C. J., Kettner, A. J., and Green, P. (2005). Impact of Humans on the Flux of Terrestrial Sediment to the Global Coastal Ocean. science 308 (5720), 376–380. doi:10.1126/science.1109454
Takeuchi, S., and Tamaki, A. (2014). Assessment of Benthic Disturbance Associated with Stingray Foraging for Ghost Shrimp by Aerial Survey over an Intertidal Sandflat. Cont. Shelf Res. 84, 139–157. doi:10.1016/j.csr.2014.05.007
Taki, K. (2000). “Critical Shear Stress for Cohesive Sediment Transport,” in Proceedings in Marine Science (Elsevier), 53–61. doi:10.1016/s1568-2692(00)80112-6
Teisson, C., Ockenden, M., Le Hir, P., Kranenburg, C., and Hamm, L. (1993). Cohesive Sediment Transport Processes. Coast. Eng. 21 (1-3), 129–162. doi:10.1016/0378-3839(93)90048-d
Tessler, Z. D., Vörösmarty, C. J., Grossberg, M., Gladkova, I., Aizenman, H., Syvitski, J. P. M., et al. (2015). Profiling Risk and Sustainability in Coastal Deltas of the World. Science 349 (6248), 638–643. doi:10.1126/science.aab3574
Tolhurst, T. J., Black, K. S., Shayler, S. A., Mather, S., Black, I., Baker, K., et al. (1999). Measuring the In Situ Erosion Shear Stress of Intertidal Sediments with the Cohesive Strength Meter (CSM). Estuar. Coast. Shelf Sci. 49 (2), 281–294. doi:10.1006/ecss.1999.0512
Tolhurst, T., Black, K., Paterson, D., Mitchener, H., Termaat, G., and Shayler, S. (2000a). A Comparison and Measurement Standardisation of Four In Situ Devices for Determining the Erosion Shear Stress of Intertidal Sediments. Cont. Shelf Res. 20 (10-11), 1397–1418. doi:10.1016/s0278-4343(00)00029-7
Tolhurst, T. J., Riethmüller, R., and Paterson, D. M. (2000b). In Situ versus Laboratory Analysis of Sediment Stability from Intertidal Mudflats. Cont. shelf Res. 20 (10-11), 1317–1334. doi:10.1016/s0278-4343(00)00025-x
Tolhurst, T. J., Gust, G., and Paterson, D. M. (2002). “The Influence of an Extracellular Polymeric Substance (EPS) on Cohesive Sediment Stability,” in Proceedings in Marine Science (Elsevier), 409–425. doi:10.1016/s1568-2692(02)80030-4
Tolhurst, T. J., Defew, E. C., De Brouwer, J. F. C., Wolfstein, K., Stal, L. J., and Paterson, D. M. (2006). Small-scale Temporal and Spatial Variability in the Erosion Threshold and Properties of Cohesive Intertidal Sediments. Cont. Shelf Res. 26 (3), 351–362. doi:10.1016/j.csr.2005.11.007
Underwood, G. J. C., and Paterson, D. M. (1993). Seasonal Changes in Diatom Biomass, Sediment Stability and Biogenic Stabilization in the Severn Estuary. J. Mar. Biol. Ass. 73 (4), 871–887. doi:10.1017/s0025315400034780
Van Ledden, M., Van Kesteren, W. G. M., and Winterwerp, J. C. (2004). A Conceptual Framework for the Erosion Behaviour of Sand-Mud Mixtures. Cont. Shelf Res. 24 (1), 1–11. doi:10.1016/j.csr.2003.09.002
Vardy, S., Saunders, J. E., Tolhurst, T. J., Davies, P. A., and Paterson, D. M. (2007). Calibration of the High-Pressure Cohesive Strength Meter (CSM). Cont. Shelf Res. 27 (8), 1190–1199. doi:10.1016/j.csr.2006.01.022
Walstra, D. J. R., Ruessink, B. G., Reniers, A. J. H. M., and Ranasinghe, R. (2015). Process-based Modeling of Kilometer-Scale Alongshore Sandbar Variability. Earth Surf. Process. Landforms 40 (8), 995–1005. doi:10.1002/esp.3676
Wang, Y., Gao, S., and Jia, J. (2006). High-resolution Data Collection for Analysis of Sediment Dynamic Processes Associated with Combined Current-Wave Action over Intertidal Flats. Sci. Bull. 51 (7), 866–877. doi:10.1007/s11434-006-0866-1
Wang, Y. P., Gao, S., Jia, J., Thompson, C. E. L., Gao, J., and Yang, Y. (2012). Sediment Transport over an Accretional Intertidal Flat with Influences of Reclamation, Jiangsu Coast, China. Mar. Geol. 291-294, 147–161. doi:10.1016/j.margeo.2011.01.004
Watts, C. W., Tolhurst, T. J., Black, K. S., and Whitmore, A. P. (2003). In Situ measurements of Erosion Shear Stress and Geotechnical Shear Strength of the Intertidal Sediments of the Experimental Managed Realignment Scheme at Tollesbury, Essex, UK. Estuar. Coast. Shelf Sci. 58 (3), 611–620. doi:10.1016/s0272-7714(03)00139-2
Weill, P., Mouazé, D., Tessier, B., and Brun-Cottan, J.-C. (2010). Hydrodynamic Behaviour of Coarse Bioclastic Sand from Shelly Cheniers. Earth Surf. Process. Landforms 35 (14), 1642–1654. doi:10.1002/esp.2004
Weill, P., Tessier, B., Mouazé, D., Bonnot-Courtois, C., and Norgeot, C. (2012). Shelly Cheniers on a Modern Macrotidal Flat (Mont-Saint-Michel Bay, France) - Internal Architecture Revealed by Ground-Penetrating Radar. Sediment. Geol. 279, 173–186. doi:10.1016/j.sedgeo.2010.12.002
Weimer, R. J., Howard, J. D., Lindsay, D. R., Scholle, P., and Spearing, D. (1982). “Tidal Flats and Associated Tidal Channels,” in Sandstone Depositional Environments (Okla: American Association of Petroleum Geologists Tulsa), 191–245. doi:10.1306/m31424c9
Wiberg, P. L., Carr, J. A., Safak, I., and Anutaliya, A. (2015). Quantifying the Distribution and Influence of Non-uniform Bed Properties in Shallow Coastal Bays. Limnol. Oceanogr. Methods 13 (12), 746–762. doi:10.1002/lom3.10063
Widdows, J., Brinsley, M. D., Salkeld, P. N., and Elliott, M. (1998). Use of Annular Flumes to Determine the Influence of Current Velocity and Bivalves on Material Flux at the Sediment-Water Interface. Estuaries 21 (4), 552–559. doi:10.2307/1353294
Winterwerp, J. C., and Van Kesteren, W. G. (2004). Introduction to the Physics of Cohesive Sediment Dynamics in the Marine Environment. Elsevier.
Yang, Y., Gao, S., Zhou, L., Wang, Y., Li, G., Wang, Y., et al. (2017). Classifying the Sedimentary Environments of the Xincun Lagoon, Hainan Island, by System Cluster and Principal Component Analyses. Acta Oceanol. Sin. 36 (4), 64–71. doi:10.1007/s13131-016-0939-1
Zhang, C., Mengpiao, X. U., Zhou, Z., Gong, Z., Kang, Y., and Huan, L. I. (2018). Advances in Cross-Shore Profile Characteristics and Sediment Sorting Dynamics of Tidal Flats. Adv. Water Sci. 29, 269–282. doi:10.14042/j.cnki.32.1309.2018.02.015
Zhou, Z., Ye, Q., and Coco, G. (2016). A One-Dimensional Biomorphodynamic Model of Tidal Flats: Sediment Sorting, Marsh Distribution, and Carbon Accumulation under Sea Level Rise. Adv. Water Resour. 93, 288–302. doi:10.1016/j.advwatres.2015.10.011
Zhu, Q., Yang, S., and Ma, Y. (2014). Intra-tidal Sedimentary Processes Associated with Combined Wave-Current Action on an Exposed, Erosional Mudflat, Southeastern Yangtze River Delta, China. Mar. Geol. 347, 95–106. doi:10.1016/j.margeo.2013.11.005
Keywords: intertidal, geomorphological units, hummocky patches, morphodynamic, critical erosion threshold, wave-current interactions, sedimentation characteristics
Citation: Zhu S, Chen Y, Yan W, Xing F, Li R, Li M, Shi B and Wang YP (2022) The Hummocky Patches and Associated Sediment Dynamics Over an Accretional Intertidal Flat. Front. Earth Sci. 10:908351. doi: 10.3389/feart.2022.908351
Received: 30 March 2022; Accepted: 30 May 2022;
Published: 23 June 2022.
Edited by:
Chong Xu, Ministry of Emergency Management, ChinaCopyright © 2022 Zhu, Chen, Yan, Xing, Li, Li, Shi and Wang. This is an open-access article distributed under the terms of the Creative Commons Attribution License (CC BY). The use, distribution or reproduction in other forums is permitted, provided the original author(s) and the copyright owner(s) are credited and that the original publication in this journal is cited, in accordance with accepted academic practice. No use, distribution or reproduction is permitted which does not comply with these terms.
*Correspondence: Fei Xing, ZnhpbmdAc2tsZWMuZWNudS5lZHUuY24=; Ya Ping Wang, eXB3YW5nQG5qdS5lZHUuY24=
Disclaimer: All claims expressed in this article are solely those of the authors and do not necessarily represent those of their affiliated organizations, or those of the publisher, the editors and the reviewers. Any product that may be evaluated in this article or claim that may be made by its manufacturer is not guaranteed or endorsed by the publisher.
Research integrity at Frontiers
Learn more about the work of our research integrity team to safeguard the quality of each article we publish.