
94% of researchers rate our articles as excellent or good
Learn more about the work of our research integrity team to safeguard the quality of each article we publish.
Find out more
ORIGINAL RESEARCH article
Front. Earth Sci., 29 August 2022
Sec. Solid Earth Geophysics
Volume 10 - 2022 | https://doi.org/10.3389/feart.2022.908234
This article is part of the Research TopicSubduction and Collision Dynamics of Tectonic PlatesView all 15 articles
Subduction of lithospheric plates produces narrow, linear troughs (trench) in front of the overriding plates at the convergent boundaries. The trenches show a wide variation in their topographic characteristics, such as width, vertical depth, and bounding surface slopes. Benchmarking their controlling factors is thus a crucial step in the analysis of trench morphology. This article identifies the mechanical coupling between the subducting and overriding plates as a leading factor in modulating the topographic evolution of a trench. The maximum depth of decoupling (MDD) is used to express the degree of decoupling at the plate interface. We simulate subduction zones in computational fluid dynamic (CFD) models to show the topographic elements (maximum negative relative relief: D; fore- and hinter-wall slopes: θF and θH; opening width: W) of trenches as a function of the MDD within a range of 30–120 km. Both D and θ strongly depend on the MDD, whereas W is found to be relatively less sensitive to the MDD, implying that the narrow/broad width of a trench can change little with the plate decoupling factor. We also show that the MDD critically controls the fore-arc stress fields of a trench, switching a compressive to tensile stress transition with increasing MDD. This study finally validates the model findings with well-constrained natural trench topography.
Mechanical coupling between the participating lithospheric plates (subducting and overriding plates) in subduction zones regulates a range of slab-driven processes, such as earthquake generation (Scholz and Campos, 1995; Ruff and Tichelaar, 1996; Kameda et al., 2011; Lallemand et al., 2018), dehydration melting in mantle wedges (Wada and Wang, 2009; Wada et al., 2012; Lee and Wada, 2017), and overriding plate deformations (Duarte et al., 2013; Willingshofer et al., 2013; Dasgupta and Mandal, 2018). More importantly, this coupling factor plays the most decisive role in the tectonic force transfer from subducting to overriding plates under a given set of tectonic parameters, such as slab age and plate convergence velocity (Kanamori, 1971; Ruff and Kanamori, 1983). A major direction of subduction studies thus focuses on plate-interface processes that critically determine the nature as well as the degree of mechanical coupling between two convergent plates (Wada and Wang, 2009; Syracuse et al., 2010; Abers et al., 2020). It has been shown that a plate interface undergoes two sequential rheological transitions with increasing depth, a brittle-ductile transition at 20–50 km, followed by a transition to viscous coupling at ∼ 70–100 km (Abers et al., 2020). The second rheological transition is assisted mainly by fluid release processes (Schmidt and Poli, 1998; Hacker, 2008), controlled by the pressure-dependent dehydration reactions of amphibole and other abundant hydrous phases in the subducting slab (Tatsumi, 1986; Wada and Wang, 2009).
Heat flow patterns in the across-trench sections of subduction zones reveal the occurrence of cold fore-arcs adjacent to hotter magmatic arc regions (England et al., 2004; Wada and Wang, 2009). Again, high-resolution P-wave tomographic analyses suggest a relatively colder, non-reworked mantle wedge beneath the fore-arc regions (Fukao et al., 1983). These geological observations warrant decoupling of the subducting slab from the overriding lithosphere at shallow levels (Abers et al., 2020). Experimental studies based on viscous rheology and petrological modeling indicate that the slab must restore its coherent, coupled interface with the ambient mantle in a deeper region (Wada et al., 2015; Cerpa et al., 2017). The dehydration reaction of hydrous phases (dominantly amphibole phase) in the subducting slabs occurs at a depth of around 110 km (Tatsumi, 1986), where the fully viscous coupling is observed to start (Wada and Wang, 2009). It is now a well-established fact that the decoupling zone has a finite areal extent down the slab dip, conventionally expressed by the term maximum depth of decoupling (MDD), which has been extensively studied in the context of various geological phenomena, such as earthquake focal distributions, arc volcanism, and exhumation of deep-crustal rocks (Arcay et al., 2007; Wada and Wang, 2009; Syracuse et al., 2010; Butler and Beaumont, 2017; Peacock and Wang, 2021). Although it is difficult to accurately measure the MDD in natural subduction zones (Syracuse et al., 2010), several studies have provided their estimates from indirect proxies, for example, the maximum depth of non-reworked colder subducting crusts (low velocity layers) using high-resolution tomographic images. Compilation of various available estimates yields the MDD in a range of 60–80 km (Wada and Wang, 2009; Abers et al., 2020), whereas cold slabs (Izu Bonin) can develop the deepest decoupling by sediment transport up to 120 km depth (Klein and Behn, 2021).
The degree of plate coupling in most cases is spatially heterogeneous, mainly due to along-trench variations of the geological settings in subduction zones, for example, the South American subduction system (Hu et al., 2021). Several studies have shown the sediment-pile thickness in a trench as one of the important factors in causing such heterogeneity (Iaffaldano et al., 2012; Behr and Becker, 2018; Hu et al., 2021). Low sediment-pile thickness gives rise to greater mechanical coupling, allowing the subducting slab to efficiently transfer the stress for deformation in the overriding plate margins (Scholz and Campos, 1995; Villegas-Lanza et al., 2016). Non-uniform plate coupling in the along-trench direction introduces several complexities in the evolution of a subduction zone. One of their significant effects is reflected in the formation of arcuate trench lines, which are widely reported from convergent tectonic settings (Iaffaldano et al., 2012; Hu et al., 2021). Also, convergent zones can give rise to differential uplift in the orogens with strongly varying seismicity patterns (Gvirtzman and Stern, 2004; Villegas-Lanza et al., 2016).
The preceding discussions suggest that plate coupling is a critical factor in controlling a range of geophysical and geological phenomena, such as earthquake mechanisms, melt generations, geothermal structures, wedge material circulations, trench arcuation, and overriding plate deformations. However, it is virtually unexplored how this factor can influence the development of negative trench topography in a subduction zone. This article focuses on subduction trenches to find the impact of plate decoupling configuration on their topographic evolution. We develop 2D computational fluid dynamic (CFD) models to replicate natural subduction zones and run a series of real-scale (both space and time) CFD simulations with varying plate decoupling conditions (up to 120 km depth, considering a wider range of possibilities). Our model results, combined with those obtained from natural trenches, provide a new insight into the role of the MDD in the development of characteristic trench topography.
In subduction zones, the trenches display characteristic topography, typically defined by a linear, narrow depression between two steeply dipping bounding walls at the contact between the subducting and overriding plates (Figure 1A), termed here as foreland (FW) and hinterland (HW) walls, respectively (Figure 1B). Natural trenches (discussed later in detail) are generally asymmetric, showing unequal FW and HW slopes. We thus treat them with two independent dip angles, θF and θH, as illustrated in Figure 1B. The closing angle, that is, the downward tapering of a trench, is a characteristic topographic parameter, which is expressed as
θT is used as a measure of the closing geometry of a trench, that is, sharp (small θT) or blunt (large θT). Bathymetric profiles show a wide spread of θT (Figure 1A). We consider a point of surface-slope break on the subducting plate (procedure described in Supporting Information) and draw a horizontal line to define the trench opening width (W) at the ocean floor. We take the negative relative relief of the trench trough (T) with respect to the horizontal line drawn at A to measure the maximum vertical depth (D) of a trench. This topographic parameter, D, is used to quantitatively represent shallow and deep trenches, as observed in natural subduction zones. To characterize the trench geometry, we consider an additional parameter,
λ is used as a shape factor. Large λ means a wide, shallow (flat) trench, such as Cascadia, whereas low λ represents an extremely narrow, deep trench, such as the north-east Japan trench (Figure 1A). This parameter allows us to show the sensitivity of the trench morphology to the plate decoupling factor. All these geometrical parameters of trench depression are measured from simulation experiments and compared with those obtained from digital elevation models (SRTM-DEM) of selected natural subduction zones to support our interpretations.
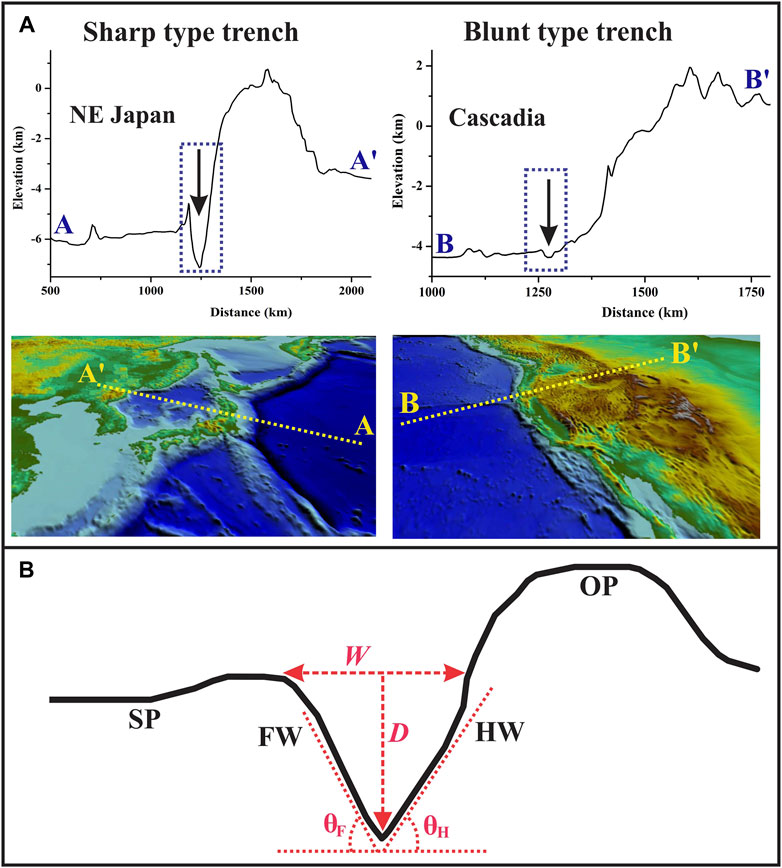
FIGURE 1. (A) Two extreme trench geometries: sharp and blunt from the North East Japan and the Cascadia subduction zones, respectively. (B) Geometrical parameters considered for the analysis of trench topography: trench opening width (W) and maximum negative relative relief (D). θF: fore-wall (FW) slopes on the subducting plate (SP); θH: hinter-wall (HW) slopes on the overriding plate (OP).
A variety of rheologies, ranging from Maxwell visco-elastic to power-law or linear viscous rheology, have been used for subduction modeling (Schmeling et al., 2008; Gerya, 2011 and references therein; Holt et al., 2015). Viscous fluid rheology provides the best rheological approximation to large-scale geodynamic processes on long time scales (million years) (McKenzie et al., 2000). In this study, we thus choose linear viscous rheology to develop subduction models to simulate the trench topography. Assuming the model fluids are incompressible, the stress versus strain-rate relation follows
where
The computational fluid dynamic (CFD) simulations operate fundamentally on the two conservations equations: mass and momentum. Considering mass balance in an elemental fluid volume, the mass conservation equation in tensor notation follows
where ρ is the density and ui represents fluid velocity. The conservation of momentum in a viscous-fluid flow leads to
where p is the hydrostatic pressure,
It is noteworthy that we ignore the effects of surface tension here because the problem concerns a large-scale fluid system.
Eqs 4, 6 were numerically solved using a finite element (FE) code (COMSOL Multiphysics ®, version 5.5) within the framework of CFD. Many earlier studies have used this CFD code to deal with different geodynamic problems, such as mantle convection (He, 2014), magma upwelling (Shahraki and Schmeling, 2012), Rayleigh-Taylor instabilities (Ruffino et al., 2016), mid-ocean ridge development (Montési and Behn, 2007), wedge melting (Lee and Kim, 2021), and plate subduction (Carminati and Petricca, 2010; Rodriguez-Gonzalez et al., 2012). To track the evolving surface of model surface topography, we implemented an arbitrary Lagrangian Eulerian (ALE) scheme, the detailed mathematical formulation of which can be seen in earlier publications (Dasgupta and Mandal, 2022 and Dasgupta et al.,2021a).
The subduction model is conceived to represent a real-scale across-trench vertical section, 6,000 km (length) × 2,900 km (height), covering the entire lower mantle to keep the rigid bottom boundary away from the overriding plate to minimize its effects on the trench evolution (Figure 2A). A proto-subduction zone is introduced to the initial model (cf. Crameri et al., 2017; Dasgupta et al., 2021b), where the subducting slab (400 km length) initially dips beneath the overriding plate (OP) to form an asymmetric configuration, which is the triggering factor to set in subduction in the model (Stern and Gerya, 2018). We consider a 100-km-thick subducting slab, treated as the oceanic lithosphere, to subduct beneath a 120-km-thick overriding plate, treated as the continental lithosphere (Riel et al., 2018; Dasgupta and Mandal, 2022). Both consist of two layers: the crustal layer and the underlying mantle lithosphere (Figure 2A). Their length is chosen in the order of 3,000 km, where the trench is located at the middle point. We consider a stratified mechanical structure of the mantle part beneath the subducting and overriding lithospheric plates: a 540-km- or 520-km-thick upper mantle layer beneath oceanic and continental plates, respectively, a 60-km-thick low viscosity channel (transition zone) and a 2,200-km-thick lower mantle. The densities of the continental crust, oceanic crust, and mantle lithosphere are chosen as 2,800, 3,000, and 3,240 kg/m3, respectively. The densities of the continental mantle lithosphere and underlying mantle in all the experiments were kept as 3,200 kg/m3 (Dasgupta and Mandal, 2018; Dasgupta et al., 2021b).
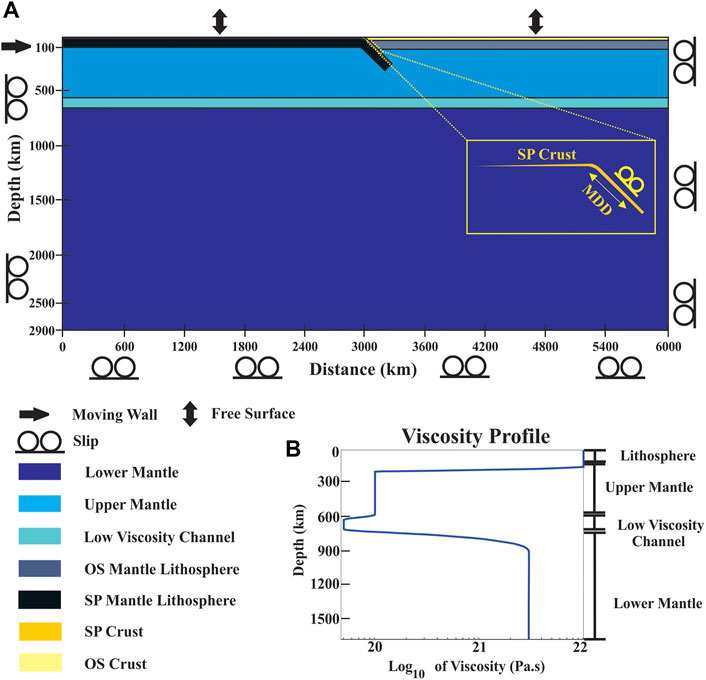
FIGURE 2. (A) Computational fluid dynamic (CFD) model setup used for trench simulations in subduction zones. An oceanic lithosphere (left) subducts beneath a continental overriding plate (right side). A proto subduction is introduced in the initial model setup to initiate the subduction process. The model dimensions, domains, and boundary conditions are explained in the lower panel. (B) Consideration of the initial viscosity–depth profile in the model domain. The domain divisions: upper and lower mantles with an intervening low-viscosity channel are shown in the profile.
Available rheological data provide a wide range of viscosity, from 1024 to 1021 Pa·s, for Earth’s lithosphere (Zhong et al., 1996; Crameri et al., 2017; Cerpa and Arcay, 2020). The long-wavelength analysis and Monte Carlo inversion of geoid data (Hager et al., 1985; Rudolph et al., 2015) suggest that the lower-mantle viscosity is 30 times that of the upper mantle. Several geophysical studies have detected a low-viscosity layer at the base of the mantle transition zone (King, 1995; Harig et al., 2010; Weismüller et al., 2015) (Figure 2B). Based on all these estimates, we consider a depth-dependent viscosity, defined by a smooth, continuous function (up to the second-order derivative) to model the mechanical stratification, where the upper mantle is set at 1020 Pa·s down to a depth of 600 km, whereas the lower mantle viscosity is at 3 × 10²¹ Pa·s (Rudolph et al., 2015). The low-viscosity channel between 640 and 700 km is assigned a value of 5 × 10¹⁹ Pa·s (Kellogg et al., 1999). Using Fjeldskaar’s (1994) model, we introduced a viscosity drop by an order of 102 across the lithospheric base (1022 Pa·s) to represent the upper mantle in our model. The material properties and model parameters are detailed in Supplementary Table S1.
We started our model run with a proto-subduction slab dip of 30° (measured up to a depth of 300 km), as used in much earlier modeling (François et al., 2014; Holt et al., 2015; Jadamec, 2016), imposing a free-slip boundary condition at the bottom and vertical boundaries. In a 20 Myr model simulation, we applied a horizontal velocity (2 cm/yr) at the rear slab boundaries for an initial run time of 3 Myr, and then allowed the proto-subduction to evolve spontaneously under the slab-pull action (Dasgupta et al., 2021a). The simulation run time was chosen to be relatively short (20 Myr) because the subduction topography generally tends to stabilize on a time scale <8 Myr (Zhong and Zuber, 2000; Dasgupta and Mandal, 2018; Dasgupta and Mandal, 2022). The MDD was imposed at the interface between the subducting crust and overriding lithosphere, varying its length from 30 to 120 km (Figure 2A). We chose to keep the top model boundaries under a free surface condition in order to obtain a good approximation of a free vertical movement, producing topography at the model surface (Pysklywec and Shahnas, 2003; Schmalholz, 2011; Crameri et al., 2012; Crameri et al., 2017). We used a perpetual coloring scheme (Crameri et al., 2020) to represent the data true color legends in our model setup.
We first performed reference simulation experiments without introducing any decoupling zone to the subducting–overriding plate interface to validate the model setup chosen in this study. The reference experiment yields time-dependent velocity fields (Figure 3A), which agree well with those reported in previous numerical modeling studies. At 8 Myr of the simulation run, the velocity field at the subducting slab edge shows the highest magnitude of flow (5 cm/yr), mostly due to the sinking slab motion. The flow velocity becomes significantly weaker (0–1.5 cm/yr) in the upper region of the subducting slab as well as the entire overriding plate. The flow vortex at the slab edge progressively becomes more vigorous, both in the velocity magnitude and spatial extent (Figure 3A).
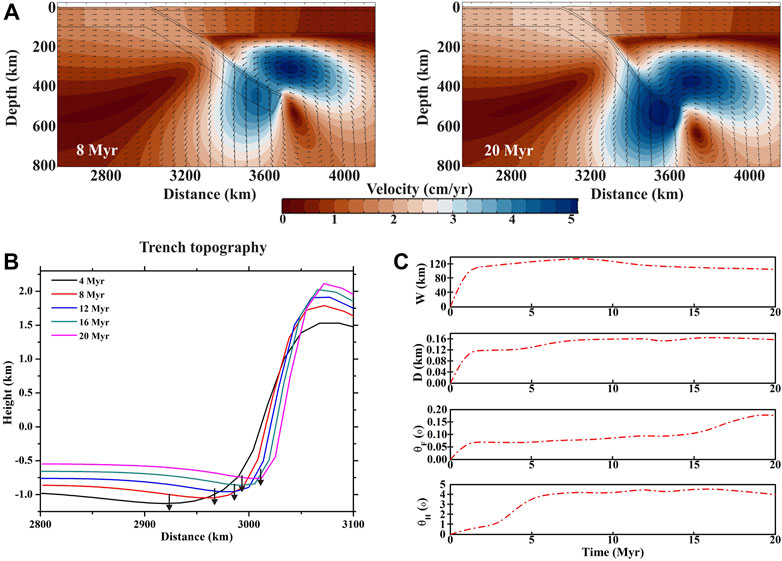
FIGURE 3. (A) Velocity fields produced in the reference experiment corresponding to model run times: 8 and 20 Myr. Note that the subducting slab creates a flow vortex in the mantle, which intensifies with time. (B) A time series plots of absolute topographic elevations of a trench topography in the reference model. (C) Temporal variations of the trench parameters: W (opening width), D (maximum negative relative relief), θH (HW slope), and θF (FW slope) presented from the reference experiment.
The model run depicts the evolution of trench topography, which is presented in Figure 3B. The trench continuously migrates forward (to the overriding plate) at a rate of 2–6 cm/yr. The model calculated topographic elements, W, D, θF, and θH, vary systematically with time (Figure 3C), but all of them tend to attain a steady state after a run time of 2–7 Myr. W (opening width) and D (maximum depth) attain stable values of 80–120 km and 0.12–0.16 km, respectively. We calculated the trench wall slopes, θF and θH, from the topographic elevation differences, the mathematical procedure of which is elaborated in Supplementary (S1). Both θF and θH are found to approach stable values of 0.07–0.1° and 3–4.5°, where θF is always less than θH (Figure 3C), implying that the fore-wall (FW) of the trench is much shallower in dip than its hinter-wall (HW). The shape factor (λ) also shows a consistent temporal variation (Figure 4A), implying an unsteady initial state of the trench geometry. In the early stage (model run time <5 Myr), λ is large (>900), but it non-linearly decreases to 673 at 20 Myr. The temporal variation of λ marks a transition from wide to narrow trench geometry with time (Figure 4A). We calculated the closing trench angle (θT) as a function of model run time (t) to study the evolution of the downward tapering trough geometry of a trench (Figure 4B). θT is found to be large (179°–178°) in the early phase (5 Myr), which decreases to ∼175° after 20 Myr. The non-linear θT—t plot suggests that the trench attains nearly a stable taper geometry on a time scale of 15 Myr.
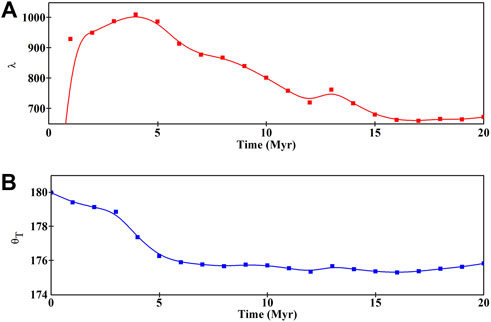
FIGURE 4. Variations of (A) the shape factor (λ = W/D) and (B) downward closing angle (θT) of the trench with time (results from the reference experiment).
We ran a set of simulations by systematically varying the MDD (30–120 km), keeping all other model parameters constant (Supplementary Table S1) to investigate exclusively the control of plate decoupling in the geometrical evolution of trenches. These simulations yield remarkable differences in trench geometry depending on the decoupling factor MDD. It is interesting to note that they always show trench retreat (migration opposite to the subduction direction) with progressive model run time (Figure 5), irrespective of MDD values. The MDD thus hardly influences the mode of trench migration (i.e., retreat versus advance) in our model.
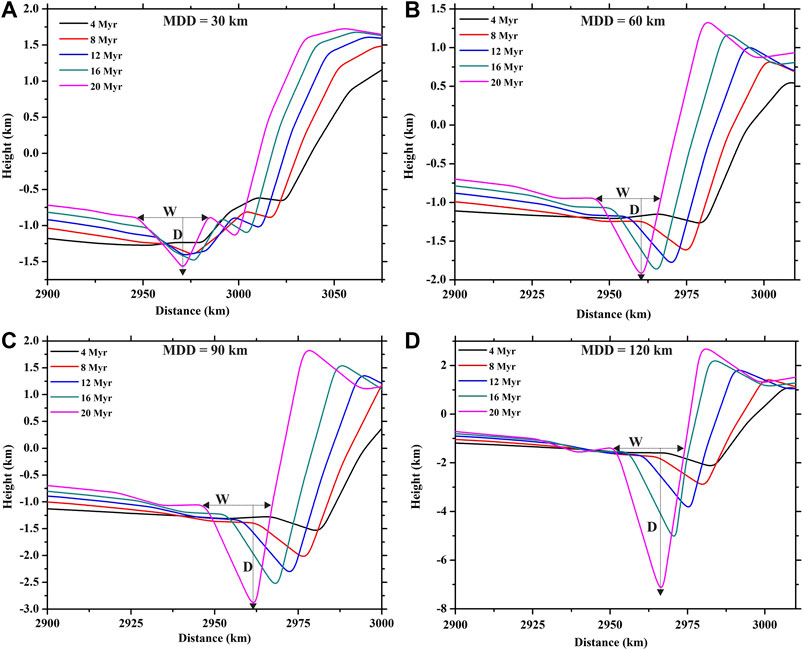
FIGURE 5. (A–D) Time series topographic profiles of subduction zones produced in CFD simulation experiments run with increasing maximum depth of decoupling (MDD): (A) 30 km, (B) 60 km, (C) 90 km, and (D) 120 km.
Experiments with the MDD = 30 km produced a trench with shallow negative topography (0.2–0.5 km), flanked by a flat fore-arc in the overriding plate (Figure 5A). With time, a secondary depression appears on the HW side of the trench due to the decoupling effect at shallow depths. The trenches deepened with time, and at the same time, their FW and HW slopes steepened with progressive subduction. However, the two trench walls evolve differently, where the HW develops a secondary trench depression, which is absent on the FW slope in the subducting slab. Both the major and secondary trench depressions widen and deepen at the same time, while the HW elevation continuously increases its maximum elevation with progressive subduction. At 20 Ma, the principal trench attains a maximum depth of D = 0.5 km, and the HW achieves a maximum relative relief of ∼3.25 km (measured relative to the deepest trench point) at a horizontal distance of ∼75 km from the trench axis.
Experiments with the MDD = 60 km show the evolution of a single trench (Figure 5B), the geometry of which markedly differs from the composite trench architecture produced in the MDD = 30 km model. The simulation on a run time of 4 Ma produces a shallow trench (D = 125 m and W = ∼ 15 km) at a horizontal distance of ∼35 km from the HW arc in the overriding plate (Figure 5B). The trench deepens relatively faster than its opening (W), consequently, to produce a narrow (W = ∼ 20 km), deep trough topography (D = 1 km) at 20 Ma. The trench deepening is associated with a sympathetic increase in the HW elevation, which eventually gives rise to an arc-like structure with a relief of ∼500 m relative to the average surface topography of the overriding plate margin. In this experiment, the trench retreat is a remarkable process in the entire path of trench evolution. However, the trench hardly changes its location with respect to the HW arc. The trench is located at a distance of 25 km, which remains practically unchanged in the run time between 4 Ma and 20 Ma. The model results indicate that the hinter-wall (HW) migrates in the foreland direction to compete with the trench retreat. The trench attains a maximum relative relief (HR: elevation difference between the trench trough and the HW arc) of ∼3 km at 20 Ma. Simulation experiments with the MDD = 90 and 120 km show a similar overall trend of trench evolution but with large quantitative differences in the topographic elements, particularly trench depths (D) and locations, and their HW elevations (Figures 5C,D). For the MDD = 90 km, D = 1.8 km, which multiplies to attain an extremely large value, D = 6 km for the MDD = 120 km. The trench eventually develops a very narrow, deep trough morphology as the trench opening width, W, which is less sensitive to the MDD. The HW arc reciprocates with trench deepening, multiplying its relative topographic elevations by more than two folds, from 750 to 1,800 m. The MDD has an enormous influence on the magnitude of negative relative trench relief (HR); for the MDD = 90 km, HR = 4.5 km at 20 Ma, which nearly doubles to become ∼10 km when the MDD = 120 km λ is consistently low for the MDD = 90 and 120 km, attaining average values of 70 and 50, respectively, after 20 Myr run time. This set of model experiments suggests that the relative relief of trenches can exceed 5 km only when the MDD is more than 90 km, which we will discuss later in the context of data from natural trenches. The trench location with respect to the HW arc topography in the overriding plate does not significantly change with the MDD.
Model simulations show a complex effect of the MDD on the geometrical development of trenches, determined by their temporally varying topographic elements: opening width (W), vertical depth (D), and the bounding FW and HW slopes (θF) and (θH). We first present their time-dependent variations independently as a function of the MDD and then combine them to characterize the possible evolving trends of trenches (Figure 6). W is found to widen with time, irrespective of MDD values chosen in the simulations (Figure 6A). However, the rate of widening at the mature stage
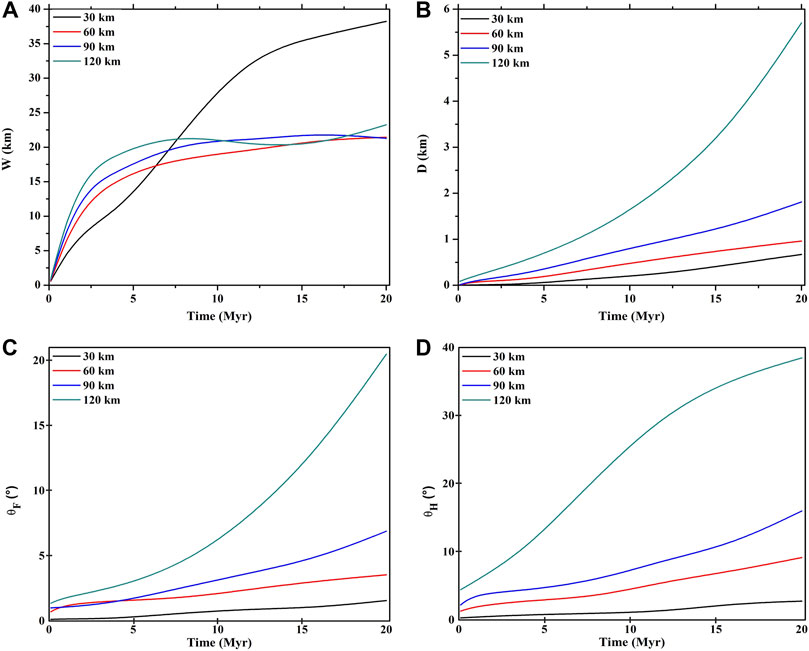
FIGURE 6. Time-dependent variations of the major topographic elements of trenches: (A) opening width (W), (B) maximum trench depth (D), (C) FW slopes (θF), and (D) HW slopes (θH). The graph colors denote MDD values used in the simulation experiments.
We studied the possible impacts of plate decoupling on the evolution of trench wall slopes in progressive subduction. For the MDD = 30 km, both FW and HW slopes (θF and θW) steadily increase their steepness with time, holding the following relation: θH > θF. For example, θF = ∼ 0.7° and ∼1.5°, whereas θH = 1° and 2.8° at 10 and 20 Ma, respectively (Figures 6C,D). An increase of the MDD causes the two trench walls to follow contrasting evolutionary trends, a nearly steady steepening of the FW, whereas a tendency of the HW to stabilize its slope on a time scale of 5–8 Ma. However, the effect of stronger plate decoupling (MDD = 60, 90, and 120 km) is hardly perceptible in the early phase of a trench; it becomes significant in the advanced stages (>10 Ma). For example, θF = 2 to 4.4° at 10 Myr, which increases to 4 to 20.4° at 20 Myr at an average rate of steepening,
The temporal changes of trench morphology (λ and θT) are strongly sensitive to the MDD. The shape factor (λ) yields a consistently high value for the MDD = 30 km (Figure 7A). In the initial stages (5 Myr), λ is as high as 400–500, which decreases to ∼100 at 20 Myr. Increasing MDD = 60, 90, and 120 km consistently reduces λ to 100, 70, and 50 (Figure 7A). The closing geometry (θT) steadily narrows down with run time, irrespective of the MDD values (Figure 7B). However, the magnitude of θT holds an inverse relationship with the MDD.
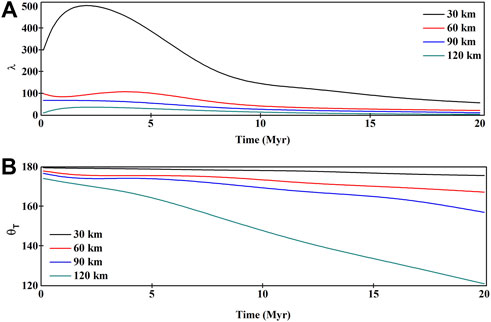
FIGURE 7. Time progression of (A) the shape factor (λ) and (B) the closing angle (θT) of a trench in the simulation experiments for different MDD values (indicated in the graph colors).
A shallow MDD (30 km) favors the compressional stress field (−40 to −32 MPa) to dominate in the plate margins, leaving a weak tensile stress (10–15 MPa) regime at the shallow level (10–15 km) in the overriding plate close to the trench (Figure 8A). An increase in the MDD reduces the compressional stress regime in its spatial extent and strengthens the tensile to neutral stress regime along the decoupling zone, as observed in the simulation experiment with the MDD = 60 km (Figure 8B). However, the compressional regime (−30 to −20 MPa) remains stronger than the tensile stress regime (10–15 MPa) in terms of its magnitudes. The stress fields undergo a dramatic transformation at the MDD = 90 km, allowing the tensile regime to spatially dominate (5–10 MPa) in the overriding plate margin, where the compressional stresses (−25 to −15 MPa) localize preferentially at a deeper level (70–120 km) (Figure 8C). The tensile regime (5–10 MPa) becomes an area-wise major stress field in the overriding plate for the MDD = 120 km (Figure 8D).
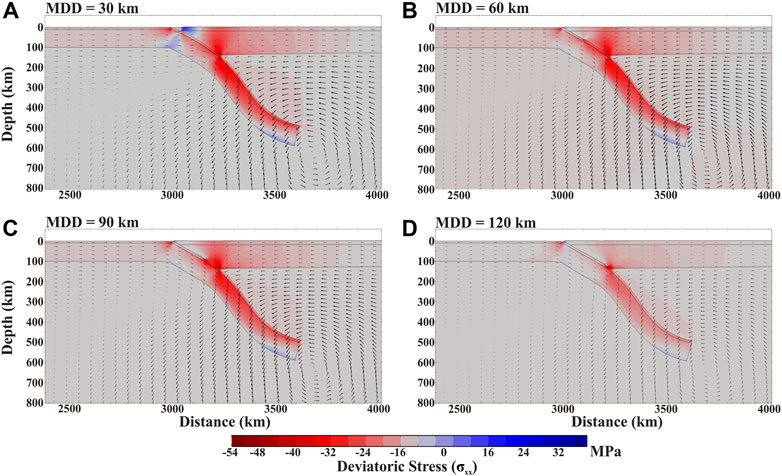
FIGURE 8. (A–D) Deviatoric stress fields of subduction zones for varying MDD in the simulation experiments. Model run time: 10 Myr. Negative and positive stress values represent compressional and extensional stresses, respectively. Arrows show the flow velocity vectors.
The models presented in the preceding section were run with a constant density difference (Δρ) between the subducting slab and the ambient mantle. However, the negative buoyancy of subducting slabs can vary with the lithospheric age, as reported in the existing literature (Cruciani et al., 2005; Dasgupta et al., 2021a), where the slabs become increasingly denser with age. We thus ran additional simulations to test the possible effects of increasing slab buoyancy on the trench topography by varying Δρ in a non-dimensional form:
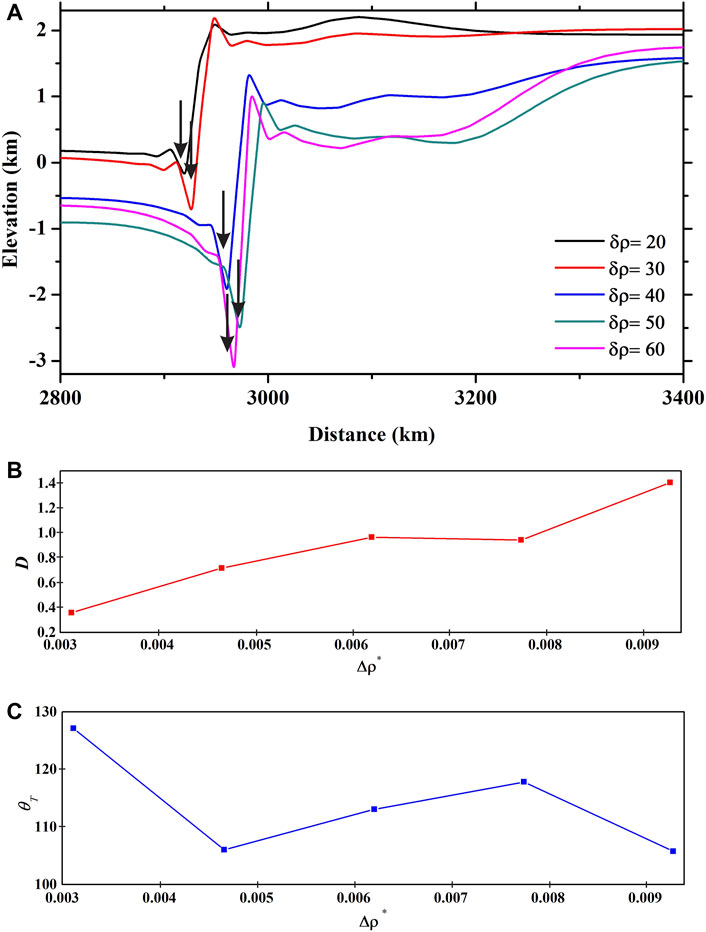
FIGURE 9. (A) Trench topography produced in CFD models for varying subducting slab buoyancy (Δρ). Model run time: 20 Myr. MDD = 60 km. (B) and (C) Plots of the maximum depth (D) and the closing angle (θT) of trenches as a function of slab buoyancy (Δρ*).
Subduction zones operate as an excellent natural laboratory to produce trenches of widely varying geometries in space and time. We first consider their two extreme geometries: sharp and blunt, to discuss their quantitative morphometric differences (Supplementary Figure S1). The Cascadia subduction zone, where the Juan de Fuca plate under-thrusts against the North American plate at a rate of 3.6 cm/yr, displays a shallow, broad (blunt type) trench, flanked by a prominent accretionary prism and an elevated fore-arc, forming the Coastal Ranges. Our estimates from multiple trench normal profiles show a moderate opening width (W ∼ 28.25 km) and a very low depth (D ∼ 0.187 km), and thereby a large shape factor (λ ∼ 172.3) of the trench (Supplementary Figure S1A). The downward closing angle (θT) is ∼178°, satisfying the condition θF < θH. On the other hand, the Northeast Japan subduction zone, where the Pacific plate subducts under the Eurasian plate at a velocity of ∼8 cm/yr, develops a sharp trench at the plate margin (Supplementary Figure S1B). This subduction zone has formed a spectacular volcanic arc complex (Honshu Volcanic Province) and a broad back-arc basin (Japan Sea). This trench shows a wider opening width (W ∼ 88.5 km), but a deep trough (D ∼ 2.8 km), and thereby a relatively low shape factor (λ ∼ 32.2). The closing angle, θT ∼ 172°, is similar to that in the Cascadian setting. The Cascadia and Japan trenches show significant differences in their hinter-wall (HW) slopes, θH = 1.2° and 5.5°, respectively. We will now discuss diverse natural trench morphologies in the context of plate decoupling factors from five selected subduction zones with well-constrained MDD available in the literature (Supplementary Table S2). The MDD of a subduction zone is estimated from the maximum depth of non-reworked oceanic crusts and low velocity zones, revealed by high-resolution teleseismic signals (Supplementary Table S2). We choose representative trench normal sections of the subduction zones to calculate the trench topography utilizing high-resolution SRTM-DEM data (Figures 10A–E).
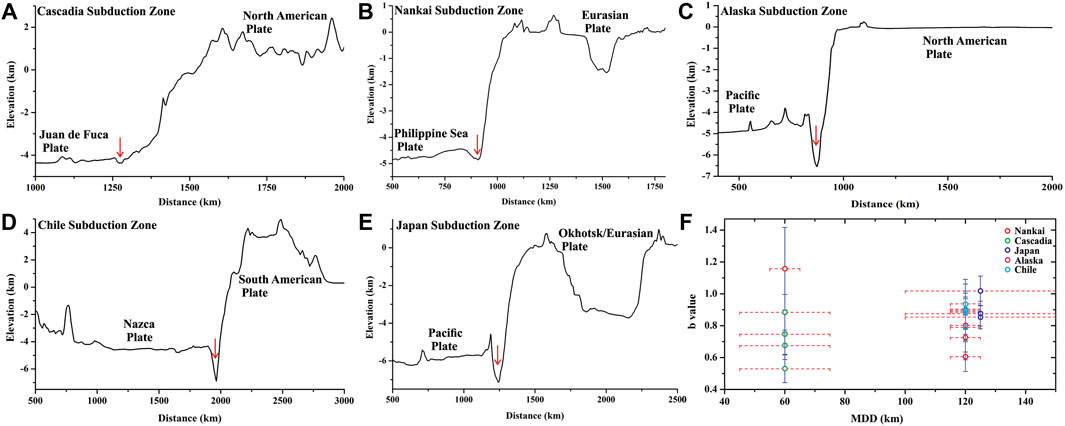
FIGURE 10. (A–E) Trench normal topographic profiles of the Cascadia, Nankai, Alaska, Chile, and Japan subduction zones with increasing trench depths. (F) Plots of the b-values of overriding plate earthquakes in selected natural subduction zones and their corresponding MDD values.
As discussed earlier, the Cascadian trench is shallow (D = 0.12 km), and its maximum relative relief (difference between trough and arc elevations) is HR = 6 km (Figure 10A). Geophysical estimates suggest a low MDD (40–45 km) in this trench. Our model simulations that run with such low MDD yield closely similar topographic reliefs (Figure 5). The Nankai subduction zone shows a deeper trench (D ∼ 0.2 km; Figure 10B) at the boundary between the subducting Philippines Sea plate and the Eurasian overriding plate. Interestingly, the estimated MDD in Nankai is ∼60 km (Hori, 1990; Ohkura, 2000). The Cascadia and Nankai examples validate the model’s predicted trench depth versus MDD relationship (Figure 6). The trench depressions in Alaska, Chile, and Japan subduction zones occur as sharp, narrow, and deep troughs (D ∼ 2–2.8 km) (Figures 10C–E). According to the geophysical estimates, all of them have a large MDD, approximately 100–120 km (Yuan et al., 2000; Kawakatsu and Watada, 2007; Rondenay et al., 2008). The steep FW and HW slopes, and large D agree with the large MDD values. Furthermore, the Nankai subduction zone yields HR ∼ 5.5 km, whereas Chile and Japan subduction zones have HR in the range of 7.5–10 km. The relative relief (HR) between the arc high and the trench trough thus holds a positive correlation with the MDD, as observed in the present model experiments.
The earthquake b-value (the slope of a log-normal distribution of the number of seismic events versus their magnitudes) estimates for the overriding plates of these subduction zones hardly provide any clear correlation with the MDD (Figure 10F). There is a general agreement that smaller b-values signify compression dominated regimes, whereas larger b-values indicate tension dominated settings (Nishikawa and Ide, 2014). Subduction zones with a low MDD yield a wide range of b-values; for example, the Cascadia subduction zone records b-value < 1, whereas the Nankai subduction zone yields b-values > 1. A similar mismatch is encountered in subduction zones with a large MDD (100–120 km). For example, the Japan and Chile subduction zones record high as well as low b-values, whereas the Alaska subduction zone, though similar in geological setting, dominantly yields low b-values. This discussion leads us to suggest that earthquake b-value estimates cannot be used solely as a proxy to detect any conclusive difference in the plate coupling dynamics.
To compare the geometrical elements of the steady-state model trench topography with natural observations, we calculated trench opening width (W), depth (D), and its wall slopes on the subducting (θF) and overriding (θH) plates. Also, the shape factor (λ) and the closing geometry (θT) of trenches are taken into account for the comparative analysis. Natural subduction zones generally show significant along-trench variations in their trench morphology. Keeping this heterogeneity in mind, we compiled multiple trench perpendicular sections to define a range of values for the geometrical parameters, instead of their single representative value (Supplementary Table S2). Also, previous studies suggested that plate decoupling becomes most effective in mature subduction zones (10–20 Myr old). We thus compiled the experimental data for a 10–20 Myr model run time. Figure 11A presents a synthesis of data from natural subduction zones. W is found to increase with increasing MDD values, where the Cascadia subduction zone (MDD = 60 km) and the Japan subduction zone (MDD = 125 km) yield an average W = 28 and 103 km, respectively. However, our CFD experiments yield W in a narrow range (20–40 km) for varying MDD. We find an excellent model–nature correlation in terms of their trench depths (D), where both model and natural findings suggest a steady increase of D with increasing MDD (Figure 11B). Natural subduction zones with low MDD values (45–60 km), like Cascadia and Nankai, show trenches with D ∼ 0.2–0.7 km, whereas the Japan and Chile subduction zones (MDD = 100–120 km) show trenches with D ∼ 2–3.8 km values. Similarly, our simulation experiments produce D ∼ 0.5–1 km for MDD = 30–60 km, which increases to 2–5.5 km when MDD = 90–120 km. The effects of the MDD in different natural subduction zones are also reflected in their respective θF and θH values. The Cascadia subduction zone (MDD = 45–60 km) yields lower θF and θH (0.2–1.2° and 0.8–1.7°), whereas the Alaska subduction zone (MDD = 100–120 km) gives rise to significantly larger θF and θH (3.5–6.5°, and 6–10.5°). The simulation experiments for MDD = 30 km produce smaller θF and θH (0.9–1.5° and 1.2–2.7°), whereas those with MDD = 120 km give rise to significantly larger θF and θH (8–20.4° and 30.3–38.4°). It is interesting to note that both experimental and natural trenches always satisfy the condition θF < θH (Figures 11C,D).
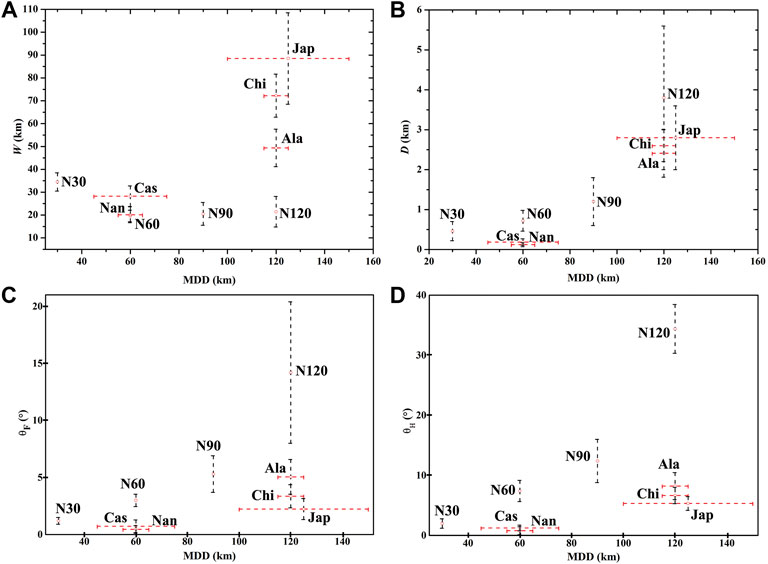
FIGURE 11. (A–D) Comparison of the trench parameters: (A) W, (B) D, (C) θF, and (D) θH of selected natural subduction zones with the model results for varying maximum depth of decoupling (MDD). N30, N60, N90, and N120 points represent numerical experiment results with 30, 60, 90, and 120 km MDD values, respectively. Subduction zone abbreviations: Cascadia-Cas; Nankai-Nan; Chile-Chi; Alaska-Ala; Japan-Jap.
The shape factor (λ) of both natural and model trenches holds an inverse relationship with their respective MDD values (Figure 12A). The Cascadia and Nankai subduction zones, having smaller MDD values (45–60 km), yield λ in the range of 200–150. Similarly, the experiments with MDD = 30 km develop trenches with λ ∼ 150–50. On the other hand, subduction zones, like Japan and Chile (MDD = 100–120 km), have λ < 50, which is similar to the experimental λ values (<30) for MDD = 120 km. The closing geometry (θT) that shows an inverse relation with MDD in experiments is correlated well with the natural data (Figure 12B). Subduction zones, like Cascadia (MDD = 45–60 km) and Japan (MDD = 120 km), have θT values of 178 and 170°, respectively. On the other hand, the MDD = 30 and 90 km models yield θT ∼ 176 and 162°, respectively.
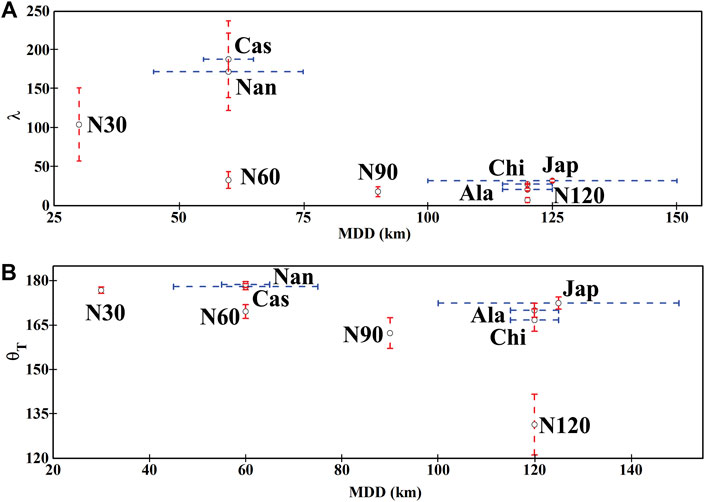
FIGURE 12. Correlations of (A) the shape factor (λ) and (B) closing angle (θT) versus MDD plots between selected natural subduction zones and the model experiments. N30, N60, N90, and N120 points represent numerical experiment results with 30, 60, 90, and 120 km MDD values, respectively. Subduction zone abbreviations: Cascadia-Cas; Nankai-Nan; Chile-Chi; Alaska-Ala; Japan-Jap.
The comparison of the model trench topography with nature accounts for entirely the first-order reliefs, that is, long-wavelength topographic elements attributed to tectonic processes, such as flexural deformation and mantle flows. Our model excludes a number of additional factors, for example, crustal thickening, magmatic accretion, and surface erosion/deposition of sediments that can influence the topography at varied wavelengths. In addition, the topographic features of a trench, such as its topographic slopes, can be influenced by secondary factors, like plastic rheological failure of the bounding walls and surface material transport, which are excluded in the present modeling. Due to this model limitation, some of our model calculations, especially for extreme values of MDD =120 km, probably overestimate the trench-wall slopes as compared to those calculated from natural systems. Moreover, we have modeled the lithospheric slabs and the underlying mantle, excluding the possible effects of petrological reactions such as dehydration melting and the Clapeyron slope of phase changes. Based on the available data (Ranalli, 1995), the maximum lithospheric viscosity in this model was set in the order of 1022 Pa·s. However, the values in cases become as high as 1023 Pa·s (Ribe, 2010; Garel et al., 2014). These limitations leave a scope for advancing the present model findings with a wider spectrum of rheological considerations, such as high lithospheric viscosity and complex non-linear rheology, for example, power–law.
1) The first-order geometry of oceanic trenches is sensitive to the maximum depth of decoupling (MDD) at the plate interface of subduction zones. Their maximum negative relative relief (D) increases with increasing MDD, where MDD = 30 and 120 km with yield mature stage D values of ∼0.5 and 5.5 km, respectively. Natural subduction zones show a weakly positive correlation of trench opening width (W) with MDD, which agrees with the experimental results for a limited run time. This difference occurs possibly due to some limitation in our model. 2) The wall slopes of a trench on the subducting plate (θF) and the overriding plate (θH) steepen with increasing MDD. For example, MDD = 30 km produces a trench with θF = 1.5° and θH = 2.77°, which increase to 20.4° and 38.46°, respectively, for MDD = 120 km experiments. 3) Subduction zones develop trenches always satisfying the condition θF < θH, irrespective of their MDD. 4) Increasing negative slab buoyancy further enhances D and reduces the downward tapering angles (θT) of trenches, for example, Δρ* = 0.0031 and 0.0092 gives rise to D = 0.35, 1.4 km and θT = 128°, 105.4°, respectively. 5) Mechanical decoupling at the plate interface facilitates the process of trench retreat, whereas coherent coupling with initial ridge push force favors trench advancement, as revealed from the reference experiment.
The original contributions presented in the study are included in the article/Supplementary Material. Further queries and data are available upon request from the corresponding author.
RD performed the research, analyzed the results, and wrote the manuscript. NM supervised the project, and provided guidance and support. All authors contributed to the article and approved the submitted version.
J. C. Bose Fellowship (SR/S2/JCB-36/2012) awarded to NM.
We thank Editor Manuele Faccenda and two reviewers for their thorough and constructive reviews at different stages, which substantially improved the scientific content of this study. Discussions with Dr. Changyeol Lee and Mr. Joyjeet Sen came as additional benefits for our manuscript. NM thanks the SERB, Department of Science and Technology, India, for supporting him through the J. C. Bose Fellowship (SR/S2/JCB-36/2012). RD gratefully thanks the University Grants Commission, India, for providing him with the research fellowship [Sr No. 2061420432; Ref. No: 22/06/2014 (i) EU-V].
The authors declare that the research was conducted in the absence of any commercial or financial relationships that could be construed as a potential conflict of interest.
All claims expressed in this article are solely those of the authors and do not necessarily represent those of their affiliated organizations, or those of the publisher, the editors, and the reviewers. Any product that may be evaluated in this article, or claim that may be made by its manufacturer, is not guaranteed or endorsed by the publisher.
The Supplementary Material for this article can be found online at: https://www.frontiersin.org/articles/10.3389/feart.2022.908234/full#supplementary-material
Abers, G. A., van Keken, P. E., and Wilson, C. R. (2020). Deep decoupling in subduction zones: Observations and temperature limits. Geosphere 16 (6), 1408–1424. doi:10.1130/ges02278.1
Arcay, D., Tric, E., and Doin, M. P. (2007). Slab surface temperature in subduction zones: Influence of the interplate decoupling depth and upper plate thinning processes. Earth Planet. Sci. Lett. 255 (3-4), 324–338. doi:10.1016/j.epsl.2006.12.027
Behr, W. M., and Becker, T. W. (2018). Sediment control on subduction plate speeds. Earth Planet. Sci. Lett. 502, 166–173. doi:10.1016/j.epsl.2018.08.057
Butler, J. P., and Beaumont, C. (2017). Subduction zone decoupling/retreat modeling explains south Tibet (Xigaze) and other supra-subduction zone ophiolites and their UHP mineral phases. Earth Planet. Sci. Lett. 463, 101–117. doi:10.1016/j.epsl.2017.01.025
Carminati, E., and Petricca, P. (2010). State of stress in slabs as a function of large‐scale plate kinematics. Geochem. Geophys. Geosyst. 11 (4). doi:10.1029/2009gc003003
Cerpa, N. G., and Arcay, D. (2020). Overriding plate velocity control on surface topography in 2‐D models of subduction zones. Geochem. Geophys. Geosyst. 21 (4), e2019GC008900. doi:10.1029/2019gc008900
Cerpa, N. G., Wada, I., and Wilson, C. R. (2017). Fluid migration in the mantle wedge: Influence of mineral grain size and mantle compaction. J. Geophys. Res. Solid Earth 122 (8), 6247–6268. doi:10.1002/2017jb014046
Crameri, F., Lithgow-Bertelloni, C. R., and Tackley, P. J. (2017). The dynamical control of subduction parameters on surface topography. Geochem. Geophys. Geosyst. 18 (4), 1661–1687. doi:10.1002/2017gc006821
Crameri, F., Shephard, G. E., and Heron, P. J. (2020). The misuse of colour in science communication. Nat. Commun. 11 (1), 5444–5510. doi:10.1038/s41467-020-19160-7
Crameri, F., Tackley, P. J., Meilick, I., Gerya, T. V., and Kaus, B. J. P. (2012). A free plate surface and weak oceanic crust produce single‐sided subduction on Earth. Geophys. Res. Lett. 39 (3). doi:10.1029/2011gl050046
Cruciani, C., Carminati, E., and Doglioni, C. (2005). Slab dip vs. lithosphere age: no direct function. Earth Planetary Sci. Let. 238 (3–4), 298–310.
Dasgupta, R., Mandal, N., and Lee, C. (2021a). Controls of subducting slab dip and age on the extensional versus compressional deformation in the overriding plate. Tectonophysics 801, 228716. doi:10.1016/j.tecto.2020.228716
Dasgupta, R., and Mandal, N. (2022). Role of double-subduction dynamics in the topographic evolution of the Sunda plate. Geophys. J. Int. 230, 696–713. doi:10.1093/gji/ggac025
Dasgupta, R., and Mandal, N. (2018). Surface topography of the overriding plates in bi-vergent subduction systems: A mechanical model. Tectonophysics 746, 280–295. doi:10.1016/j.tecto.2017.08.008
Dasgupta, R., Sen, J., and Mandal, N. (2021b). Bending curvatures of subducting plates: Old versus young slabs. Geophys. J. Int. 225 (3), 1963–1981. doi:10.1093/gji/ggab070
Duarte, J. C., Schellart, W. P., and Cruden, A. R. (2013). Three-dimensional dynamic laboratory models of subduction with an overriding plate and variable interplate rheology. Geophys. J. Int. 195 (1), 47–66. doi:10.1093/gji/ggt257
England, P., Engdahl, R., and Thatcher, W. (2004). Systematic variation in the depths of slabs beneath arc volcanoes. Geophys. J. Int. 156 (2), 377–408. doi:10.1111/j.1365-246x.2003.02132.x
Fjeldskaar, W. (1994). Viscosity and thickness of the asthenosphere detected from the Fennoscandian uplift. Earth Planet. Sci. Lett. 126, 399–410. doi:10.1016/0012-821x(94)90120-1
François, T., Burov, E., Agard, P., and Meyer, B. (2014). Buildup of a dynamically supported orogenic plateau: Numerical modeling of the Zagros/Central Iran case study. Geochem. Geophys. Geosyst. 15 (6), 2632–2654. doi:10.1002/2013gc005223
Fukao, Y., Hori, S., and Ukawa, M. (1983). A seismological constraint on the depth of basalt–eclogite transition in a subducting oceanic crust. Nature 303 (5916), 413–415. doi:10.1038/303413a0
Garel, F., Goes, S., Davies, D. R., Davies, J. H., Kramer, S. C., and Wilson, C. R. (2014). Interaction of subducted slabs with the mantle transition-zone: A regime diagram from 2-D thermo-mechanical models with a mobile trench and an overriding plate. Geochem. Geophys. Geosyst. 15 (5), 1739–1765. doi:10.1002/2014gc005257
Gerya, T. (2011). Future directions in subduction modeling. J. Geodyn. 52 (5), 344–378. doi:10.1016/j.jog.2011.06.005
Gvirtzman, Z., and Stern, R. J. (2004). Bathymetry of Mariana trench‐arc system and formation of the Challenger Deep as a consequence of weak plate coupling. Tectonics 23 (2). doi:10.1029/2003tc001581
Hager, B. H., Clayton, R. W., Richards, M. A., Comer, R. P., and Dziewonski, A. M. (1985). Lower mantle heterogeneity, dynamic topography and the geoid. Nature 313 (6003), 541–545. doi:10.1038/313541a0
Harig, C., Zhong, S., and Simons, F. (2010). Constraints on upper mantle viscosity from the flow-induced pressure gradient across the Australian continental keel. Geochem. Geophys. Geosyst. 11, n/a. doi:10.1029/2010gc003038
He, L. (2014). Numerical modeling of convective erosion and peridotite-melt interaction in big mantle wedge: Implications for the destruction of the North China Craton. J. Geophysical Res. Solid Earth 119 (4), 3662–3677.
Holt, A. F., Becker, T. W., and Buffett, B. A. (2015). Trench migration and overriding plate stress in dynamic subduction models. Geophys. J. Int. 201 (1), 172–192. doi:10.1093/gji/ggv011
Hori, S. (1990). Seismic waves guided by untransformed oceanic crust subducting into the mantle: The case of the kanto district, central Japan. Tectonophysics 176 (3-4), 355–376. doi:10.1016/0040-1951(90)90078-m
Hu, J., Liu, L., and Gurnis, M. (2021). Southward expanding plate coupling due to variation in sediment subduction as a cause of Andean growth. Nat. Commun. 12 (1), 7271–7279. doi:10.1038/s41467-021-27518-8
Iaffaldano, G., Di Giuseppe, E., Corbi, F., Funiciello, F., Faccenna, C., and Bunge, H. P. (2012). Varying mechanical coupling along the Andean margin: Implications for trench curvature, shortening and topography. Tectonophysics 526, 16–23. doi:10.1016/j.tecto.2011.09.014
Jadamec, Margarete A. (2016). Insights on slab-driven mantle flow from advances in three-dimensional modelling. J. Geodyn. 100, 51–70. doi:10.1016/j.jog.2016.07.004
Kameda, J., Yamaguchi, A., Saito, S., Sakuma, H., Kawamura, K., and Kimura, G. (2011). A new source of water in seismogenic subduction zones. Geophys. Res. Lett. 38 (22). doi:10.1029/2011gl048883
Kanamori, H. (1971). Great earthquakes at island arcs and the lithosphere. Tectonophysics 12 (3), 187–198. doi:10.1016/0040-1951(71)90003-5
Kawakatsu, H., and Watada, S. (2007). Seismic evidence for deep-water transportation in the mantle. Science 316 (5830), 1468–1471. doi:10.1126/science.1140855
Kellogg, L., Hager, B., and van der Hilst, R. (1999). Compositional stratification in the deep mantle. Science 283, 1881–1884. doi:10.1126/science.283.5409.1881
Klein, B. Z., and Behn, M. D. (2021). On the evolution and fate of sediment diapirs in subduction zones. Geochem. Geophys. Geosyst. 22 (11), e2021GC009873. doi:10.1029/2021gc009873
Lallemand, S., Peyret, M., van Rijsingen, E., Arcay, D., and Heuret, A. (2018). Roughness characteristics of oceanic seafloor prior to subduction in relation to the seismogenic potential of subduction zones. Geochem. Geophys. Geosyst. 19 (7), 2121–2146. doi:10.1029/2018gc007434
Lee, C., and Kim, Y. (2021). Role of warm subduction in the seismological properties of the forearc mantle: An example from southwest Japan. Sci. Adv. 7 (28), eabf8934. doi:10.1126/sciadv.abf8934
Lee, C., and Wada, I. (2017). Clustering of arc volcanoes caused by temperature perturbations in the back-arc mantle. Nat. Commun. 8 (1), 15753–15759. doi:10.1038/ncomms15753
McKenzie, D., Nimmo, F., Jackson, J. A., Gans, P. B., and Miller, E. L. (2000). Characteristics and consequences of flow in the lower crust. J. Geophys. Res. 11029, 11029–11046. doi:10.1029/1999jb900446
Montési, L. G., and Behn, M. D. (2007). Mantle flow and melting underneath oblique and ultraslow mid‐ocean ridges. Geophys. Res. Lett. 34 (24), L24307. doi:10.1029/2007gl031067
Nishikawa, T., and Ide, S. (2014). Earthquake size distribution in subduction zones linked to slab buoyancy. Nat. Geosci. 7 (12), 904–908. doi:10.1038/ngeo2279
Ohkura, T. (2000). Structure of the upper part of the Philippine Sea plate estimated by later phases of upper mantle earthquakes in and around Shikoku, Japan. Tectonophysics 321 (1), 17–36. doi:10.1016/s0040-1951(00)00078-0
Peacock, S. M., and Wang, K. (2021). On the stability of talc in subduction zones: A possible control on the maximum depth of decoupling between the subducting plate and mantle wedge. Geophys. Res. Lett. 48 (17), e2021GL094889. doi:10.1029/2021gl094889
Pysklywec, R. N., and Shahnas, M. H. (2003). Time-dependent surface topography in a coupled crust–mantle convection model. Geophys. J. Int. 154 (2), 268–278. doi:10.1046/j.1365-246x.2003.01987.x
Ranalli, G. (1995). Rheology of the Earth. Springer Science & Business Media. ISBN 978-0-412-54670-9.
Ribe, N. M. (2010). Bending mechanics and mode selection in free subduction: A thin-sheet analysis. Geophys. J. Int. 180 (2), 559–576. doi:10.1111/j.1365-246x.2009.04460.x
Riel, N., Capitanio, F. A., and Velic, M. (2018). Numerical modeling of stress and topography coupling during subduction: Inferences on global vs. regional observables interpretation. Tectonophysics 746, 239–250. doi:10.1016/j.tecto.2017.07.023
Rodríguez-González, J., Negredo, A. M., and Billen, M. I. (2012). The role of the overriding plate thermal state on slab dip variability and on the occurrence of flat subduction. Geochem. Geophys. Geosyst. 13 (1). doi:10.1029/2011gc003859
Rondenay, S., Abers, G. A., and Van Keken, P. E. (2008). Seismic imaging of subduction zone metamorphism. Geol. 36 (4), 275–278. doi:10.1130/g24112a.1
Rudolph, M. L., Lekić, V., and Lithgow-Bertelloni, C. (2015). Viscosity jump in Earth’s mid-mantle. Science 350 (6266), 1349–1352. doi:10.1126/science.aad1929
Ruff, L. J., and Tichelaar, B. W. (1996). What controls the seismogenic plate interface in subduction zones? Washington DC: American Geophysical Union Geophysical Monograph Series, 105–111. doi:10.1029/GM096p0105
Ruff, L., and Kanamori, H. (1983). Seismic coupling and uncoupling at subduction zones. Tectonophysics 99 (2-4), 99–117. doi:10.1016/0040-1951(83)90097-5
Ruffino, F., Gentile, A., Zimbone, M., Piccitto, G., Reitano, R., and Grimaldi, M. G. (2016). Size-selected Au nanoparticles on FTO substrate: Controlled synthesis by the Rayleigh-Taylor instability and optical properties. Superlattices Microstruct. 100, 418–430. doi:10.1016/j.spmi.2016.09.047
Schmalholz, S. M. (2011). A simple analytical solution for slab detachment. Earth Planet. Sci. Lett. 304 (1-2), 45–54. doi:10.1016/j.epsl.2011.01.011
Schmeling, H., Babeyko, A. Y., Enns, A., Faccenna, C., Funiciello, F., Gerya, T., et al. (2008). A benchmark comparison of spontaneous subduction models-Towards a free surface. Phys. Earth Planet. Interiors 171 (1–4), 198–223. doi:10.1016/j.pepi.2008.06.028
Schmidt, M. W., and Poli, S. (1998). Experimentally based water budgets for dehydrating slabs and consequences for arc magma generation. Earth Planetary Science Lett. 163 (1–4), 361–379.
Scholz, C. H., and Campos, J. (1995). On the mechanism of seismic decoupling and back arc spreading at subduction zones. J. Geophys. Res. 100 (B11), 22103–22115. doi:10.1029/95jb01869
Shahraki, M., and Schmeling, H. (2012). Plume-induced geoid anomalies from 2D axi-symmetric temperature-and pressure-dependent mantle convection models. J. Geodyn. 59, 193–206. doi:10.1016/j.jog.2012.01.006
Stern, R. J., and Gerya, T. (2018). Subduction initiation in nature and models: A review. Tectonophysics 746, 173–198. doi:10.1016/j.tecto.2017.10.014
Syracuse, E. M., van Keken, P. E., and Abers, G. A. (2010). The global range of subduction zone thermal models. Phys. Earth Planet. Interiors 183 (1-2), 73–90. doi:10.1016/j.pepi.2010.02.004
Tatsumi, Y. (1986). Formation of the volcanic front in subduction zones. Geophys. Res. Lett. 13 (8), 717–720. doi:10.1029/gl013i008p00717
Villegas-Lanza, J. C., Chlieh, M., Cavalié, O., Tavera, H., Baby, P., Chire-Chira, J., et al. (2016). Active tectonics of Peru: Heterogeneous interseismic coupling along the Nazca megathrust, rigid motion of the Peruvian Sliver, and Subandean shortening accommodation. J. Geophys. Res. Solid Earth 121 (10), 7371–7394. doi:10.1002/2016jb013080
Wada, I., Behn, M. D., and Shaw, A. M. (2012). Effects of heterogeneous hydration in the incoming plate, slab rehydration, and mantle wedge hydration on slab-derived H2O flux in subduction zones. Earth Planet. Sci. Lett. 353, 60–71. doi:10.1016/j.epsl.2012.07.025
Wada, I., He, J., Hasegawa, A., and Nakajima, J. (2015). Mantle wedge flow pattern and thermal structure in Northeast Japan: Effects of oblique subduction and 3-D slab geometry. Earth Planet. Sci. Lett. 426, 76–88. doi:10.1016/j.epsl.2015.06.021
Wada, I., and Wang, K. (2009). Common depth of slab-mantle decoupling: Reconciling diversity and uniformity of subduction zones. Geochem. Geophys. Geosyst. 10 (10). doi:10.1029/2009gc002570
Weismüller, J., Gmeiner, B., Ghelichkhan, S., Huber, M., John, L., Wohlmuth, B., et al. (2015). Fast asthenosphere motion in high-resolution global mantle flow models. Geophys. Res. Lett. 42, 7429–7435. doi:10.1002/2015gl063727
Willingshofer, E., Sokoutis, D., Luth, S. W., Beekman, F., and Cloetingh, S. (2013). Subduction and deformation of the continental lithosphere in response to plate and crust-mantle coupling. Geology 41 (12), 1239–1242. doi:10.1130/g34815.1
Yuan, X., Sobolev, S. V., Kind, R., Oncken, O., Bock, G., Asch, G., et al. (2000). Subduction and collision processes in the Central Andes constrained by converted seismic phases. Nature 408 (6815), 958–961. doi:10.1038/35050073
Zhong, S., Gurnis, M., and Moresi, L. (1996). Free-surface formulation of mantle convection—I. Basic theory and application to plumes. Geophys. J. Int. 127 (3), 708–718. doi:10.1111/j.1365-246x.1996.tb04049.x
Keywords: subduction zone, trench dynamics, stress field, CFD modeling, relative relief
Citation: Dasgupta R and Mandal N (2022) Trench topography in subduction zones: A reflection of the plate decoupling depth. Front. Earth Sci. 10:908234. doi: 10.3389/feart.2022.908234
Received: 30 March 2022; Accepted: 27 July 2022;
Published: 29 August 2022.
Edited by:
Manuele Faccenda, Università Padova, ItalyReviewed by:
Bernhard Maximilian Steinberger, GFZ German Research Centre for Geosciences, GermanyCopyright © 2022 Dasgupta and Mandal. This is an open-access article distributed under the terms of the Creative Commons Attribution License (CC BY). The use, distribution or reproduction in other forums is permitted, provided the original author(s) and the copyright owner(s) are credited and that the original publication in this journal is cited, in accordance with accepted academic practice. No use, distribution or reproduction is permitted which does not comply with these terms.
*Correspondence: Ritabrata Dasgupta, cml0YWJyYXRhZGFzZ3VwdGEucnNAamFkYXZwdXJ1bml2ZXJzaXR5Lmlu; Nibir Mandal, bmliaXIubWFuZGFsQGphZGF2cHVydW5pdmVyc2l0eS5pbg==
Disclaimer: All claims expressed in this article are solely those of the authors and do not necessarily represent those of their affiliated organizations, or those of the publisher, the editors and the reviewers. Any product that may be evaluated in this article or claim that may be made by its manufacturer is not guaranteed or endorsed by the publisher.
Research integrity at Frontiers

Learn more about the work of our research integrity team to safeguard the quality of each article we publish.