 Jinbo Tang
 Chen Liu1,2,3
 Hao Wang
- 1Key Laboratory of Mountain Hazards and Earth Surface Processes, Chinese Academy of Sciences, Chengdu, China
- 2Institute of Mountain Hazards and Environment, Chinese Academy of Sciences, Chengdu, China
- 3School of Energy and Power Engineering, Xihua University, Chengdu, China
- 4College of Water Conservancy and Hydropower Engineering, Sichuan Agriculture University, Ya’an, China
Guxiang Gully, located in Bome county in southwest Tibet, China, is a right-bank tributary of the Purlung Tsangpo River. Hanging glaciers are widely distributed upstream of the gully, and a large number of moraines can cause debris flows triggered by run-offs generated by the rainstorm and melting water of glaciers deposited in this gully. The debris flow in the Guxiang Gully can frequently pose a serious threat to the Sichuan–Tibet highway. Due to the lack of field observation data, in this study, the flood discharge method combining the run-off generated by rainstorms and melting water of glaciers was employed to determine the magnitudes of debris flows under once-in-a-century, once-in-two-century, and once-in-three-century flood return periods. Furthermore, a numerical simulation is implemented to determine the maximum flow depth and velocity of the debris flow in each grid cell and the inundated debris flow area in Guxiang Gully with different return periods. Subsequently, each grid cell’s maximum flow depth and velocity are used to assess buried hazards and impact hazards, respectively. The integrated hazard could be calculated by combining the buried hazard and the impact hazard. The result shows that the hazard of the top of the fan and Purlung Tsangpo River affected by the debris flow is highest, and the debris flow is likely to block the Purlung Tsangpo River.
1 Introduction
The mountainous region southeast of the Qinghai–Tibet Plateau is one of the most crucial areas in China for natural disasters such as landslides and debris flows (Du and Zhang, 1981). Once a debris flow occurs, it causes significant damage to the buildings of settlements and transportation infrastructure (Takahashi, 2007; Cui et al., 2015). Modern glaciers, especially marine glaciers, are widely distributed in this region. Due to the influence of the southwest monsoon from the Indian Ocean and the complex geological and geomorphological environment, debris flows are initiated frequently by run-offs generated by the coupling of frequent heavy precipitation with glacier meltwater during summer (Liu and Cheng, 2015). Generally, run-off is generated only when glacier meltwater has difficulty initiating debris flows due to a relatively small discharge. However, when there is a condition of heavy precipitation, rainfall can lead to largely accelerated glacier melt and form a relatively large discharge and then trigger debris flows. This type of debris flow is typically termed as glacier–rainfall mixed debris flows.
It is necessary to analyze the hazard of debris flows to reduce their risks. Luo et al. (2020) proposed a framework for vulnerability analysis to generate a physical-vulnerability model of sequential and concurrent hazards based on the interaction mechanism between debris flows and buildings, in which the cumulative damage effects of sequential debris flows were analyzed. Paudel et al. (2020) used a GIS model by coupling the hazard areas of debris flows with rainfall frequency to assess the hazard of debris flows. Bonetto et al. (2021) established an open geographic database to quantitatively and rapidly assess the hazard of debris flows based on the independent parameters in the region. Jiang et al. (2021) proposed an empirical model (Flow-R model) to assess the debris flows’ hazard class on the flow paths and spreading areas of debris flows at the regional scale with basic information on debris flows. However, traditional hazard analysis is based mainly on the empirical formula, which can only calculate parameters such as runout distance but cannot describe the buried area of debris flows (Wei et al., 2006).
In recent years, with the development of dynamic theory and numerical simulation technology for debris flows, hazard analysis based on the dynamic process of debris flows has also made many achievements (O'Brien et al., 1993; Liu and Tang, 1995; Iverson, 1997; Guo et al., 2022). Based on the determination of the magnitudes of the debris flows in 12 creeks in Bíldudalur over 10 years, Glade (2005) compared the input of the sediment requirement model for debris flows and estimated sediment reproduction from both the suction and rock wall retreat models. Wei et al. (2006) applied the momentum partition method to analyze the hazard, but it did not involve disasters caused by burying the protected object. Liu et al. (2008) derived the magnitude–frequency (MF) relationship by expressing the observed live debris flows and runoff (i.e., total volume) distributions over the last 40 years. It is critical for debris flow prediction. However, they did not fully consider the reliability and authenticity of the data. Zou et al. (2016) proposed a method to describe the integrated hazard of debris flows by summing up the depth and kinetic energy of debris flows. Because the depth implied the disaster caused by burying the protected object and the kinetic energy represented the hazard caused by impacting the protected subjects, the risk of debris flows seems to be considered adequately in the method proposed by Zou et al. (2016). However, the depth and kinetic energy have separate physical dimensions, and summing them can lead to the problem of dimensional dissonance. Gao et al. (2019) analyzed 178 debris flow events by regression analysis in Jiang Jia Gully from 1987 to 2004. The MCF relationship for high-frequency debris flows is consistent with the power-law equation, but there are differences in the regression coefficients in the equation. Fan et al. (2020) proposed to evaluate the hazard of loose material on post-earthquake slopes by comparing multi-temporal landslide and hydro-topographic parameters. However, Fan et al. (2020) did not try to distinguish the association between different types of hydro-topographic parameters and multi-temporal landslide inventories. Dash et al. (2021) performed a 3D numerical simulation of the Himalayas based on the Voellmy model and conducted a hazard assessment. It is advantageous to the region where data integrity is incomplete. But the study fails to consider the hydrogeological and other conditions upstream which cause debris flows. Therefore, the numerical simulation of the long time scale for rainfall, dynamic, and high altitude for glacial debris flow is urgently needed.
In this study, a method to describe the integrated hazard of debris flows is proposed by employing numerical simulation techniques and is used for the integrated hazard analysis of debris flows in Guxiang Gully. After this review of the literature (Section 1), the overview of Guxiang Gully is described in Section 2. Section 3 introduces the method used to determine the magnitude of the Guxiang Gully debris flows. Section 4 describes the numerical techniques used in this study. In Section 5, a numerical technique is used to simulate debris flows in Guxiang Gully with different frequency scales, and then the integrated hazard of debris flows is analyzed by combining the maximum flow depth and the maximum flow velocity head. Finally, conclusions are drawn in Section 6.
2 Overview of the Study Area
Guxiang Gully, located in Bomi county, Tibet Autonomous Region, China, is a right-bank tributary of the Parlung Tsangpo valley (As Figure 1A), where moraines controlled by modern marine glaciers are widespread in this region (Gao et al., 2018). As a typical glacial debris flow that threatens the safety of the Sichuan–Tibet highway, the debris flows in the Guxiang Gully have a high velocity with a powerful impact and buried destruction on the downstream roads (Cheng et al., 1997; You et al., 1997). It is vital to analyze the motility and hazard of debris flows in Guxiang Gully to ensure the safety of the Sichuan–Tibet Highway (Wei et al., 2006).
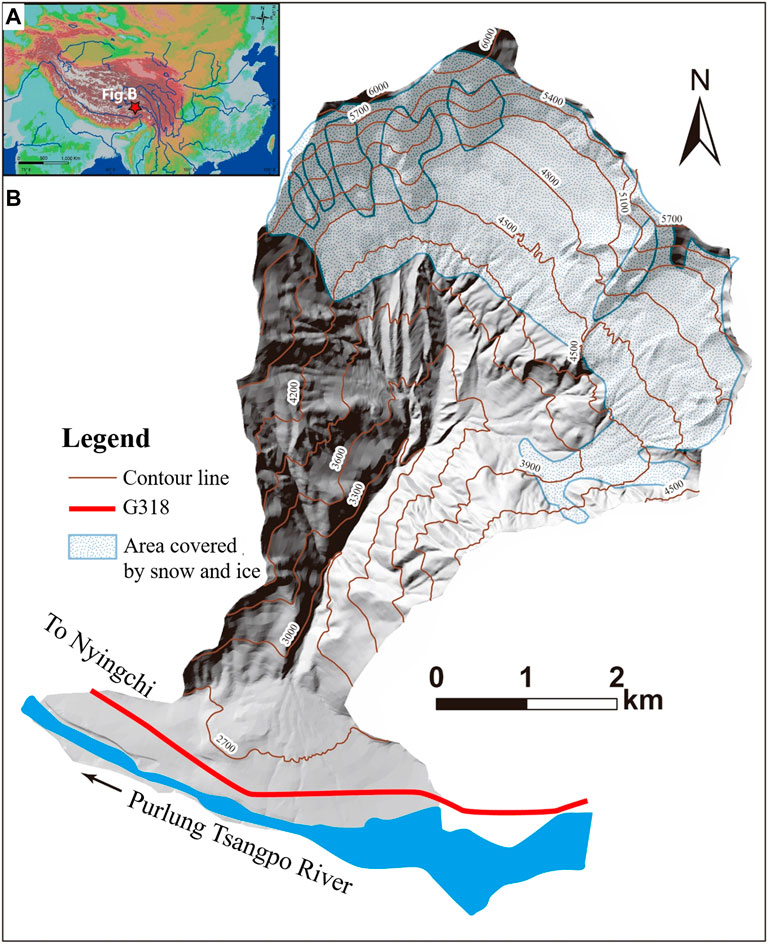
FIGURE 1. Overview map of the Guxiang Gully watershed.
The Guxiang Gully area watershed is 25.2 km2, and the main channel has a length of 6 km and a longitudinal mean gradient of 256‰, as shown in Figure 1B. The steep slopes can supply potential energy for debris flow initiation. The six hanging glaciers are developed in the source area of this gully, and large moraines that supply the material sources for debris flow initiation accumulated in this gully (Zhu et al., 1997). Guxiang Gully is situated in the suture zone of Yarlung Tsangpo (King et al., 2016), and intense geological activity induced plenty of loose disperse debris, which can contribute to material sources for debris flow initiation. In addition, due to thaw and freeze weathering, rock crevices developed, which were vulnerable to avalanches (IMHE (Chengdu Institute of Mountain Hazards and Environment), 1995; Zhang, 2008). Overall, these conditions resulted in tremendous amounts of loose sediment, which can initiate large-magnitude debris flows.
In addition, the marine glaciers in the region play an important role in enlarging the magnitude of debris flows (IMHE (Chengdu Institute of Mountain Hazards and Environment), 1995). Due to the influence of radiation by solar and heavy precipitation, the meltwater volume for the glacier of Guxiang Gully is the largest in July and August every year and accounts for more than 70% of the year in the rainy season (Liu et al., 2013; Zhang and Lin, 2016). The Indian monsoon can transport large amounts of warm humid airflow along the Brahmaputra–Yarlung Tsangpo River into the Parlung Tsangpo valley (Deng et al., 2017). Under the influence of the southwest monsoon, the rainy season lasts for approximately 6 months and has enough precipitation for debris flow initiation. In addition, due to the presence of modern glaciers at the source, meltwater increases the existing run-off discharge caused by precipitation due to the increase in ambient temperature, which provided sufficient hydrodynamic conditions for the formation of debris flows in the region (Cui et al., 2015).
In September 1953, a large-scale debris flow with a peak discharge of 28,600 m3/s occurred in the Guxiang Gully as a result of heavy precipitation, which lasted for more than 4 h. Vast amounts of sediments, approaching 11 million m3, were transported to the 1.5–3.5-km wide and 2-km long downstream fan. A single granite gneiss 20 m × 8 m × 12 m size boulder was found in the depositional fan. A large body of sediments was transported into and blocked the Purlung Tsangpo River and then formed a dammed lake where the water level upstream of the dammed lake rose 40 m, causing backwater flooding more than 70 km upstream. In 1963, other large-scale debris flows occurred again in the Guxiang Gully, and the sediments rushed into the Purlung Tsangpo River and squeezed the cross-section of the channel of the Purlung Tsangpo River. The backwater associated with the second event flooded approximately 12 m upstream (Shi et al., 1964). In addition to these large-scale debris flows, these events caused massive physical and economic losses; additionally, these debris flows in the Guxiang Gully could occur from May to September every year. Although the scales of these debris flows were small, they had a very high frequency, sometimes occurring more than hundreds of times a year. Before 1953, the area of the debris flow fans in Guxiang Gully was 1.5 km2 and increased to 3.7 km2 in 1964, 4.23 km2 in 1973, and 4.25 km2 at present (You, 2001).
According to the results of Zhu et al. (1997), the longest branch before 1950 in the Guxiang Gully source area was a small-scale shallow gully. Due to the effect of the Medog earthquake, the strength of the moraine dropped. Moreover, due to rainfall and infiltration of glacier meltwater, saturated instability of the soil, and gravity unloading, numerous landslides occurred in the source area. The moraine also provided abundant material sources for the large debris flows that occurred in 1953. In the 1960s, landslides collapsed 5–6 times per hour in the catchment (Shi et al., 1964). However, after the 1990s, the moraine in the source area of the Guxiang Gully gradually stabilized, and the frequency and scale of debris flows also decreased, transforming into dilute debris flows and hyperconcentrated flows (Zhu et al., 1997).
3 Determination of the Magnitude of Guxiang Gully Debris Flows
The initiation mechanism of the debris flow is very complex, which can be initiated by landslide transformation, glacial lake outburst floods (GLOFs), ice-rock avalanches, and glacial debris flows (Kääb et al., 2018; Shugar et al., 2021). Since hydrological data in this area are not available, in this study, the flood discharge method combining the run-off generated by the rainstorm and by melting water of glaciers was employed to determine the magnitude of debris flows. This method has been widely applied and has played a pivotal role in the hydrological calculation in the areas where hydrological data are not available in Tibet (IHME (Chengdu Institute of Mountain Hazards and Environment), 1995; Looper and Vieux, 2012; Kim and Choi, 2015; Banasik et al., 2016; Vasil’eva et al., 2019; Deng et al., 2020).
In this study, the run-off generated by rainfall can be calculated by the following formula (IMHE (Chengdu Institute of Mountain Hazards and Environment), 1995):
where Q0 is the peak discharge of flood (m3/s); μ is the flood runoff coefficient; Sp is the rain intensity, i.e., the maximum hourly rain intensity (mm/h); τ is the confluence time (h) in the catchment; n is the rain attenuation index; F is the confluence area in the catchment (km2), and the time of the run-off generation tc is calculated as follows:
The time of hydrological confluence in the catchment can be calculated as follows:
where μ = 3.6F−0.19is the runoff coefficient; m = 0.278θ0.204 is the confluence coefficient; and θ = L/(J1/3F1/4) is the characteristic coefficient of the catchment.
In addition, when the glacier area accounts for 10%–30% of the catchment, glacier meltwater plays a pivotal role in the formation of run-off in the catchment where the integrated effect of heavy rainfall and glacier melting needs to be simultaneously considered. To determine the peak discharge of floods in glacier–rainfall mixed debris flows gullies, the peak discharge of glacier melting Q1 needs to be calculated using the following formula (IMHE (Chengdu Institute of Mountain Hazards and Environment), 1995):
where F1 is the area covered by glaciers and snow (km2), and H is the total rainfall for individual debris flow events (mm).
Combining the peak discharge generated by rainfall with that by glacier meltwater, the peak discharge of glacier-rainfall mixed debris flows can be calculated as follows:
where Qd is the peak flood discharge of glacier-rainfall mixed debris flows; and Q0 and Q1 can be determined by Eq. 1 and Eq. 4, respectively. φd = (γd–γw)/(γs–γd) is the correction coefficient due to the presence of sediment in debris flows, γd is the bulk density of debris flows, γw is the inherent density of water and is taken as 1,000 kg/m3, γs is the inherent density of particles in debris flows and is taken as 2,650 kg/m3, and D is the scale amplification coefficient due to the presence of glaciers and can be calculated as follows:
where F1 is the area covered by glaciers and snow; F is the total area of the catchment (km2); and θ0 is the surface angel of the glacier relative to the horizontal plane (°).
According to the duration of debris flows T and the maximum flow Qd, the total volume Vt of a debris flow process can be calculated by the following formula:
In this study, catchment and rainfall parameters were used from IMHE (Chengdu Institute of Mountain Hazards and Environment), (1995) and are listed in Table 1. The peak flood discharges and total magnitudes of debris flows in Guxiang Gully under once-in-a-century, once-in-two-century, and once-in-three-century flood frequency conditions were calculated from Eq. 1 to Eq. 7 and are listed in Table 2.
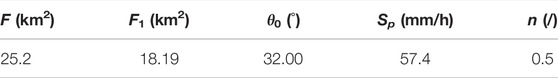
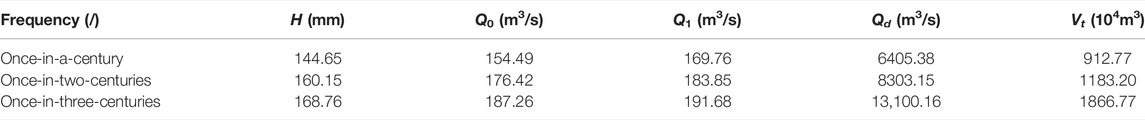
TABLE 2. Determination of the values of run-off in Eqs 4, 5 and the total magnitude of debris flows calculated by Eq. 7.
4 Numerical Simulations of Debris Flow Movements
As a special kind of solid and liquid two-phase fluid, the dynamics of debris flows are very sophisticated (Wang et al., 1998). According to the joint efforts of many debris flow scholars at home and abroad, kinetic equations that can describe the movement of debris flows have been developed to a certain extent (Iverson and Denlinger, 2001; Pitman and Le, 2005; Pudasaini and Mergili, 2019). The movement of debris flows is an enormously complex dynamic process, and it is almost impossible to find an analytical solution for debris flow channels in real terrain based on fluid dynamics, so it can only be solved with the help of numerical calculation methods (Iverson, 1997). In this study, based on the basic hydrodynamic equation, the dynamic control equation of viscous debris flows is derived and developed as follows:
where p = hu and q = hv are the discharges per width in the x and y directions, respectively; u and v are the debris flow velocity in the x and y directions, respectively; h is the debris flow depth; Zb is the bottom altitude; g = 9.8 m/s2 is the acceleration of gravity; and Sfx and Sfy are the bottom resistances of debris flows in the x and y directions, respectively. According to Iverson’s study, the resistance to debris flow movement includes liquid-phase constituent and solid-phase particle motion friction resistance (O'Brien et al., 1993) adding, which can be expressed as follows:
where Cs is the volumetric concentration of the solid phase, τB is the yield stress of debris flows in the liquid phase, η is the dynamic viscosity coefficient of the liquid phase of the debris flows, ρ is the density of debris flows, ρf is the liquid-phase fluid density, ρs = 2,650 kg/m3 is the density of particles, and ψ is the friction angle between the particles and the bed surface in the debris flow mass. According to the study of Wei et al.(2006), in this study, these parameters could be taken as Cs = 0.46, ρf = 1,450 kg/m3, ρ = 2,000 kg/m3, τB = 55.20 Pa, η = 0.086 Pa⋅s, and ψ = 18.5°.
In this study, the numerical software proposed by Zhang and Lin (2016) was employed to numerically simulate the motion of debris flows. As listed in Table 2, under once-in-a-century, once-in-two-century, and once-in-three-century flood return periods, the magnitudes of debris flows in Guxiang Gully are approximately 9.1277 million m3, 11.8320 million m3, and 18.6677 million m3, respectively. According to the 1:10,000 topographic map of Guxiang Gully, the digital elevation model (DEM) of the catchment area of Guxiang Gully was established. The numerical simulation of the debris flows of Guxiang Gully was implemented under the conditions of 100-year frequency, 200-year frequency, and 300-year frequency, and the final deposition area and depth distribution of the debris flows are shown in Figure 2. The maximum depths of the accumulation were 27.50 m and 31.63 m, the maximum accumulation depths were 27.50 m, 31.63 m, and 47.60 m, and the maximum accumulation depth was located in the main river area of the Purlung Tsangpo River affected by the debris flows.
FIGURE 2. Deposition area of debris flows with different return periods: (A) 100-year frequency, (B) 200-year frequency, and (C) 300-year frequency.
5 Hazard Analysis
Traditionally, statistical methods were mainly employed to assess the risk of debris flows that involve the runout and deposition area but cannot consider the dynamical characteristics of debris flows, such as the distribution of depth and velocity (Guzzetti et al., 2005; Zou et al., 2016). To precisely evaluate the hazard of debris flows, more details on the dynamical characteristics of debris flows are essential. In this study, to analyze the hazard based on the results of numerical simulations, the maximum flow depth and maximum velocity were extracted at each grid cell during debris flow movement, which can be described as follows:
where U = (u2+v2)1/2 is the resultant velocity of the debris flows; u and v are the x- and y-component velocity debris flows, respectively; Δt is the numerical time step; T is the total time of debris flow simulation; and the subscripts i and j represent the i-th and j-th grid cells along the x-direction and y-direction, respectively, in the computational domain.
In the process of numerical simulation, the maximum flow depth distribution and maximum velocity distribution of debris flows at different frequencies were extracted by Eqs 13, 14 and are shown in Figure 3. The numerical simulation results indicated that after the debris flows ran out from the outlet of the Guxiang Gully, the debris flows spread rapidly over the depositional fan. Under the condition of a once-in-a-century frequency, the maximum flow depth and the maximum flow velocity of debris flows were 32.57 m and 11.32 m/s, respectively, in the whole computational domain. The maximum depth of debris flows is distributed at the main river area of the Purlung Tsangpo river and is equal to 27.5 m, where the maximum flow velocity is 4.32 m/s. Under the conditions of a once-in-two-century frequency, the maximum flow depth and the maximum flow velocity of debris flows were 35.71 m and 12.00 m/s, respectively, in the whole computational domain. The maximum depth of debris flows is distributed at the main river area of the Purlung Tsangpo river and is equal to 31.63 m, where the maximum flow velocity is 5.63 m/s; under the condition of a once-in-three-century frequency, the maximum flow depth and the maximum flow velocity of debris flows were 46.12 m and 14.89 m/s, respectively, in the whole computational domain. The maximum depth of debris flows is distributed at the main river area of the Purlung Tsangpo River and is equal to 47.60 m, where the maximum flow velocity is 7.54 m/s.
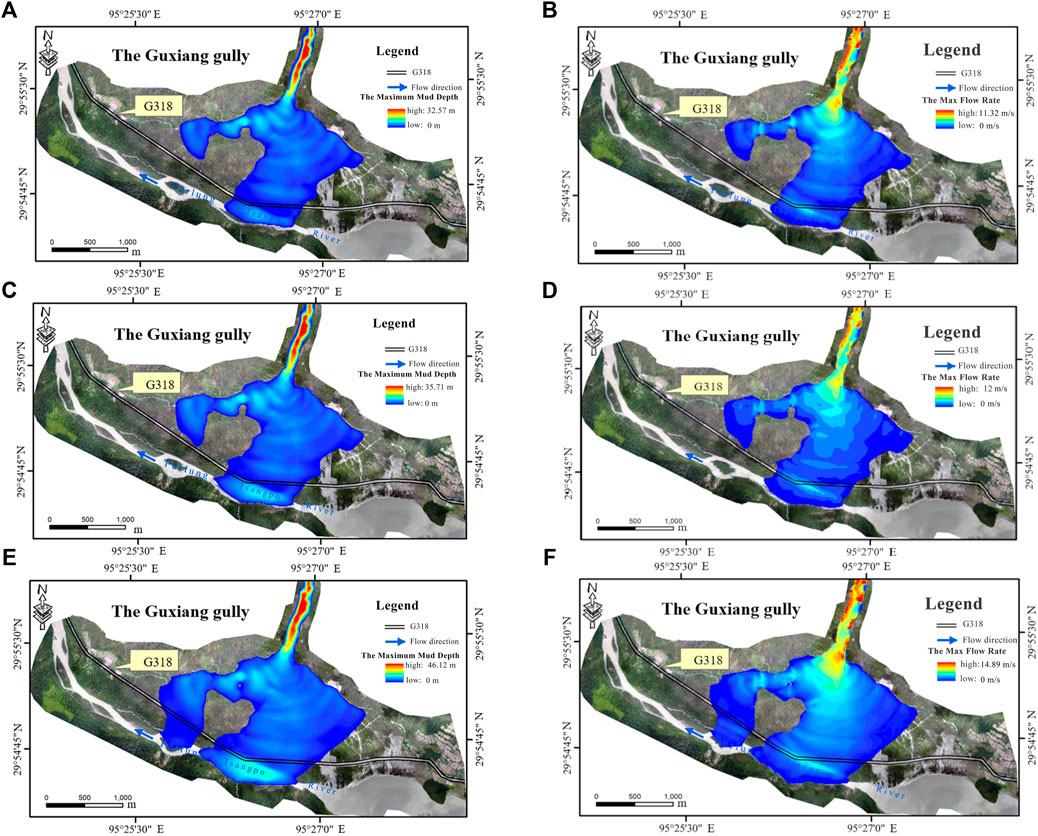
FIGURE 3. Maximum depth of debris flows with different return periods. (A) 100-year frequency. (C) 200-year frequency. (E) 300-year frequency. The maximum velocity distribution of debris flows with the different return periods. (B) 100-year frequency. (D) 200-year frequency. (F) 300-year frequency.
Furthermore, according to the hazard characteristics of debris flows, the hazard of debris flows in the movement process is mainly reflected by burying and impacting caused by debris flows (Hu et al., 2012; Zhu et al., 2021). In this study, the maximum depth of debris flows at each grid-cell was regarded as the hazard by burying the protected objects caused by debris flows. In addition, the impact force of debris flows is usually expressed as p = KρU2 (Tang et al., 2013). Therefore, the maximum flow velocity head U2/(2 g) at each grid cell was employed to represent a hazard caused by impacting the protected objects, where U is the resultant flow velocity, and g is the gravity acceleration. Summing up the hazard of debris flows caused by burying and impacting protected objects, the integrated hazard of debris flows can be described as follows:
where Hij represents the integrated hazard of debris flows at the i-th and j-th grid cells in the computational domain, which have dimensions of length (m).
In this study, based on the numerical results, Eq. 15 is employed to determine the integrated hazard distribution of debris flows under once-in-a-century, once-in-two-century, and once-in-three-century flood frequency conditions, as shown in Figure 4. The numerical simulation results showed that under once-in-a-century, once-in-two-century, and once-in-three-century flood frequency conditions, the areas with the highest hazard of debris flows were distributed at the outlet of Guxiang Gully, which were 33.96 m, 37.66 m, and 50.01 m for different frequencies, respectively. In addition, under the conditions of these frequencies, the debris flows in Guxiang Gully have obvious implications of blocking the Purlung Tsangpo River. Once the debris flows block the Purlung Tsangpo river, it forms a dam. As the debris flow dam collapses, it may lead to a debris flow-blocking-failure and flood disaster chain.
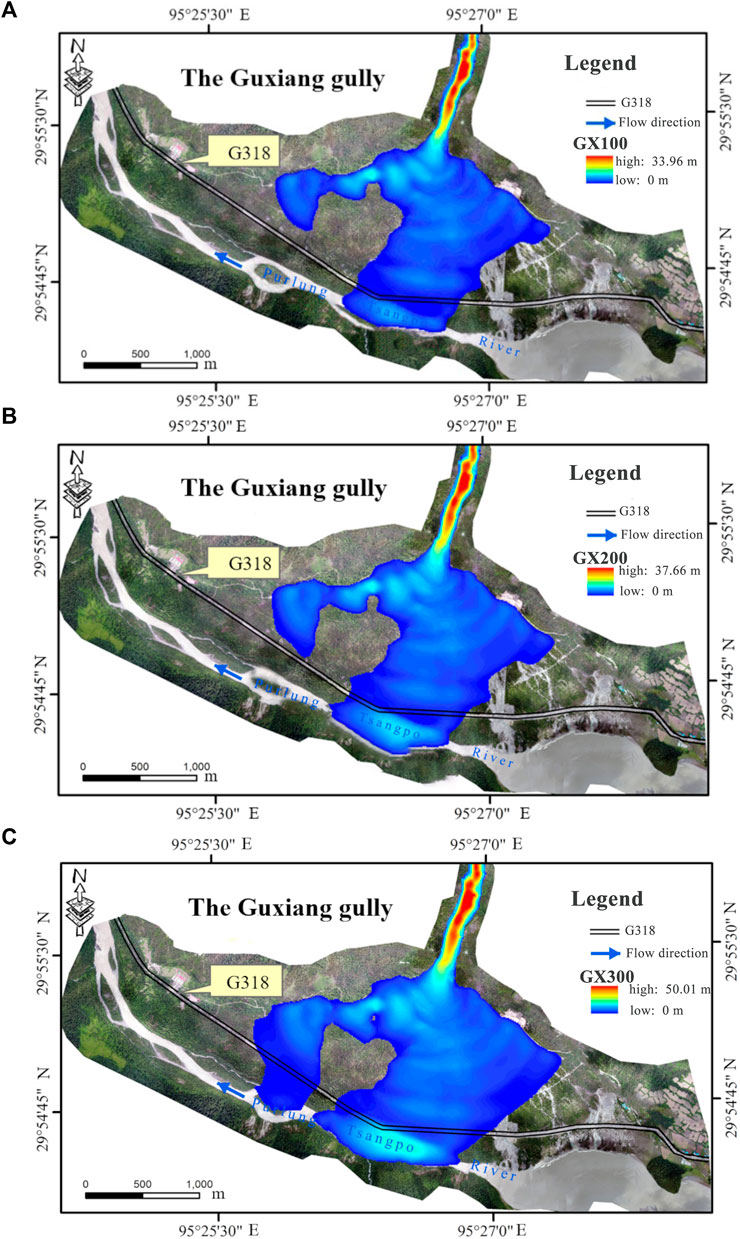
FIGURE 4. Distribution of debris flow hazards for different return periods. (A) 100-year frequency. (B) 200-year frequency. (C) 300-year frequency.
6 Conclusion
The magnitude of the debris flows is one of the major control factors in assessing debris flow hazards. The debris flows in Guxiang Gully were initiated by the run-off of rainfall and meltwater from glaciers. The integrated effect of heavy rainfall and glacier meltwater needs to be fully considered as determining the magnitude of the debris flows. In this study, the flood discharge method combining the run-off generated by rainstorms and by the melting water of glaciers was employed to determine the magnitudes of debris flows for the once-in-a-century, once-in-two-century, and once-in-three-century return periods.
Furthermore, the motions of debris flow in Guxiang Gully with once-in-a-century, once-in-two-century, and once-in-three-century flood frequency conditions were numerically simulated. The integrated debris flow hazard is proposed by combining the maximum flow depth and the maximum flow velocity head, where the maximum flow depth of debris flows at each grid cell implies the hazard of debris flows caused by burying the protected objects, and for the hazard of debris flows caused by impacting the protected objects, the flow velocity head was employed.
Based on the numerical simulation results, the integrated hazards of debris flows in Guxiang Gully with once-in-a-century, once-in-two-century, and once-in-three-century flood frequency conditions were analyzed. The results showed that the high-hazard area caused by debris flows in Guxiang Gully is mainly distributed at the outlet of the gully and the main river area of the Purlung Tsangpo River downstream, and the debris flows have the apparent risk of blocking the river under once-in-a-century, once-in-two-century, and once-in-three-century flood frequency conditions. If debris flows block the Purlung Tsangpo river, the dam caused by debris flows can fail, which likely leads to a debris flow blocking the river and flood disaster chain as the dam fails.
Data Availability Statement
The original contributions presented in the study are included in the article further inquiries can be directed to the corresponding author.
Author Contributions
JT: conceptualization, methodology, data curation, writing—original draft, and formal analysis. CL: conceptualization, methodology, and formal analysis. JM: conceptualization, methodology, and formal analysis. HW: conceptualization, methodology, and formal analysis.
Funding
This work was supported by the Key Research Program of Frontier Sciences, CAS (Grant No. QYZDY-SSW-DQC006), National Natural Science Foundation of China (Grant Nos. 41941017 and U20A20112), and the support from the Sichuan Science and Technology Program 2021YFH0009 is gratefully acknowledged.
Conflict of Interest
The authors declare that the research was conducted in the absence of any commercial or financial relationships that could be construed as a potential conflict of interest.
Publisher’s Note
All claims expressed in this article are solely those of the authors and do not necessarily represent those of their affiliated organizations, or those of the publisher, the editors, and the reviewers. Any product that may be evaluated in this article, or claim that may be made by its manufacturer, is not guaranteed or endorsed by the publisher.
References
Banasik, K., Hejduk, L., Woodward, D. E., and Banasik, J. (2016). Flood Peak Discharge vs. Various CN and Rain Duration in a Small Catchment. Rocz. Ochr. Srodowiska 18, 201–212.
Bonetto, S., Mosca, P., Vagnon, F., and Vianello, D. (2021). New Application of Open Source Data and Rock Engineering System for Debris Flow Susceptibility Analysis. J. Mt. Sci. 18 (12), 3200–3217. doi:10.1007/s11629-021-6814-3
Chen, N., Zou, Q., Su, F., Cui, P., and Zhang, Y. (2015). Risk Assessment and Disaster Reduction Strategies for Mountainous and Meteorological Hazards in Tibetan Plateau. Chin. Sci. Bull. 60, 3067–3077. doi:10.1360/N972015-00849
Cheng, Z. L., Liu, L. J., and You, Y. (1997). Debris Flow Velocity of Guxiang Ravine, Xizang. Chengdu, China: Mountain Research, 04, 293–295.
Dash, R. K., Kanungo, D. P., and Malet, J. P. (2021). Runout Modelling and Hazard Assessment of Tangni Debris Flow in Garhwal Himalayas, India. Environ. Earth Sci. 80. doi:10.1007/s12665-021-09637-z
Deng, P., Xu, G., Bing, J., Xu, C., and Jia, J. (2020). Evaluation Method of Rain-Flood Resource Utilization Availability and its Application in the Hanjiang River Basin. Water Supply 20, 3557–3575. doi:10.2166/ws.2020.251
Du, R. H., and Zhang, S. C. (1981). Characteristics of Glacial Mud-Flow in South-Eastern Qinhai-Xizang Plateau. J. Glaciol. Geocryol. (03), 10–16. (in Chinese).
Fan, X., Yunus, A. P., Scaringi, G., Catani, F., Siva Subramanian, S., Xu, Q., et al. (2021). Rapidly Evolving Controls of Landslides after a Strong Earthquake and Implications for Hazard Assessments. Geophys. Res. Lett. 48. doi:10.1029/2020GL090509
Gao, Y.-c., Chen, N.-s., Hu, G.-s., and Deng, M.-f. (2019). Magnitude-frequency Relationship of Debris Flows in the Jiangjia Gully, China. J. Mt. Sci. 16 (6), 1289–1299. doi:10.1007/s11629-018-4877-6
Glade, T. (2005). Linking Debris-Flow Hazard Assessments with Geomorphology. Geomorphology 66, 189–213. doi:10.1016/j.geomorph.2004.09.023
Guo, J., Cui, Y., Xu, W., Yin, Y., Li, Y., and Jin, W. (2022). Numerical Investigation of the Landslide-Debris Flow Transformation Process Considering Topographic and Entrainment Effects: a Case Study. Landslides 19, 773–788. doi:10.1007/s10346-021-01791-6
Guzzetti, F., Reichenbach, P., Cardinali, M., Galli, M., and Ardizzone, F. (2005). Probabilistic Landslide Hazard Assessment at the Basin Scale. Geomorphology 72, 272–299. doi:10.1016/j.geomorph.2005.06.002
Hu, K. H., Cui, P., and Ge, Y. G. (2012). Building Destruction Patterns by August 8, 2010 Debris Flow in Zhouqu, Western China. Mt. Res. 30 (04), 484–490. doi:10.16089/j.cnki.1008-2786.2012.04.020
IMHE (Chengdu Institute of Mountain Hazards and Environment) (1995). Mountain Disasters and Prevention Countermeasures on the South Line of Sichuan - Tibet Highway (In Tibet). Beijin: Science Press.
Iverson, R. M., and Denlinger, R. P. (2001). Flow of Variably Fluidized Granular Masses across Three-Dimensional Terrain: 1. Coulomb Mixture Theory. J. Geophys. Res. 106, 537–552. doi:10.1029/2000JB900329
Iverson, R. M. (1997). The Physics of Debris Flows. Rev. Geophys. 35, 245–296. doi:10.1029/97RG00426
Jiang, N., Su, F., Li, Y., Guo, X., Zhang, J., and Liu, X. (2021). Debris Flow Assessment in the Gaizi-Bulunkou Section of Karakoram Highway. Front. Earth Sci. 9, 660579. doi:10.3389/feart.2021.660579
Kääb, A., Leinss, S., Gilbert, A., Bühler, Y., Gascoin, S., Evans, S. G., et al. (2018). Massive Collapse of Two Glaciers in Western Tibet in 2016 after Surge-like Instability. Nat. Geosci. 11, 114–120. doi:10.1038/s41561-017-0039-7
Kim, E. S., and Choi, H. I. (2015). A Method of Flood Severity Assessment for Predicting Local Flood Hazards in Small Ungauged Catchments. Nat. Hazards 78 (3), 2017–2033. doi:10.1007/s11069-015-1817-4
Liu, J., Cheng, Z., and Li, Q. (2013). Meteorological Conditions for Frequent Debris Flows from Guxiang Glacier, Mount Nyenchen Tanglha, China. Mt. Res. Dev. 33, 95–102. doi:10.1659/MRD-JOURNAL-D-12-00053.1
Liu, J. J., Li, Y., Su, P. C., and Cheng, Z. L. (2008). Magnitude-frequency Relations in Debris Flow. Environ. Geol. 55 (6), 1345–1354. doi:10.1007/s00254-007-1083-1
Looper, J. P., and Vieux, B. E. (2012). An Assessment of Distributed Flash Flood Forecasting Accuracy Using Radar and Rain Gauge Input for a Physics-Based Distributed Hydrologic Model. J. Hydrology 412-413, 114–132. doi:10.1016/j.jhydrol.2011.05.046
Luo, H., Zhang, L., Wang, H., and He, J. (2020). Multi-hazard Vulnerability of Buildings to Debris Flows. Eng. Geol. 279, 105859. doi:10.1016/j.enggeo.2020.105859
O'Brien, J., Julien, P., and Fullerton, W. (199319932). Two-dimensional Water Flood and Mudflow Simulation. J. Hydraulic Eng. 119119, 2. doi:10.1061/(ASCE)0733-942910.1061/(asce)0733-9429(1993)119:2(244)
Pitman, E. B., and Le, L. (2005). A Two-Fluid Model for Avalanche and Debris Flows. Phil. Trans. R. Soc. A 363, 1573–1601. doi:10.1098/rsta.2005.1596
Pudasaini, S. P., and Mergili, M. (2019). A Multi‐Phase Mass Flow Model. J. Geophys. Res. Earth Surf. 124, 2920–2942. doi:10.1029/2019JF005204
Shi, Y. F., Yang, Z. H., Xin, Z. C., and Du, R. H. (1964). Glacier Debris Flow in Guxiang Area, Tibet. Chin. Sci. Bull. (06), 542–544. (in Chinese).
Shugar, D. H., Jacquemart, M., Shean, D., Bhushan, S., Upadhyay, K., Sattar, A., et al. (2021). A Massive Rock and Ice Avalanche Caused the 2021 Disaster at Chamoli, Indian Himalaya. Science 373 (6552), 300–306. doi:10.1126/science.abh4455
Takahashi, T. (2007). Debris Flow: Mechanics, Prediction and Countermeasures. London: Taylor and Francis Group, 35–38.
Tang, J. B., Hu, K. H., Zhou, G., Chen, H., Zhu, X. H., and Ma, C. (2013). Debris Flow Impact Pressure Signal Processing by the Wavelet Analysis. J. Sichuan Univ. Eng. Sci. Ed. 45 (1), 8–13. doi:10.15961/j.jsuese.2013.01.003
Vasil’eva, E., Aleksyuk, A., Belyakova, P., Fedorova, T., and Belikov, V. (2019). Numerical Modeling of the Behavior of a Destructive Rain Flood on a Mountain River. Water Resour. 46, S43–S55. doi:10.1134/S0097807819070169
Wang, G. Q., Sao, S. D., and Fei, X. J. (1998). Debris Flow Simulation: I-Model. J. Sediment Res. (03), 9–15. doi:10.16239/j.cnki.0468-155x.1998.03.002
Wei, F. Q., Hu, K. H., Lopez, J. L., and Cui, P. (2003). The Method of Momentum Zoning of Debris Flow Hazard and its Application. Chin. Sci. Bull. (03), 298–301. (in Chinese).
You, Y., Cheng, Z. L., Hu, P. H., and He, S. F. (1997). A Study on Model Testing of Debris Flow in GuXiang Gully, Tibet. J. Nat. Disasters (01), 54–60.
You, Y. (2001). Transporting Characteristics of Debris Flow at Guxiang Accumulation Fan in Tibet Autonomous Region. Bull. Soil Water Conservation (02), 28–30. doi:10.13961/j.cnki.stbctb.2001.02.007
Zhang, B. B. (2008). Study on Debris Flow Characteristics in Temperate Glacier Area of Pallon Tsanggpo, Master’s Thesis. [CHINA(SC)]. Sounthwest Jiaotong University.
Zhang, Y., and Lin, P. (2016). An Improved SWE Model for Simulation of Dam-Break Flows. Proc. Institution Civ. Eng. - Water Manag. 169 (6), 260–274. doi:10.1680/wama.15.00021
Zhu, L., He, S., Qin, H., He, W., Zhang, H., Zhang, Y., et al. (2021). Analyzing the Multi-Hazard Chain Induced by a Debris Flow in Xiaojinchuan River, Sichuan, China. Eng. Geol. 293, 106280. doi:10.1016/j.enggeo.2021.106280
Zhu, P. Y., Luo, F. D., and Kou, Y. Z. (1997). Debris Flow Development Trend of Guxiang Ravine, Tibet. Chendu, China: Mountain research, 04, 296–299.
Keywords: Guxiang Gully, debris flows, flood discharge method, numerical simulation, hazard analysis
Citation: Tang J, Liu C, Mao J and Wang H (2022) Numerical Simulation and Hazard Analysis of Debris Flows in Guxiang Gully, Tibet, China. Front. Earth Sci. 10:908078. doi: 10.3389/feart.2022.908078
Received: 30 March 2022; Accepted: 27 April 2022;
Published: 08 June 2022.
Edited by:
Changdong Li, China University of Geosciences (Wuhan), ChinaReviewed by:
Nazir Bazai, Institute of Mountain Hazards and Environment (CAS), ChinaYifei Cui, Tsinghua University, China
Copyright © 2022 Tang, Liu, Mao and Wang. This is an open-access article distributed under the terms of the Creative Commons Attribution License (CC BY). The use, distribution or reproduction in other forums is permitted, provided the original author(s) and the copyright owner(s) are credited and that the original publication in this journal is cited, in accordance with accepted academic practice. No use, distribution or reproduction is permitted which does not comply with these terms.
*Correspondence: Hao Wang, aGdvb2RzcGVlZDIwMDhAMTYzLmNvbQ==
†These authors share first authorship