 B. A. Lathrop
 C. A-L. Jackson1
94% of researchers rate our articles as excellent or good
Learn more about the work of our research integrity team to safeguard the quality of each article we publish.
Find out more
ORIGINAL RESEARCH article
Front. Earth Sci., 25 August 2022
Sec. Structural Geology and Tectonics
Volume 10 - 2022 | https://doi.org/10.3389/feart.2022.907543
This article is part of the Research TopicLinks Between Tectonics, Fault Evolution and Surface Processes in Extensional SystemsView all 5 articles
The relationship between normal fault displacement (D) and length (L) varies due to numerous factors, including fault size, maturity, basin tectonic history, and host rock lithology. Understanding how fault D and L relate is useful, given related scaling laws are often used to help refine interpretations of often incomplete, subsurface datasets, which has implications for hydrocarbon and low-carbon energy applications. Here we provide a review of D/L scaling laws for normal faults, discuss factors that could influence these relationships, including both geological factors and errors in measurement, and provide a critique of previously published D/L databases. We then present our newly assembled database of 4059 normal faults from 66 sources that include explicit information on: 1) fault length and displacement, 2) host rock lithology, 3) host basin tectonic history, and 4) maturity, as well as fault D and L through time when these data are available. We find an overall scaling law of D = 0.3L0.92, which is similar to previously published scaling equations and that varies in response to the aforementioned geological factors. Our data show that small faults (<1 m length) tend to be over-displaced compared to larger faults, active faults tend to be under-displaced compared to inactive faults, and faults with stiffer host rock lithologies, like igneous and carbonate rocks, tend to be under-displaced with respect to faults within softer, more compliant host rocks, like clastic sedimentary rocks. Our dynamic D/L through time data show that faults follow the hybrid fault growth model, i.e., they initially lengthen, during which time they will appear under-displaced, before accumulating displacement. To the best of our knowledge, this is the first comprehensive, integrated, critical study of D/L scaling laws for normal faults and the factors influencing their growth. These revised relationships can now be utilized for predicting fault length or displacement when only one variable is available and provide the basis for general understanding D/L scaling laws in the context of normal fault growth. This underpinning database is open-access and is available for analysis and manipulation by the broader structural geology community.
The relationship between normal fault displacement (D) and length (L) has been widely researched over several decades (e.g., Walsh and Watterson 1988; Cowie and Scholz 1992a; Dawers et al., 1993; Clark and Cox, 1996; Schultz and Fossen, 2002; Kim and Sanderson, 2005; Xu et al., 2006; Schultz et al., 2008; Torabi and Berg, 2011). The empirical relationship between D and L is often described by:
The value n may range from 0.5 to 2.0 (n = 0.5, Fossen and Hesthammer, 1998; n = 1, Cowie and Scholz, 1992a; Dawers et al., 1993; Scholz et al., 1993; Clark and Cox, 1996; Schlische et al., 1996; Kim and Sanderson, 2005; Xu et al., 2006; n = 1.5, Marrett and Allmendinger, 1991; Gillespie et al., 1992; n = 2, Watterson, 1986; Walsh and Watterson, 1988). N = 1 indicates a linear scaling law, which implies that faults of different sizes act similarly and n≠1 indicates a scale-dependent geometry (Kim and Sanderson, 2005; Schultz et al., 2008).
The value c (sometimes written as P or γ) is an expression of fault displacement and is hypothesized to be related to rock material properties such as shear strength and elasticity, as well as the driving stress; for example, as rock shear strength increases from a mudstone to a granite, c increases (Walsh and Watterson, 1988; Cowie and Scholz, 1992b; Gillespie et al., 1992; Ackermann et al., 2001; Kim and Sanderson, 2005; Schultz et al., 2008; Torabi and Berg, 2011). Reported values of c range from 0.0001 to 1 (Schultz et al., 2008; Torabi and Berg, 2011), although they typically fall between 0.001 and 0.1 (Schultz et al., 2008; Torabi and Berg, 2011). High values of c (i.e., c = 1) have been documented from strike-slip faults (MacMillan, 1975; Torabi and Berg, 2011).
This scaling relationship defined above has typically been used to: 1) assess the way in which normal faults form, with applications to geohazard analysis (Cowie and Scholz, 1992b), and 2) allow better prediction of fault dimensions, with applications to energy resource exploration and extraction, nuclear waste, and CO2 storage, which all rely on robust structural models that are commonly constructed from incomplete datasets (Torabi and Berg, 2011; Kolyukhin and Torabi, 2012). We may need to estimate L when only D (or vice versa) can be observed in an isolated field exposure or in a single 2D seismic reflection profile. For example, fault connectivity impacts fluid flow from source to reservoir, thus knowing how fault length might impact that, and how displacement may influence fault seal, is key when assessing the resource potential of a sedimentary basin.
When plotted in log-log space, the relationship between displacement and length appears strongly positively correlated across several orders of magnitude (see D/L plots in Walsh and Watterson, 1988; Cowie and Scholz, 1992a; Schlische et al., 1996; Kim and Sanderson, 2005; Torabi and Berg, 2011). However, the relationship between normal fault length and displacement is highly variable, and a one-size-fits all equation to describe D/L scaling is likely imprecise. Understanding how factors such as tectonic history, fault maturity, host rock lithology, and fault size effect D/L scaling, and using these observations to create bespoke D/L equations, will improve our ability to estimate either parameter.
D/L scaling relationships may not only describe the finite geometry of a normal fault, but they may also provide insights into how faults grow. For example, a linear relationship (i.e., n = 1) between D and L was used to justify a model of normal fault growth where faults accumulated displacement and length synchronously; this was originally referred to as the isolated fault model, but is now commonly referred to as the propagating fault model (e.g., Walsh and Watterson, 1988; Morley et al., 1990; Dawers et al., 1993; Cartwright et al., 1995; Manighetti et al., 2001; Walsh et al., 2003; Childs et al., 2017b; Rotevatn et al., 2019). It has also been suggested that asymmetric D/L fault profiles are showing that one fault tip is pinned and the other is propagating, which could justify a propagating fault model (Manighetti et al., 2001; Perrin et al., 2016).
Numerous studies have since challenged the notion that fault growth follows a linear trajectory in D-L scaling space and have instead argued that faults grow in accordance with the constant-length model, i.e., faults reach their near-final length rapidly and then accrue displacement without significant further tip propagation (e.g., Walsh et al., 2002, Walsh et al., 2003; Nicol et al., 2005, Nicol et al., 2017; Jackson and Rotevatn, 2013; Henstra et al., 2015; Fossen and Rotevatn, 2016; Hemelsdaël and Ford, 2016; Tvedt et al., 2016; Childs et al., 2017b; Rotevatn et al., 2019; Pan et al., 2021). Faults have also been shown to grow in accordance with the hybrid fault model; this combines the propagating and constant-length models, suggesting that faults grow in two distinct phases: 1) an initial phase (20%–30% of the faults life), when maximum fault length is reached by segment tip propagation and linkage and 10%–60% of displacement is accrued, 2) a second stage (the remaining 70%–80% of the faults life) when 40%–90% of displacement is accrued (Rotevatn et al., 2019). Some faults may also experience a stage of lateral tip-line retreat in the last ∼25% of their lives, where slip is concentrated along their central portions (Meyer et al., 2002; Morley 2002; Nicol et al., 2020; Lathrop et al., 2021).
It has been suggested that fault arrays grow in cyclical stages where faults alternate between quick lengthening stages and prolonged displacement stages (Pan et al., 2021). During the lengthening stage, faults grow via the constant-length model, lengthening quickly by linking with an adjacent fault, followed by a period of displacement without additional tip propagation. As rifts continue to develop, smaller faults in stress shadows (i.e., faults that are not optimally positioned to accommodate strain) become inactive as strain is partitioned and localised onto larger faults (Cowie and Scholz, 1992a; Gawthorpe & Leeder, 2000; Meyer et al., 2002; Pan et al., 2021). This pattern likely continues until extension stops in the area.
Global compilations of D/L data result in a range of scaling relationships with different values for both c and n. There are several possible reasons for this. First, these compilations may contain faults with errors in measurement of D and/or L, resulting in scaling laws that are not as reliable as we wish or need. Second, there has been little research into how D/L scaling relationships change for faults: 1) of different size, 2) forming in differing tectonic settings (i.e., if a fault forms due to the reactivation of an older structure, or whether it is newly formed in previously undeformed or only weakly deformed host rock), 3) forming in different host rock lithologies, and 4) that have been active for different lengths of time (i.e., fault maturity, which may relate to whether a fault is in a tectonically active area or not). It has been noted that these factors can cause high variability in global datasets (e.g., Cowie and Scholz, 1992a; Nicol et al., 2010; Rotevatn et al., 2019), but this variability has not yet been quantified (see Section 2). Finally, if faults really do grow via a constant-length or hybrid fault growth model, D/L ratios will vary greatly throughout the life of a fault, and thus D/L ratios from faults of different stages in their development are less meaningful, and a compilation of dynamic D/L data will more accurately show how faults grow than a single measurement taken: 1) at the end of a fault’s life, once it has become inactive, or 2) as a snapshot at a specific, possibly unknown time in the fault’s development.
It is clear there are numerous factors that may cause variability in the important, widely used relationship between normal fault displacement and length. In this paper we look closely at these two parameters, isolating various factors that could affect the relationship between the two, and proposing improved scaling laws for specific geological setting. We first summarise and discuss inconsistencies in previous compilations of D and L, critically quality checking the included data. We next provide a new open-source normal fault database that includes factors such as fault maturity, tectonic history, and host rock lithology, which previous work suggests may be important to consider when establishing and ultimately applying D/L relationships. We also compile data on normal fault D and L through time (i.e., from structures flanked by growth strata that permit displacement and length backstripping; Meyer et al., 2002; Tvedt et al., 2016; Jackson et al., 2017; Lathrop et al., 2021; Pan et al., 2021, physical analogue studies; Schlagenhauf et al., 2008; and numerical modelling studies; Finch and Gawthorpe, 2017) to show how faults may grow and how D/L ratios may change through time. Finally, we interrogate our new database and discuss how fault size, host rock lithology, regional tectonic history, and fault maturity affect fault growth and D/L scaling. Our new database of normal fault properties demonstrates that one-size-fits-all scaling relationships are overly simplistic and that D/L scaling relationships should not be used indiscriminately.
There are a range of geologic phenomena that can cause normal faults to be over or under-displaced, and that are known to influence D/L scaling laws. Several common errors in measurement can also influence D/L scaling laws. We briefly outline these and illustrate how the related data would theoretically plot in D/L scaling space (Figure 1), before highlighting measurement errors in published datasets.
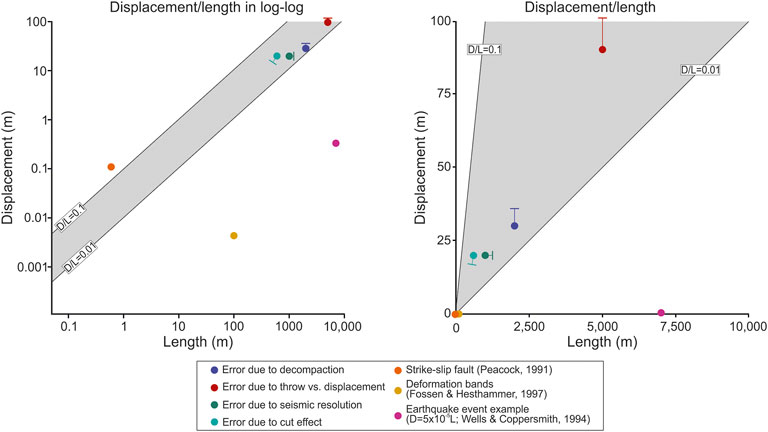
FIGURE 1. Schematic showing how errors in measurement and data from structures other than normal faults that can affect D/L scaling in log-log and linear space. Dots signify observed values and one-sided error bars delineate where the observed value should be.
Different geological phenomena could affect the relationship between fault length and displacement. Tectonic setting is said to affect the relationship between D and L (Cowie and Scholz, 1992a). Specifically, reactivated faults can establish their maximum length more quickly than non-reactivated faults, which means reactivated normal faults may have a relatively low D/L ratio, at least in the early stages of their growth (Walsh et al., 2002; Vétel et al., 2005; Baudon and Cartwright, 2008; Giba et al., 2012; Whipp et al., 2014).
The amount of time that a fault has been active can also affect D/L scaling. For example, Mouslopoulou et al. (2009) note that fault displacement rates vary through time, especially for “young” faults (<20 Kyr), which can result in ∼an order-of-magnitude scatter in D/L scaling. Nicol et al. (2010) demonstrate that active faults are under-displaced in the early stages of their growth, with the D/L ratio increasing with time (i.e., the constant-length fault model, e.g., Walsh et al., 2002; Walsh et al., 2003; Nicol et al., 2005; Nicol et al., 2010; Nicol et al., 2017; Rotevatn et al., 2019).
Host rock lithology can change the D/L ratio of a fault, with host rock lithology linked to shear modulus and Young’s Modulus. Walsh and Watterson (1988, 1989), Cowie and Scholz (1992b) and Wibberley et al. (1999) compare D/L scaling and host rock shear modulus, showing that stiffer lithologies (i.e., high shear modulus) are under-displaced compared to softer lithologies (i.e., low shear modulus). Agreeing with this, Gudmundsson. (2004) notes that faults with a low Young’s Modulus and D/L are inversely related, i.e., faults within softer and/or more deformed host rocks have a lower Young’s Modulus and higher D/L ratios (over-displaced), whereas faults within stiffer host rocks have a higher Young’s Modulus and lower D/L ratios (under-displaced). Several studies have also shown that mechanical stratigraphy can affect D/L scaling (Muraoka and Kamata, 1983; Nicol et al., 1996; Gross et al., 1997; Schultz and Fossen, 2002; Soliva et al., 2006; Roche et al., 2013, 2014). For example, faults can be stratigraphically confined within stiffer layers, with bounding softer or more compliant layers preventing faults from propagating vertically (but not laterally), and thus causing them to be under-displaced (Schultz and Fossen, 2002).
Fault size could also affect D/L scaling, although there is some disagreement as to precisely how. For example, Schlische et al. (1996) did not find a relationship between D/L and fault size, although in contrast, Cowie and Scholz (1992a) found that large faults (>1 km of displacement) are over-displaced compared to smaller faults, whereas Torabi and Berg (2011) noted that small faults (<1 m of displacement) and large faults (>1 km of displacement) have higher D/L ratios than medium faults (those with displacement between 1 m and 1 km).
When faults have along-fault changes in dip (i.e., fault dip changes in cross-section), strain, typically in the form of folding, is partitioned onto bends; this may cause faults to appear either over or under-displaced. According to estimates by Delogkos et al. (2020), fault bends can cause throw to be under-estimated by approximately 10%, and up to 50% in extreme cases. Related to this, fault drag can reduce the amount of displacement measured on a normal fault, especially on large faults (Walsh and Watterson, 1987; Gross et al., 1997; Kim and Sanderson, 2005; Childs et al., 2017a; Delogkos et al., 2017). Delogkos et al. (2017) noted that fault drag accounted for up to ∼24% of the total throw on faults with throws between 35 and 550 m.
Igneous sill emplacement can also modify D/L scaling. For example, the inflation of an igneous sill within the hangingwall of a pre-existing normal fault can cause reverse reactivation of the fault, causing a decrease in fault displacement and in the ratio between D and L. As a result, the fault geometry and related scaling relationship may not reflect the fault’s growth history (Norcliffe et al., 2021).
The growth of normal faults by linkage of segments can also cause faults to have multiple, smaller displacement maxima, instead of a single, large maximum displacement value. This can cause the faults to appear under-displaced (e.g., Peacock and Sanderson, 1991; Gillespie et al., 1992; Cartwright et al., 1995; Dawers et al., 1993; Acocella et al., 2000; Xu et al., 2006; Faure Walker et al., 2009).
Low-angle normal faults and listric faults with a low angle (dips between 20 and 30°) can have higher D values than standard normal faults due to their geometries (Morley, 2009; Madarieta-Txurruka et al., 2021). This could skew D/L scaling laws. Typically, this information is not reported, and we encourage future researchers to provide this information for future analysis.
In addition to the geological factors outlined above, the relationship between displacement and length could be affected by precisely where on a fault surface these values are measured, i.e., it is possible that the true maximum length and displacement have not been recorded (Kim and Sanderson, 2005; Torabi et al., 2019). Maximum displacement is typically located near the fault centre, however an arbitrary section of the fault exposed in outcrop may not pass through the centre, which is referred to as the “cutting effect” (Kim and Sanderson, 2005).
If fault offset is measured as throw instead of displacement and is then included in a D/L database without knowledge of fault dip, the D/L ratio would be inaccurate (Figure 1). This does not greatly alter the position of a data point on a D-L plot (Figure 1), but it could affect the derived scaling equations.
D/L ratios can be skewed if different types of faults are plotted together. For example, strike-slip faults tend to be over-displaced compared to normal faults, with D/L ratios being as high as 1:1, whereas normal faults have a maximum ratio of 1:2 (Kim and Sanderson, 2005; Torabi and Berg, 2011), so this could skew normal fault scaling laws towards being more over-displaced (Figure 1). The higher D/L ratios in this case are possibly due to fault length being measured parallel to slip direction, whereas fault length should be measured perpendicular to dip for a pure dip-slip normal fault (Kim and Sanderson, 2005; Torabi and Berg, 2011). It is also possible that oblique-slip faults could be included in a normal fault database, which could have a lower D than purely dip-slip normal faults.
Displacement and length relationships measured from individual earthquakes scale differently to those derived from faults, i.e., the average slip to rupture length scaling relationship for individual earthquake events is D = 5 × 10⁻⁵L (Wells and Coppersmith, 1994; Iezzi et al., 2018; Figure 1), thus data from individual earthquakes should not be added to D-L scaling databases. D-L data derived from individual earthquakes record only the length dimension of the slip patch and the magnitude of slip.
Deformation bands are mechanically different than tectonic faults; deformation bands experience strain hardening after formation due to grain interlocking, with strain then tending to localize elsewhere and form new bands instead of increasing displacement on existing bands (Fossen and Rotevatn, 2012). This causes deformation bands to be under-displaced compared to tectonic faults, usually having a value of n = 0.05. Inclusion of deformation bands in D/L scaling databases would thus skew D/L scaling relationships (Wibberley et al., 2000b; Schulz et al., 2008; Fossen and Rotevatn, 2012; Figure 1).
There is also error associated with D/L measurements obtained from normal faults imaged in 3D seismic reflection data. For example, length could be underestimated by a few hundred meters to a few kilometres, depending on fault size, due to the displacement near the fault tips being under seismic resolution (Yielding et al., 1996; Pickering et al., 1997; Rotevatn and Fossen, 2011). If fault displacement is measured in time- (rather than depth-) migrated seismic reflection data, a good knowledge of subsurface velocities is needed to accurately convert values of displacement in milliseconds two-way time (ms TWT) to metres. If these velocity data are poor, there will be uncertainty around D, and the D/L ratio may accordingly be inaccurate, i.e., if the applied velocity is too high, displacement, and the D-L ratio, will be under-estimated. Compaction could also decrease throw values (up to 20% compaction according to Taylor et al., 2008; Figure 1), which can be an issue for deeply buried faults in compactable, mudstone-dominated host rock.
The measurement errors described above can visually skew plotted data and significantly change calculated D/L scaling laws. D/L scaling laws are undoubtedly important for attempting to estimate D from L (or vice-versa), but D/L plots are also important as they are often used to qualitatively check if a D/L relationship is strong or weak. These errors can skew D/L plots to different extents, depending on how the data are presented (Figure 1). The effects of errors such as measuring throw instead of displacement, the cutting effect, the impact of post-formation decompaction, and issues related to seismically imaging low-displacement fault tips, result in changes that are apparent in a graph not presented in log-log space (Figure 1A), but that make little difference in a log-log D/L graph (Figure 1B). Data in log-log space tend to “hide” fluctuations due to small measurement errors, as data will move very little and will still lie within the range of values in the global database. These errors in measurement could change D/L scaling laws, but unless the error is more than an order of magnitude than the correct value, it likely will not be seen in log-log space. However, when structures other than normal faults, such as strike-slip faults and deformation bands, or measurements from singular earthquake events are included in a database, they fall significantly outside the typical range of D/L values (Figure 1). While more error is visible in a plot not in log-log space, there is a bias towards larger faults if the plot spans several orders of magnitude, as only the largest faults are visible when faults of all sizes are included on one plot (see Figure 1).
Several highly cited D/L and throw/L databases have been complied in the past 35 years (Walsh and Watterson, 1988; Cowie and Scholz, 1992a; Schlische et al., 1996; Bailey et al., 2005; Torabi and Berg, 2011). Some of the data included in these contributions do not measure true D or L, despite these data being reused in newer compilations. As a result, D/L scaling laws could be affected. The way in which these data were presented, in non-digital format, plotted tightly in log-log space, made the data unobtainable and non-replicable. We here review these complications and suggest which data points could inaccurately skew D/L scaling laws and should not be included in future databases.
Walsh and Watterson (1988) was, to the best of our knowledge, the first contribution that compared the relationship between length (referred to as fault width) and displacement using a global compilation of faults. 308 normal faults from the British Coalfields were compared to a global dataset of 58 faults from 22 sources (Supplementary Table S1). In that paper, the relationship between fault length and displacement was described as D=L2/P, where P (equivalent to c) is a variable and related to rock properties, such as host rock shear modulus, (e.g., Cowie and Scholz, 1992b; Bailey et al., 2005; Kim and Sanderson, 2005; Nicol et al., 2020). They use the assumption that n = 2 because all their data was bounded by a slope of 2, despite their data having an overall regression line of n = 1.58 (Walsh and Watterson, 1988). An average best-fit equation was not given, so the average value of c is not known. Of the 22 sources included in their dataset, nine had included data where D or L was not explicitly given, which could have skewed their final D/L scaling law. For example, neither D and/or L were included in some of the original sources used by Walsh and Watterson (1988) (Teas, 1929; Babenroth and Strahler, 1945; Brunstrom, 1963; Mayuga, 1970; Huntoon, 1974; Van den Bark and Thomas, 1980; Aitkenhead, 1985). We note that Teas (1929) lists the measurement of the “closure around the fault,” which was likely included as displacement, and Huntoon (1974) does not explicitly state fault length and displacement. We therefore assume that Walsh and Watterson (1988) may have established fault length and displacement from a schematic map of the study area (see Figures 2, 3, 5, 6 in Huntoon, 1974). In some papers, D and/or L were given as a range rather than a single value (i.e., displacement ranges from 100 to 500 m; Shepherd and Burns, 1978; Frost and Halliday, 1980), and Walsh and Watterson (1988) may have picked a mid-point or maximum value of the range; this could possibly change the derived scaling relationship, making the data appear over or under-displaced, depending on what value was chosen. The data from Babenroth and Strahler (1945) and Huntoon (1974) were also originally given as throw and was included in the Walsh and Watterson (1988) dataset as displacement, which could make the faults look slightly under-displaced; throw data could be converted to displacement if the fault dip is known or assumed, however this is not discussed in their methodology. It is also entirely possible that correct fault length and displacement values were given to Walsh and Watterson (1988), via personal correspondence with the authors, however that was not included in the methodology or indicated by an in-text citation.
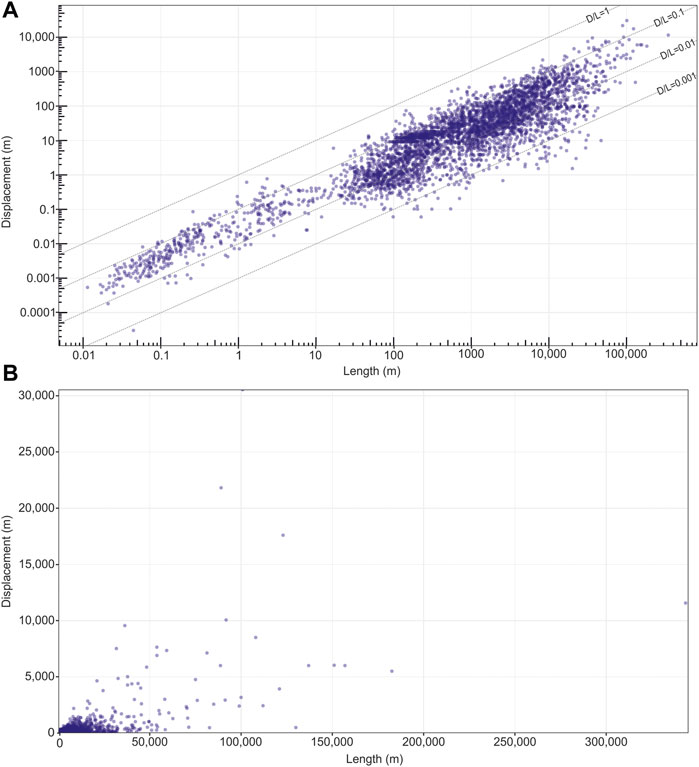
FIGURE 2. Plots showing fault length vs. displacement for all data in our database. (A) Data in log-log space. (B) Data in linear space.
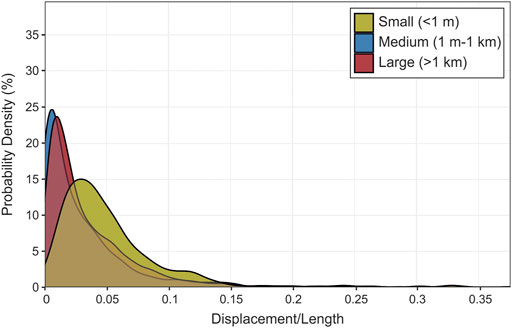
FIGURE 3. Density estimates of the D/L value of small, medium, and large faults in our dataset. Peaks in the density plot are at the D/L values with the highest probability.
Cowie and Scholz (1992a) subsequently compared D/L relationships of ∼210 faults compiled from nine different sources, one of which overlaps with the sources used in Walsh & Watterson (1988; Supplementary Table S1). Their data suggest a linear D/L scaling relationship (n = 1) (Cowie and Scholz, 1992a), which would suggest an equation of D=cL. Average values of c are not given. They note that large faults (defined as faults longer than 1 km) have a higher D/L ratio, possibly since faults that cut through the brittle upper crust (usually faults with L > 10 km) have a higher displacement (Cowie and Scholz, 1992a).
Cowie and Scholz (1992a) included normal faults, as well as thrust (Elliot, 1976), and strike-slip faults (MacMillan, 1975; Peacock, 1991) in their analysis. This was not an error as it was the intention of the paper, however grouping different types of faults together could skew D/L ratios. Additionally, neither D nor L data was presented in the data from Krantz (1988) (which contributed ∼12 of ∼210 data points) so we cannot be sure where, geologically speaking, these values were obtained from or how robust they are. Again, it is possible that the correct fault length and displacement values were obtained via personal correspondence.
Schlische et al. (1996) compared 201 normal faults from the Dan River Basin, USA to a global database of 346 faults from 11 sources, nine of which overlap with the earlier Walsh and Watterson (1988) and Cowie and Scholz (1992a) compilations (Supplementary Table S1). One of the key aims of this paper was to compare the D/L relationship of small (L <1.25 m) and larger faults. They found that D/L did not vary as a function of fault size. Of the faults in their global compilation, 174 were strike-slip faults from two different sources, and 172 were normal faults from 11 different sources (Supplementary Table S1). They note a broadly linear relationship between D and L (n = 1), with c values between 0.001 and 1; some of the variability in c could be due to the inclusion of strike-slip faults in the dataset, which typically have a higher D/L ratio than normal faults (Kim and Sanderson, 2005). The best fit curve through the compiled data is arithmetically defined by D = 0.03L1.06, with the authors noting that there is no significant change in the D/L scaling relation across many orders of magnitude.
Bailey et al. (2005) compared throw-length (rather than displacement-length) relationships of their 7862 normal faults from the East Pennine Coalfield, UK to a global dataset of 1756 faults from 46 different sources, 22 of which overlap with Walsh and Watterson (1988), Cowie and Scholz (1992a), or Schlische et al. (1996) (Supplementary Table S1). Of the 46 sources used, 29 had potential errors in measurement, included data that was not from normal faults, or were from a source that was not publicly available; together, these issues could have affected the derived D/L scaling law. For example, length and/or displacement/throw are not listed in the original sources of several datasets (Beck, 1929; Teas, 1929; Babenroth and Strahler, 1945; Brunstrom, 1963; Woodland and Evans, 1964; Wood et al., 1969; Mayuga, 1970; Huntoon, 1974; Van den Bark and Thomas, 1980; Aitkenhead, 1985; Gillespie et al., 1993). For example, Beck (1929) only had displacement shown in a schematic cross-section, Krantz (1988) only measured slip vector direction, Gillespie et al. (1993) measured fault spacing, and Gross et al. (1997) measured maximum dip separation, yet all these values were included as throw. Thrusts were included in the compilation (Fox, 1959; Elliott, 1976; Rowan, 1997), as well as strike-slip faults (Freund, 1970; MacMillan, 1975; Peacock, 1991). Data from unpublished (and still publicly inaccessible) theses were also included (MacMillan, 1975; Gillespie, 1991), as were data from individual earthquakes (Jackson et al., 1996). Some faults had either displacement or length listed as a range of values instead of a single measurement (see Figure 1) (Shepherd and Burns, 1978; Frost and Halliday, 1980). There were also some duplicate data, where the same faults were studied in two separate papers and both were included; note that this does not visually affect the data plot but can influence scaling relationship calculations (Dawers et al., 1993; Dawers and Anders, 1995). Deformation bands were also included as faults (Fossen and Hesthammer, 1998), with these structures having displacements up to two orders-of-magnitude smaller than tectonic faults of the same length. Several sources measured fault displacement in their original sources (Muroaka and Kamata, 1983; Walsh and Watterson, 1988; Opheim and Gudmundsson, 1989; Marrett and Allmendinger, 1991; Dawers et al., 1993; Nicol et al., 1996; Schlische et al., 1996), but were included in Bailey et al. (2005) as throw. Despite these issues, the data compiled by Bailey et al. (2005) has been used in several subsequent papers (Nicol et al., 2010, 2017; Reilly et al., 2017; Rotevatn et al., 2019; Bramham et al., 2021).
To the best of our knowledge, the most recent compilation of D and L is by Torabi and Berg (2011), who studied faults in siliciclastic rocks from 27 sources, 16 of which have overlap with Walsh and Watterson (1988), Cowie and Scholz (1992a), Schlische et al., 1996, or Bailey et al. (2005) (Supplementary Table S1). The total number of faults they include is unclear, as the data is very tightly spaced in the presented scatterplot and the raw data are not available for analysis. However, in the text they state these data are for normal faults from 22 sources, reverse faults from four sources, and strike-slip faults from three sources (some sources had more than one type of fault; Supplementary Table S1). Torabi and Berg (2011) consider the potential causes of scatter in the data, such as the underestimation of the frequency of small faults (truncation effect), and the under-estimation of the frequency of long faults due to sample line limitations (censoring effect). They found that small faults (L<1 m) and large faults (L>1 km) have a similar D/L ratio, and that medium-sized faults (L = 1–1,000 m) tend to be comparatively under-displaced (Torabi and Berg, 2011). They suggest this difference arises because medium-sized faults are still growing by segment linkage, and that their D/L ratio will eventually match that of larger faults as they mature (Torabi and Berg, 2011). They also found that strike-slip faults are over-displaced compared to normal and reverse faults, and that cataclastic deformation bands are under-displaced compared to faults (Torabi and Berg, 2011). Length and/or displacement was also not listed in the original sources of several datapoints (Krantz, 1988; Gillespie et al., 1993. Vertical offset (i.e., throw) was measured in Villemin and Sunwoo (1987), which would vary slightly from displacement.
Our D/L database includes 4,059 normal faults from 66 sources (Supplementary Table S2), ranging in length from 10 mm to 245 km, in age from the Carboniferous to presently active faults, and in duration of activity from faults that were active for >100 Myr to those that have been active for <1 Myr, and includes natural faults and those generated by physical and numerical models (Supplementary Table S2). Maximum length and maximum displacement are noted in our database, along with fault host rock lithology, fault maturity, and tectonic history when the information is available. We focused on these parameters because they are known to affect fault growth (e.g., Cowie and Scholz, 1992a; Torabi and Berg, 2011), and they provide a relatively easy and replicable way of characterizing and comparing faults. All the data are provided in raw format and are publicly available, such that the wider geologic community can easily access, analyze, and add to. We created what was to our knowledge at the time of the submission of this manuscript, all of the normal fault data that could be found, however it is likely that additional data exists that we did not include, and additional sources will continue to become available in the future.
When displacement and length were not explicitly stated in the original sources, we used data acquisition software (Quintessa Graph Grabber; https://www.quintessa.org/software/downloads-and-demos/graph-grabber-2.0.2) to pick the displacement and length from graphs. This yields a certain level of error, especially when taking values from a graph in log-log space, because: 1) several overlapping data points may only yield one datapoint; and 2) there is some minor imprecision on where the extracted data lie on the X (length) and Y (displacement) axis, which in a log-log plot could be moderately significant (see Figure 1).
To be included, faults had to be normal (i.e., extensional) faults dominated by dip-slip kinematics; reverse and strike-slip faults were not included. All of the included faults were reported to be purely dip-slip in their original sources; however the results could be skewed if the faults did have an oblique slip component. Fault length is defined as ‘the longest horizontal or sub-horizontal dimension along the fault plane, perpendicular to slip direction (Watterson, 1986; Kim and Sanderson, 2005). Fault displacement describes the movement between two fault blocks, calculated by measuring an offset marker bed separated by a fault (Walsh and Watterson, 1988; Xu et al., 2006). Displacement should be measured at its maximum point on the fault. If throw was listed in the original source, it was converted to displacement using the listed fault dip, or an average 55° when fault dip was not explicitly stated. An average dip of 55° is used because normal fault dip tends to range between 40 and 70°. All data are from geologic faults and not individual earthquakes. Faults have been sorted and analyzed by size. We use length as a measure of fault size, defining three classes: small (<1 m), medium (1 m−1 km), and large (>1 km) (see also Torabi and Berg, 2011).
Since host rock lithology might influence scaling laws, we sorted D/L data into the following groupings: clastic (fine-grained sand and coarser), fine-grained clastic (siltstone and finer), carbonate (specifically a carbonate “coarser” than lime-mud), fine-grained carbonate (e.g., lime mud), mixed carbonate-clastic, evaporite-bearing sedimentary rocks, igneous, igneous with clastic, and unlithified sand. Faults with metamorphic host rocks have been included in the database, however there were not enough to calculate meaningful statistics, so they were not included in our analysis. Information on host rock lithology could not be found for every fault, and it is only included in the database when explicitly listed by the author or found in another source documenting the same basin. Faults often offset a variety of host rock lithologies, especially for large faults, but they were categorized by the dominant lithology (i.e., over c. 50%). “Carbonate” host rocks are those with >50% carbonate material that is coarser than lime-mud. Faults with host rocks classified as “clastic sedimentary” have host rocks whose lithologies are >50% clastic sedimentary rock, with sand-sized or coarser grains. Faults with host rocks classified as sedimentary with evaporites have host rocks whose lithologies are sedimentary rocks in areas with evaporites; not every fault is necessarily physically linked to an evaporite detachment. Faults with host rocks classified as “fine-grained clastic” have host rocks whose lithologies are >50% clastic sedimentary rock with silt-sized or smaller grain sizes. Faults in rocks classified as “fine-grained carbonate” have host rocks whose lithologies are >50% carbonate rock with fine-grained lithologies, such as lime-muds. Faults in rocks classified as “mixed carbonate and clastic” have host rocks whose lithologies are roughly 50:50 clastic and carbonate. Faults with host rocks classified as “unlithified” were formed in unlithified sediment at the time of active faulting. Faults with host rocks classified as “igneous” have igneous host rocks. Faults in rocks classified as “sedimentary with igneous” have both sedimentary and igneous host rocks. Faults in metamorphic host rocks were included in the overall dataset, however, there were not enough of them to be statistically significant, so they are not separated in their own sub-group. To compare the relationship between D/L to lithology and Young’s Modulus, we compiled a list of known Young Modulus for different lithologies from published sources to find a range of possible values and average value for each lithology; these data can be downloaded here https://figshare.com/articles/dataset/Young_s_Modulus/17087342.
Faults were also classified based on tectonic history to assess how end-member tectonic histories might affect their length and displacement. More specifically, we categorized them as reactivated and no pre-existing structures; the former are from areas where faults clearly reactivated structures that after a period of quiescence, became active again. These faults may have formed in response to the reactivation of structures that previously experienced extensional, compressive, strike-slip deformation, or a combination of these, before being reactivated as normal faults. Faults categorized as having no pre-existing structures are from areas thought to have not experienced significant earlier deformation. Information on tectonic history is not always available, so not every fault is categorized this way.
Faults were classified as active and inactive; this allowed us to assess whether active faults show different length and displacement relationships compared to inactive (i.e., dead) faults. Faults categorised as active are from study areas where faults are currently active in tectonically deforming regions, although every fault might not necessarily be active. Faults categorised as inactive are from areas that are not tectonically active, i.e., inactive rifts now buried and imaged in seismic reflection data or exposed in the field in exhumed basins. This information is not available for every fault in the database, so not every fault is included in this categorization. Care must be taken with these data because it is possible for an active fault to have been active for a long period of time and thus be over-displaced compared to an inactive fault that became inactive prematurely due to the removal of the driving stress. Additionally, faults displacement measurements could be affected by climate and erosion, especially faults that have been inactive for a long period of time.
We stress that care must be taken when evaluating how these factors affect D/L scaling relationships as it might be difficult or impossible to isolate the role of each. For example, if a large fault is newly active, has an igneous host rock, and formed due to reactivation of a pre-existing structure, it may be difficult or impossible to determine which factors has the most influence on its D/L ratio.
For each subcategory, we present the data in four ways: 1) in log-log space—even though data can visually “hide” in log-log space (Rotevatn et al., 2019), they allowed us to view all data in one plot where all orders of magnitude can be seen together 2) in non-log-log space, with data shown all together in one graph spanning all orders of magnitude—this allowed us to show overall D/L average trendlines, even though smaller faults cannot be visualised, 3) non-log-log space, grouped by order-of-magnitude so that all of the data can be seen more clearly (Supplementary Figures S1–3), 4) and in a probability density plot. Probability density plots calculated the probability density of D/L values in the each of the different aforementioned categories. We used a kernel density estimation (KDE), which is a non-parametric method of estimating the probability density of a function of a random value, in this case D/L. The height of each plot (y-axis) corresponds to the probability density of the data at a given value of D/L (x-axis). The peaks of the density plot are at the D/L values with the highest probability. A log-log linear model (linear regression) was conducted to calculate a scaling law relationship of the entire dataset, as well as each sub-category (i.e., fault size, tectonic history, fault maturity, host rock lithology). Power law relationships were used because that is the standard in the literature when relating fault displacement and length, and because it tended to fit the data best. When describing faults throughout the paper, we refer to faults as over-displaced if D/L>0.1 and under-displaced if D/L<0.01.
In our database, faults are 0.011–344,800 m long (Figure 2) and have a power-law trendline of Dmax = 0.03L0.92±0.01 (i.e., n = 0.92±0.01 and c = 0.03; Table 1). Our value of n is thus broadly consistent with the estimate of Cowie and Scholz (1992a) and others (n = 1) for normal faults. However, there is a large amount of scatter in our data, with displacements for a given fault length ranging across 1.5–4 orders of magnitude (Figure 2). In this section we investigate how D/L relationships are affected by fault size, maturity, tectonic history, and host rock lithology. We also look at examples of how D and L (and their related scaling relationship) change through time, assessing how this relates to the D/L global database, which is based on finite (i.e., present) fault geometry.
TABLE 1. Table listing of all the results for each of the studied categories, including number of faults, number of sources, power-law equation that can be used to estimate fault length or displacement, and the R-squared for that equation.
A total of 395 small faults were included from 11 different sources, 3246 medium faults were included from 48 sources, and 394 large faults were included from 35 sources (seen in Figure 2). The dataset includes small faults from areas such as the High Atlas, Morocco and the Dan River Rift, USA, medium faults from areas such as the Pyrenees and Utah, USA, and large faults from areas such as the Levant Basin, offshore Lebanon, and the North Sea, offshore Norway. Our data show that small faults have a higher D/L ratio, with a power-law trendline indicating Dmax = 0.04L0.97± 0.02, n = 0.97± 0.02 and c = 0.04; Table 1; Figure 2). Medium and large faults have similar power-law trendlines of Dmax = 0.03L0.94± 0.01 and Dmax = 0.001L1.3± 0.01, respectively, n = 0.94± 0.01 and c = 0.03 for medium faults and n = 1.3± 0.11 and c = 0.001 for large faults (Table 1). However, the values of n of small and medium faults are within the same confidence interval (Table 1).
There is a significant amount of scatter in the relationship between D and L, especially for larger faults (i.e., 3–4 orders of magnitude; Figure 2). For example, faults that are 10,000 m (±200 m) long have displacements ranging from 4 to 999 m, with a standard deviation of 303 m. In contrast, medium faults only vary by 1–2 orders of magnitude (Figure 2). For example, faults that are 50 m (±1 m) long have displacements ranging between 0.3 and 7 m, with a standard deviation of 1.6 m. Small faults have the least amount of scatter, with displacements that vary by only 1–1.5 orders of magnitude (Figure 2). For example, faults that are 0.1 ± 0.05 m long have displacements between 0.002 and 0.01 m, with a standard deviation of 0.003 m.
Medium and large faults plot similarly in a probability density plots (Figure 3); there is a ∼24% probability and ∼23% probability, respectively, of a D/L value of ∼0.02, i.e., medium to large faults in the dataset are most likely to have a displacement that is ∼2% of fault length. More small faults in the dataset were over-displaced compared to medium and large faults; small faults have a ∼15% probability of a D/L value of ∼0.035, i.e., small faults in this dataset are most likely to have a displacement that is ∼3.5% of fault length (Figure 3). The shape of the distribution of small faults is relatively long-tailed, meaning that there are more small faults with a higher D/L value than medium or large faults.
1959 active faults from 27 sources were included, ranging in size from 0.3 m to 345 km in length, with data from areas such as Crete, the Apennines, Italy, and the Turkana Rift, Kenya (Figure 4). A total of 2059 inactive faults were included from 38 sources, ranging in size from 0.01 m to 123.4 km in length, with data from areas such as the Exmouth Plateau, offshore NW Australia, Horda Platform, offshore Norway, and the Levant Basin, offshore Lebanon (Figure 4).
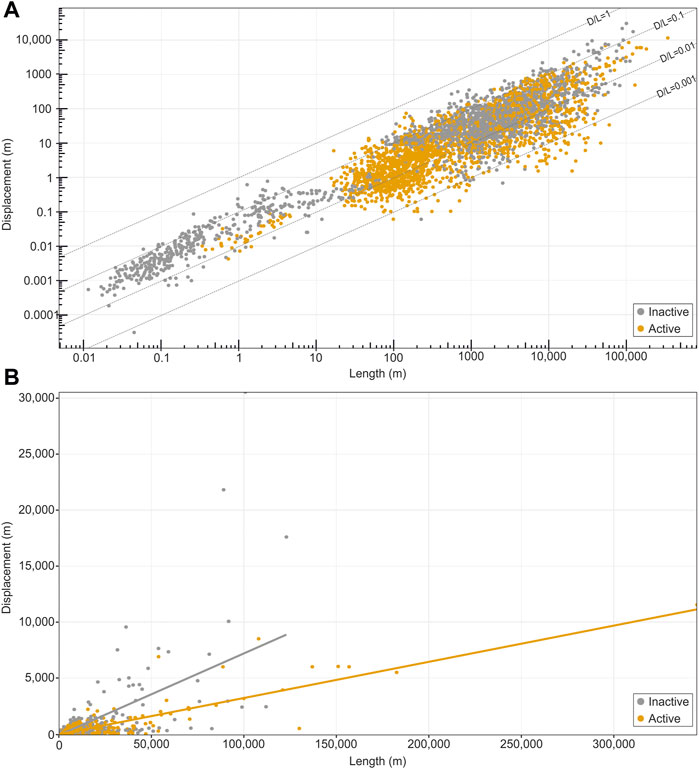
FIGURE 4. Plots showing fault length vs. displacement for active and inactive normal faults in our database. (A) Data in log-log space. (B) Data in linear space.
The active faults have a power-law trendline of Dmax = 0.03L0.90± 0.01, which requires n = 0.90±0.02 and c = 0.03, whereas inactive faults have a trendline of Dmax = 0.05L0.93± 0.01, which requires n = 0.93±0.01 and c = 0.05 (Table 1). The confidence values of n for inactive and active faults overlap (Table 1). Inactive faults have a higher displacement/length ratio than active faults (Figures 4B, 5).
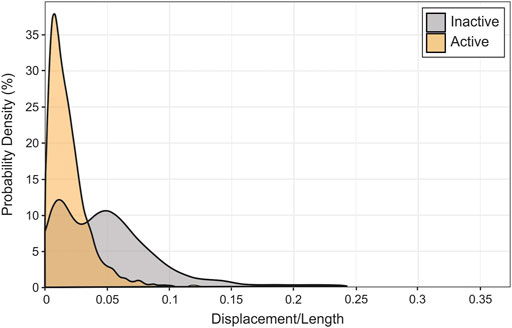
FIGURE 5. Density estimates of the D/L value of active and inactive faults in our dataset. Peaks in the density plot are at the D/L values with the highest probability.
According to the probability density plot (Figure 6), there is a ∼37% probability of active faults having a D/L value of ∼0.025, i.e., active faults are most likely to have a displacement that is 2.5% of length. Inactive faults have two probability peaks; there is ∼12% probability of a D/L value of 0.025 and ∼11% probability of a D/L value of 0.05, i.e., inactive faults are most like to have a displacement that is ∼2.5% or ∼5% of length. The density plot of inactive faults has a longer tail, which means that higher D/L values are more probable in inactive faults than active faults.
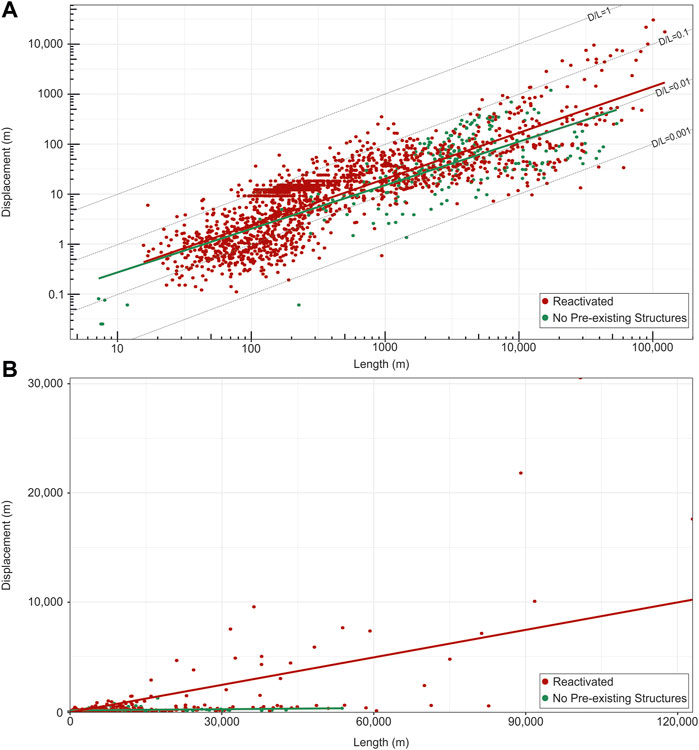
FIGURE 6. Plots showing fault length vs. displacement for reactivated and non-reactivated normal faults in our database. (A) Data in log-log space. (B) Data in linear space.
1,620 reactivated faults from eight sources were included, ranging in size from 17 m to 123 km in length, with data from areas such as the Porcupine Basin, offshore Ireland and the North Malay Basin, Thailand (Figure 6). 265 faults with no pre-existing structures were taken from 15 sources from areas such as Canyonlands, Utah, USA and the East Pacific Rise (Figure 6). Faults range in size from 0.2 m to 54 km. The reactivated faults have a power-law trendline of Dmax = 0.03L0.92± 0.01, n = 0.96± 0.1 and c = 0.03, and the non-reactivated faults have a power-law trendline of Dmax = 0.04L0.87± 0.05, n = 0.87± 0.05 and c = 0.04 (Table 1). Reactivated faults have a higher D/L ratio on average than faults not forming in the presence of a pre-existing structure or structures (Figure 6B). This is unusual, given several authors have suggested that reactivated faults tend to be under-displaced (Walsh et al., 2002; Vétel et al., 2005). We discuss the possible reasons for this in Section 6.3.
In probability density plots (Figure 7), reactivated faults and faults with no pre-existing structures plot similarly; for reactivated faults and faults with no pre-existing structures, there is a ∼27% and ∼24% probability, respectively, of a D/L value of ∼0.025, i.e., both reactivated faults and faults with no pre-existing structures in this dataset are most likely to have a displacement that is ∼2.5% of length. The distribution of reactivated faults has a slightly longer tail, which means that there is a slightly higher probability of reactivated faults having a higher D/L value.
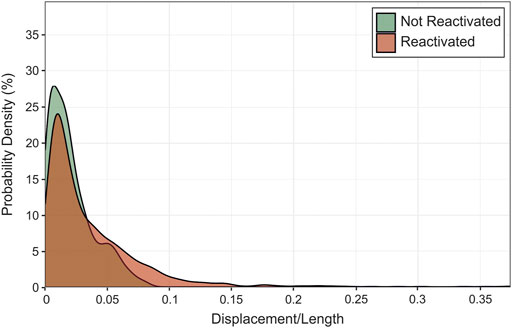
FIGURE 7. Density estimates of the D/L value of faults that have and have not been reactivated in our dataset. Peaks in the density plot are at the D/L values with the highest probability.
A power-law trendline was calculated for each lithology sub-category, with n values ranging from 0.007 to 1.1 and c values from 0.79 to 1 (Table 1). The confidence intervals for n of faults in fine-grained carbonate, fine-grained clastic, mixed carbonate/clastic, and sedimentary with igneous rocks overlap and other host rocks do not (Table 1). Faults with clastic sedimentary and fine-grained clastic sedimentary host rocks tend to have a higher D/L ratio (i.e., they are over-displaced) compared to the other lithologies (Figure 8). Faults with igneous host rocks tend to have a lower D/L ratio compared to the other lithologies (Figure 8).
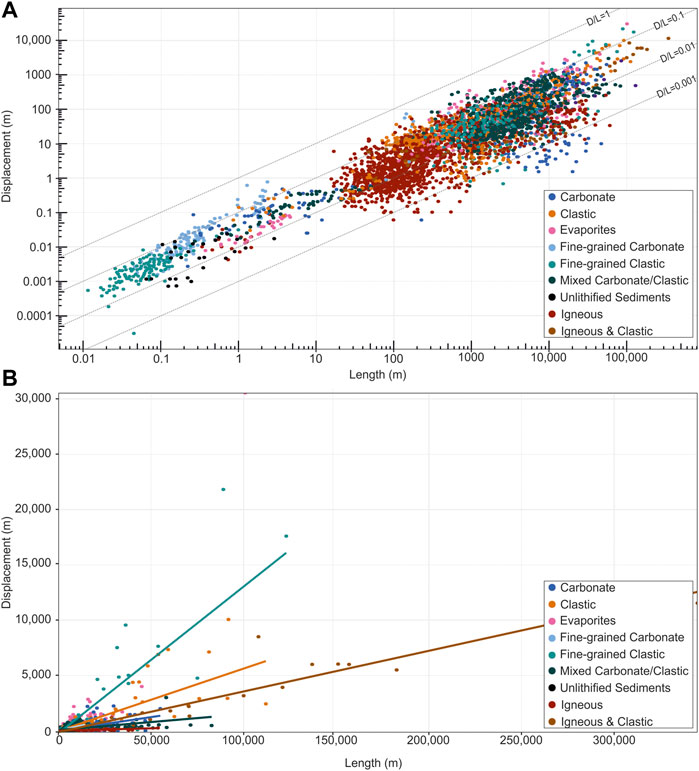
FIGURE 8. Plots showing fault length vs. displacement for normal faults with host rocks of different lithologies included in our dataset, including carbonate, clastic, evaporites, fine-grained carbonate, fine-grained clastic, mixed carbonate/clastic, unlithified sediments, igneous, and igneous/clastic. (A) Data in log-log space. (B) Data not in linear space.
According to density plots (Figure 9), clastic sedimentary rocks have the highest probability of high D/L values compared to the other lithologies, i.e., there is a ∼13% probability of a fault in a clastic host rock having a D/L value of ∼0.09, i.e., faults with clastic sedimentary host rocks in this dataset are most likely to have a displacement that is ∼9% of the fault length. Faults with igneous and clastic with igneous host rocks have a higher probability of low D/L values than other lithologies; for igneous and clastic with igneous host rocks, there is a ∼32% and ∼35% probability respectively of a D/L value of ∼0.01, i.e., faults with igneous or igneous/clastic host rocks are most likely to have a displacement that is ∼1% of length.
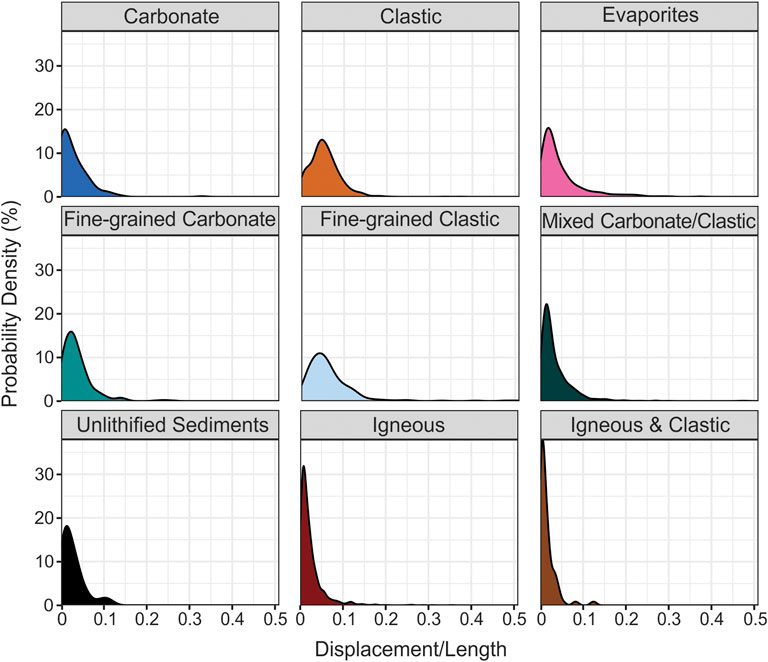
FIGURE 9. Density estimates of the D/L value of faults with host rocks of different lithologies included in our dataset, including carbonate, clastic, evaporites, fine-grained carbonate, fine-grained clastic, mixed carbonate/clastic, unlithified sediments, igneous, and igneous/clastic. Peaks in the density plot are at the D/L values with the highest probability.
37 faults from six different sources were included in a dynamic D-L through time dataset (Figure 10). 24 natural faults imaged in 3D seismic reflection data were included, with these faults being 1.9–42 km long. Six faults generated in physical analogue models and three from numerical models were also included. The D/L trajectories of these faults are shown against the global D/L database (Figure 10A) and in normalised D vs. time and L vs. time plots (Figure 10B).
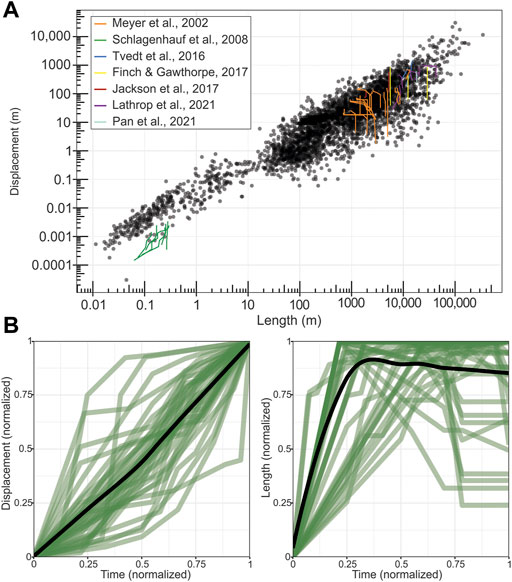
FIGURE 10. Figures showing fault growth through time (with data extracted from Meyer et al., 2002; Schlagenhauf et al., 2008; Tvedt et al., 2016; Finch and Gawthorpe, 2017; Jackson et al., 2017; Lathrop et al., 2021; Pan et al., 2021). (A) Global D/L dataset (black) for normal faults in log-log space with D/L through time data in colour above it. (B) Displacement and length through time, normalised in green, average values in black.
There is a wide range of displacement trajectories in the studied faults. For example, in the first 25% of the faults’ lives, some faults had only accumulated only 6% of their (eventual) total displacement, whereas others had reached up to 75% of their final maximum displacement (Figure 10B). On average, faults accumulate displacement at a constant rate, although on a fault-to-fault basis there is more variability (Figure 10B). 26 of the 37 (70%) faults attain >75% of their maximum length within the first 25% of their lives, and 35 of 37 (95%) faults reach their lengths within the first half of their lives (Figure 10B). Faults then either maintain their maximum length or decrease in active trace length until they become inactive. On average, faults reach their maximum length within the first 30% of their lives and then decrease in length by 5%–10%. 23 of the 37 (62%) faults experience late-stage lateral tip retreat, where their tips become inactive in the later stages of the faults’ lives.
We here summarise some key observations regarding the relationship between normal fault D and L, and fault size, activity, tectonic history, and lithology, and then use specific, well-constrained case studies to indicate how the various parameters control fault growth and associated scaling relationships. We then discuss D/L changes through time, fault growth models, and the processes that control the upper limits of the D/L scaling relationship.
There is little consensus in the literature on how fault size affects the relationship between D and L. Schlische et al. (1996) found no relationship between fault size and D/L ratio. In contrast, Cowie and Scholz (1992a) found that very large faults (>1 km) were over-displaced compared to smaller faults. Torabi and Berg (2011) showed that small faults (<1 m displacement) and large faults (>1 km displacement) have a higher displacement/length ratio than medium faults (between 1 m and 1 km), suggesting both small and large faults are over-displaced. They explained that the low D/L ratio of medium-sized faults is likely due to faults of this size being in the process of overlapping, interacting, and linking, i.e., they will eventually become larger and accrue more displacement (Torabi and Berg, 2011). However, the low D/L ratio of these faults could be due to sampling biases, i.e., there is a scarcity of published medium-sized faults included in their database.
Our results show that large and medium-sized faults have similar displacement/length ratios, but that small faults (<1 m) tend to be relatively over-displaced (Figure 3). Assuming a constant-length growth model (e.g., Walsh et al., 2002; Jackson et al., 2017; Rotevatn et al., 2019), faults reach their maximum length quickly and then accumulate displacement. Medium and large faults are active for a longer period, and under a constant-length model they are likely to have reached their maximum length and to be in some stage of displacement accrual and thus be under-displaced. Under-displaced medium-to-large faults could either be still active and in the displacement accrual stage or they could have become inactive before they reached their maximum displacement potential (e.g., due to kinematic interactions between faults, strain partitioning onto more optimally positioned faults). Small faults are active for a shorter period, so faults can lengthen and accumulate a relatively high amount of displacement and are less likely to become inactive before reaching their maximum possible displacement.
Duration of faulting may also explain scatter in the global D/L plot, i.e., the displacement on large faults, which presumably have been active for longer than small faults, span up to four orders of magnitude, whereas small faults only span 1–1.5 orders of magnitude (Figure 2). Scatter for large faults represents faults that have become inactive prematurely, and the lack of scatter for small faults may represent fault growth stages not detectable using, for example, seismic reflection data (e.g., Jackson et al., 2017; Rotevatn et al., 2019).
Fault length and displacement accumulation tend to be strongly partitioned in time (Figure 10B) (e.g., Walsh et al., 2002; Tvedt et al., 2016; Rotevatn et al., 2019). Thus, if the maximum displacement had (in the case of an inactive fault) or has (in the case of a still-active fault) been measured part-way through a fault’s life rather than at the end, it would plot as under-displaced, assuming a constant-length growth model. When estimating fault scaling, it is important to keep in mind if the faults are active, and if so, how mature they are. However, there is still a huge amount of scatter among both active and inactive faults; inactive faults trend over-displaced compared to active faults (Figures 4, 5), however the scaling laws between inactive and active faults have n values with overlapping confidence intervals (Table 1). Faults can become inactive at any point in their maturity, for example dying pre-maturely with relatively low displacement, which could also add additional scatter.
We would expect that active faults tend to be younger and have been active for less time compared to inactive faults; they thereforecould be comparatively under-displaced. This aligns with our understanding of fault growth under a “constant length” or “hybrid growth” model (Walsh et al., 2002, 2003; Nicol et al., 2005, 2017; Jackson and Rotevatn, 2013; Henstra et al., 2015; Fossen and Rotevatn, 2016; Hemelsdaël and Ford, 2016; Tvedt et al., 2016; Childs et al., 2017b). Under a constant-length or hybrid growth model, faults reach their maximum length in the first 20%–30% (or less) of their life. Active faults could be generally under-displaced because they have reached their maximum length but are still accruing displacement, however the relationship is not clear (Table 1).
One example from the database of under-displaced, immature normal faults come from the Taupo Rift on the central North Island of New Zealand (Nicol et al., 2010; Figure 11A). Rifting began 1–2 Ma, with the studied faults having been active for 60 and 300 kyr. The area is tectonically active, and the faults accommodate 15 mm/yr of extension. The older faults, which have been active for 300 kyr, are 2.3–70.7 km long and have displacements ranging between 20.7 and 2,198 m. Dmax/L is between 0.002 and 0.06 (average 0.017) (Nicol et al., 2010; Figure 11A). In contrast, the younger faults, which have been active for only 60 kyr, are 487 m to 28.7 km long, have displacements ranging between 1 and 97.9 m, and a Dmax/L between 0.0009–0.01 (average 0.004) (Nicol et al., 2010; Figure 11A). It is often difficult to deduce whether a fault is under-displaced due to fault maturity or lithology (see Section 3); however, in the Taupo Rift case, given that these faults formed in the same host rock, it is likely these still-active faults are under-displaced solely due to fault maturity.
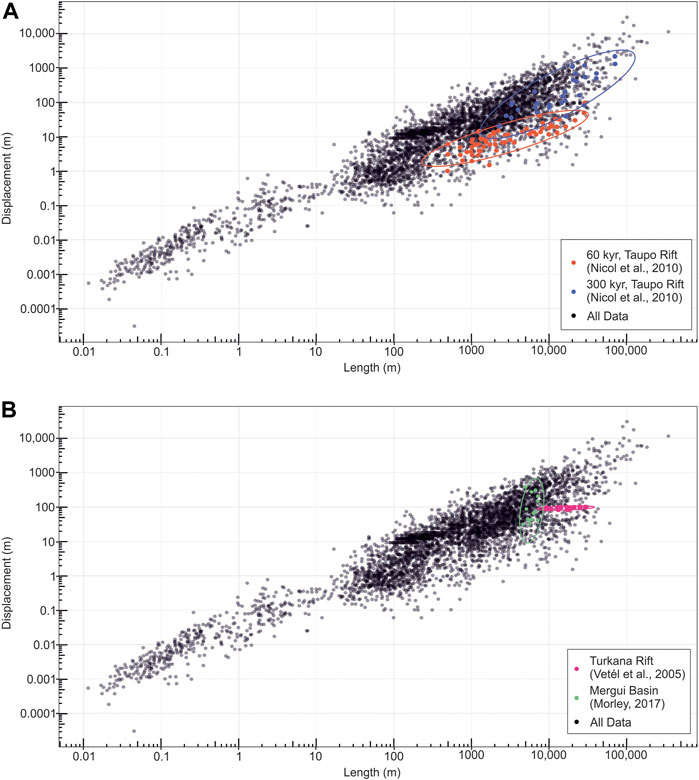
FIGURE 11. (A) Global D/L dataset (black) for normal faults in log-log space with faults of different maturities highlighted: 60 kyr faults from the Taupo Rift in orange and 300 kyr faults from the Taupo Rift in purple (from Nicol et al., 2010). (B) Global D/L dataset (black) for normal faults in log-log space with reactivated faults highlighted: faults from the Turkana Rift in pink (from Vétel et al., 2005) and the Mergui Basin in green (from Morley, 2017).
The Taupo Rift faults are under-displaced compared to a set of inactive faults of similar length from the Exmouth Plateau, offshore NW Australia (Pan et al., 2021). Faults on the Exmouth Plateau were active from the Early Jurassic-Early Cretaceous (85.5 kyr), are 307 m to 181.2 km long, and have displacements ranging between 18.2 and 857.6 m (Pan et al., 2021). Dmax/L is between 0.006–0.5 (average of 0.06). These faults grew in accordance with and support the constant-length model, reaching their final length in less than 7.2 myr (8% of their total lifespan) before accruing significant displacement (Pan et al., 2021).
Faults that formed in response to the reactivation of a pre-existing structure tend to be slightly over-displaced compared to faults in areas that have no reported pre-existing faulting (Figures 6B, 7). Previous studies indicate reactivated faults tend to have a higher displacement to length ratio because the maximum length of the fault is generally established in the first phase of faulting (Vétel et al., 2005; Baudon and Cartwright, 2008). However, we believe that role the reactivation of older structures and thus pre-extensional tectonic history plays in controlling D/L ratios is strongly dependent on how long the fault has been active during its most recent deformation, since newly formed faults will tend to be under-displaced, according to both the constant-length and hybrid fault growth models (Rotevatn et al., 2019).
One example of reactivated normal faults is from the tectonically active Turkana Rift, Northern Kenya (Vétel et al., 2005; Figure 11B in pink). Faults here range from 208 m to 29.5 km long, have displacements ranging from 82.5 to 101 m, and have been active for <3 Myr (Vétel et al., 2005). Faults are thought to have reactivated Proterozoic basement faults, or possibly utilised basement metamorphic foliation, and the area currently extends with a strain rate of ∼0.1 mm/yr (Vétel et al., 2005). Fault arrays were able to reach relatively long lengths (∼40 km) in a relatively short period of time, despite these relatively low strain rates, likely due to them exploiting and activating pre-existing weaknesses (Vétel et al., 2005). The average D/L ratio is 0.007, (displacement is 0.7% of length). These faults are thus under-displaced, which is likely due to them having lengthened rapidly by exploiting intra-basement weaknesses; these faults are thus likely still at the beginning of their displacement accumulation stage.
An example of more mature, but still-active reactivated faults come from the Mergui Basin, Thailand (Morley, 2017; Figure 11B, in green), which unlike the Turkana Rift faults (Vétel et al., 2005) are relatively over-displaced. The area has a complicated tectonic history: the Mergui basin experienced Triassic-Early Jurassic and Early Cenozoic transtension, with the related strike-slip faults later reactivated as normal faults (Morley, 2017). These faults have been active since the Early Eocene to Late Miocene, are 20.9–123 km long, and have 458 m-21.8 km displacement (Morley, 2017). They are over-displaced, with a D/L average of 0.14 (displacement is 14% of length), with D/L ratios as high as 0.26. These faults are over-displaced because they were able to establish their maximum length quickly by exploiting and reactivating pre-existing weaknesses inherited from previous faulting, and then accommodate strain by accruing displacement. These faults are still-active, but are very mature (i.e., they have been active since the Early Eocene); as a result, they have been able to attain high D/L ratios.
In summary, reactivated faults are, on average, over-displaced (Figures 6, 7), and this should be considered when using D/L scaling laws to estimate faults length or displacement. However, we hypothesise that relatively young reactivated, still-active faults, such as the ones in the Turkana Rift (Vétel et al., 2005), could be under-displaced as they have reached maximum length quickly but are still accruing displacement. When assessing reactivated faults, it is important to consider how long the faults have been active.
Host rock lithology can influence the relationship between fault length and displacement due to the stiffness of different lithologies, often described by host rock shear modulus (Walsh and Watterson, 1988; Walsh and Watterson, 1989; Cowie and Scholz, 1992a; Wibberley et al., 1999). In previous studies an inverse relationship between host rock shear modulus and D/L has been reported; faults in host rocks with a high shear modulus (stiffer rocks, for example, a granite) are under-displaced compared faults with a high shear modulus (softer rocks, for example, a mudstone) (Walsh and Watterson, 1988; Walsh and Watterson, 1989; Cowie and Scholz, 1992a; Wibberley et al., 1999; Gudmundsson, 2004; Childs et al., 2017a).
The stiffness of rocks relates to their elastic properties, also expressed by the Young’s Modulus and the Poisson ratio (Roche et al., 2013). Fault length and displacement have been related to rock stiffness in the following equation from crack models:
Where E is Young’s Modulus, ν is Poisson’s ratio, and Δτ is the shear stress driving the fault (Roche et al., 2014). Poisson ratio can fall between 0.05 and 0.4, although values usually range between 0.3 and 0.4 (Gercek, 2007). There is generally little variation in Poisson’s ratio between different lithologies, compared to Young’s Modulus (Gudmundsson, 2004). Young’s Modulus has a high amount of variation, ranging between 0.05 and 100 GPa (Roche et al., 2013). Fault displacement is inversely proportional to the Young’s modulus of the rock (Wibberly et al., 1999; Wibberly et al., 2000a; Gudmundsson, 2004) which suggests that stiffer rocks, such as igneous and metamorphic rocks, are more likely to be under-displaced than pyroclastic or sedimentary rocks. Factors such as increasing temperature, increasing porosity, and water content can decrease Young’s Modulus. Highly fractured rocks have a low Young’s Modulus; the breccia of a faults core has a low Young’s Modulus, like that of a weak clay or pyroclastic tuff (Gudmundsson, 2004).
The data compilation presented in this paper appears to reveal a relationship between the D/L ratio of normal faults and host rock lithology, with faults with a low Young’s Modulus tending to have a higher D/L ratio (i.e., they are over-displaced) (Figure 12). Evaporite-bearing sedimentary host rocks tend to be over-displaced compared to other lithologies, which could be due to the softness of the rocks making tip propagation difficult. Both evaporites and sedimentary rocks have a relatively low Young’s Modulus, with sedimentary rocks ranging between 0.04 and 67 GPa (24 GPa average; Figure 12) and evaporites ranging between 4 and 64 GPa (23 GPa average; Figure 12). Faults within either fine- and coarse-grained clastic host rocks, are also relatively over-displaced, with Young’s Modulus estimated between 0.04 and 36 GPa (14 GPa average; Figure 12) for fine-grained clastic sedimentary rocks, and 6–67 (25 GPa average) for sandstones and conglomerates (Figure 12). Faults in carbonates and mixed clastic/carbonates tend to lie in the middle of the various D/L trendlines, with carbonates having an estimated Young’s Modulus between 24 and 66 GPa (45 GPa average; Figure 12). Faults within igneous host rocks are significantly under-displaced (Figure 9B), which is possibly in part due to the stiffness of igneous rocks; igneous rocks have the highest estimated Young’s Modulus, between 5 and 99 GPa (49 GPa average; Figure 12).
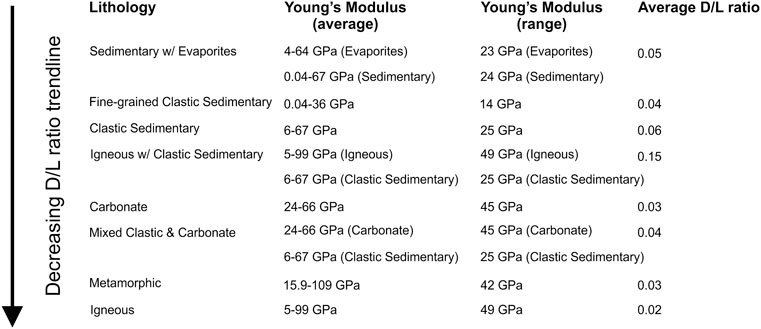
FIGURE 12. Figure showing how the Young’s Modulus of different lithologies relates to D/L. The range of Young’s Modulus, average Young’s modulus, and average D/L for fault with host rocks of each lithology is shown. Generally, as Young’s Modulus increases, D/L decreases. Our Young’s Modulus data and sources can be accessed here: https://figshare.com/articles/dataset/Young_s_Modulus/17087342.
One example of under-displaced faults in host rocks with a high Young’s Modulus are in the East African Rift (Figure 13; Williams et al., 2021). Here, normal faults are forming in a metamorphic host rock. Fault ages are not well constrained, but they are estimated to be roughly Pliocene in age and they are demonstrably still active (Scholz et al., 2020). Faults are 13–130 km long and have displacements ranging from 122 m to 2.5 km. Dmax/L is very low, between 0.003–0.03 (average of 0.01), indicating the faults are relatively under-displaced (Williams et al., 2021). It should be noted that these faults are active, which as discussed in Section 2 could result in them being under-displaced. Additionally, some of the faults in the East African Rift have reacted foliation, making it ambiguous as to whether these faults being under-displaced are related to Young’s Modulus, fault maturity, reactivation, or a combination.
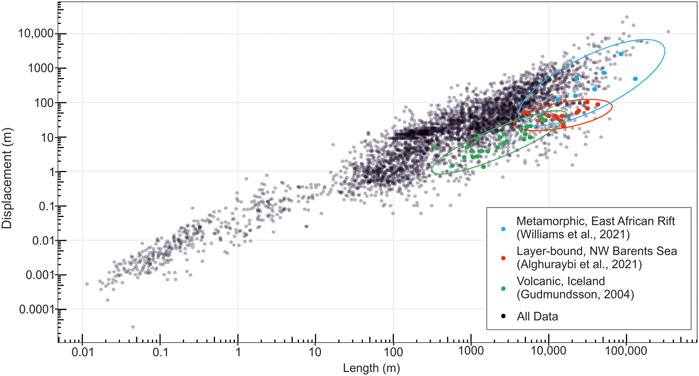
FIGURE 13. Global D/L dataset (black) for normal faults in log-log space with faults from different host rocks highlighted: metamorphic host rocks from the East African Rift (from Williams et al., 2021), layer-bound faults from the NW Barents Sea in red (from Alghuraybi et al., 2021), and igneous host rocks from Iceland (from Gudmundsson, 2004).
Another example of under-displaced normal faults within stiff host rocks come from an active rift zone in Iceland (Figure 13; Gudmundsson, 2004). The faults here are Holocene (<10,000 years old) and cut through basaltic pahoehoe lava flows with an estimated Young’s Modulus of 30–60 GPa, and possibly as high as 100 GPa. Faults range from 345 m to 9 km long and have displacements ranging from 1.3 to 33 m. Dmax/L is between 0.0009–0.01 (average of 0.004), meaning the faults are under-displaced (Gudmundsson, 2004). We expect the stiff host rock lithology has contributed to these faults being under-displaced; however, these are active faults, so according to a constant-length fault growth model, they have possibly reached their maximum length, but not yet their maximum displacement.
Differences in mechanical stratigraphy between lithological units can create vertical barriers that inhibit fault growth, which can cause faults to be under-displaced (Peacock and Sanderson, 1992; Wilkins and Gross, 2002; Welch et al., 2009; Roche et al., 2014). There is a relationship between rock stiffness and fault displacement gradient (i.e., the displacement variation per unit length across a fault), with these gradients tending to be higher in rock units with lower Young’s Modulus (Roche et al., 2014). Mechanical stratigraphy can restrict faults from propagating vertically, causing faults to have a high aspect ratio (fault height/length; height is the fault dimension along dip) (Nicol et al., 1996; Schultz and Fossen, 2002; Soliva et al., 2006; Roche et al., 2013; Alghuraybi et al., 2021). In a numerical modelling analogue study by Roche et al. (2013), aspect ratios for faults in homogeneous rock properties not bounded by mechanical stratigraphy are typically >2, whereas aspect ratios of faults in limestone-clay sequences are, on average, 13, and even as high as 50 (Roche et al., 2013). However, no aspect ratios >20 have been reported in natural studies (Torabi et al., 2019). If faults have a high aspect (height-length) ratio, it stands that they would likely also have a high displacement-length ratio. However, this is likely only applicable to relatively small faults, or possibly large faults cutting through thick layers (e.g., a fault with 1 m of displacement offsetting a 20 cm-thick mudstone package, vs. a 1 km displacement fault offsetting a 100 m-thick mudstone package).
One example of under-displaced faults with high aspect ratios included in our database are layer-bound, thin-skinned normal faults from the NW Barents Sea (Figure 13; Alghuraybi et al., 2021). The faults in this study were only active in the Late Jurassic and they occur in a fine-grained clastic host rock. Faults are 4.7–42.7 km long, have displacements ranging from 21 to 103 m, and their Dmax/L is between 0.001–0.009 (average of 0.003). They have aspect ratios as high as 19, compatible with aspect ratios found in the numerical models of Roche et al. (2013). The faults from the NW Barents Sea are interpreted to have reached their final length quickly (i.e., they grew in accordance with the constant-length model) and were not able to reach their likely maximum displacement, likely due to the mechanical layering.
In summary, host rock lithology influences D/L ratios; softer rocks (such as sedimentary rocks) tend to be over-displaced, and stiffer rocks (such as igneous rocks) tend to be under-displaced, which agrees with the initial hypothesis from previous literature (Wibberly et al., 1999; Wibberly et al., 2000a; Gudmundsson, 2004). Mechanical stratigraphy also causes rocks to be vertically restricted and causes them to be under-displaced.
Our overall scaling relationship between normal fault length and maximum displacement for all data in our revised database is D = 0.03L0.92±0.01. This agrees with previous literature that estimated n = 1 (Cowie and Scholz, 1992a; Dawers et al., 1993; Scholz et al., 1993; Clark and Cox, 1996; Schlische et al., 1996; Kim and Sanderson, 2005; Xu et al., 2006). Our database has thousands of faults that span eight orders of magnitude in terms of fault length, thus we believe that we can confidently say that, overall, n = 1, and that our equation could be used to reliably estimate D or L within 1–2 orders of magnitude in most cases.
There is so much variability in our plots (r2 = 0.85) when all D/L data is considered that it could be questioned whether a single global scaling law should be used at all. Even after conducting a detailed quality check of the data and removing data for which we believe there are errors/inconsistencies, there is still significant variation in the D/L scaling relationship for normal faults. As we discuss above, we suggest that some of these differences may be related to properties such as lithology, fault maturity and reactivation. The scaling relationships for data within each of these categories are different, however in some cases overlap within the confidence intervals. This may be related to the fact that feedbacks between the properties considered in this study likely exist and more analysis is needed to establish which are the key properties which most control D/L. Despite this, we believe that there is value in being able to estimate D from L, and that more specialised scaling relationships like those provided here considering fault size, lithology, tectonic history, and fault maturity are thus warranted. For example, using our global scaling law (Dmax=0.03L0.92), we would estimate that a 3 km long normal fault within a sandstone host rock in a tectonically active area would have a displacement of c. 47 m. In contrast, if we use the “clastic sedimentary” D/L equation (Dmax = 0.11L0.84), we would estimate a displacement of c. 277 m; by using the “inactive” D/L equation (Dmax = 0.05L0.93) we would estimate a displacement of c. 126 m. Both values are likely more accurate than the global estimate, which may have implications for situations which requite estimating fault displacement or length, such as understanding fault sealing, possible CO2 leakage in a potential CCS locality, how large an earthquake might be. For the most accurate estimates, we would suggest either 1) calculating an average of the applicable equations, in this example, an average between the value for a “clastic sedimentary” and “inactive,” or to have an even more accurate estimation, 2) use our database to combine faults with similar factors to make a bespoke equation for that area.
The relationship between fault D and L is also dynamic, changing throughout a fault’s life. Additionally, faults are typically not isolated structures. Some faults in a network become inactive early due to being sub-optimally located (i.e., pinned tips, interacting with an adjacent fault with opposing dips, fault rotation) and strain is partitioned onto larger and longer lasting faults. It is important to practice caution when working with D/L ratios. As shown in Figure 10, the relationship between D and L evolves through time, thus using static data to infer a dynamic relationship can be problematic. Plotting data only in log-log space can hide variability and statistical spread, as shown by Rotevatn et al. (2019). For example, different stages of fault growth will likely be masked in a large log-log plot, as the fault lies within the global scatter at every stage of fault growth. This shows that fault growth cannot be inferred from global D/L plots, and that plotting D and L through time (Figure 10) is important to understanding fault growth.
In contrast to the lower limits of the D/L scaling dataset, which shows significant scatter likely reflecting the process of fault growth, there appears to be an upper limit of maximum displacement (Figure 14). The absolute upper bound is the upper limit of Dmax/L = 0.5 (i.e., at max, faults displacement can be ½ of length), however very few faults have a D/L value that high, i.e., 99.7% of the data falls below D/L = 0.3, and 94% of the data falls below D/L = 0.1. We argue that the D/L upper-limit seen in our global dataset may be related to an overarching rule of fault mechanics in which faults cannot accommodate a certain amount of displacement without additional propagation or linkage with another fault. The wall-rock that borders the fault tips can accommodate a finite amount of shear stress, and beyond that the rock will fail, resulting in additional fault tip propagation (Freeman et al., 2010). Upper D/L limits could also be due to isostatic restoring forces due to the topography generated in the hanging wall and footwall blocks of the fault (Cowie and Scholz, 1992a).
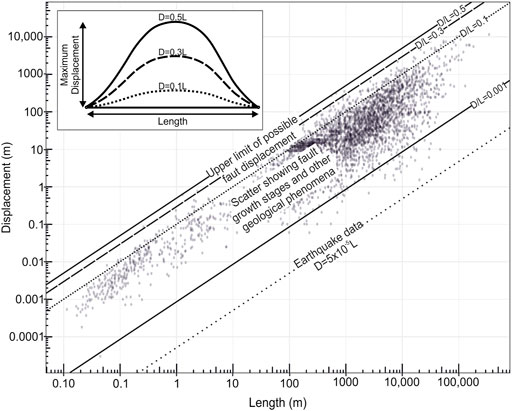
FIGURE 14. Global D/L dataset for normal faults with our suggested upper limit of D/L (D/L=0.1). The average D/L value of a single earthquake is also shown (Wells and Coppersmith, 1994).
We here present a new normal fault database that presents fault length and displacement along with host rock lithology, fault maturity, and tectonic history that will now be available to the public. In our interrogation of the new global normal fault database of 4046 faults, we found that 1) for the complete dataset n = 0.92 in terms of the standard equation Dmax=cLn, but there is a lot of scatter in D/L in the global dataset when faults of all lithologies, maturities, and tectonic histories are grouped together, 2) small faults (>1 m) tend to be over-displaced, 3) stiffer rocks tend to be under-displaced, and softer rocks tend to be over-displaced, 4) active faults tend to be under-displaced compared to inactive faults, and 5) reactivated faults are over-displaced compared to faults in previously undeformed settings, unless the reactivated faults are still active. We also collected normal fault D/L through time data and found that faults grow via a constant length-to-hybrid fault growth model. Since D/L ratios are changing throughout a fault’s life, it is important to express caution when looking at static D/L data.
The datasets presented in this study can be found in online repositories. The names of the repository/repositories and accession number(s) can be found in the article/Supplementary Material.
BL conducted the data collection, data analysis, and wrote the original manuscript. CA-LJ, RB, and AR provided guidance throughout the analysis and writing of the manuscript, as well as edits to the final document.
The authors declare that the research was conducted in the absence of any commercial or financial relationships that could be construed as a potential conflict of interest.
All claims expressed in this article are solely those of the authors and do not necessarily represent those of their affiliated organizations, or those of the publisher, the editors and the reviewers. Any product that may be evaluated in this article, or claim that may be made by its manufacturer, is not guaranteed or endorsed by the publisher.
We thank Imperial College for providing Bailey Lathrop with the President’s Scholarship to fund their PhD research. Whilst compiling this data, we received an outpouring of support from Twitter and the Geotectonics mailing list, and we are grateful to each person that reached out to share data with us. We thank Alex Lipp and Sinead Lyster for their advice during the data analysis portion of this research. We thank Alex Whittaker and Clare Bond for their feedback provided during Bailey Lathrop’s PhD viva. We also thank the Imperial College Basins Research Group (BRG) for their feedback and help throughout this research. We thank GC and GD for their constructive reviews of this manuscript.
The Supplementary Material for this article can be found online at: https://www.frontiersin.org/articles/10.3389/feart.2022.907543/full#supplementary-material
Supplementary Figure S1 | Plots showing active and inactive normal fault D/L data, separated by order of magnitude.
Supplementary Figure S2 | Plots showing normal fault D/L data from reactivated faults and faults with no pre-existing structures, separated by order of magnitude.
Supplementary Figure S3 | Plots showing normal fault D/L data for normal faults with host rocks of different lithologies included in our dataset, including carbonate, clastic, evaporites, fine-grained carbonate, fine-grained clastic, mixed carbonate/clastic, unlithified sediments, igneous, and igneous/clastic, separated by order of magnitude.
Supplementary Table S1 | Table showing previously published global databases with the number of faults used and their sources, along with their values of n and C if given.
Supplementary Table S2 | Table showing all of the sources used in our global database, along with the number of faults from each source, type of data, host rock lithology, if the fault was reactivated or not, the range of fault sizes, and if the fault was active or inactive. Some spaces are left blank because not all information was available for every source.
Ackermann, R. V., Schlische, R. W., and Withjack, M. O. (2001). The Geometric and Statistical Evolution of Normal Fault Systems: An Experimental Study of the Effects of Mechanical Layer Thickness on Scaling Laws. J. Struct. Geol. 23 (11), 1803–1819. doi:10.1016/S0191-8141(01)00028-1
Acocella, V., Gudmundsson, A., and Funiciello, R. (2000). Interaction and Linkage of Extension Fractures and Normal Faults: Examples from the Rift Zone of Iceland. J. Struct. Geol. 22, 1–14. doi:10.1016/S0191-8141(00)00031-6
Aitkenhead, N. (1985). Geology of the Country Around Buxton, Leek and Bakewell. Mere. Geol. Surv. Gt. Br. 111, 168.
Alghuraybi, A., Bell, R. E., and Jackson, C. A. L. (2021). The Geometric and Temporal Evolution of Fault-Related Folds Constrain Normal Fault Growth Patterns, Barents Sea, Offshore Norway. Basin Res. 34, 618–639. doi:10.1111/bre.12633
Alnuaim, A., Hamid, W., and Alshenawy, A. (2019). Unconfined Compressive Strength and Young’s Modulus of Riyadh Limestone. Electron. J. Geotechnical Eng. 24 (3), 707–717.
Babenroth, D. L., and Strahler, A. N. (1945). Geomorphology and Structure of the East Kaibab Monocline, Arizona and Utah. Geol. Soc. Am. Bull. 56, 107–150. doi:10.1130/0016-7606(1945)56[107:gasote]2.0.co;2
Bailey, W. R., Walsh, J. J., and Manzocchi, T. (2005). Fault Populations, Strain Distribution and Basement Fault Reactivation in the East Pennines Coalfield, UK. J. Struct. Geol. 27 (5), 913–928. doi:10.1016/j.jsg.2004.10.014
Balsamo, F., Clemenzi, L., Storti, F., Mozafari, M., Solum, J., Swennen, R., et al. (2016). Anatomy and Paleofluid Evolution of Laterally Restricted Extensional Fault Zones in the Jabal Qusaybah Anticline, Salakh Arch, Oman. Geol. Soc. Am. Bull. 128 (5–6), 957–972. doi:10.1130/B31317.1
Baudon, C., and Cartwright, J. (2008). The Kinematics of Reactivation of Normal Faults Using High Resolution Throw Mapping. J. Struct. Geol. 30 (8), 1072–1084. doi:10.1016/j.jsg.2008.04.008
B. D. M. Gauthier , S. D. Lake (, B. D. M., and Lake, S. D. (1993). Probabilistic Modeling of Faults Below the Limit of Seismic Resolution in Pelican Field, North Sea, Offshore United Kingdom. Bulletin 77, 761–777. doi:10.1306/bdff8d4e-1718-11d7-8645000102c1865d
Beck, E. (1929). “Salt Creek Oil Field, Natrona County, Wyoming,” in Structure of Typical American Oilfields II (Tulas, U S: The American Association of Petroleum Geologists), 589–603.
Bond, D. C., Atherton, E., Bristol, H. M., Buschbach, T. C., Stevenson, D. L., Becker, L. E., Dawson, T. A., Fernalld, E. C., Schwalb, H., Wilson, E. N., Statler, A. T., Stearns, R. G., and Buehner, J. H. (1971). “Possible Future Petroleum Potential of Region 9--Illinois Basin, Cincinnati Arch, and Northern Mississippi Embayment,” in Future Petroleum Provinces of the United States-- Their Geology and Potential. Editor Cram, I. H. (Memoir: Am. Ass. Petrol. Geol), 15, 1165–1218.
Bramham, E. K., Wright, T. J., Paton, D. A., and Hodgson, D. M. (2021). A New Model for the Growth of Normal Faults Developed Above Pre-Existing Structures. Geology 49 (5), 587–591. doi:10.1130/G48290.1
Brunstrom, R. G. W. (1963). Recently Discovered Oilfields in Britain, 1963. 6th World Petroleum Congress, 11–20.
Cartwright, J. A., Mansfield, C., and Trudgill, B. (1996). “The Growth of Normal Faults by Segment Linkage. Editors P. G. Buchanan, and P. G. Nieuwland (London, UK: Geological Society of London), 99, 163–177. doi:10.1144/gsl.sp.1996.099.01.13
Cartwright, J. A., Trudgill, B. D., and Mansfield, C. S. (1995). Fault Growth by Segment Linkage: An Explanation for Scatter in Maximum Displacement and Trace Length Data from the Canyonlands Grabens of SE Utah. J. Struct. Geol. 17 (9), 1319–1326. doi:10.1016/0191-8141(95)00033-A
Childs, C., Holdsworth, R. E., Jackson, C. A.-L., Manzocchi, T., Walsh, J. J., and Yielding, G. (2017b). Introduction to the Geometry and Growth of Normal Faults. Geol. Soc. Lond. Spec. Publ. 439 (1), 1–9. doi:10.1144/SP439.24
Childs, C., Manzocchi, T., Nicol, A., Walsh, J. J., Soden, A. M., Conneally, J. C., et al. (2017a). The Relationship Between Normal Drag, Relay Ramp Aspect Ratio and Fault Zone Structure. Geol. Soc. Lond. Spec. Publ. 439, 355–372. doi:10.1144/SP439.16
Clark, R. M., and Cox, S. J. D. (1996). A Modern Regression Approach to Determining Fault Displacement-Length Scaling Relationships. J. Struct. Geol. 18 (2–3), 147–152. doi:10.1016/S0191-8141(96)80040-X
Collettini, C. (2011). The Mechanical Paradox of Low-Angle Normal Faults: Current Understanding and Open Questions. Tectonophysics 510 (3–4), 253–268. doi:10.1016/j.tecto.2011.07.015
Cowie, P. A., and Scholz, C. H. (1992a). Displacement-Length Scaling Relationship for Faults: Data Synthesis and Discussion. J. Struct. Geol. 14 (10), 1149–1156. doi:10.1016/0191-8141(92)90066-6
Cowie, P. A., and Scholz, C. H. (1992b). Physical Explanation for the Displacement-Length Relationship of Faults Using a Post-Yield Fracture Mechanics Model. J. Struct. Geol. 14 (10), 1133–1148. doi:10.1016/0191-8141(92)90065-5
Crider, J. G., and Pollard, D. D. (1998). Fault Linkage: Three-Dimensional Mechanical Interaction Between Echelon Normal Faults. J. Geophys. Res. 103 (10), 24373–24391. doi:10.1029/98jb01353
Davarpanah, S. M., Vasarhelyi, B., and Török, Á. (2020). Technical Note: Determination of Young’s Modulus and Poisson’s Ratio for Intact Stratified Rocks and Their Relationship with Uniaxial Compressive Strength. Aust. Geomechanics J. 55 (4), 101–118.
Davis, K., Burbank, D. W., Fisher, D., Wallace, S., and Nobes, D. (2005). Thrust-Fault Growth and Segment Linkage in the Active Ostler Fault Zone, New Zealand. J. Struct. Geol. 27, 1528–1546. doi:10.1016/j.jsg.2005.04.011
Davison, I., (1994). Linked Fault Systems; Extensional, Strike-Slip and Contractional. In Continental Deformation. Editor P. L. Hancock Oxford, UK: Pergamon Press, pp. 121–142.
Dawers, N. H., and Anders, M. H. (1995). Displacement-Length Scaling and Fault Linkage. J. Struct. Geol. 17 (5), 607–614. doi:10.1016/0191-8141(94)00091-d
Dawers, N. H., Anders, M. H., and Scholz, C. H. (1993). Growth of Normal Faults: Displacement-Length Scaling. Geol. 21 (12), 1107–1110. doi:10.1130/0091-7613(1993)021<1107:gonfdl>2.3.co;2
Delogkos, E., Manzocchi, T., Childs, C., Sachanidis, C., Barbas, T., Schöpfer, M. P. J., et al. (2017). Throw Partitioning Across Normal Fault Zones in the Ptolemais Basin, Greece. Geol. Soc. Lond. Spec. Publ. 439 (1), 333–353. doi:10.1144/SP439.19
Delogkos, E., Saqab, M. M., Walsh, J. J. J., Roche, V., and Childs, C. (2020). Throw Variations and Strain Partitioning Associated with Fault-Bend Folding Along Normal Faults. Solid earth. 11 (3), 935–945. doi:10.5194/se-11-935-2020
Densmore, A. L. (2004). Footwall Topographic Development During Continental Extension. J. Geophys. Res. 109 (F3), 1–16. doi:10.1029/2003jf000115
Dobson, P., and Houseworth, J. (2013). Inventory of Shale Hydrological, and Including Geologic. Berkeley, CA, USA: Formations in the US Mechanical Characteristics.
Drozdzewski, V. G. (1980). “Tiefenteknik der Emscher- und Essener-Hauptmulde im mittleren Ruhrgebiet,” in Beitrage zur Tieftektonikdes Ruhrkarbons (Krefeld: Geologisches Laudesaint Nordrein-Westfalen), 45–83.
Duffy, O. B., Nixon, C. W., Bell, R. E., Jackson, C. A.-L., Gawthorpe, R. L., Sanderson, D. J., et al. (2017). The Topology of Evolving Rift Fault Networks: Single-Phase vs Multi-Phase Rifts. J. Struct. Geol. 96, 192–202. doi:10.1016/j.jsg.2017.02.001
Elliott, D. (1976). The Energy Balance and Deformation Mechanisms of Thrust Sheets. Philosophical Trans. R. Soc. A Math. Phys. Eng. Sci. 283 (1312), 289–312.
Ellis, M. A., and Barnes, J. B. (2015). A Global Perspective on the Topographic Response to Fault Growth. Geosphere 11 (4), 1008–1023. doi:10.1130/GES01156.1
Faure Walker, J. P., Roberts, G. P., Cowie, P. A., Papanikolaou, I. D., Sammonds, P. R., Michetti, A. M., et al. (2009). Horizontal Strain-Rates and Throw-Rates across Breached Relay Zones, Central Italy: Implications for the Preservation of Throw Deficits at Points of Normal Fault Linkage. J. Struct. Geol. 31 (10), 1145–1160. doi:10.1016/j.jsg.2009.06.011
Finch, E., and Gawthorpe, R. (2017). Growth and Interaction of Normal Faults and Fault Network Evolution in Rifts: Insights from Three-Dimensional Discrete Element Modelling. Geol. Soc. Lond. Spec. Publ. 439 (1), 219–248. doi:10.1144/SP439.23
Fintland, T. W. (2011). Measurements of Young’s Modulus on Rock Samples at Small Amplitude and Low Frequency.
Fossen, H., and Hesthammer, J. (1998). Deformation Bands and Their Significance in Porous Sandstone Reservoirs. First Break 16, 21–25. doi:10.1046/j.1365-2397.1998.00683.x
Fossen, H., and Rotevatn, A. (2012). Characterization of Deformation Bands Associated with Normal and Reverse Stress States in the Navajo Sandstone, Utah: Discussion. Bulletin 96 (5), 869–876. doi:10.1306/09221110173
Fossen, H., and Rotevatn, A. (2016). Fault Linkage and Relay Structures in Extensional Settings-A Review. Earth-Science Rev. 154, 14–28. doi:10.1016/j.earscirev.2015.11.014
Fox, F. G. (1959). Structure and Accumulation of Hydrocarbon in Southern Foothills, Alberta, Canada. Bull. Am. Assoc. Petroleum Geol. 43, 992–1025. doi:10.1306/0bda5d05-16bd-11d7-8645000102c1865d
Freeman, B., Boult, P. J., Yielding, G., and Menpes, S. (2010). Using Empirical Geological Rules to Reduce Structural Uncertainty in Seismic Interpretation of Faults. J. Struct. Geol. 32 (11), 1668–1676. doi:10.1016/j.jsg.2009.11.001
Freund, R. (1970). Rotation of Strike Slip Faults in Sistan, Southeast Iran. J. Geol. 78, 188–200. doi:10.1086/627500
Frost, D. V., and Halliday, D. W. (1980). Geology of the Country Around Bellingham. Mem. Geol. Surv. Gt. Br., 13.
Frost, D. V., and Smart, J. G. O. (1979). Geology of the Country North of Derby. Mere. Geol. Surv. Gt. Br., 125.
Gercek, H. (2007). Poisson's Ratio Values for Rocks. Int. J. Rock Mech. Min. Sci. 44 (1), 1–13. doi:10.1016/j.ijrmms.2006.04.011
Ghalayini, R., Homberg, C., Daniel, J. M., and Nader, F. H. (2017). Growth of Layer-Bound Normal Faults Under a Regional Anisotropic Stress Field. Geol. Soc. Lond. Spec. Publ. 439 (1), 57–78. doi:10.1144/SP439.13
Giba, M., Walsh, J. J., and Nicol, A. (2012). Segmentation and Growth of an Obliquely Reactivated Normal Fault. J. Struct. Geol. 39, 253–267. doi:10.1016/j.jsg.2012.01.004
Gillespie, P. A., Howard, C. B., Walsh, J. J., and Watterson, J. (1993). Measurement and Characterisation of Spatial Distributions of Fractures. Tectonophysics 226, 113–141. doi:10.1021/jo00120a01410.1016/0040-1951(93)90114-y
Gillespie, P. A. (1991). Structural Analysis of Faults and Folds with Examples from the South Wales Coalfield and Ruhr Coalfield. Unpublished PhD thesis. Cardiff: University of Wales.
Gillespie, P. A., Walsh, J. J., and Watterson, J. (1992). Limitations of Dimension and Displacement Data from Single Faults and the Consequences for Data Analysis and Interpretation. J. Struct. Geol. 14 (10), 1157–1172. doi:10.1016/0191-8141(92)90067-7
Pickering, G., Peacock, D. C. P., Sanderson, D. J., and Bull, J. M. (1997). Modeling Tip Zones to Predict the Throw and Length Characteristics of Faults. Bulletin 81 (1), 82–99. doi:10.1306/522b4299-1727-11d7-8645000102c1865d
Gross, M. R., Gutie´rrez-Alonso, G., Bai, T., Wacker, M. A., Collinsworth, K. B., and Behl, R. J. (1997). Influence of Mechanical Stratigraphy and Kinematics on Fault Scaling Relations. J. Struct. Geol. 19 (2), 171–183. doi:10.1016/S0191-8141(96)00085-5
Gudmundsson, A. (2004). Effects of Young's Modulus on Fault Displacement. Comptes Rendus Geosci. 336 (1), 85–92. doi:10.1016/j.crte.2003.09.018
Hedtmann, N., and Alber, M. (2017). Investigation of Water-Permeability and Ultrasonic Wave Velocities of German Malm Aquifer Rocks for Hydro-Geothermal Energy. Procedia Eng. 191, 127–133. doi:10.1016/j.proeng.2017.05.163
Hemelsdaël, R., and Ford, M. (2016). Relay Zone Evolution: A History of Repeated Fault Propagation and Linkage, Central Corinth Rift, Greece. Basin Res. 28 (1), 34–56. doi:10.1111/bre.12101
Henstra, G. A., Rotevatn, A., Gawthorpe, R. L., and Ravnås, R. (2015). Evolution of a Major Segmented Normal Fault During Multiphase Rifting: The Origin of Plan-View Zigzag Geometry. J. Struct. Geol. 74, 45–63. doi:10.1016/j.jsg.2015.02.005
Hollinsworth, A. D., Koehn, D., Dempster, T. J., and Aanyu, K. (2019). Structural Controls on the Interaction Between Basin Fluids and a Rift Flank Fault: Constraints from the Bwamba Fault, East African Rift. J. Struct. Geol. 118, 236–249. doi:10.1016/j.jsg.2018.10.012
Iezzi, F., Mildon, Z., Walker, J. F., Roberts, G., Goodall, H., Wilkinson, M., et al. (2018). Coseismic Throw Variation Across Along-Strike Bends on Active Normal Faults: Implications for Displacement Versus Length Scaling of Earthquake Ruptures. J. Geophys. Res. Solid Earth 123 (11), 9817–9841. doi:10.1029/2018JB016732
Jackson, C. A.-L., Bell, R. E., Rotevatn, A., and Tvedt, A. B. M. (2017). Techniques to Determine the Kinematics of Synsedimentary Normal Faults and Implications for Fault Growth Models. Geol. Soc. Lond. Spec. Publ. 439 (1), 187–217. doi:10.1144/SP439.22
Jackson, C. A.-L., and Rotevatn, A. (2013). 3D Seismic Analysis of the Structure and Evolution of a Salt-Influenced Normal Fault Zone: A Test of Competing Fault Growth Models. J. Struct. Geol. 54, 215–234. doi:10.1016/j.jsg.2013.06.012
Jackson, J., Norris, R., and Youngson, J. (1996). The Structural Evolution of Active Fault and Fold Systems in Central Otago, New Zealand: Evidence Revealed by Drainage Patterns. J. Struct. Geol. 18 (2–3), 217–234. doi:10.1016/S0191-8141(96)80046-0
Janoschek, R. H., and Gotzinger, K. G. H. (1969). “Exploration for Oil Andgas in Austria,” in The Exploration for Petroleum in Europe and North Africa. Editor P. Hepple (Amsterdam: Elsevier), 161–180.
Karp, T., Scholz, C. A., and McGlue, M. M. (2012). Structure and Stratigraphy of the Lake Albert Rift, East Africa Observations from Seismic Reflection and Gravity Data. AAPG Mem. 95, 299–318. doi:10.1306/13291394M952903
Khalil, S. M., and Mcclay, K. R. (2017). 3D Geometry and Kinematic Evolution of Extensional Fault-Related Folds, NW Red Sea, Egypt. Geol. Soc. Lond. Spec. Publ. 439 (1), 109–130. doi:10.1144/SP439.11
Kicono, L. (2005). The Semliki Basin, Uganda: Its Sedimentation History and Stratigraphy in Relation to Petroleum Accumulation. Town: University of Cape.
Kim, Y.-S., Andrews, J. R., and Sanderson, D. J. (2000). Damage Zones Around Strike-Slip Fault Systems and Strike-Slip Fault Evolution, Crackington Haven, Southwest England. Geosci. J. 4 (2), 53–72. doi:10.1007/BF02910127
Kim, Y.-S., and Sanderson, D. J. (2005). The Relationship between Displacement and Length of Faults: A Review. Earth-Science Rev. 68 (3–4), 317–334. doi:10.1016/j.earscirev.2004.06.003
Kolyukhin, D., and Torabi, A. (2012). Statistical Analysis of the Relationships between Faults Attributes. J. Geophys. Res. 117 (5). doi:10.1029/2011JB008880
Krantz, R. W. (1988). Multiple Fault Sets and Three-Dimensional Strain: Theory and Application. J. Struct. Geol. 10 (3), 225–237. doi:10.1016/0191-8141(88)90056-9
Lamarche, G., Proust, J.-N., and Nodder, S. D. (2005). Long-Term Slip Rates and Fault Interactions under Low Contractional Strain, Wanganui Basin, New Zealand. Tectonics 24 (4). doi:10.1029/2004TC001699
Lathrop, B. A., Jackson, C. A. L., Bell, R. E., and Rotevatn, A. (2021). Normal Fault Kinematics and the Role of Lateral Tip Retreat: An Example from Offshore NW Australia. Tectonics 40 (5). doi:10.1029/2020TC006631
Liang, W., Yang, C., Zhao, Y., Dusseault, M. B., and Liu, J. (2007). Experimental Investigation of Mechanical Properties of Bedded Salt Rock. Int. J. Rock Mech. Min. Sci. 44 (3), 400–411. doi:10.1016/j.ijrmms.2006.09.007
MacMillan, R. A. (1975). The Orientation and Sense of Displacement of Strike-Slip Faults in Continental Crust, BS Thesis. Ottawa, Ont: Carleton Univ. Canada.
Madarieta-Txurruka, A., Galindo-Zaldívar, J., González-Castillo, L., Peláez, J. A., Ruiz-Armenteros, A. M., Henares, J., et al. (2021). High- and Low-Angle Normal Fault Activity in a Collisional Orogen: The Northeastern Granada Basin (Betic Cordillera). Tectonics 40 (7), 1–25. doi:10.1029/2021TC006715
Małkowski, P., Ostrowski, Ł., and Brodny, J. (2018). Analysis of Young's Modulus for Carboniferous Sedimentary Rocks and its Relationship with Uniaxial Compressive Strength Using Different Methods of Modulus Determination. J. Sustain. Min. 17 (3), 145–157. doi:10.1016/j.jsm.2018.07.002
Manighetti, I., King, G. C. P., Gaudemer, Y., Scholz, C., and Doubre, C. (2001). Slip Accumulation and Lateral Propagation of Active Faults in Afar. J. Geophys. Res. 106 (13), 667–696. doi:10.1029/2000jb900471
Marrett, R., and Allmendinger, R. W. (1991). Estimates of Strain Due to Brittle Faulting: Sampling of Fault Populations. J. Struct. Geol. 13 (6), 735–738. doi:10.1016/0191-8141(91)90034-G
Mayuga, M. (1970). Geology and Development of California’s Giant--Wilmington Oil Field, 14. Memoir: American Association of Petroleum Geologists, 158–184. http://archives.datapages.com/data/specpubs/fieldst2/data/a009/a009/0001/0150/0158.htm.
McClymont, A. F., Villamor, P., and Green, A. G. (2009). Fault Displacement Accumulation and Slip Rate Variability within the Taupo Rift (New Zealand) Based on Trench and 3-D Ground-Penetrating Radar Data. Tectonics 28 (4), a–n. doi:10.1029/2008TC002334
McGlue, M. M., Scholz, C. A., Karp, T., Ongodia, B., and Lezzar, K. E. (2006). Facies Architecture of Flexural Margin Lowstand Delta Deposits in Lake Edward, East African Rift: Constraints from Seismic Reflection Imaging. J. Sediment. Res. 76 (6), 942–958. doi:10.2110/jsr.2006.068
McGrath, A. (1992). Fault Propagation and Growth; a Study of the Triassic and Jurassic from Watchet and Kilve, North Somerset [Master’s Thesis]. London: Royal Holloway, University of London, 165.
McLeod, A. E., Dawers, N. H., and Underhill, J. R. (2000). The Propagation and Linkage of Normal Faults: Insights from the Strathspey-Brent-Statfjord Fault Array, Northern North Sea. Basin Res. 12 (3–4), 263–284. doi:10.1111/j.1365-2117.2000.00124.x
Meyer, V., Nicol, A., Childs, C., Walsh, J. J., and Watterson, J. (2002). Progressive Localisation of Strain during the Evolution of a Normal Fault Population. J. Struct. Geol. 24 (8), 1215–1231. doi:10.1016/S0191-8141(01)00104-3
MFRG (1973). A Minor Fault System Around the Otaki Area, Boso Peninsula, Japan. Earth Sci. (Chikyu Kagaku) 27, 180–187.
Morley, C. K. (2002). Evolution of Large Normal Faults: Evidence from Seismic Reflection Data. AAPG Bull. 86 (6), 961–978. doi:10.1002/2016GC006582.Subsea10.1306/61eedbfc-173e-11d7-8645000102c1865d
Morley, C. K., Gabdi, S., and Seusutthiya, K. (2007). Fault Superimposition and Linkage Resulting from Stress Changes during Rifting: Examples from 3D Seismic Data, Phitsanulok Basin, Thailand. J. Struct. Geol. 29 (4), 646–663. doi:10.1016/j.jsg.2006.11.005
Morley, C. K. (2009). Geometry and Evolution of Low-Angle Normal Faults (LANF) within a Cenozoic High-Angle Rift System, Thailand: Implications for Sedimentology and the Mechanisms of LANF Development. Tectonics 28, a–n. doi:10.1029/2007TC002202
Morley, C. K., Nelson, R. A., Patton, T. L., and Munn, S. G. (1990). Transfer Zones in the East African Rift System and Their Relevance to Hydrocarbon Exploration in Rifts (1). Bulletin 74 (8), 1234–1253. doi:10.1306/0c9b2475-1710-11d7-8645000102c1865d
Morley, C. K. (2017). The Impact of Multiple Extension Events, Stress Rotation and Inherited Fabrics on Normal Fault Geometries and Evolution in the Cenozoic Rift Basins of Thailand. Geol. Soc. Lond. Spec. Publ. 439 (1), 413–445. doi:10.1144/SP439.3
Mouslopoulou, V., Walsh, J. J., and Nicol, A. (2009). Fault Displacement Rates on a Range of Timescales. Earth Planet. Sci. Lett. 278 (3–4), 186–197. doi:10.1016/j.epsl.2008.11.031
Muraoka, H., and Kamata, H. (1983). Displacement Distribution along Minor Fault Traces. J. Struct. Geol. 5 (5), 483–495. doi:10.1016/0191-8141(83)90054-8
Nelson, P. H. H. (1980). “Role of Reflection Seismic in Development of Nembe Creek Field, Nigeria,” in Giant Oil and Gas Fields of the Decade: 1968-1978. Editor M. T. Halbouty (Memoir: Am. Ass. Petrol. Geol), 30, 565–576.
Nicol, A., Childs, C., Walsh, J. J., Manzocchi, T., and Schöpfer, M. P. J. (2017). Interactions and Growth of Faults in an Outcrop-Scale System. Geol. Soc. Lond. Spec. Publ. 439, 23–39. doi:10.1144/SP439.9
Nicol, A., Walsh, J., Berryman, K., and Nodder, S. (2005). Growth of a Normal Fault by the Accumulation of Slip over Millions of Years. J. Struct. Geol. 27 (2), 327–342. doi:10.1016/j.jsg.2004.09.002
Nicol, A., Walsh, J., Childs, C., and Manzocchi, T. (2020). “The Growth of Faults,” in Understanding Faults: Detecting, Dating, and Modeling (Amsterdam, Netheerlands: Elsevier), 221–255. doi:10.1016/B978-0-12-815985-9.00006-0
Nicol, A., Walsh, J. J., Villamor, P., Seebeck, H., and Berryman, K. R. (2010). Normal Fault Interactions, Paleoearthquakes and Growth in an Active Rift. J. Struct. Geol. 32 (8), 1101–1113. doi:10.1016/j.jsg.2010.06.018
Nicol, A., Watterson, J., Walsh, J. J., and Childs, C. (1996). The Shapes, Major axis Orientations and Displacement Patterns of Fault Surfaces. J. Struct. Geol. 18 (2–3), 235–248. doi:10.1016/S0191-8141(96)80047-2
Norcliffe, J., Magee, C., Jackson, C., Kopping, J., and Lathrop, B. (2021). Fault Inversion Contributes to Ground Deformation above Inflating Igneous Sills. Volcanica 4 (1), 1–21. doi:10.30909/VOL.04.01.0121
Opheim, J. A., and Gudmundsson, A. (1989). Formation and Geometry of Fractures, and Related Volcanism, of the Krafla Fissure Swarm, Northeast Iceland. Geol. Soc. Am. Bull. 101 (12), 1608–1622. doi:10.1130/0016-7606(1989)101<1608:fagofa>2.3.co;2
Pan, S., Bell, R. E., Jackson, C. A. L., and Naliboff, J. (2021). Evolution of Normal Fault Displacement and Length as Continental Lithosphere Stretches. Basin Res. 34, 121–140. doi:10.1111/bre.12613
Peacock, D. C. P. (1991). Displacements and Segment Linkage in Strike-Slip Fault Zones. J. Struct. Geol. 13, 1025–1035. doi:10.1016/0191-8141(91)90054-M
Peacock, D. C. P., and Sanderson, D. J. (1991). Displacements, Segment Linkage and Relay Ramps in Normal Fault Zones. J. Struct. Geol. 13 (6), 721–733. doi:10.1016/0191-8141(91)90033-F
Peacock, D. C. P., and Sanderson, D. J. (1992). Effects of Layering and Anisotropy on Fault Geometry. J. Geol. Soc. 149 (5), 793–802. doi:10.1144/gsjgs.149.5.0793
Perrin, C., Manighetti, I., Ampuero, J.-P., Cappa, F., and Gaudemer, Y. (2016). Location of Largest Earthquake Slip and Fast Rupture Controlled by Along-Strike Change in Fault Structural Maturity Due to Fault Growth. J. Geophys. Res. Solid Earth 121, 3666–3685. doi:10.1002/2015JB012671
Poulimenos, G. (2000). Scaling Properties of Normal Fault Populations in the Western Corinth Graben, Greece: Implications for Fault Growth in Large Strain Settings. J. Struct. Geol. 22 (3), 307–322. doi:10.1016/S0191-8141(99)00152-2
Reeve, M. T., Bell, R. E., Duffy, O. B., Jackson, C. A.-L., and Sansom, E. (2015). The Growth of Non-Colinear Normal Fault Systems; What Can We Learn from 3D Seismic Reflection Data? J. Struct. Geol. 70, 141–155. doi:10.1016/j.jsg.2014.11.007
Reeves, J. R. (1929). El Dorado Oil Field, Butler County, Kansas. Structure of Typical American Oilfields. Am. Ass. Petrol. Geol. 2, 160–167.
Reilly, C., Nicol, A., and Walsh, J. (2017). Importance of Pre-existing Fault Size for the Evolution of an Inverted Fault System. Geol. Soc. Lond. Spec. Publ. 439 (1), 447–463. doi:10.1144/SP439.2
Rioseco, E. M., Löhken, J., Schellschmidt, R., and Tischner, T. (2013). “3-D Geomechanical Modeling of the Stress Field in the North German Basin: Case Study Genesys-Borehole Gt1 in Hanover Groß-Buchholz,” in Proceedings of the Thirty-Eighth Workshop on Geothermal Reservoir Engineering, Stanford University Stanford California, February 11-13, 2013.
Rippon, J. H. (1984). Contoured Patterns of the Throw and Hade of Normal Faults in the Coal Measures (Westphalian) of North-East Derbyshire. Proc. Yorks. Geol. Soc. 45 (3), 147–161. doi:10.1144/pygs.45.3.147
Roberts, G. P., and Michetti, A. M. (2004). Spatial and Temporal Variations in Growth Rates along Active Normal Fault Systems: An Example from the Lazio-Abruzzo Apennines, Central Italy. J. Struct. Geol. 26 (2), 339–376. doi:10.1016/S0191-8141(03)00103-2
Roche, V., Homberg, C., David, C., and Rocher, M. (2014). Normal Faults, Layering and Elastic Properties of Rocks. Tectonophysics 622, 96–109. doi:10.1016/j.tecto.2014.03.006
Roche, V., Homberg, C., and Rocher, M. (2013). Fault Nucleation, Restriction, and Aspect Ratio in Layered Sections: Quantification of the Strength and Stiffness Roles Using Numerical Modeling. J. Geophys. Res. Solid Earth 118 (8), 4446–4460. doi:10.1002/jgrb.50279
Roche, V., Homberg, C., Van Der Baan, M., and Rocher, M. (2017). Widening of Normal Fault Zones Due to the Inhibition of Vertical Propagation. Geol. Soc. Lond. Spec. Publ. 439 (1), 271–288. doi:10.1144/SP439.5
Rotevatn, A., and Fossen, H. (2011). Simulating the Effect of Subseismic Fault Tails and Process Zones in a Siliciclastic Reservoir Analogue: Implications for Aquifer Support and Trap Definition. Mar. Petroleum Geol. 28 (9), 1648–1662. doi:10.1016/j.marpetgeo.2011.07.005
Rotevatn, A., Jackson, C. A.-L., Tvedt, A. B. M., Bell, R. E., and Blækkan, I. (2019). How Do Normal Faults Grow? J. Struct. Geol. 125, 174–184. doi:10.1016/j.jsg.2018.08.005
Rowan, M. G. (1997). Three-Dimensional Geometry and Evolution of a Segmented Detachment Fold, Mississippi Fan Foldbelt, Gulf of Mexico. J. Struct. Geol. 19 (3-4), 463–480. doi:10.1016/s0191-8141(96)00098-3
Ruzhich, V. V. (1977). “Relations between Fault Parameters and Practical Application of Them,” in Mekhanizmy Structur Vostochronochnoisibiri Novisbirsk. (in Russian).
Santi, P. M., Holschen, J. E., and Stephenson, R. W. (2000). Improving Elastic Modulus Measurements for Rock Based on Geology. Environ. Eng. Geoscience 6 (4), 333–346. doi:10.2113/gseegeosci.6.4.333
Schlagenhauf, A., Manighetti, I., Malavieille, J., and Dominguez, S. (2008). Incremental Growth of Normal Faults: Insights from a Laser-Equipped Analog Experiment. Earth Planet. Sci. Lett. 273 (3–4), 299–311. doi:10.1016/j.epsl.2008.06.042
Schlische, R. W., Young, S. S., Ackermann, R. V., and Gupta, A. (1996). Geometry and Scaling Relations of a Population of Very Small Rift-Related Normal Faults. Geol 24 (8), 683–686. doi:10.1130/0091-7613(1996)024<0683:gasroa>2.3.co;2
Scholz, C. A., Shillington, D. J., Wright, L. J. M., Accardo, N., Gaherty, J. B., and Chindandali, P. (2020). Intrarift Fault Fabric, Segmentation, and Basin Evolution of the Lake Malawi (Nyasa) Rift, East Africa. Geosphere 16 (5), 1293–1311. doi:10.1130/GES02228.1
Scholz, C. H., Dawers, N. H., Yu, J.-Z., Anders, M. H., and Cowie, P. A. (1993). Fault Growth and Fault Scaling Laws: Preliminary Results. J. Geophys. Res. 98 (B12), 21951–21961. doi:10.1029/93jb01008
Schultz, R. A., and Fossen, H. (2002). Displacement-length Scaling in Three Dimensions: The Importance of Aspect Ratio and Application to Deformation Bands. J. Struct. Geol. 24 (9), 1389–1411. doi:10.1016/S0191-8141(01)00146-8
Schultz, R. A., Soliva, R., Fossen, H., Okubo, C. H., and Reeves, D. M. (2008). Dependence of Displacement-Length Scaling Relations for Fractures and Deformation Bands on the Volumetric Changes across Them. J. Struct. Geol. 30 (11), 1405–1411. doi:10.1016/j.jsg.2008.08.001
Shepherd, J., and Burns, K. L. (1978). Fault Swarms in the Greta Coal Seam, New South Wales. Proc. Australas. Inst. Min. Metall. 267, 27–36.
Shoemaker, E. M., Squires, R. L., and Abrams, M. J. (1978). “15: Bright Angel and Mesa Butte Fault Systems of Northern Arizona,” in Cenozoic Tectonics and Regional Geophysics of the Western Cordillera. Editors R. B. Smith, and G. P. Eaton (Boulder, CO, USA: Geol. Soc. Am. Memoir), 152, 341–367. doi:10.1130/mem152-p341
Shunshan, X., Nieto-Samaniego, A. F., Velasquillo-Martínez, L. G., Grajales-Nishimura, J. M., Murillo-Muñetón, G., and García-Hernández, J. (2011). Factors Influencing the Fault Displacement-Length Relationship: An Example from the Cantarell Oilfield, Gulf of Mexico. GeofInt 50 (3), 279–293. doi:10.22201/igeof.00167169p.2011.50.3.227
Siegburg, M., Bull, J. M., Nixon, C. W., Keir, D., Gernon, T. M., Corti, G., et al. (2020). Quantitative Constraints on Faulting and Fault Slip Rates in the Northern Main Ethiopian Rift. Tectonics 39 (8), e2019TC006046. doi:10.1029/2019TC006046
Soliva, R., and Benedicto, A. (2004). A Linkage Criterion for Segmented Normal Faults. J. Struct. Geol. 26 (12), 2251–2267. doi:10.1016/j.jsg.2004.06.008
Soliva, R., Benedicto, A., and Maerten, L. (2006). Spacing and Linkage of Confined Normal Faults: Importance of Mechanical Thickness. J. Geophys. Res. 111 (1), 1–17. doi:10.1029/2004JB003507
Soliva, R., and Schultz, R. A. (2008). Distributed and Localized Faulting in Extensional Settings: Insight from the North Ethiopian Rift-Afar Transition Area. Tectonics 27 (2), 1288–1299. doi:10.1029/2007TC002148
Taylor, S. K., Nicol, A., and Walsh, J. J. (2008). Displacement Loss on Growth Faults Due to Sediment Compaction. J. Struct. Geol. 30 (3), 394–405. doi:10.1016/j.jsg.2007.11.006
Teas, L. P. (1929). “Bellevue Oil Field, Bossier Parish, Louisiana,” in Structure of Typical American Oilfields, Vol. II (Memoir: Am. Ass. Petrol. Geol), 229–253.
Torabi, A., Alaei, B., and Libak, A. (2019). Normal Fault 3D Geometry and Displacement Revisited: Insights from Faults in the Norwegian Barents Sea. Mar. Petroleum Geol. 99, 135–155. doi:10.1016/j.marpetgeo.2018.09.032
Torabi, A., and Berg, S. S. (2011). Scaling of Fault Attributes: A Review. Mar. Petroleum Geol. 28 (8), 1444–1460. doi:10.1016/j.marpetgeo.2011.04.003
Tschopp, R. H. (1967). Development of the Fahud Field, 1967. Mexico: World Petroleum Congress Proceedings, 243–250.
Tvedt, A. B. M., Rotevatn, A., and Jackson, C. A.-L. (2016). Supra-Salt Normal Fault Growth during the Rise and Fall of a Diapir: Perspectives from 3D Seismic Reflection Data, Norwegian North Sea. J. Struct. Geol. 91, 1–26. doi:10.1016/j.jsg.2016.08.001
Van den Bark, E., and Thomas, O. D. (1980). “Ekofisk: First of the Giant Combining (A4) and (A5) Oil Fields in Western Europe,” in Giant Oil and Gas Fields of the Decade: 1968-1978. Editor M. T. Halbouty (Memoir: Am. Ass. Petrol. Geol), 30, 195–224.
Verdier, A. C., Oki, A. C., and Suardy, A. (1980). “Geology of the Handil Field (East Kalimanton-Indonesia),” in Giant Oil and Gas Fields of the Decade: 1968--1978. Editor M. T. Halbouty (Memoir: Am. Ass. Petrol. Geol), 30, 399–421.
Vétel, W., Le Gall, B., and Walsh, J. J. (2005). Geometry and Growth of an Inner Rift Fault Pattern: The Kino Sogo Fault Belt, Turkana Rift (North Kenya). J. Struct. Geol. 27 (12), 2204–2222. doi:10.1016/j.jsg.2005.07.003
Villemin, T., Angelier, J., and Sunwoo, C. (1995). Fractal Distribution of Fault Length and Offsets: Implications of Brittle Deformation Evaluation-The Lorraine Coal Basin. Fractals Earth Sci., 205–226. doi:10.1007/978-1-4899-1397-5_10
Villemin, T., and Sunwoo, C. (1987). Distribution logarithmique self-similaire des rejets et longueurs de failles: exemple du bassin houiller Lorrain. Comptes Rendus l’Académie Sci. 305 (16), 1309–1312.
Walsh, J. J., Bailey, W. R., Childs, C., Nicol, A., and Bonson, C. G. (2003). Formation of Segmented Normal Faults: A 3-D Perspective. J. Struct. Geol. 25 (8), 1251–1262. doi:10.1016/S0191-8141(02)00161-X
Walsh, J. J., Nicol, A., and Childs, C. (2002). An Alternative Model for the Growth of Faults. J. Struct. Geol. 24 (11), 1669–1675. doi:10.1016/S0191-8141(01)00165-1
Walsh, J. J., and Watterson, J. (1988). Analysis of the Relationship between Displacements and Dimensions of Faults. J. Struct. Geol. 10 (3), 239–247. doi:10.1016/0191-8141(88)90057-0
Walsh, J. J., and Watterson, J. (1989). Displacement Gradients on Fault Surfaces. J. Struct. Geol. 11 (3), 307–316. doi:10.1016/0191-8141(89)90070-9
Walsh, J. J., and Watterson, J. (1987). Distributions of Cumulative Displacement and Seismic Slip on a Single Normal Fault Surface. J. Struct. Geol. 9 (8), 1039–1046. doi:10.1016/0191-8141(87)90012-5
Watterson, J. (1986). Fault Dimensions, Displacements and Growth. Pageoph 124 (1–2), 365–373. doi:10.1007/BF00875732
Wedmore, L. N. J., Biggs, J., Williams, J. N., FagerengDulanya, Å., Dulanya, Z., Mphepo, F., et al. (2020). Active Fault Scarps in Southern Malawi and Their Implications for the Distribution of Strain in Incipient Continental Rifts. Tectonics 39 (3), e2019TC005834. doi:10.1029/2019TC005834
Welch, M. J., Davies, R. K., Knipe, R. J., and Tueckmantel, C. (2009). A Dynamic Model for Fault Nucleation and Propagation in a Mechanically Layered Section. Tectonophysics 474 (3–4), 473–492. doi:10.1016/j.tecto.2009.04.025
Wells, D. L., and CoppersmithKevin, J. (1994). New Empical Relationship between Magnitude, Rupture Length, Rupture Width, Rupture Area, and Surface Displacement. Bull. Seismol. Soc. Am. 84 (4), 974–1002. doi:10.1785/BSSA0840040974
Whipp, P. S., Jackson, C. A.-L., Gawthorpe, R. L., Dreyer, T., and Quinn, D. (2014). Normal Fault Array Evolution above a Reactivated Rift Fabric; a Subsurface Example from the Northern Horda Platform, Norwegian North Sea. Basin Res. 26 (4), 523–549. doi:10.1111/bre.12050
Wibberley, C. A. J., Petit, J.-P., and Rives, T. (2000b). Mechanics of Cataclastic ‘Deformation Band' Faulting in High-Porosity Sandstone, Provence. Comptes Rendus de l'Académie des Sci. - Ser. IIA - Earth Planet. Sci. 331 (6), 419–425. doi:10.1016/S1251-8050(00)01423-3
Wibberley, C. A. J., Petit, J.-P., and Rives, T. (1999). Mechanics of High Displacement Gradient Faulting Prior to Lithification. J. Struct. Geol. 21 (3), 251–257. doi:10.1016/S0191-8141(99)00006-1
Wibberley, C. A. J., Petit, J.-P., and Rives, T. (2000a). Micromechanics of Shear Rupture and the Control of Normal Stress. J. Struct. Geol. 22 (4), 411–427. doi:10.1016/S0191-8141(99)00158-3
Wilkins, S. J., and Gross, M. R. (2002). Normal Fault Growth in Layered Rocks at Split Mountain, Utah: Influence of Mechanical Stratigraphy on Dip Linkage, Fault Restriction and Fault Scaling. J. Struct. Geol. 24 (9), 1413–1429. doi:10.1016/S0191-8141(01)00154-7
Willemse, E. J. M. (1997). Segmented Normal Faults: Correspondence between Three-Dimensional Mechanical Models and Field Data. J. Geophys. Res. 102 (B1), 675–692. doi:10.1029/96jb01651
Williams, J. N., Fagereng, Å., Wedmore, L., Biggs, J., Mdala, H., Mphepo, F., et al. (2021). Low Dissipation of Earthquake Energy along Faults that Follow Pre-Existing Weaknesses: Field and Microstructural Observations of Malawi’s Bilila-Mtakataka Fault. Preprint. doi:10.5194/nhess-2021-306
Wood, G. H., Trexler, J. P., and Kehn, T. M. (1969). Geology of the West-Central Part of the Southern Anthracite Field and Adjoining Areas. Pennsylvania: Geology Survey. Professional paper.
Woodland, A. W., and Evans, W. B. (1964). The Geology of the South Wales Coalfield. Part IV the Country Around Pontypridd and Maesteg. London: H.M.S.O.
Worthington, R. P., and Walsh, J. J. (2017). Timing, Growth and Structure of a Reactivated Basin-Bounding Fault. Geol. Soc. Lond. Spec. Publ. 439 (1), 511–531. doi:10.1144/SP439.14
Xu, H., Zhou, W., Xie, R., Da, L., Xiao, C., Shan, Y., et al. (2016). Characterization of Rock Mechanical Properties Using Lab Tests and Numerical Interpretation Model of Well Logs. Math. Problems Eng. 2016, 1–13. doi:10.1155/2016/5967159
Xu, S.-S., Nieto-Samaniego, A. F., Alaniz-Álvarez, S. A., and Velasquillo-Martínez, L. G. (2006). Effect of Sampling and Linkage on Fault Length and Length-Displacement Relationship. Int. J. Earth Sci. Geol. Rundsch) 95 (5), 841–853. doi:10.1007/s00531-005-0065-3
Yielding, G., Needham, T., and Jones, H. (1996). Sampling of Fault Populations Using Sub-Surface Data: A Review. J. Struct. Geol. 18 (2–3), 135–146. doi:10.1016/S0191-8141(96)80039-3
Young, M. J., Gawthorpe, R. L., and Hardy, S. (2001). Growth and Linkage of a Segmented Normal Fault Zone; The Late Jurassic Murchison-Statfjord North Fault, Northern North Sea. J. Struct. Geol. 23 (12), 1933–1952. doi:10.1016/S0191-8141(01)00038-4
Keywords: normal fault, fault length and displacement, fault scaling relationship, fault growth and evolution, fault database
Citation: Lathrop BA, Jackson CA-L, Bell RE and Rotevatn A (2022) Displacement/Length Scaling Relationships for Normal Faults; a Review, Critique, and Revised Compilation. Front. Earth Sci. 10:907543. doi: 10.3389/feart.2022.907543
Received: 29 March 2022; Accepted: 22 June 2022;
Published: 25 August 2022.
Edited by:
Laura Christine Gregory, University of Leeds, United KingdomReviewed by:
Giacomo Corti, National Research Council (CNR), ItalyCopyright © 2022 Lathrop, Jackson, Bell and Rotevatn. This is an open-access article distributed under the terms of the Creative Commons Attribution License (CC BY). The use, distribution or reproduction in other forums is permitted, provided the original author(s) and the copyright owner(s) are credited and that the original publication in this journal is cited, in accordance with accepted academic practice. No use, distribution or reproduction is permitted which does not comply with these terms.
*Correspondence: B. A. Lathrop, YmFpbGV5X2xhdGhyb3BAb3V0bG9vay5jb20=
Disclaimer: All claims expressed in this article are solely those of the authors and do not necessarily represent those of their affiliated organizations, or those of the publisher, the editors and the reviewers. Any product that may be evaluated in this article or claim that may be made by its manufacturer is not guaranteed or endorsed by the publisher.
Research integrity at Frontiers
Learn more about the work of our research integrity team to safeguard the quality of each article we publish.