 Annemarie Christophersen
 Yannik Behr2†
 Craig Miller
94% of researchers rate our articles as excellent or good
Learn more about the work of our research integrity team to safeguard the quality of each article we publish.
Find out more
ORIGINAL RESEARCH article
Front. Earth Sci., 18 July 2022
Sec. Volcanology
Volume 10 - 2022 | https://doi.org/10.3389/feart.2022.905965
This article is part of the Research TopicVolcanic Forecasting, Crisis Management, and Risk CommunicationView all 8 articles
Volcano observatory best practice recommends using probabilistic methods to forecast eruptions to account for the complex natural processes leading up to an eruption and communicating the inherent uncertainties in appropriate ways. Bayesian networks (BNs) are an artificial intelligence technology to model complex systems with uncertainties. BNs consist of a graphical presentation of the system that is being modelled and robust statistics to describe the joint probability distribution of all variables. They have been applied successfully in many domains including risk assessment to support decision-making and modelling multiple data streams for eruption forecasting and volcanic hazard and risk assessment. However, they are not routinely or widely employed in volcano observatories yet. BNs provide a flexible framework to incorporate conceptual understanding of a volcano, learn from data when available and incorporate expert elicitation in the absence of data. Here we describe a method to build a BN model to support decision-making. The method is built on the process flow of risk management by the International Organization for Standardization. We have applied the method to develop a BN model to forecast the probability of eruption for Mt Ruapehu, Aotearoa New Zealand in collaboration with the New Zealand volcano monitoring group (VMG). Since 2014, the VMG has regularly estimated the probability of volcanic eruptions at Mt Ruapehu that impact beyond the crater rim. The BN model structure was built with expert elicitation based on the conceptual understanding of Mt Ruapehu and with a focus on making use of the long eruption catalogue and the long-term monitoring data. The model parameterisation was partly done by data learning, complemented by expert elicitation. The retrospective BN model forecasts agree well with the VMG elicitations. The BN model is now implemented as a software tool to automatically calculate daily forecast updates.
As societies live and play closer to volcanoes there is a growing requirement for volcano monitoring agencies to provide quantitative information on the likelihood and impact of volcanic hazards that can be understood and utilized by various stakeholders, including landowners and managers, infrastructure managers, civil/federal aviation authorities, local people, and tourists. In addition, national health and safety legislation increasingly requires dynamic assessment of risk for employees, their subcontractors, and communication of the changing risk to other potentially affected parties. Eruption forecasting underpins such quantitative information and risk assessments.
Volcano observatory best practice recommendations propose using probabilistic methods to forecast eruptions and their uncertainties to account for the complex natural processes leading up to an eruption (Pallister et al., 2019). A recent comprehensive review on forecasting volcanic eruptions advocates for integrative frameworks to bring together diverse information that can come from monitoring data and geology (Poland and Anderson, 2020). The review highlights several promising developments that have potential to improve the utility and accuracy of eruption forecasts. These include the increase in quality and quantity of multidisciplinary monitoring data and the enhancement of computer power and machine learning algorithms.
Possible integrated frameworks for forecasting volcanic eruptions and their hazards include event trees and Bayesian networks (BNs) (Poland and Anderson, 2020). Event trees are a graphical representation of the possible sequences of events from volcanic unrest to the extent of various hazards (Newhall and Hoblitt, 2002). Each branch in the tree has a probability assigned to it. Multiplying these probabilities along the path to a particular outcome can be used to calculate the probability of that outcome. As a volcanic sequence of events evolves and new information becomes available, Bayesian methods can be used for updating model outputs (Marzocchi et al., 2008; Lindsay et al., 2010). For example, a recent study has revisited an event tree to forecast vent location and style of eruption for the Auckland Volcanic Field, incorporating new data and expert elicitation with the aim to support decision-making for evacuation (Wild et al., 2022).
Bayesian networks (BNs) are an artificial intelligence technology to model uncertain situations (Korb and Nicholson, 2010). A graphical component represents the modelled variables for users to gain a clear understanding of the modelled system while robust statistics describe the joint probability distribution of all variables. Various commercial and open-source software packages are available to build and explore BN models. These allow for complex calculations quickly and accurately on demand. Thus, BNs support better probabilistic and causal reasoning and decision-making. For this purpose, BNs have been used in many diverse areas (e.g., Pourret et al., 2008; Weber et al., 2012), including risk assessment decision support (e.g., Aspinall et al., 2003; Fenton and Neil, 2013; Gerstenberger and Christophersen, 2016). In volcanology, BNs have been applied to retrospectively analyse the 1976–77 volcanic crisis at La Soufrière volcano, Guadeloupe, (Hincks et al., 2014), the 1993 explosion at Galeras volcano, Colombia, (Aspinall et al., 2003), and in real-time to the 2011–2012 unrest on Santorini, Greece, (Aspinall and Woo, 2014). Sheldrake et al. (2017) developed a BN to evaluate evidence for the cessation in eruptive activity of the Soufrière Hills volcano, Montserrat. Cannavò et al. (2017) introduced BNs to real-time monitoring on Mount Etna, Italy. Tierz et al. (2017) used the flexible framework that BNs offer to assess rain-triggered lahars on Mount Somma-Vesuvius, Italy. Christophersen et al. (2018) undertook a pilot study to forecast eruptions for Whakaari/White Island, Aotearoa New Zealand in collaboration with the volcano monitoring scientists and volcanologists from two universities. While the pilot study did not result in a tool ready for application, the simplified graphical presentation of the volcanic system highlighted assumptions that were made by individual sub-disciplines but not necessarily widely appreciated before.
Despite these promising case studies, BNs have not been widely embraced at volcano monitoring agencies for forecasting eruptions or as decision-support tools to keep local authorities informed of impending volcanic hazards. Whitehead and Bebbington (2021) evaluated several short-term eruption forecasting methods, including event trees and BNs. They concluded that while BNs and machine-learning algorithms have significant potential most volcanoes do not have extensive catalogues of eruptions and datasets of monitoring data and therefore event trees and expert interpretation of the system are the only currently available methods for wide application.
Other recent developments in volcanic eruption forecasting include machine learning algorithms that search for seismic precursors to eruptions. Dempsey et al. (2020) used continuous waveform data, averaged into 10-min bins from Whakaari/White Island, Aotearoa New Zealand, from January 2011 to January 2020, and created hundreds of statistical features describing different aspects of the tremor signal. The 9-year period studied included five sudden onset explosive eruptions, which are the focus of the forecast tool. The model was trained on data around the eruptions and then used to identify similar signals in the subsequent time series. The forecast method identified four of five eruptions. The fifth eruption seems to have a slightly different physical mechanism and highlights the limitation of such purely data-driven approaches that can only anticipate eruptions with similar precursor patterns. The model also had 58 false positive alerts for the period with 5 eruptions, highlighting the need for care if using such methods for automated alerting and warning. In a follow-up study, Ardid et al. (2022) describe a seismic precursor signal for gas-driven eruption derived through correlation analysis of 18 well-recorded eruptions in New Zealand, Alaska and Kamchatka. They related the signal to formation of a hydrothermal seal that enables rapid pressurisation. Automated recognition of these kinds of precursor signals could become a component of an integrated probabilistic forecast framework.
Aotearoa New Zealand straddles the plate boundary between the Australian and Pacific plates and thus features active volcanism. The national volcanic monitoring is coordinated by GNS Science, New Zealand’s geological agency, through the GeoNet programme (New Zealand Ministry of Civil Defence and Emergency Management, 2015). The Volcano Monitoring Group (VMG) consists of GNS Science staff based at three sites and meets regularly to review the status of all 14 monitored New Zealand volcanic centers. The VMG has the responsibility to set Volcano Alert Levels (VALs) (Potter et al., 2014), the Aviation Color Codes of the International Civil Aviation Organization and provide scientific advice to emergency management authorities at the national, regional, and local level. There are six VALs, ranging from 0–5, that describe the status of each volcano. The VAL is not predictive or forecasting, and only describes the current level of activity. No detectable volcanic unrest corresponds to VAL 0, minor or moderate to heightened volcanic unrest to VAL 1 and 2. VALs 3 – 5 describe small, moderate and major eruptions, respectively, causing eruption hazards near vent (3), on and near volcano (4) and on and beyond volcano (5). VALs aim to inform the public and agencies of current activity levels, and the hazards associated with that level of activity.
Since 2014, the VMG has undertaken regular expert elicitations to estimate the probability of an eruption for volcanoes at VAL 1 (every 13 weeks) and VAL 2 (every 4 weeks), and more often following an eruption (Deligne et al., 2018). Individual team members provide their best guess, minimum, and maximum likelihood estimates for an eruption impacting beyond the crater rim over the time window of interest, usually 91 days at VAL1 and 28 days at VAL2, via email to a moderator, who is the only person who knows the identity of elicitation participants for a specific elicitation. At least 8 participants are required to contribute, with at least one each from the fields of geochemistry, geophysics, and geology. Monitoring data and the eruption catalogue provide fundamental inputs into the elicitation process as well as the regular discussions of the VMG. The result of this VMG elicitation, is fed into a life safety calculation (Deligne et al., 2018) assessing the level of risk and setting access protocols for staff visiting the volcano.
In this paper we describe a method to develop a BN to support decision-making, and then apply the method to Mt Ruapehu, Aotearoa, New Zealand to derive an automated eruption forecast learned from monitoring data and expert elicitation. Section 2 provides background on BNs in the context of eruption forecasting and outlines a method for their development to support decision-making. Section 3 describes Mt Ruapehu, including the conceptual understanding of the volcano, its eruption history, as well as available monitoring data to build the BN. Section 4 applies the method to forecast eruptions within the parameters of the VMG elicitation. The results are analysed via three case studies, followed by discussions of advantages and limitations of this modelling approach. The paper closes by looking at next steps and future developments.
Bayesian Networks (BNs) are probabilistic graphical models that represent a set of random variables and their joint probability distribution via a directed acyclic graph (Pearl, 1986; Korb and Nicholson, 2010). Figure 1A shows a simplified example of the graph for volcanic eruption forecasting. The variables are represented by nodes. The example includes simplified nodes for volcanic monitoring data in light blue, the node for Eruption in orange and one hidden node, Magmatic Intrusion, in yellow, that cannot be directly observed. Directed links (also called arcs) point from a “parent” node to a “child” node. “Acyclic” means that circular loops cannot be modelled while closed loops are possible. Thus, in the example, an additional arc could be added between Volcanic Process and Seismicity, with Magmatic Intrusion the parent node to avoid a cyclical loop. The direction of the arcs may indicate a causal relationship, e.g., Magmatic Intrusion may cause Geochemistry observations. However, the probabilistic calculations behind the graph representation only require dependence (e.g., correlation) between random variables and not necessarily causality. Therefore, the direction of the arcs can be chosen depending on how the joint probability distribution can best be quantified. This is different to event trees where the direction of the arcs generally indicates a sequence of events.
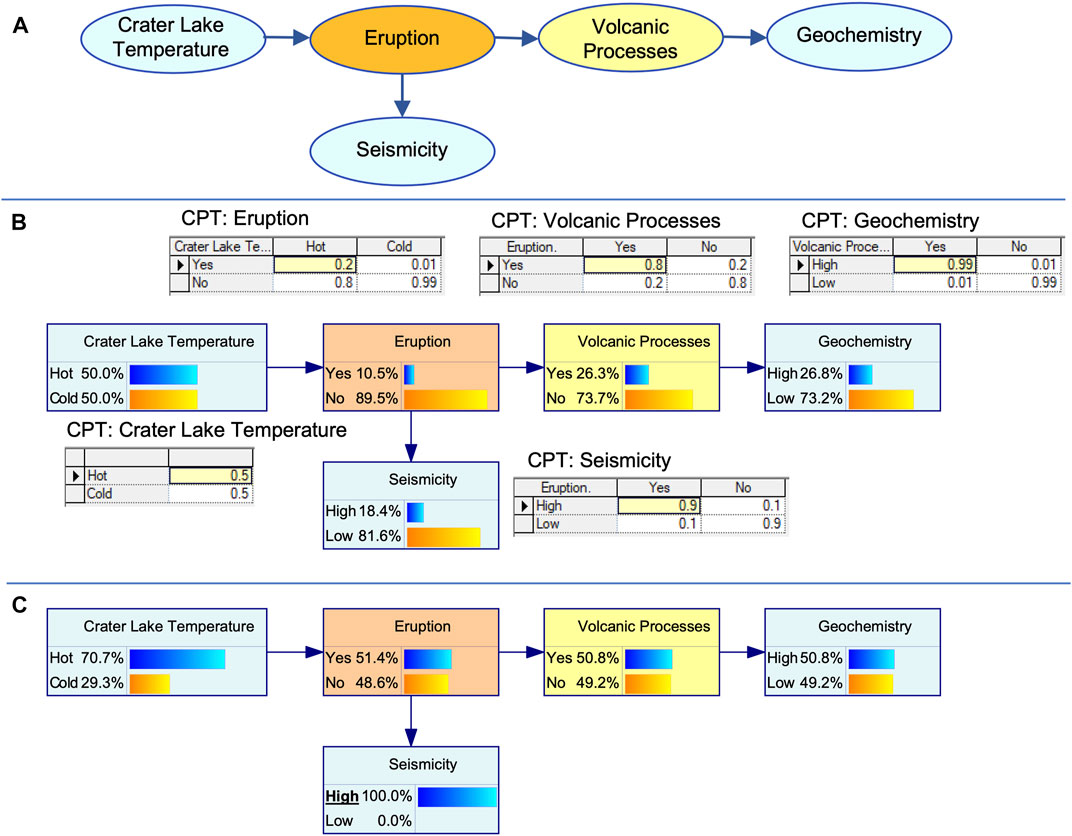
FIGURE 1. Illustration of (A) a BN structure (B) Conditional Probability Tables (CPTs) associated with each node, and (C) inference, where the observation of “High Seismicity” changes the probability distribution of the other notes. Monitoring data shown in blue, the Eruption node in orange and “Magmatic Intrusion” as a hidden node for a volcanic process in yellow. The direction of the arrows connecting the nodes do not indicate causation, or a linear process in time. Instead, they reflect dependence that is modelled with probabilistic relationships. Subplot (B) shows example of CPTs for a simplified model, where each variable has only two states. For all but the node Crater Lake Temperature, the distribution of the states is conditional on the states of the parent node. In the text we provide example calculations for the probabilities, as well as for the inference in (C).
Most commonly, the random variables are modelled as discrete, even if they are continuous. Thus, they have a finite number of states (such as low, medium, high, or increasing, unchanged, decreasing) that are mutually exclusive, and exhaustively describe the possible node states. The dependencies of discrete variables are captured in Conditional Probability Tables (CPTs).
Figure 1B shows fictitious CPTs for the simplified eruption model where each node only has two states. For Crater Lake Temperature the states are Hot and Cold, and we assume an equal probability of occurrence of 0.5 or 50%. The probabilities need to add to 1 to reflect that the states are exclusive and exhaustive. Eruption is a child of Crater Lake Temperature and thus, its CPT requires a probability estimate for each of its own states under all the possible conditions of the parent nodes(s). In the example, there is only one parent node with two states, thus there are only two conditions, Crater Lake Temperature Hot and Cold, for which to estimate the probability distribution of Eruption. Again, given the exclusive and exhaustive nature of the states, the probabilities for each condition must add to one. In the example, we assume a probability of 0.2 for eruption when the Crater Lake Temperature is Hot and only 0.01 when it is cold. These probabilities reflect the observation that eruptions happen more frequently when the lake is hot, presumably heated from fresh magma (Strehlow et al., 2017). The probability P(E = Yes) of Eruption being Yes under any conditions (i.e. the marginal probability) can then be calculated as follows
When a BN is fully parameterized, it can be used to update distributions given new data or additional observations. This is referred to as inference, instantiation or (less commonly) bi-directionality (Gerstenberger et al., 2015). Evidence added to one node can change the probabilities of all dependent nodes, regardless of the direction of the arcs. In Figure 1C, we assume that Seismicity High has been observed. We can apply Bayes’ theorem (Bayes and Price, 1763)
where A and B are events, and
Real-time models are more complex than this simplified example and require child nodes with many parents and discrete variables with many states. The number of CPT entries to parameterise such a model can become very large. Some of the conditions might be very rare, making it impossible to populate the CPT robustly. Trying to restrict the number of states to a small number creates challenges in setting state boundaries (Christophersen et al., 2018), especially for continuous data such as many volcano monitoring data.
For continuous variables, the most common BN modelling approach is to either assert some form of discretisation, or assume a parametric joint distribution (Pearl, 1988; Shachter and Kenley, 1989). Hybrid nonparametric BNs also exist that can accommodate ordinal variables measured on both discrete and continuous scales, without restricting the continuous part to be described by a parametric family of multivariate distributions (Hanea et al., 2006; Hanea et al., 2015). This approach is less common in applications.
The method that we apply to develop a BN for supporting decision-making has many similarities to the risk management process as defined by the International Organization for Standardization (ISO, 2018). Figure 2 is based on the (ISO, 2018) process flow for risk management, where the central element of risk assessment is replaced with the BN model development. Communication and Consultation as well as Monitoring and Review are embedded in the process. Communication is about informing stakeholders while Consultation is about gathering feedback from stakeholders on the model development. Both are important to ensure that the model fulfils the expectations of the stakeholders and can support the decisions that they need to make. Communication and Consultation feed into all stages of the Model Development. Monitoring and Review also feed into all stages and have the function to improve the quality and suitability of the model. Before starting on the model development, it is important to establish the context. This includes identifying the stakeholders, defining the question that the BN model is supposed to answer, identifying suitable data and information to build the model, selecting experts and appropriate tools.
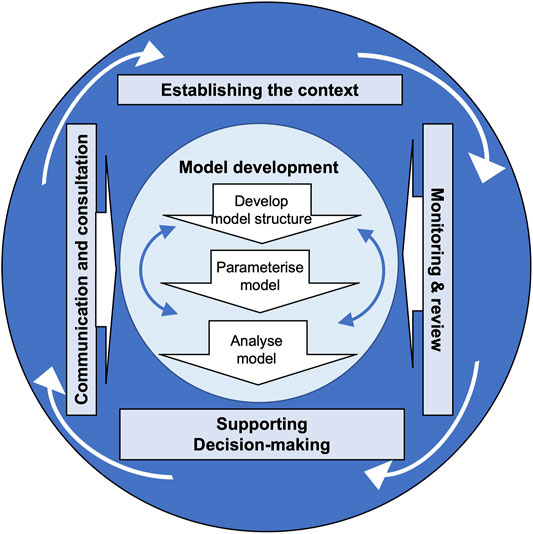
FIGURE 2. The process of the BN model development to support decision-making based on the ISO risk management process (International Organization for Standardization (ISO, 2018)). It is embedded in Communication and Consultation with the stakeholders and Monitoring and Review.
The Model Development can be generally described as having three steps: Developing the model structure, quantifying the model, and analysing and testing the model. In practice, the process is iterative. For example, part of the model can be taken through the three steps individually before the full model is assembled. Developing the Model Structure includes identifying the key variables or components. This step is guided by the question that the model aims to answer, variables that affect the outcome and available data. Parameterising the model involves quantifying the joint probability distribution of all variables. Often data can be presented in different ways, e.g. averaging measurements such as crater lake temperature over different time spans. Analysis of correlations between different parameters can guide the choices of most suitable parameterization. Model analysis is about understanding the model. It can involve sensitivity analysis between different parameters. Most BN software packages provide functionality to do this kind of analysis. Inference, i.e. setting evidence for one variable and observing the outcomes of others, is an advantage of BNs that can help investigate different scenarios.
Both the structure and the parameters of a BN can be obtained from data, experts and most commonly a combination of both. Although more and more volcano monitoring data become available in real-time, the duration for which datasets for machine learning exist is small compared to the length of the eruption cycle of most volcanoes. Therefore, the BN model development for eruption forecasting will most often require both data and expert input. Burgman et al. (2021) provide a summary of available methods for model building and quantification. While formal/structured protocols for structured expert elicitation processes exist to parameterise a model (Cooke and Goossens, 2008; Aspinall, 2010; Hanea et al., 2016; Colson and Cooke, 2017; Hanea et al., 2022), there is a gap in well-defined procedures for model development. A recently developed online platform makes a start in filling this gap (Nyberg et al., 2021).
Mt Ruapehu lies at the southern end of the Taupo Volcanic Zone (TVZ) within the Tongariro National Park (Figure 3). Tongariro National Park is a dual World Heritage Area for its outstanding natural and cultural significance. The mountain hosts three ski areas that are visited by up to 10,000 visitors per day in winter, as well as being a popular destination for hiking in the summer months. Mt Ruapehu is capped by a crater lake (also known as Te Wai ā-moe) that creates unique lahar hazards from both eruption and breakout floods. The Department of Conservation in conjunction with GNS Science operate eruption and lahar detection and warning systems, designed to give 1–2 min of warning that an eruption has occurred, giving time for ski field visitors to move out of valleys to high ground to escape eruption triggered lahars. Regular testing and drills are undertaken to ensure the effectiveness of the system (Leonard et al., 2008).
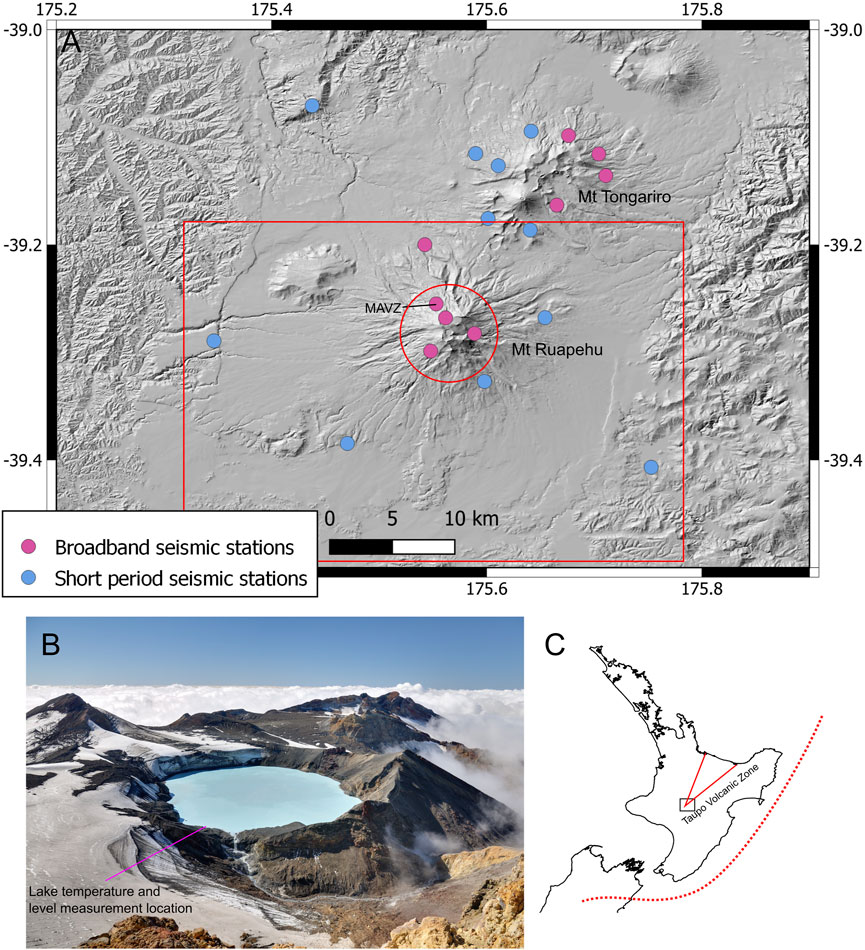
FIGURE 3. (A) Monitoring network at Mt Ruapehu and Mt Tongariro, with inner region (red circle) and outer region (red square) for seismicity rate. (B) Crater Lake, Te Wai-ā-moe looking to the north (c Visual Media Library, GNS Science, ID 113328, photographer Dougal Townsend). The outlet of the lake is visible in bottom edge of the lake in this photo and flows to the right (southeast). (C) TVZ outline (red line) and plate boundary (dashed line), rectangle box is location of map (A).
A lahar occurred in 1953, when the crater lake outlet that had been dammed since the 1945 eruption, failed. Floodwaters rushed down the Whangaehu river destroying a rail bridge minutes before a train plunged over it, killing 151 people. A similar dam failure was anticipated following the 1995/96 eruption episode that built a tephra barrier 7 m above the lake outlet (Manville and Cronin, 2007). A detection and warning system was designed and installed, and downstream engineering mitigation efforts were undertaken to strengthen bridges across the Whangaehu river valley. The system detected the dam failure on 18 March 2007 and there was no loss of life or damage to infrastructure. On 25 September 2007, an eruption through a cold lake (<13°C) severely injured a climber in the Dome Shelter, an equipment shed, on the summit plateau.
Ruapehu has been active since the last 230 ka (Conway et al., 2016; Leonard et al., 2021) with 4 major cone building and collapse periods. These build and collapse cycles have resulted in a complex, compound edifice with concentrated areas of hydrothermal alteration reflecting past locations of central vent volcanism (Kereszturi et al., 2020; Miller et al., 2020; Kereszturi et al., 2021). Since ∼5 ka activity is centred beneath the crater lake (Conway et al., 2016). Ruapehu magma is inferred to be hosted in vertical storage domains within the crust below the volcano (Price et al., 2012). Geophysical evidence (Ingham et al., 2009) suggests magma storage domains within the top 10 km are linked by narrow conduits to the summit of the volcano where the tip of the magma column resides within the edifice (Figure 4A). In the top 1 km below the crater lake the hydrothermal system interacts with the tip of the magma column, transferring heat and gas into the lake (Figure 4B).
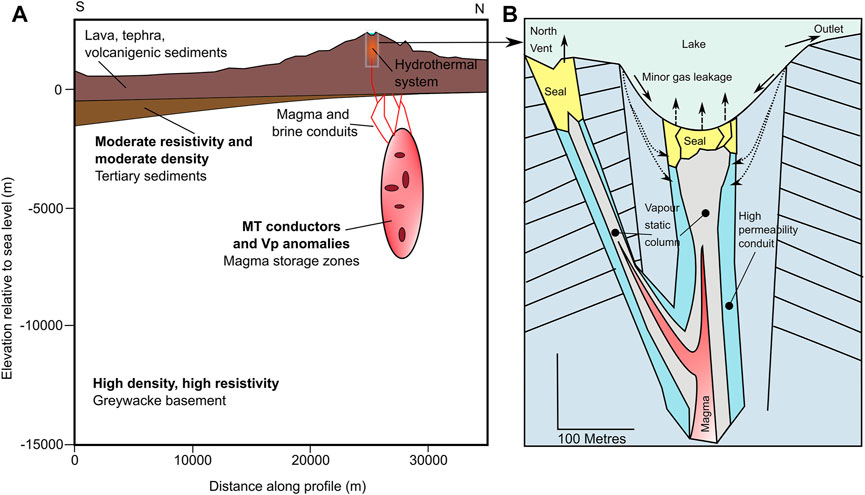
FIGURE 4. Mt Ruapehu volcano conceptual model on two scales. (A) South to north cross section showing crustal setting of Mt Ruapehu and locations of basement, magma and hydrothermal system inferred from geological mapping and geophysical surveys (modified after Leonard et al. (2021)). The box around the crater lake region is shown in detail in part (B). (B) Generalised components of the hydrothermal system beneath the crater lake (modified after Christenson et al. (2010)).
Release of hot magmatic gases into the lake is modulated by hydrothermal mineralisation (e.g., alunite/natroalunite) and elemental sulphur deposition, creating low permeability seals within the upper vent conduits (Christenson et al., 2010). Magma interacting with hydrothermal fluid also changes the lake chemistry, so that constituents such as Mg2+, Cl−, Al3+, Na+, K+, and SO4 are useful indicators of relative components of magmatic versus hydrothermal input into the lake. As such, the physical and chemical properties of the lake are controlled by complex interactions between influx of deep magmatic gases and the overlying hydrothermal system.
The interaction of the magmatic and hydrothermal systems produces cyclic temperatures in the crater lake that vary typically between 15 and 45°C with approximately 6–18 months cycles. The median lake temperature since measurements began is 26°C. Eruptions have occurred from both hot lakes (temperature >45°C, e.g., 1971, 1995) as well as cold lakes (i.e., 2007, lake temperature <13°C), however more than half of the eruptions follow lake temperatures higher than 40°C (Strehlow et al., 2017). Strehlow et al. (2017) concluded that lake temperatures significantly above and below long-term background can indicate increased eruption probability.
Eruptions from lakes hotter than approximately 45°C suggest that magma intrusion to shallow level is the causative process, while eruptions from cold lakes (<15°C) suggest that over pressurisation within the conduit is driven by a sealing mechanism, such as pore-space mineralisation. In the sealing scenario, precipitation of minerals such as natroalunite in conduit fractures and pore-spaces reduces permeability, preventing the free discharge of hot gas and fluids into the lake. This results in a build-up of pressure in the conduit below the seal and can led to eruption when that seal fails, e.g. Raoul Island (Christenson et al., 2007) and White Island (Ardid et al., 2022). Sealing also results in decreased gas flux, as observed in the lead up to the 2007 eruption, as well as a change in lake chemistry as cations that make up alunite/natroalunite seals (e.g., K and to a lesser extent Na) are depleted from the crater lake solution (Christenson et al., 2010).
Magma intrusion can also create seismic swarms on the flanks, as well as at distant locations because of local stress changes caused by magma injection (Hurst and McGinty, 1999; Kilgour et al., 2014; Hurst et al., 2018). Girona et al. (2018) also found that Ruapehu was sensitive to Sun-Moon gravitational forces during the 3 months prior to the 2007 eruption, suggesting the system was in a critically stressed state, with building overpressure behind a mineralogical seal.
The flux of magmatic or hydrothermal system fluids also generates volcanic tremor. The cause of tremor is typically interpreted as the flow of pressurised fluids (gas, liquid, or two-phase fluid) through a constriction such as a crack or conduit. This causes the wall of the constriction to vibrate like an organ pipe and this vibration is called tremor (e.g., Chouet and Matoza, 2013).
In summary, the complex interplay between magmatic and hydrothermal system processes creates unrest scenarios that produce a variety of monitoring signals depending on the dominant mechanism.
Since 1830 more than 571 eruptions have been recorded (Scott, 2013) making Ruapehu one of New Zealand’s most active volcanoes alongside Whakaari/White Island (Kilgour et al., 2021). Many of these eruptions occurred on the same day during eruption sequences, leaving 338 days in the last 192 years that had eruptive activity. Scott (2013) categorised eruptions on a 6-point scale where eruptions size 0 (lake steaming), 1 and 2 are confined to the crater lake or its immediate basin. Size 3 eruptions deposit material outside the crater basin but not beyond the summit region, while eruptions size 4 and 5 deposit material onto the outer flanks or beyond the whole volcanic edifice. The VMG elicitation and thus the BN only considers eruptions equal to or larger than size 3 (Figure 5A in red), as these are the eruptions likely to extend beyond the crater lake basin and impact infrastructure and recreational activities in the national park, for which the ability to forecast and warn is critical. There are 317 eruptions size 3 or larger since 1830. The most recent eruption of Ruapehu was 25 September 2007, size 4, (Christenson et al., 2010; Kilgour et al., 2010), following a size 2 eruption in October 2006. These two small eruptions followed a prolonged period of eruptive activity in 1995 and 1996 (Size 5).

FIGURE 5. Time series of key parameters in the model and the discretisation intervals of the variables. The panels to the right of each time series show the histograms for the respective discretisation intervals. (A) Eruption history with events size 3 or larger shown in red. (B) Lake temperature. (C) Mg:Cl ratio, (D,E) Airborne SO2 and CO2 flux respectively, (F) RSAM, (G) SO4 concentration, (H) Earthquake rate in the outer region, (I) Earthquake rate in the inner region.
Strehlow et al. (2017) proposed that phreatic eruptions at Ruapehu do not follow a Poisson process, instead they tend to cluster, possibly linked to an increased heat flow during periods of shallow magma intrusion. We also recognise this clustering process. Since we are interested to forecast the first eruption following a period of unrest, we de-clustered the eruption catalogue. To do so, we analysed the number of eruptions of size 3 or larger, within de-clustering intervals ranging from 1 to 365 days (Figure 6). This analysis shows that the number of eruptions of size 3 or larger, occurring within an interval, decreases slowly after 14 days from the initial eruption. We therefore remove eruptions occurring within a 14-days interval after an eruption resulting in 61 eruptions size 3 or larger. We also exclude eruptions occurring during the October 1945 to August 1946 and July 1995 to December 1997 magmatic eruption episodes, as eruptions within these time periods are causatively linked and violate the Poisson assumption of no causality between events. This reduces the total number of declustered eruptions greater than scale 3 to 51.
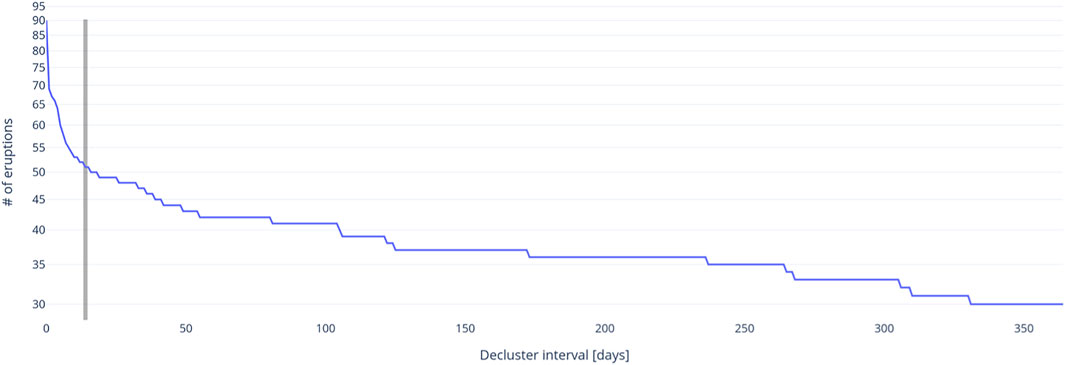
FIGURE 6. Number of eruptions contained in each de-clustering interval. The change in slope at 14 days, marked by the vertical grey bar, is selected as the optimal de-clustering interval.
Mt Ruapehu is one of the most intensely instrumented volcanoes in Aotearoa, New Zealand (Miller and Jolly, 2014). Ruapehu is monitored by a network of 10 seismometers (5 broadband and 5 short period, 3 of which are housed in 50–100 m deep boreholes), 8 air pressure (infrasound) sensors to detect eruptions, and 9 GNSS stations to monitor land movement. 15 km to the northeast, Tongariro volcano (including Mt Ngauruhoe) is monitored by a similar number of seismic, infrasound, and GNSS stations that also record seismic and volcanic activity from Ruapehu. Seismic stations that provided data for this study are shown in Figure 3.
Data are publicly available through webservices provided by GeoNet. Being able to access all datasets programmatically is essential to update BN forecasts automatically. Data used in the BN are listed in Table 1 together with the sampling intervals and time series start and end dates. Figure 5 shows timeseries of a selection of the data used in the BN.
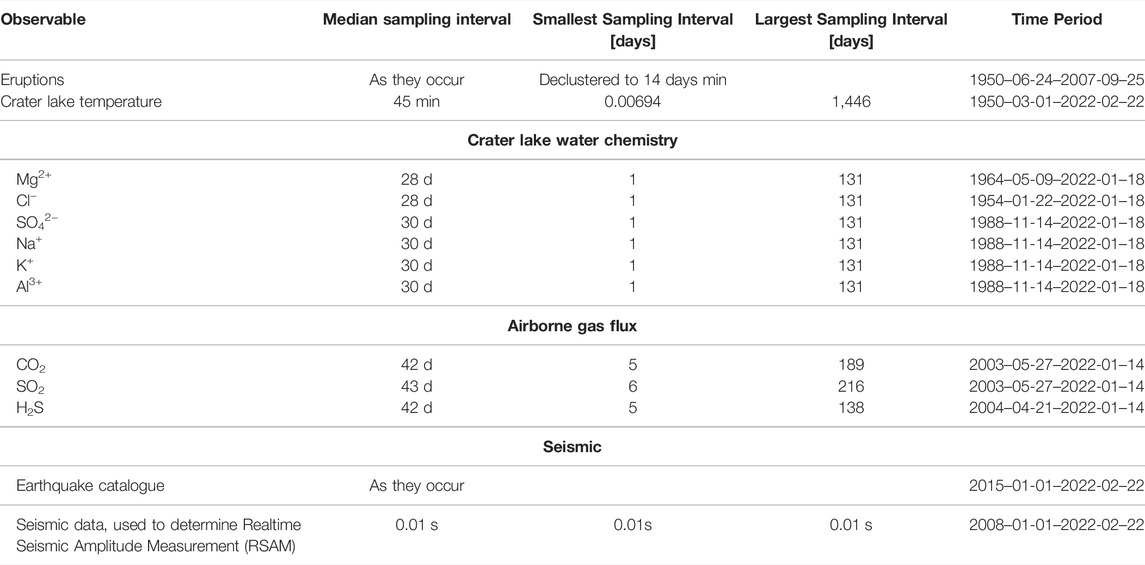
TABLE 1. The available monitoring data, their median, smallest and largest sampling intervals, and time period of recording.
The crater lake temperature near the outlet (Figure 5B) has been regularly measured since 1950s, initially intermittently and since 2008, recorded every 15 min and transmitted several times per day via satellite link to GeoNet’s data center. The lake water level relative to the overflow point is also recorded, however, it is strongly affected by external factors, such as rainfall, that can create lake level changes larger than volcanic processes. Therefore, we do not use the lake level in the BN. In addition, water and dissolved gas samples are manually collected from the lake on an approximately monthly basis and analysed by GNS laboratories (Figures 5C,G).
Mt Ruapehu emits a gas plume through the crater lake that is measured using spectrometers and electrochemical sensors (sensing SO2, CO2 and H2S) mounted on a fixed wing aircraft, at approximately monthly intervals (Figures 5D,E). Daily images of SO2 concentrations in the atmosphere are collected from the TropOMI satellite (e.g., Burton et al., 2021), however the plume from Ruapehu is usually below detectable levels from the satellite.
The Tongariro National Park (TNP) seismic network is part of the New Zealand seismograph network operated by GNS/GeoNet. Earthquakes are automatically located within a few minutes of their occurrence using the SeisComP3 processing system. Since 2015, the magnitude of completeness of the TNP network is around local magnitude ML0.5 with events down to ML0 recorded in the catalogue. We use earthquake rate as input parameter, determined from all earthquakes that occur regardless of the magnitude of completeness, since small events can be relevant to forecasting eruptions as seen, for example, before the 2012 Tongariro eruption (Jolly et al., 2014). Only earthquakes in the upper 30 km of the crust are considered as related to the volcano i.e., volcano-tectonic and are included here. For the BN we divide seismicity into two zones. The inner zone is all earthquakes within a 5 km radius of the lake, which is approximately the extent of the upper edifice. The outer zone is all earthquakes within 39 × 35 km box (EW, NS dimensions respectively) around Mt Ruapehu (https://www.geonet.org.nz/volcano/eqstats/ruapehu), (Figures 3, 5H,I). The average earthquake rate in the outer and inner region is 1.56 and 0.15 per day, respectively. The median inter-event times are 8.7 and 67 h.
Continuous seismic data from DRZ and MAVZ stations are used to calculate 10-min average Realtime Seismic Amplitude Measurements (RSAM) (Figure 5F). The VMG uses predefined thresholds for RSAM to classify tremor as low, medium, or high. The threshold for high tremor was set such that it would be exceeded by significant periods of increased volcanic tremor during the past decade, but more transient increases would remain below. The boundary between low and medium is set at half the threshold for high.
DRZ was housed in Dome Shelter, approximately 500 m north of the crater lake. Digital data from this station exist from 2008 to 2017 when it was dismantled. Station MAVZ was installed in 2013 and is now the closest seismic station, about 800 m to the north of the former DRZ station. Prior to 2008 analogue data were collected at DRZ beginning in 1984, however calibrations to rescale the analogue to modern digital data are not reliable; hence data prior to 2008 are not used. Four years of overlapping data coverage between the two stations allow DRZ data to be rescaled to MAVZ data, using a linear correlation of tremor values, thereby extending the time series from MAVZ.
To build the eruption model for Ruapehu, we applied the methods outlined in Section 2.1. Here we provide details on establishing the context and the individual steps of the model development. For model analysis, we describe how we estimate model uncertainty and undertake model validation.
For the application to Mt Ruapehu, the VMG is the key stakeholder. Two of the authors (CM and YB) are members of the VMG and therefore have a deep understanding of the requirements. The VMG has been involved in regular communications and consultation throughout the model development process and monitored and reviewed progress by presentations of results from the different model development steps. The question that we address is aligned to the VMG elicitation and asks “What is the probability of an eruption at Mt Ruapehu within the next forecast period that impacts beyond the crater lake?”. The forecast period depends on the VAL and we focus here on a 13 week period, which corresponds to VAL 1. The experts to inform the process were also the members of the VMG. Data and information to incorporate into the model development are the monitoring data described in Section 3.3, and the conceptional model of Mt Ruapehu (Figure 4). To implement the BN we use the Python programming language and the SMILE reasoning engine for graphical probabilistic models, available free of charge for academic research and teaching use from BayesFusion, LLC, https://www.bayesfusion.com/. Exploratory data analysis is mainly done in Jupyter Notebooks (Beg et al., 2021) and the results are visualized with bespoke graphics using the Plotly graphing library (Plotly Technologies Inc., 2015) and for the VMG in BayesFusion’s web interface BayesBox.
The development of the model had three stages. These broadly correspond to three sets of parameters, A, B, and C that have different data availability. The different parameter sets are represented in different colours, blue for A, green for B, and yellow for C and the eruption node in orange (Figure 7). The initial stage was undertaken by the authors, focusing on the parameters with the longest records, eruptions and crater lake temperature. Given that the measurements are supposed to reflect the variables for the next 91 days of the forecast period to align with the VMG elicitation, we introduced intermediate nodes that reflect the minimum and maximum temperature and the maximum trend during the forecast period. In the second stage, parameters were added with a shorter record, which had most if not all measurements outside an eruption occurring, i.e., post 2007. To keep the CPT of the eruption node manageable, eruption was chosen as parent node for all the variables in set B, as well as for the hidden nodes that represent the volcanic processes. We presented the initial model to the VMG for feedback. There were suggestions to investigate further parameters, including the magnesium chloride ratio which has a long measurement record. The final stage was in collaboration with the geochemists and resulted in two hidden nodes to reflect there are two geological scenarios (magmatic intrusion or hydrothermal seal) that can lead to eruption and that those would be preceded by different observations.
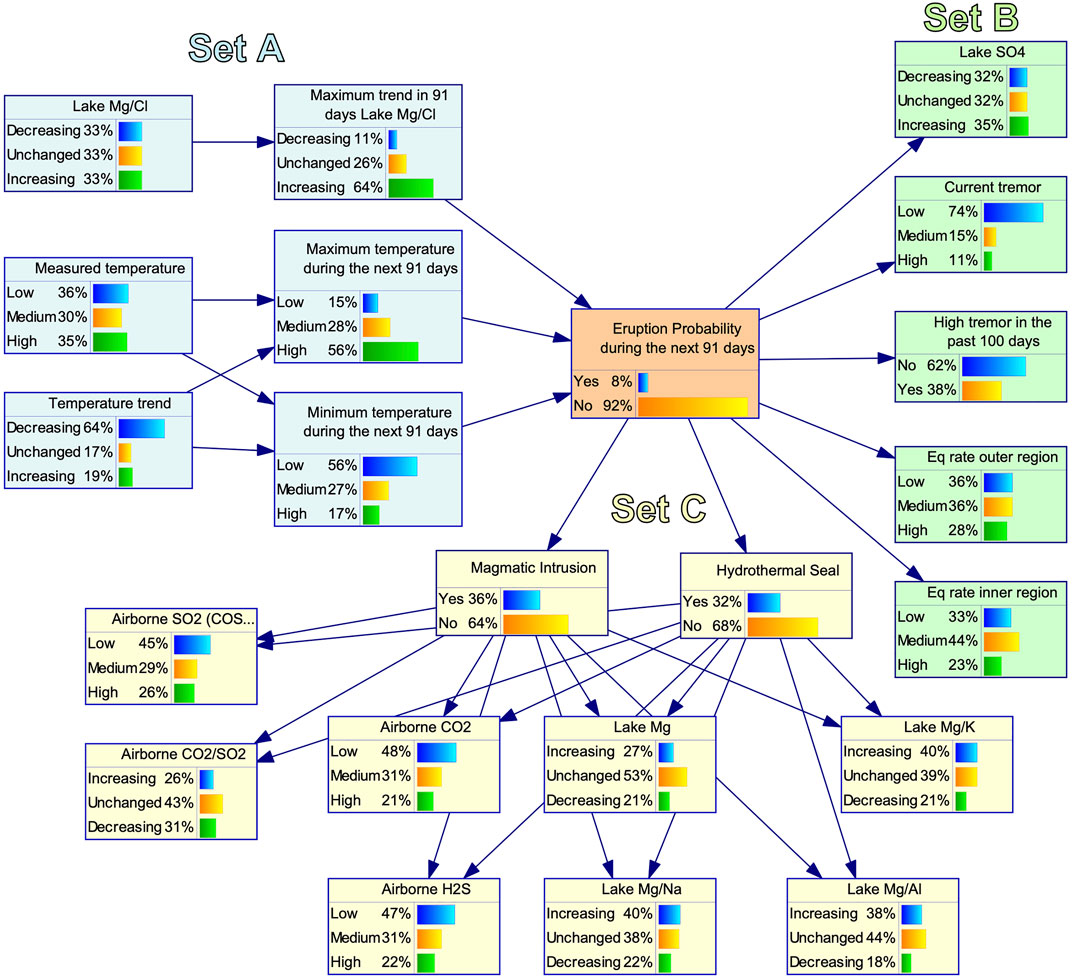
FIGURE 7. The BN model to forecast the probability of eruption to impact beyond the rim of the crater lake during the next 91 days. The orange node represents Eruption. The blue nodes (Set (A)) represent monitoring data with a long observation period that could be used jointly with the Eruption node to learn the CPTs from the data. The green nodes (Set (B)) represent monitoring data, which had not sufficient observations when an eruption occurred so that only the condition of no eruption could be learned from data. The CPT entries for the condition that an eruption occurred were elicited from experts. The yellow nodes (Set (C)) represent two hidden nodes and geochemical observations, for which the CPTs were fully elicited by members of the VMG.
Table 1 lists all datasets used to train and evaluate the BN and Figure 5 shows the time-series for a subset of them. Record lengths and sampling intervals are markedly different for most datasets. A particular strength of BNs is their ability to handle missing data, which allows us to use the whole record length for almost all datasets. When training the BN, missing data are handled with the Expectation-Maximization algorithm, an iterative optimisation technique that can be used to infer the entries of the CPTs even if some of the training data records have gaps (e.g., Do and Batzoglou, 2008; Ratnapinda and Druzdzel, 2015). During inference, nodes in the BN without data are integrated over all possible states of the node. Neither of these two techniques are possible with non-probabilistic machine learning methods such as standard Artificial Neural Networks.
For the earthquake rate data, we did not use the whole record length. This is because the seismic monitoring of Mt Ruapehu has improved significantly over the past few decades and consequently the number of detected earthquakes 20 years ago cannot be easily compared to the number detected today. To systematically use older records, we would need to introduce a magnitude of completeness and disregard many smaller events. However, small events can be relevant to forecasting eruptions as mentioned above. To calculate earthquake rates, we used the seismic catalogue from 1 January 2015, since when earthquake detection capabilities have been largely unchanged.
Geochemical samples and measurements are taken about 10–12 times per year whereas geophysical observations are typically made at least daily. To mitigate the disparate sampling rates between different datasets we chose to interpolate and resample all at a daily interval. Other options include using only data that are available on any given day or deciding on an arbitrary time window over which an observation remains valid. Using the data only on the day of measurements and, for example, the average values on other days lead to abrupt changes in the forecast probabilities. These sudden changes would be difficult to explain to stakeholders as they are counterintuitive given the often more gradual changes in the volcano monitoring data. Interpolation will certainly deviate from the true value of, for example, SO2 flux between two measurements. The interpolated value is, however, likely to be closer to the true value than the previous measurement and leads to a smoother time series of eruption forecasts.
We decided to only use discrete variables with either 2 or three states, depending on the type of data a node refers to. We distinguished three different types of nodes: binary nodes such as ‘Eruption’ (states: ‘yes’, ‘no’), dataset nodes such as ‘Measured temperature’ (states: ‘low’, ‘medium’, ‘high’), and trend nodes such as ‘Lake SO4’ (states: ‘decreasing’, ‘unchanged’, ‘increasing’). For dataset nodes, we used prior knowledge to set the state boundaries if possible. For example, the VMG uses predefined thresholds for RSAM to classify tremor as low, medium, or high. In cases where such information was not available, we determined the state boundaries such that an equal number of values is assigned to each of the states. This is equivalent to assuming a uniform prior distribution over the states. It is important to note here that such automatically determined state boundaries will vary depending on the time periods spanned by the datasets.
As mentioned above, we divide the network’s nodes into three sets. Set A (blue in Figure 7) contains nodes for which records go back at least to the 1960s (crater lake temperature; Mg2+ and Cl-concentrations). Because there is a big overlap between Set A and the eruption catalogue, CPTs involving nodes A, that is P(E=yes|A) and P(E=no|A), can be purely learned from data using Expectation-Maximization (Ratnapinda and Druzdzel, 2015). Sets B (green in Figure 7) and C (yellow in Figure 7) contain nodes for which at most one eruption occurred during the recording period. CPTs involving nodes in set B can be partially learned from data. We learn the conditional probabilities P(B|E=no) from data and elicit the probabilities P(B|E=yes). Because we introduced the two hidden nodes for the probability of magmatic intrusion (M) and hydrothermal seal (H), CPTs involving Set C and the nodes M and H have to be elicited by experts (P(C|M=yes, H=yes), P(M=yes|E=yes), P(H=yes|E=yes) etc.).
The elicitation was conducted with members of the VMG in a similar method as the regular elicitation of probabilities. Depending on the elicitation question we had between three and nine expert estimates of the CPTs for nodes in Set B and C. We combined them by taking the mean over all estimates for each elicitation question. Unlike the median, the mean guarantees that the resulting probabilities over all states will still sum to one. Every expert involved in the elicitation process was also provided with a model populated with their individual estimates. This allowed experts to interrogate the model resulting from their own estimates and compare it to the final mean model.
Sources of uncertainty in our forecasts are the BN model structure, the measurement uncertainty of each dataset, and the discretisation of the continuous data. Because the BN includes both data- and expert-informed parts, modifying the structure of the BN cannot be done in an automated fashion. Investigating uncertainty from the model structure is, therefore, not feasible using the method described below. Estimating accurate measurement uncertainty is difficult for most datasets and is unlikely to be significant in comparison to uncertainty stemming from discretisation. We hence focused on quantifying the influence of different discretisation on the forecasts. Because several of the CPTs are determined fully or partially by expert elicitation, we could not easily change the number of discretization steps, that is the number of states of each node. We therefore only varied the state boundaries within a uniform distribution around the original boundaries and then retrained and re-evaluated the resulting model. Specifically, we varied all state boundaries randomly within ±10% of the original boundaries and repeated this procedure 500 times. This results in an ensemble of 500 forecast time-series. For each day in the forecast time-series we approximated the resulting ensemble of forecasts with a normal distribution to determine the mean and 90 percent confidence interval. The results are shown in Figure 8 and compared to the VMG elicitation.
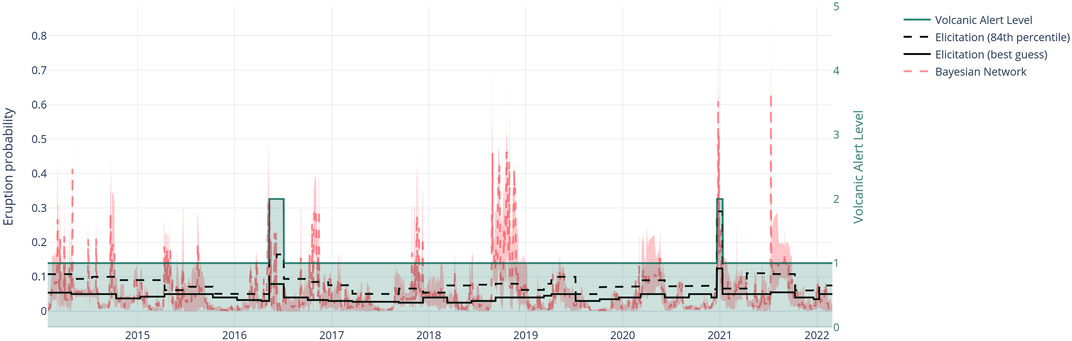
FIGURE 8. Ruapehu BN time series from 2014 to 2022. The red dashed line shows the BN forecast with its 90% confidence interval shown in shaded pink. The solid black line shows the median forecast of VMG elicitations with the black dashed line showing their 84th percentile. The green line and shaded area indicates the Volcanic Alert Level at Mt Ruapehu.
Most of the observational data were recorded during a period with very few eruptions, i.e. have been measured post 1997. As mentioned earlier, this means it is not possible to establish sound statistical relationships between the monitoring datasets and eruptions, which led us to add expert elicited nodes to the BN. It is, therefore, also not possible to validate the final model using standard techniques such as cross-validation (e.g., Murphy, 2022a).
While we cannot easily evaluate the accuracy of our forecasts (which is a common problem for rare events), we can test whether the long-term, cumulative probability of our forecasts is compatible with the historic eruption rate for Ruapehu. Because we learned the nodes in Set A using the eruption catalogue, we expect the marginal probability of an eruption (P(E=yes)) to be close to the Poisson probability of the long-term eruption rate. However, nodes in Set B and C are child nodes of the eruption node and in the absence of evidence will not influence P(E=yes). To calculate the long-term probability of the whole BN’s forecasts we first convert 91-days probabilities to daily probabilities assuming a binomial distribution. We then compute the cumulative probability of an eruption during the 8 years between 2014 and 2022 assuming a Poisson binomial distribution (Hong, 2013). The resulting probability is 0.82 (min: 0.51, max: 0.98), which we convert into a yearly rate of 0.21 (min: 0.09, max: 0.46) assuming a Poisson distribution.
For comparison, the long-term annual eruption rate based on the declustered eruption catalogue from 1950 to 2022 is 0.28. The expected annual eruption rate from VMG elicitation forecast is 0.17 (min: 0.05, max: 0.35). Both the BN and the VMG elicitation include the eruption rate from the catalogue but tend to be slightly lower, reflecting a period of lower volcanic activity since the mid 1990s. The annual eruption rate since 2000 has only been 0.05. Forecast rates for the elicitation and the BN to be between the long-term and short-term eruption rate appear to be intuitively correct but the true validity and performance of our model can eventually only be tested with further eruptions. In the following section we compare our BN performance to the VMG elicited values as an additional form of validation.
Figure 8 shows the parameterised eruption forecast model developed during this study to be consistent with the VMG elicitation for 91 days. This is the model using the mean estimates of the expert elicitation. In addition, there are also model versions for each individual expert, who participated in the elicitation. As explained above, we distinguish three sets of parameters, A, B, and C as indicated by the colours blue, green, and yellow. In the following sections we discuss the BN forecasts for three case studies representing different time periods and analyse the sensitivity of the model to various input parameters. We then discuss the possible uses of the forecasts, followed by advantages and limitations of the BN modelling for eruption forecasting.
We look more closely at the forecasts of the BN over three time periods and compare them to the VMG elicitation eruption probabilities. The first period is in May 2016 when the highest lake temperature since the 1995/96 eruption was recorded (46.3°C on 11 May 2016). The second period lasts from September 2018 to February 2019 when the crater lake was sustained above 28°C and underwent several short heating cycles. The third period is from December 2020 to February 2021 when the highest CO2 flux in the gas plume (3,067 t/d on 16 December 2020) was recorded since measurements began in 2003. The full suite of monitoring observations for these periods is summarised in Table 2. These time periods allow us to investigate the sensitivity of the network to different parameters.
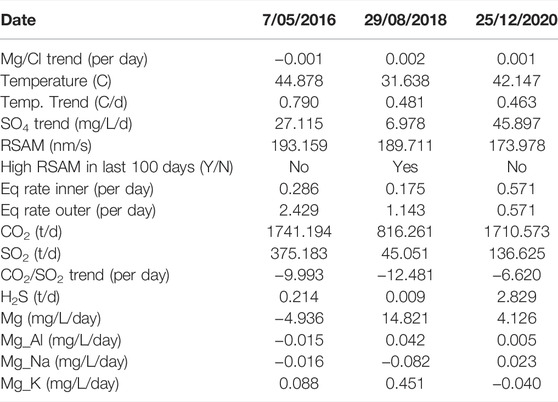
TABLE 2. The measured values of the monitoring data for each of the three case study dates presented in Figure 12.
Between 1 April and 11 May 2016 the crater lake temperature rose to 46.3°C, the hottest lake temperature since the lake reformed post the 1995/96 eruption episode (Figure 9). In late April 2016 a swarm of earthquakes was recorded beneath the crater lake in the inner earthquake zone (https://www.geonet.org.nz/vabs/79Xso7vAOWamQSKE8UGmiY) as the lake temperature exceeded 40°C. Volcanic tremor was at low levels during the start of the heating cycle and increased to medium levels in early May and had not been at high levels in the previous 100 days (Table 2). Volcanic gases SO2 and CO2 were also elevated (350 t/d SO2 and 1800 t/d CO2) and the CO2:SO2 ratio was low (6.5) indicating a strong magmatic signal. Because of the high lake temperature and associated elevated gas flux and earthquakes beneath the lake, the volcanic alert level was raised to VAL 2 on 11 May 2016, and the aviation colour code to yellow (https://www.geonet.org.nz/vabs/50d2iGPUAUEg4amq0GcsqK). The volcanic alert level was reduced to VAL 1 and aviation colour code to green on 5 July 2016, once the lake temperature, gas emission rates and volcanic tremor intensity declined substantially. The volcanological interpretation of this activity by the VMG was likely a perturbation of the hydrothermal system caused by an influx of hot magmatic gases from a deep source within the edifice (Figure 4), rather than injection of fresh magma into the shallow hydrothermal system. The interpretation of a deep magmatic source was based on the elevated CO2 emission rate. CO2 has low solubility in magma and as magma ascends it is one of the first gas species to be exsolved (Lowenstern, 2001), hence elevated CO2 is often indicative of deeper magmatic degassing.
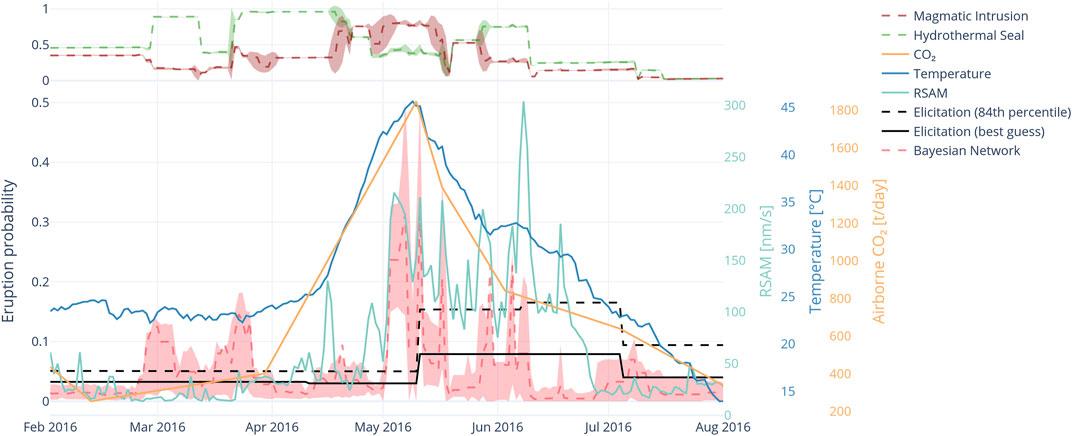
FIGURE 9. BN timeseries from February to August 2016 covering period of high crater lake temperature. Pink shading indicates 90% confidence interval around the mean of the BN forecast (red dashed line). Corresponding best guess and 84th percentile values from VMG elicitations shown in black curves. Lake temperature and RSAM are shown by blue and green curves respectively. The top panel indicates the values of the hidden BN nodes, magmatic intrusion (red dashed line) and hydrothermal seal (green dashed line), with shading showing the 90% confidence interval.
Figure 9 shows the forecasts of the BN around the heating cycle from February to August 2016. The black lines show the VMG elicitation values, and the step up on 11 May when the VAL was raised to level 2 (and the elicitation period reduced from 91 to 28 days). However, 10 days prior to this VMG elicitation round increasing the eruption probabilities, the BN forecast for the probability of eruption in the next 91 days raised from background (approximately 0.05) to 0.23 mean value. Prior to that, in March, the BN elevated slightly from background to around 0.15, associated with a small increase in earthquake rates. The BN forecast peaked at 0.3 mean value, initially on 7 May and then again on 11 May with a decrease in between caused by fluctuations in tremor intensity.
The BN forecast then fluctuated in an elevated state, largely controlled by tremor intensity, until returning to background on around 18 May when the lake temperature had established a decreasing trend and had decreased to around 37°C. However, a week later the rate of lake temperature decrease slowed in association with another series of short-lived tremor bursts that also caused short-lived higher eruption probabilities. Finally, in mid-June the lake temperature continued its decline and as the tremor decreased so did the BN forecast return to background levels. Meanwhile the VMG elicitation forecast remained high for another 28 days, through another cycle of VMG elicitation until 5 July when the temperature had reached 23°C. The VMG elicitation on 5 July lowered the regular forecast to 0.09 (84th percentile value) in conjunction with the VAL returning to level 1.
An increase in the lake temperature alone was not sufficient to significantly raise the BN forecast. It was only when the lake temperature reaching the high band, and tremor and CO2 reaching the medium band (Figure 5) came together that the BN forecast increased significantly. The state of two nodes reflecting either the Magmatic Intrusion or Hydrothermal Seal by natroalunite as the dominant volcanological processes (Figure 7) are shown in the top panel of Figure 9. These nodes show that the dominant process switched from seal to magmatic intrusion with 0.75 likelihood, about halfway up the rising lake temperature and prior to the BN forecast increasing. The change of the dominant process to magmatic intrusion prior to the BN forecast change provides a useful early indicator of a pending increase in eruption probability. Magmatic intrusion remained the likely mode until the lake began to cool and tremor reduced. Prior to the lake temperature rise, hydrothermal seal was the dominant process.
This example shows the utility of the network in early detection of unrest, but importantly also prompt recognition of when the unrest period had ended. The BN detected higher eruption probability approximately 8 days prior to the VMG elicitation and further detected a change in state from hydrothermal to magmatic activity several days before the increase in eruption probability. The fixed 4-weeks interval of the VMG elicitation at VAL2 inherently creates a lag, compared to a daily updated, data-driven BN and in this example by the time the VMG elicitation had occurred, the peak of the eruption probability had already passed. In addition, the VMG elicitation kept the eruption probability elevated for 56 days while the BN returned to background after approximately 40 days. Even though VAL is not directly determined by eruption probability, changes in VAL often reflect the VMG judgement on the likelihood of eruption. As such, this has implications for stakeholders and local inhabitants, who may be adversely affected by restrictions caused by elevated alert levels or who may be put in danger by delays in raising an alert level.
Between September and December 2018, the BN forecast was at an elevated level (0.1–0.45) while the VMG elicitation values remained around background (0.08, 84th percentile value) (Figure 10). In mid-August the crater lake temperature increased from 24 to 33°C and then began to oscillate with monthly cycles between 28 and 33°C rather than displaying its usual long term cyclic behaviour. This oscillatory behaviour was observed in 2012, 2017 and late 2019, but at lower temperatures (20–25°C). Airborne CO2 flux also oscillated during this period. CO2 flux was moderate at the start of this period (1,600 t/d) but decreased to ∼700 t/d before increasing again to ∼1,300 t/d and then decreasing to ∼400 t/d in later 2018. The CO2:SO2 ratio was <25 throughout the time interval. Volcanic tremor increased sharply at the end of August 2018 to the high band and then remained low aside from a brief spike in November. The Mg:Cl ratio peaked during the period and then declined in early 2019. The volcanological interpretation of these data is that the system was partially sealed allowing only irregular pulses of gas and heat into the hydrothermal system. This pulsatory behaviour was enough to maintain the lake at elevated temperatures throughout this period. The VAL remained at 1 during this time.
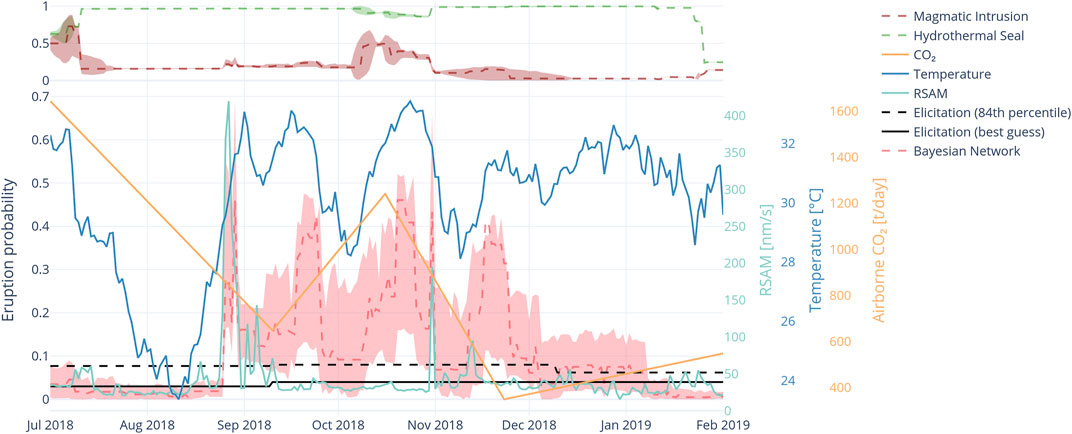
FIGURE 10. BN forecast timeseries from August to February 2019 covering period of sustained high crater lake temperature. Pink shading indicates 90% confidence interval around the mean (red dashed line). Corresponding best guess and 84th percentile values from VMG elicitations shown in black curves. Lake temperature and RSAM are shown by blue and green curves respectively. The top panel indicates the values of the magmatic intrusion (red dashed line) and hydrothermal seal (green dashed line) with shading the 90% confidence interval.
The BN forecast shows 4 peaks between late August 2018 and end of November 2018. The higher eruption probability peaks relate to peaks of lake temperature fluctuation when the temperature oscillated 5–10°. The first BN forecast peak in late August 2018 was caused largely by the tremor spike rather than lake temperature as the temperature did not peak until several days later. For the remainder of the short-term BN forecast cycles the tremor was not a significant factor, rather the lake temperature oscillating in and out of the high band (>31C) was the controlling influence. Interestingly, the broad temperature peak in late December 2018 to January 2019 did not result in an increased eruption probability. The rate of change of this temperature peak is less than the previous peaks and was likely a controlling factor.
For this period the BN forecast was more dynamic than the VMG elicitations which remained steady throughout, with only a minor decline after a VMG elicitation in December 2018. According to the BN, the volcano remained strongly in the hydrothermal seal state throughout this period; however more magmatic influence is inferred in the October to November 2018 heating cycle. Throughout this time-period of elevated eruption probability, the VMG elicited values remained largely constant at close to background values, with only small changes occurring at the 13-weeks elicitation intervals. The VMG did not consider the short-term temperature cycles, or other monitored parameters unusual enough to require raising the alert level to VAL2 and hence their elicited probability values stayed low reflecting the 13-weeks elicitation cycle at VAL1. This period is a good example of the network being more reactive to data and could be used to prompt re-evaluation of the alert level or re-elicitation of the eruption probability from the VMG.
From December 2020 to February 2021 a heating cycle coincided with the highest CO2 flux (3,067 t/d) recorded since measurements began in 2003 (Figure 11). SO2 and H2S gas emissions were also at high levels and emissions were accompanied by pulsatory tremor to medium levels. Some volcanic earthquakes up to ML 2.2 were recorded in the inner earthquake region in late December 2020. The volcanological interpretation was that the vent was in open conditions allowing unrestricted gas and heat flux. The combination of high gas values, high lake temperature and elevated tremor with discrete volcanic earthquakes prompted the Volcanic Alert Level to be raised to 2 and the aviation colour code to yellow (https://www.geonet.org.nz/vabs/2eRQvDWg31q0luE4H2McoY). The VAL returned to level 1 on 11 January 2021 when the tremor returned to low levels and the lake had begun to cool.
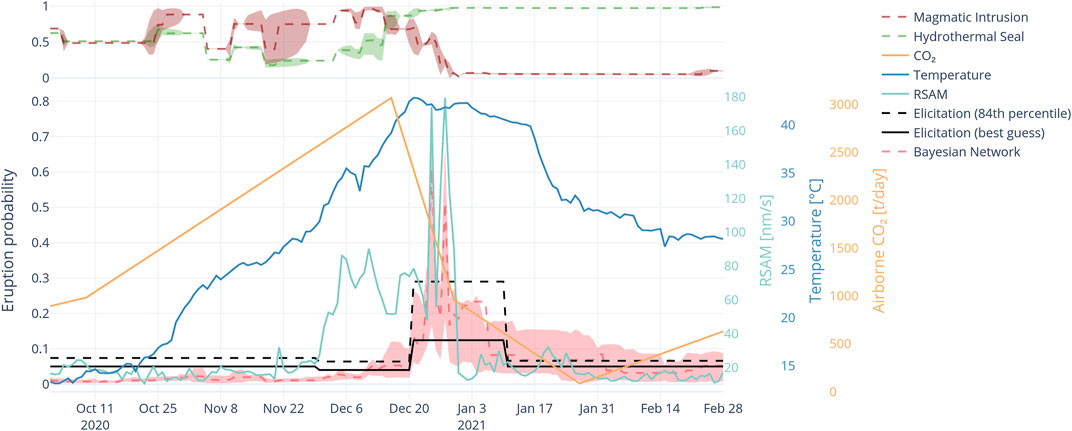
FIGURE 11. BN forecast timeseries from October 2020 to February 2021 covering period of high airborne CO2 measurement and high lake temperatures. Pink shading indicates 90% confidence interval around the mean (red dashed line). Corresponding best guess and 84th percentile values from expert elicitation shown in black curves. Lake temperature, RSAM and CO2 flux are shown by blue, green and orange curves respectively. The top panel indicates the values of the magmatic intrusion (red dashed line) and hydrothermal seal (green dashed line) with shading the 90% confidence interval.
The BN forecast did not respond to the high CO2 value or initial temperature rise until the temperature peaked on 21 December. At this point the increase in BN forecast to around 0.12 was coincidental with the VMG elicitation value of 0.3 (84th percentile value), because of fortuitous timing of the elicitation. The 84th percentile of the VMG elicitation probability and the maximum BN forecast values (red shading in Figure 11) are in good agreement. The BN forecast values remained elevated until early January 2021 before they dropped to background. The VMG elicitation probability returned to background on 11 January approximately 5 days after the BN forecast. Spikes in the BN forecast during its elevated period are caused by tremor spikes and the BN forecast reacts to them immediately, illustrating its ability to rapidly adapt to changing input data.
During this period the hidden nodes of the BN entered the magmatic intrusion state during the heating phasing of the cycle and switched to hydrothermal seal once the heating phase peaked. Again, detection of the magmatic intrusion state occurred approximately 1 month in advance of the increase in the BN eruption probability reflecting both rising temperature and increasing CO2 flux.
Figure 12 shows the network sensitivity over several days for the time periods of the three case studies. Sensitivity reflects how changes in a parameter’s CPT result in changes to the eruption probability given the current evidence. For nodes with high sensitivity, changes in the evidence, for example the ‘Lake SO4’ value going from ‘Unchanged’ to ‘Increasing’, tend to also cause strong changes in the probability of an eruption. In that sense it expresses the potential of changing the probability of an eruption with a change of state rather than the absolute contribution of that parameter to the current probability of eruption. For nodes with high sensitivity, changes in the state boundaries, have a strong influence on eruption probability. Although sensitivity also depends on the evidence Figure 12 shows that under most circumstances nodes in Set B have the highest sensitivity and will, therefore, contribute most of the uncertainty shown in Figures 8–11. Figures 9–11 also show that eruption probability is strongly influenced by the state of ‘Current tremor’ or RSAM. This is a combined effect of this nodes’ high sensitivity and it having very small values in its CPT. The latter is less a reflection of our experts’ opinion on the importance of ‘High’ tremor values than on what constitutes ‘Low’, ‘Medium’, and ‘High’ tremor. Hence, the way we discretize our continuous datasets can have a significant influence on the eruption probability which we quantify through the uncertainty analysis (Section 4.4).
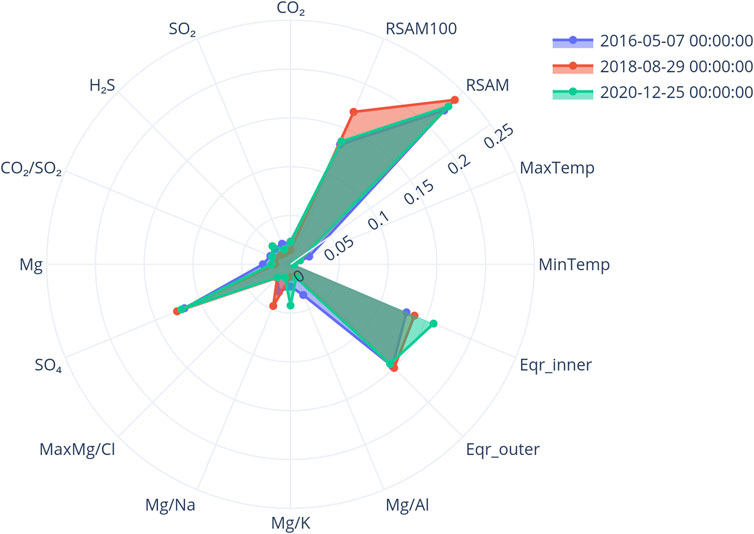
FIGURE 12. Normalised parameter sensitivity plots for 3 dates from each time interval discussed.
The graphical component of the BN visually represents the input variables and helps users to gain a clear understanding of the modelled system while robust statistics describe the joint probability distribution of all variables. One advantage of BNs is the process of inference, i. e the updating of the joint probability distribution given new data or additional observations. This bidirectionality of BNs is a large advantage over event trees, which assume a one-way non-reversable process. Inference can be used to analyse the dependencies of variables and thus assist in gaining a better understanding of the modelled system.
In our application to Mt Ruapehu, the BN modelling approach provided a flexible framework to accommodate data and information from different sources. We aligned the model structure to the VMG’s conceptual understanding of the volcano processes. The long observation records of eruption, crater lake temperature and chemistry allowed for data learning of those nodes (Set A) and ensured that the probability of eruption is well constrained by the historical record. For some of the other nodes with a shorter observation record (Set B), it was straightforward to populate the CPTs by a mixed method, i.e. data analysis for the condition of no eruption occurring and expert elicitation for the condition of eruption occurring. The final set of nodes (Set C) was elicited by experts. It is a strength of BNs to handle missing data, which allowed us to use the whole record length for every dataset. A logical next step is to integrate other sources of information on upcoming eruptions, e.g. models of seismic precursors to eruptions (Dempsey et al., 2020) or physical models of volcanic processes (Poland and Anderson, 2020).
BN modelling software tools (the SMILE reasoning engine for graphical probabilistic models) made it easy to learn from data, integrate the most recent monitoring data, automatically update forecast probabilities, and make results available to the VMG. In addition, we used BayesFusion’s web interface BayesBox to provide each expert with their individual and the final model results. This is an online webtool where users can set evidence and explore the model.
The BN forecast responded faster to changes in monitoring data than the expert elicitation. It detected signs of unrest earlier and promptly recognised when the unrest period had ended. This was partly due to the BN updating daily (compared to 4 or 13 weeks for VMG elicitation) but could also be due to the members of the VMG being more conservative in changing their forecast probabilities. There is a well-known bias in expert elicitation, called anchoring (Tversky and Kahneman, 1974). Anchoring occurs when the assessment of a numerical value is based on an initial estimate (i.e., the long-term eruption probability) and is not sufficiently adjusted to accommodate other information. Anchoring could also be responsible for the observation that VMG elicitation forecasts were significantly lower than the BN forecasts in some cases.
Expert elicitation required to parameterise the BN focussed on the relation between individual variables at one time rather than estimating the overall probability of eruption that is influenced by many variables. Therefore, individual assumptions can be more easily tested and explored within a model context. This will make the forecasts more defensible and robust and plays to the strengths of subject matter experts.
The BN forecast results could be interpreted because they tied back to the conceptual understanding of the volcano (in contrast to pure machine learning methods). Automatically updating and displaying figures such as the examples from the case studies (Figures 9–11) to discuss in regular monitoring meetings may help to advance the understanding of the relationships between variables and may lead to better understanding of the system and in turn improvements of the model.
A general limitation of BNs lies within modelling complex systems with a manageable number of parent nodes and states for each node. From a conceptual understanding it may be tempting to have Eruption as a child node of many other nodes (e.g., Christophersen et al., 2018), however, this would be very difficult to parameterise. We circumvented this challenge by the selection of our model structure to have only some variables as parent to Eruption and many others being child nodes. Defining the eruption node to have only two states, yes and no, also helped to keep the number of required CPT entries small.
The retrospective BN model forecasts agree well with the VMG elicitations. However, it is challenging to formally test the model due to the sparsity of data. This challenge is not unique to BN models and affects other short-term eruption forecasting methods (Whitehead and Bebbington, 2021) as well as other domains with limited data such as large earthquakes, e.g., Jordan et al. (2014) discuss the testability of earthquake forecasts in the context of Operational Earthquake Forecasting (OEF). They define OEF as “the dissemination of authoritative information about time-dependent probabilities to help communities prepare for potentially destructive earthquakes”. They recommend developing forecast models, validating them against the available data, making results available to users and helping them to formulate mitigation options. With the advances in probabilistic eruption forecasting volcanology may adapt similar approaches.
The BN forecast would have been very challenging to constrain without the long record of eruptions (Scott, 2013). However, there is a place for BN modelling even with little data. Aspinall and Woo (2014) demonstrate that BNs are valuable to track various variables to assess the probability of eruption with limited data and under time pressure.
We were in a fortunate position to work within a team of varied expertise and strengths to get around most challenges and limitations and achieve satisfactory results. We also had access to well-maintained and functional software that requires licensing for government and commercial use. We would like to encourage others in less advantageous positions to try BNs as probabilistic modelling framework for forecasting volcanic eruptions and their hazards and report on their experiences so that all volcano observatories can benefit from the learnings. There are freely available BN modelling tools and some example BNs published to get started (e.g., Aspinall et al., 2003; Aspinall and Woo, 2014; Hincks et al., 2014; Christophersen et al., 2018).
Probabilities of eruption forecasts may be of limited use to other besides technical stakeholders. The method described here to develop a BN for decision-making can be applied to work with any stakeholder to identify the question that would be most beneficial for them to answer for making good and well-informed decisions.
We have described a method to build Bayesian Network (BN) models to support decision-making and applied it to develop a BN model to forecast volcanic eruption at Mt Ruapehu, Aotearoa, New Zealand. The BN model is now implemented as a software tool to automatically calculate daily forecast updates. Our BN provides a probabilistic model framework to forecast volcanic eruptions that incorporates expert understanding of the volcanic systems, learning from the ever-increasing volcano monitoring data and allows for expert elicitation when data are not available.
Going forward, we plan to apply the same method to other volcanoes and to extend the question to address other volcanic hazards and their impacts. We also plan methodological advances. In this study we treated successive datapoints as independent, effectively ignoring the sequential nature of our data. A more natural way to model the joint probability of our datasets would be to include time-dependence which leads to Dynamic Bayesian Networks (e.g., Murphy, 2002b).
The development of open-source modelling software and guidelines on how to tailor a forecasting model to a different volcano would be beneficial to other volcano observatories, especially smaller ones.
Our application was targeted to the needs of the GNS Science Volcano Monitoring Group. Before providing quantitative information on the likelihood and impact of volcanic hazards more widely, more work is required to understand the need of various stakeholders so that the information and its communication can be well targeted. For example, it is important to balance the tolerance for risk with the possibility of false alarms, in case stakeholders turn forecasts into alerts that are linked to certain action and procedures.
Publicly available datasets were analyzed in this study. This data can be found here: earthquake catalogue: https://wfs.geonet.org.nz seismic waveform data: https://www.geonet.org.nz/data/tools/FDSN geochemistry and crater lake temperature data: https://www.geonet.org.nz/data/tools/FITS eruption catalogue: https://github.com/GeoNet/data/tree/main/historic-volcanic-activity.
CM and YB conceived the project. AC devised the method. YB wrote the python code and set up the BN model in Bayesbox. All authors interacted with the GNS Science Volcano Monitoring Group for consultation, monitoring and review. CM and YB contributed to the expert elicitation of the required BN parameters. All the authors contributed to evaluation of the modelling, discussion of the results and the writing of the paper.
This work has been undertaken within the GNS Science Hazard and Risk Management Programme and the Data Science Programme funded through the Strategic Science Investment Fund by the New Zealand’s Ministry of Business, Innovation & Employment.
The authors declare that the research was conducted in the absence of any commercial or financial relationships that could be construed as a potential conflict of interest.
All claims expressed in this article are solely those of the authors and do not necessarily represent those of their affiliated organizations, or those of the publisher, the editors and the reviewers. Any product that may be evaluated in this article, or claim that may be made by its manufacturer, is not guaranteed or endorsed by the publisher.
We thank the GNS Science Volcano Monitoring Group for their participation in the expert elicitation part of this study. We thank Bruce Christenson and Agnes Mazot for sharing their insights into the geochemical dynamics of Ruapehu. Rob Buxton provided valuable advice during initial discussions setting up the network. We acknowledge the New Zealand GeoNet project and its sponsors EQC, GNS Science, LINZ, NEMA and MBIE for providing the data used in this study.
Ardid, A., Dempsey, D., Caudron, C., and Cronin, S. (2022). Seismic Precursors to the Whakaari 2019 Phreatic Eruption Are Transferable to Other Eruptions and Volcanoes. Nat. Commun. 13 (1), 2002. doi:10.1038/s41467-022-29681-y
Aspinall, W. (2010). A Route to More Tractable Expert Advice. Nature 463 (7279), 294–295. doi:10.1038/463294a
Aspinall, W. P., and Woo, G. (2014). Santorini Unrest 2011–2012: An Immediate Bayesian Belief Network Analysis of Eruption Scenario Probabilities for Urgent Decision Support under Uncertainty. J. Appl. Volcanol. 3 (1), 1–12. doi:10.1186/s13617-014-0012-8
Aspinall, W. P., Woo, G., Voight, B., and Baxter, P. J. (2003). Evidence-Based Volcanology: Application to Eruption Crises. J. Volcanol. Geotherm. Res. 128 (1-3), 273–285. doi:10.1016/s0377-0273(03)00260-9
Bayes, M., and Price, M. (1763). LII. An Essay towards Solving a Problem in the Doctrine of Chances. By the Late Rev. Mr. Bayes, F. R. S. Communicated by Mr. Price, in a Letter to John Canton, A. M. F. R. S. Phil. Trans. R. Soc. 53, 370–418. doi:10.1098/rstl.1763.0053
Beg, M., Taka, J., Kluyver, T., Konovalov, A., Ragan-Kelley, M., Thiéry, N. M., et al. (2021). Using Jupyter for Reproducible Scientific Workflows. Comput. Sci. Eng. 23 (2), 36–46. doi:10.1109/MCSE.2021.3052101
Burgman, M., Layman, H., and French, S. (2021). Eliciting Model Structures for Multivariate Probabilistic Risk Analysis. Front. Appl. Math. Statistics 7. doi:10.3389/fams.2021.668037
Burton, M., Hayer, C., Miller, C., and Christenson, B. (2021). Insights into the 9 December 2019 Eruption of Whakaari/White Island From Analysis of TROPOMI SO 2 Imagery. Sci. Adv. 7 (25), 1–12. doi:10.1126/sciadv.abg1218
Cannavò, F., Cannata, A., Cassisi, C., Di Grazia, G., Montalto, P., Prestifilippo, M., et al. (2017). A Multivariate Probabilistic Graphical Model for Real-Time Volcano Monitoring on Mount Etna. J. Geophys. Res. Solid Earth 122, 3480–3496. doi:10.1002/2016JB013512
Chouet, B. A., and Matoza, R. S. (2013). A Multi-Decadal View of Seismic Methods for Detecting Precursors of Magma Movement and Eruption. J. Volcanol. Geotherm. Res. 252, 108–175. doi:10.1016/j.jvolgeores.2012.11.013
Christenson, B. W., Reyes, A. G., Young, R., Moebis, A., Sherburn, S., Cole-Baker, J., et al. (2010). Cyclic Processes and Factors Leading to Phreatic Eruption Events: Insights From the 25 September 2007 Eruption Through Ruapehu Crater Lake, New Zealand. J. Volcanol. Geotherm. Res. 191 (1-2), 15–32. doi:10.1016/j.jvolgeores.2010.01.008
Christenson, B. W., Werner, C. A., Reyes, A. G., Sherburn, S., Scott, B. J., Miller, C., et al. (2007). Hazards from Hydrothermally Sealed Volcanic Conduits. Eos. doi:10.1029/2007eo050002
Christophersen, A., Deligne, N. I., Hanea, A. M., Chardot, L., Fournier, N., and Aspinall, W. P. (2018). Bayesian Network Modeling and Expert Elicitation for Probabilistic Eruption Forecasting: Pilot Study for Whakaari/White Island, New Zealand. Front. Earth Sci. 6, 23. doi:10.3389/feart.2018.00211
Colson, A. R., and Cooke, R. M. (2017). Cross Validation for the Classical Model of Structured Expert Judgment. Reliab. Eng. Syst. Saf. 163 (Suppl. C), 109–120. doi:10.1016/j.ress.2017.02.003
Conway, C. E., Leonard, G. S., Townsend, D. B., Calvert, A. T., Wilson, C. J. N., Gamble, J. A., et al. (2016). A High-Resolution 40Ar/39Ar Lava Chronology and Edifice Construction History for Ruapehu Volcano, New Zealand. J. Volcanol. Geotherm. Res. 327, 152–179. doi:10.1016/j.jvolgeores.2016.07.006
Cooke, R. M., and Goossens, L. L. H. J. (2008). TU Delft Expert Judgment Data Base. Reliab. Eng. Syst. Saf. 93 (5), 657–674. doi:10.1016/j.ress.2007.03.005
Deligne, N. I., Jolly, G. E., Taig, T., and Webb, T. H. (2018). Evaluating Life-Safety Risk for Fieldwork on Active Volcanoes: the Volcano Life Risk Estimator (VoLREst), a Volcano Observatory's Decision-Support Tool. J. Appl. Volcanol. 7 (1), 7. doi:10.1186/s13617-018-0076-y
Dempsey, D. E., Cronin, S. J., Mei, S., and Kempa-Liehr, A. W. (2020). Automatic Precursor Recognition and Real-Time Forecasting of Sudden Explosive Volcanic Eruptions at Whakaari, New Zealand. Nat. Commun. 11 (1), 3562. doi:10.1038/s41467-020-17375-2
Do, C. B., and Batzoglou, S. (2008). What Is the Expectation Maximization Algorithm? Nat. Biotechnol. 26 (8), 897–899. doi:10.1038/nbt1406
Fenton, N., and Neil, M. (2013). Risk Assessment and Decision Analysis with Bayesian Networks. Boca Raton FL USA: CRC Press.
Gerstenberger, M. C., and Christophersen, A. (2016). A Bayesian Network and Structured Expert Elicitation for Otway Stage 2C: Detection of Injected CO 2 in a Saline Aquifer. Int. J. Greenh. Gas Control 51, 317–329. doi:10.1016/j.ijggc.2016.05.011
Gerstenberger, M. C., Christophersen, A., Buxton, R., and Nicol, A. (2015). Bi-directional Risk Assessment in Carbon Capture and Storage with Bayesian Networks. Int. J. Greenh. Gas Control 35, 150–159. doi:10.1016/j.ijggc.2015.01.010
Girona, T., Huber, C., and Caudron, C. (2018). Sensitivity to Lunar Cycles Prior to the 2007 Eruption of Ruapehu Volcano. Sci. Rep. 8 (1), 1476. doi:10.1038/s41598-018-19307-z
Hanea, A. M., Hemming, V., and Nane, G. F. (2022). Uncertainty Quantification with Experts: Present Status and Research Needs. Risk Anal. 42 (2), 254–263. doi:10.1111/risa.13718
Hanea, A. M., Kurowicka, D., and Cooke, R. M. (2006). Hybrid Method for Quantifying and Analyzing Bayesian Belief Nets. Qual. Reliab. Engng. Int. 22 (6), 709–729. doi:10.1002/qre.808
Hanea, A. M., McBride, M. F., Burgman, M. A., and Wintle, B. C. (2016). Classical Meets Modern in the IDEA Protocol for Structured Expert Judgement. J. Risk Res. 21, 417–433. doi:10.1080/13669877.2016.1215346
Hanea, A., Morales Napoles, O., and Ababei, D. (2015). Non-Parametric Bayesian Networks: Improving Theory and Reviewing Applications. Reliab. Eng. Syst. Saf. 144, 265–284. doi:10.1016/j.ress.2015.07.027
Hincks, T. K., Komorowski, J. C., Sparks, S. R., and Aspinall, W. P. (2014). Retrospective Analysis of Uncertain Eruption Precursors at La Soufrière Volcano, Guadeloupe, 1975–77: Volcanic Hazard Assessment Using a Bayesian Belief Network Approach. J. Appl. Volcanol. 3 (1), 1–26. doi:10.1186/2191-5040-3-3
Hong, Y. (2013). On Computing the Distribution Function for the Poisson Binomial Distribution. Comput. Statistics Data Analysis 59, 41–51. doi:10.1016/j.csda.2012.10.006
Hurst, A. W., and McGinty, P. J. (1999). Earthquake Swarms to the West of Mt Ruapehu Preceding its 1995 Eruption. J. Volcanol. Geotherm. Res. 90 (1–2), 19–28. doi:10.1016/s0377-0273(99)00019-0
Hurst, T., Kilgour, G., and Hamling, I. (2018). Magmatic Triggering of Earthquakes on Distal Faults as a Potential Medium‐Term Warning Signal from Ruapehu Volcano. Geophys. Res. Lett. 45 (23), 12776–12783. doi:10.1029/2018GL080677
Ingham, M. R., Bibby, H. M., Heise, W., Jones, K. A., Cairns, P., Dravitzki, S., et al. (2009). A Magnetotelluric Study of Mount Ruapehu Volcano, New Zealand. Geophys. J. Int. 179 (2), 887–904. doi:10.1111/j.1365-246X.2009.04317.x
International Organization for Standardization [ISO] (2018). Risk Management — Guidelines. Geneva, Switzerland: International Organization for Standardization. (ISO 31000:2018).
Jolly, A. D., Jousset, P., Lyons, J. J., Carniel, R., Fournier, N., Fry, B., et al. (2014). Seismo-acoustic Evidence for an Avalanche Driven Phreatic Eruption through a Beheaded Hydrothermal System: An Example From the 2012 Tongariro Eruption. J. Volcanol. Geotherm. Res. 286, 331–347. doi:10.1016/j.jvolgeores.2014.04.007
Jordan, T. H., Marzocchi, W., Michael, A. J., and Gerstenberger, M. C. (2014). Operational Earthquake Forecasting Can Enhance Earthquake Preparedness. Seismol. Res. Lett. 85 (5), 955–959. doi:10.1785/0220140143
Kereszturi, G., Schaefer, L., Mead, S., Miller, C., Procter, J., and Kennedy, B. (2021). Synthesis of Hydrothermal Alteration, Rock Mechanics and Geophysical Mapping to Constrain Failure and Debris Avalanche Hazards at Mt. Ruapehu (New Zealand). N. Z. J. Geol. Geophys. 64 (2-3), 1–22. doi:10.1080/00288306.2021.1885048
Kereszturi, G., Schaefer, L. N., Miller, C. A., and Mead, S. (2020). Hydrothermal Alteration on Composite Volcanoes -Mineralogy, Hyperspectral Imaging and Aeromagnetic Study of Mt Ruapehu. New Zealand, 1–28. doi:10.1002/ESSOAR.10503500.1
Kilgour, G., Kennedy, B., Scott, B., Christenson, B., Jolly, A., Asher, C., et al. (2021). Whakaari/White Island: a Review of New Zealand's Most Active Volcano. N. Z. J. Geol. Geophys. 64 (2-3), 273–295. doi:10.1080/00288306.2021.1918186
Kilgour, G. N., Saunders, K. E., Blundy, J. D., Cashman, K. V., Scott, B. J., and Miller, C. A. (2014). Timescales of Magmatic Processes at Ruapehu Volcano from Diffusion Chronometry and Their Comparison to Monitoring Data. J. Volcanol. Geotherm. Res. 288, 62–75. doi:10.1016/j.jvolgeores.2014.09.010
Kilgour, G., V. Manville, V., Pasqua, F. D., A. Graettinger, A., Hodgson, K. A., and Jolly, G. E. (2010). The 25 September 2007 Eruption of Mount Ruapehu, New Zealand: Directed Ballistics, Surtseyan Jets, and Ice-Slurry Lahars. J. Volcanol. Geotherm. Res. 191 (1–2), 1–14. doi:10.1016/j.jvolgeores.2009.10.015
Korb, K. B., and Nicholson, A. E. (2010). Bayesian Artificial Intelligence. Second Edition. Boca Raton, FL: CRC Press.
Leonard, G. S., Cole, R. P., Christenson, B. W., Conway, C. E., Cronin, S. J., Gamble, J. A., et al. (2021). Ruapehu and Tongariro Stratovolcanoes: A Review of Current Understanding. N. Z. J. Geol. Geophys. 0 (0), 1–32. doi:10.1080/00288306.2021.1909080
Leonard, G. S., Johnston, D. M., Paton, D., Christianson, A., Becker, J., and Keys, H. (2008). Developing Effective Warning Systems: Ongoing Research at Ruapehu Volcano, New Zealand. J. Volcanol. Geotherm. Res. 172 (3-4), 199–215. doi:10.1016/j.jvolgeores.2007.12.008
Lindsay, J., Marzocchi, W., Jolly, G., Constantinescu, R., Selva, J., and Sandri, L. (2010). Towards Real-Time Eruption Forecasting in the Auckland Volcanic Field: Application of BET_EF during the New Zealand National Disaster Exercise 'Ruaumoko'. Bull. Volcanol. 72 (2), 185–204. doi:10.1007/s00445-009-0311-9
Lowenstern, J. (2001). Carbon Dioxide in Magmas and Implications for Hydrothermal Systems. Miner. Deposita 36 (6), 490–502. doi:10.1007/s001260100185
Manville, V., and Cronin, S. J. (2007). Breakout Lahar from New Zealand's Crater Lake. Eos Trans. AGU 88 (43), 441. doi:10.1029/2007EO430001
Marzocchi, W., Sandri, L., and Selva, J. (2008). BET_EF: a Probabilistic Tool for Long- and Short-Term Eruption Forecasting. Bull. Volcanol. 70 (5), 623–632. doi:10.1007/s00445-007-0157-y
Miller, C. A., and Jolly, A. D. (2014). A Model for Developing Best Practice Volcano Monitoring: a Combined Threat Assessment, Consultation and Network Effectiveness Approach. Nat. Hazards 71 (1), 493–522. doi:10.1007/s11069-013-0928-z
Miller, C. A., Schaefer, L. N., Kereszturi, G., and Fournier, D. (2020). Three‐Dimensional Mapping of Mt. Ruapehu Volcano, New Zealand, from Aeromagnetic Data Inversion and Hyperspectral Imaging. J. Geophys. Res. Solid Earth 125, 1–24. doi:10.1029/2019JB018247
Murphy, K. P. (2002a). Dynamic Bayesian Networks: Representation, Inference And Learning PhD. Berkeley: University of California.
New Zealand Ministry of Civil Defence and Emergency Management (2015). “Volcanic Unrest or Eruption,” in The Guide to the National Civil Defence Emergency Management Plan 2015 (Wellington (NZ): New Zealand Department of the Prime Minister and Cabinet).
Newhall, C., and Hoblitt, R. (2002). Constructing Event Trees for Volcanic Crises. Bull. Volcanol. 64 (1), 3–20. doi:10.1007/s004450100173
Nyberg, E. P., Nicholson, A. E., Korb, K. B., Wybrow, M., Zukerman, I., Mascaro, S., et al. (2021). BARD: A Structured Technique for Group Elicitation of Bayesian Networks to Support Analytic Reasoning. Risk Anal. doi:10.1111/risa.13759
Pallister, J., Papale, P., Eichelberger, J., Newhall, C., Mandeville, C., Nakada, S., et al. (2019). Volcano Observatory Best Practices (VOBP) Workshops - a Summary of Findings and Best-Practice Recommendations. J. Appl. Volcanol. 8 (1), 2. doi:10.1186/s13617-019-0082-8
Pearl, J. (1986). Fusion, Propagation, and Structuring in Belief Networks. Artif. Intell. 29 (3), 241–288. doi:10.1016/0004-3702(86)90072-X
Pearl, J. (1988). Probabilistic Reasoning in Intelligent Systems: Networks of Plausible Inference. San Francisco, CA: Morgan Kaufmann Publishers.
Plotly Technologies Inc (2015). Collaborative Data Science. Montréal, QC: Plotly Technologies Inc. Availableat: https://plot.ly.
Poland, M. P., and Anderson, K. R. (2020). Partly Cloudy with a Chance of Lava Flows: Forecasting Volcanic Eruptions in the Twenty‐First Century. J. Geophys. Res. Solid Earth 125 (1), e2018JB016974. doi:10.1029/2018JB016974
Potter, S. H., Jolly, G. E., Neall, V. E., Johnston, D. M., and Scott, B. J. (2014). Communicating the Status of Volcanic Activity: Revising New Zealand's Volcanic Alert Level System. J. Appl. Volcanol. 3 (1). doi:10.1186/s13617-014-0013-7
Pourret, O., Naïm, P., and Marcot, B. (2008). Bayesian Networks: A Practical Guide to Applications. Wiley.
Price, R. C., Gamble, J. A., Smith, I. E. M., Maas, R., Waight, T., Stewart, R. B., et al. (2012). The Anatomy of an Andesite Volcano: A Time-Stratigraphic Study of Andesite Petrogenesis and Crustal Evolution at Ruapehu Volcano, New Zealand. J. Petrology 53 (10), 2139–2189. doi:10.1093/petrology/egs050
Ratnapinda, P., and Druzdzel, M. J. (2015). Learning Discrete Bayesian Network Parameters from Continuous Data Streams: What Is the Best Strategy? J. Appl. Log. 13 (42), 628–642. doi:10.1016/j.jal.2015.03.007
Scott, B. J. (2013). A Revised Catalogue of Ruapehu Volcano Eruptive Activity: 1830-2012. Taupo, New Zealand: GNS Science.
Shachter, R. D., and Kenley, C. R. (1989). Gaussian Influence Diagrams. Manag. Sci. 35 (5), 527–550. doi:10.1287/mnsc.35.5.527
Sheldrake, T. E., Aspinall, W. P., Odbert, H. M., Wadge, G., and Sparks, R. S. J. (2017). Understanding Causality and Uncertainty in Volcanic Observations: An Example of Forecasting Eruptive Activity on Soufrière Hills Volcano, Montserrat. J. Volcanol. Geotherm. Res. 341, 287–300. doi:10.1016/j.jvolgeores.2017.06.007
Strehlow, K., Sandri, L., Gottsmann, J. H., Kilgour, G., Rust, A. C., and Tonini, R. (2017). Phreatic Eruptions at Crater Lakes: Occurrence Statistics and Probabilistic Hazard Forecast. J. Appl. Volcanol. 6 (1), 4. doi:10.1186/s13617-016-0053-2
Tierz, P., Woodhouse, M. J., Phillips, J. C., Sandri, L., Selva, J., Marzocchi, W., et al. (2017). A Framework for Probabilistic Multi-Hazard Assessment of Rain-Triggered Lahars Using Bayesian Belief Networks. Front. Earth Sci. 5, 73. doi:10.3389/feart.2017.00073
Tversky, A., and Kahneman, D. (1974). Judgment Under Uncertainty: Heuristics and Biases. Science 185 (4157), 1124–1131. doi:10.1126/science.185.4157.1124
Weber, P., Medina-Oliva, G., Simon, C., and Iung, B. (2012). Overview on Bayesian Networks Applications for Dependability, Risk Analysis and Maintenance Areas. Eng. Appl. Artif. Intell. 25 (4), 671–682. doi:10.1016/j.engappai.2010.06.002
Whitehead, M. G., and Bebbington, M. S. (2021). Method Selection in Short-Term Eruption Forecasting. J. Volcanol. Geotherm. Res. 419, 107386. doi:10.1016/j.jvolgeores.2021.107386
Keywords: eruption forecasting, Bayesian Network (BN), expert elicitation, data learning, time series, Mt Ruapehu volcano
Citation: Christophersen A, Behr Y and Miller C (2022) Automated Eruption Forecasting at Frequently Active Volcanoes Using Bayesian Networks Learned From Monitoring Data and Expert Elicitation: Application to Mt Ruapehu, Aotearoa, New Zealand. Front. Earth Sci. 10:905965. doi: 10.3389/feart.2022.905965
Received: 28 March 2022; Accepted: 06 June 2022;
Published: 18 July 2022.
Edited by:
Heather Michelle Wright, United States Geological Survey (USGS), United StatesReviewed by:
Jeremy Pesicek, United States Geological Survey (USGS), United StatesCopyright © 2022 Christophersen, Behr and Miller. This is an open-access article distributed under the terms of the Creative Commons Attribution License (CC BY). The use, distribution or reproduction in other forums is permitted, provided the original author(s) and the copyright owner(s) are credited and that the original publication in this journal is cited, in accordance with accepted academic practice. No use, distribution or reproduction is permitted which does not comply with these terms.
*Correspondence: Annemarie Christophersen, QS5DaHJpc3RvcGhlcnNlbkBnbnMuY3JpLm56
†These authors have contributed equally to this work and share first authorship
Disclaimer: All claims expressed in this article are solely those of the authors and do not necessarily represent those of their affiliated organizations, or those of the publisher, the editors and the reviewers. Any product that may be evaluated in this article or claim that may be made by its manufacturer is not guaranteed or endorsed by the publisher.
Research integrity at Frontiers
Learn more about the work of our research integrity team to safeguard the quality of each article we publish.