 Linghua Duo
 Yanan Li2
95% of researchers rate our articles as excellent or good
Learn more about the work of our research integrity team to safeguard the quality of each article we publish.
Find out more
ORIGINAL RESEARCH article
Front. Earth Sci. , 10 May 2022
Sec. Environmental Informatics and Remote Sensing
Volume 10 - 2022 | https://doi.org/10.3389/feart.2022.902444
This article is part of the Research Topic Meta-Scenario Computation for Social-Geographical Sustainability View all 60 articles
With the rapid development of the economy and society in recent years, the ecological environment has deteriorated significantly. The governments at all levels, departments, and relevant scholars have begun to pay attention to urban ecological construction and research on urban disaster prevention and mitigation. The concept of resilience has gained widespread attention in this context. However, at present, urban ecological resilience research is still in its infancy, and there are many qualitative but few quantitative studies in terms of assessment methods. This study explores the complex dynamic evolution mechanism of urban ecosystem resilience based on the three resilience characteristics and selects Nanchang, an important ecological barrier in the middle and lower reaches of the Yangtze River and a model area for integrated management of the Great Lakes basin, as an assessment target. This study establishes a quantitative measurement and evaluation framework for urban ecological resilience in three dimensions (resistance, adaptation, and vitality) and conducts a comprehensive evaluation of urban ecosystem resilience. The results show that the trend of land-use change from 1990 to 2020 is mainly characterized by the continuous decrease in arable land and ecological land (forestland, grassland, and water) and the continuous increase in construction land, among which the land-use dynamic attitude of construction land is the largest, reaching 5.33% from 1990 to 2005. During the study period, the overall ecosystem resilience of Nanchang showed a gradual decline and was always at a moderate-to-low level, with a long-term distribution pattern of “low in the middle and high in the surrounding areas” and clear spatial heterogeneity. This study helps clarify the security status of the regional ecosystem and provides a reference for exploring the complex dynamic evolution mechanism of ecological resilience.
Natural ecosystems are not only the basis and conditions for human survival and development but also an important prerequisite for the sustainable development of human society. The stability of their structure and function is an effective guarantee for the development of human society (Ma et al., 2001). However, as urbanization continues and the number of people grows, human interference with natural ecosystems is intensifying and the burden on ecosystems is becoming heavier (Jin et al., 2018), resulting in more ecological problems such as global warming (He et al., 2022), heat island effect (Yang et al., 2019; He et al., 2021), and deterioration of human habitat. Cities are the most complex social and ecological systems, which are inevitably subject to various disturbances and intrusions from human activities, especially since the 20th century, when modern societies have become more densely populated, urban social environments and conflicts have become more complex, urban economic structures have become more diverse, the risks and unknown threats to urban development have further increased, and their possible malignant consequences have gradually become apparent (He et al., 2018). Therefore, to cope with shocks and threats, how to enhance the ability of cities to resist ecological risks has attracted the close attention of many countries and regions, and the construction of resilient cities has gradually become a major hot spot of academic research.
The historical changes in resilience have evolved considerably under the tireless research of scholars. The concept of resilience was first applied to ecology by the Canadian scholar Holling and referred to the ability of a system to resist risk, restore equilibrium, and adapt to new environments (Holling, 1996). Since then, experts and scholars in urban science research have referred to this concept and explored urban resilience to improve the buffering capacity and resistance of cities in the face of external threats with the help of resilience thinking. As an important aspect of urban resilience, the assessment of urban ecological resilience has also received attention from governments, departments, and relevant scholars at all levels (Chen W. X. et al., 2022). The New Urban Agenda adopted at the United Nations Conference on Housing and Sustainable Urban Development, launched in Ecuador in October 2016, included “urban ecological resilience” as the material for the eighth policy cluster and set the ecological goal of sustainable urban development as building “environmentally sustainable and resilient cities” (He, 2017). In China, on 3 November 2020, the “Proposal of the Central Committee of the Communist Party of China on Formulating the 14th Five-Year Plan for National Economic and Social Development and the Visionary Goals for 2035” was proposed to “promote a new-type urbanization with people-oriented.” We will strengthen historical and cultural protection, shape the urban landscape, strengthen urban renovation of old neighborhoods and community construction, enhance urban flood control and drainage capacity, and build sponge cities and resilient cities. We will improve the level of urban governance and strengthen the prevention and control of risks in the governance of megacities (Xia et al., 2022). These elaborated that the implementation of resilient cities has a key role in the sustainable development construction of China’s cities that should not be underestimated (Yang et al., 2021; Ren et al., 2022). The domestic attention to and international influence of resilient cities show that resilience is of considerable importance in promoting harmonious urban and ecological development (Yu et al., 2022; Xie et al., 2022).
The scientific research on ecological resilience has accumulated some rich experiences by domestic and foreign scholars. In 2001, the adaptive cycle theory was created, shifting the starting point of research from an ecological resilience perspective to evolutionary resilience and using this theory to define resilience (Ostrom, 2004). By reviewing the origins and expansion of the definition of resilience, Manyena (2006) elucidated the strong link between urban resilience and urban vulnerability and revealed the important role played by resilience theory when cities are subjected to shocks. Abdrabo and Hassaan (2015) constructed a comprehensive framework for urban resilience using four entry points: urban, peri-urban, urban networks, and adjacent rural areas. Suárez et al. (2016) creatively proposed an urban resilience index for the construction of a framework system to measure urban resilience, using 50 provincial capitals in Spain as the study area. Gimenez et al. (2017) explored the need for multiple interests to join in the construction of urban resilience and discussed how policy-makers could lead the process of building urban resilience (Gimenez et al., 2017). Bozza et al. (2017) argued that resilience evaluation models should be differentiated according to the different natural threats that ecosystems resist, based on which they developed a resilience evaluation framework with the ability to assess different ecological threats in the same city, starting from a time-series perspective (Bozza et al., 2017).
However, most of the current studies focus on the nature of resilience theory, development history, component units, basic categories, and other basic principles and the overall planning of resilient city construction, with more qualitative and fewer quantitative studies, making it difficult to make a deep and objective quantitative evaluation of urban resilience. This study focuses on the long time series resilience process and constructs a quantitative evaluation framework of ecological resilience from the three dimensions of “resistance-adaptation-vitality” to address the shortcomings of the current qualitative evaluation. A comprehensive evaluation of urban ecosystem resilience is conducted to understand the complex dynamic evolutionary mechanisms of ecological resilience, thus clarifying the state of regional ecosystem security.
This study takes Nanchang city as the study area, constructs a quantitative evaluation framework for urban ecological resilience from three aspects “resistance-adaptation-vitality,” and conducts a comprehensive assessment of ecosystem resilience in Nanchang city to investigate the impact of landscape pattern evolution on ecological resilience. Specifically, this study can achieve the following three objectives: 1) a framework for quantitative measurement and evaluation of urban ecological resilience is established; 2) trends and characteristics of ecological resilience are assessed from the perspective of three major characteristics of resilience; and 3) new ideas and measures to optimize the landscape pattern and improve ecological resilience in Nanchang city are obtained.
The main contributions of this study are as follows. Theoretically, the introduction of a quantitative description of the urban ecosystem resilience evaluation index system under the trend of rapid urbanization allows a multidimensional and comprehensive analysis of ecological resilience, providing a new approach and perspective for the diversification of ecological resilience assessment systems. Practically speaking, exploring the influence of landscape pattern evolution on ecological resilience helps people understand the complex mechanisms of ecological resilience changes, better optimizes landscape patterns, improves the current ecological environment, and provides references for the implementation of territorial spatial planning and ecological control strategies.
Nanchang is located in the middle and lower reaches of the Yangtze River, close to the first freshwater lake in China-Poyang Lake (Figure 1), rich in water resources, and connected to numerous rivers and lakes, with a forest coverage rate of 21.96%. The unique natural resource endowment makes Nanchang an important ecological barrier in the middle and lower reaches of the Yangtze River and a model area for comprehensive management of the Great Lakes basin (Ypa et al., 2020). However, what cannot be ignored is that, as the core city of the Poyang Lake city cluster, Nanchang city has experienced rapid population growth and construction land expansion in recent years, which has resulted in a series of urban ecological environment problems, such as water pollution, air pollution, and deterioration of the human living environment. If left unaddressed and uncorrected, these problems will not only adversely affect the quality of the urban habitat but also hinder socioeconomic progress, making it particularly important to quantify the resilience of Nanchang’s ecosystem.
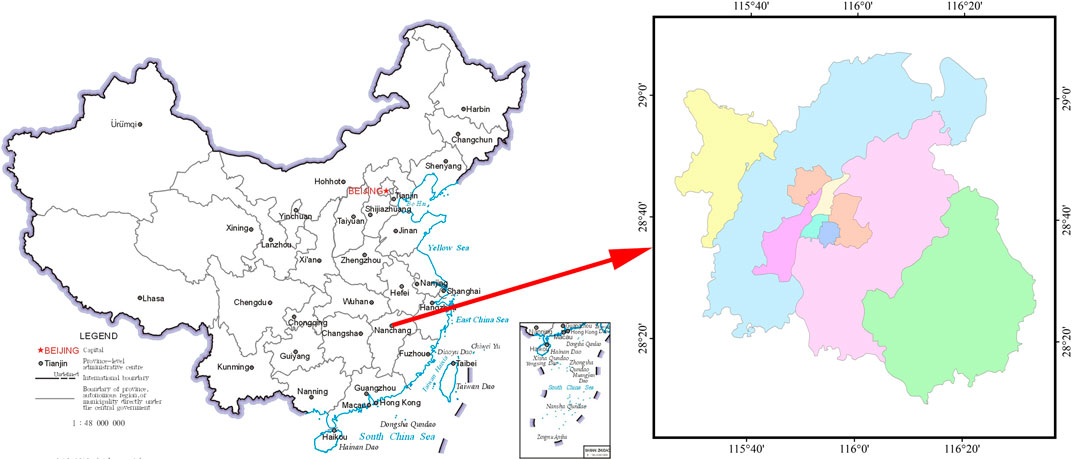
FIGURE 1. The study area.
The main data used in this study are remote sensing images of Nanchang in 1990, 2005, and 2020, digital elevation data of Nanchang (resolution 30 × 30 m), township vector data of Nanchang, population data, GDP data, road data, soil type, average annual temperature, annual precipitation, and other data. Among them, Landsat TM/ETM+ is selected for remote sensing images with a resolution of 30 m (Zhao et al., 2021), the time periods are 1990, 2005, and 2020, the months are July–August, the cloudiness is less than 10%, and the geographic coordinate system is WGS84. The specific description and main sources of the above data are shown in Table 1.
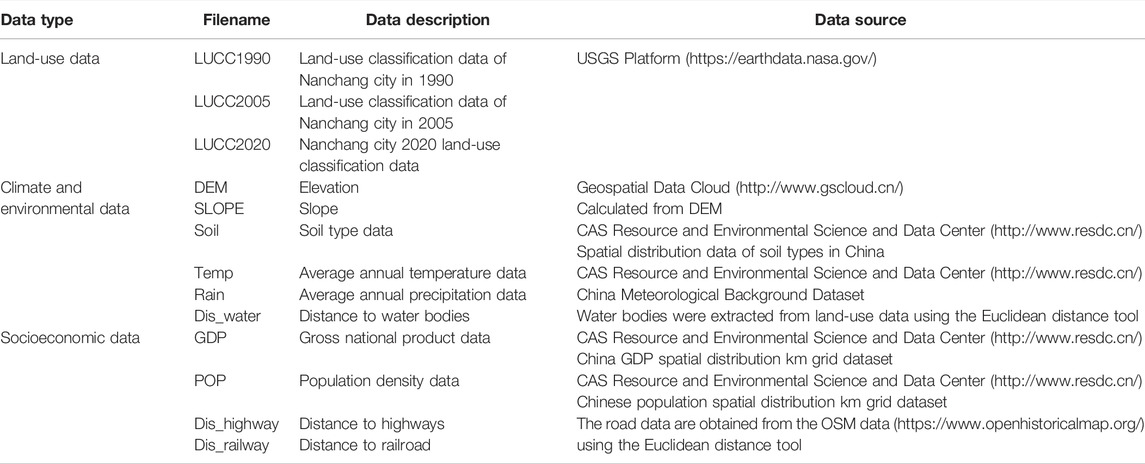
TABLE 1. Data description and source.
Firstly, the remote sensing image processing software ENVI was used to pre-process the image data of 1990, 2005, and 2020, including a series of operations such as radiation calibration, atmospheric correction, de-clouding, image stitching, and cropping. According to the actual situation of Nanchang city, the land-use types of Nanchang city were classified into the following six categories: arable land, forest land, grassland, water, construction land, and unused land concerning the classification standards in the Classification of Current Land Use (GB/T21010-2017), combined with the computer supervised classification method and manual visual interpretation. The specific operations are as follows: firstly, based on the field survey and reference to the land-use data of Nanchang city in known years, the interpretation samples of each land-use type are obtained using the supervised classification method; then, the classification template for interpretation is created according to the distribution characteristics and spectral characteristics of the interpretation samples, and when the accuracy of the classification template is higher than 85%, the accuracy is considered to meet the requirements and the template can be interpreted. After that, the supervised classification results are subjected to post-classification processing, including operations such as spot error correction and topology checking. Those that do not meet the requirements for supervised classification accuracy are modified and improved by manual visual interpretation. Finally, to evaluate the accuracy of the classification results, the high-definition historical images of Google Earth were used as a reference, and the sample points were selected to verify the results of supervised classification. In this study, the Kappa coefficient was used for quantitative evaluation, and the Kappa coefficients of 1990, 2005, and 2020 were calculated to be above 80%, according to the conclusion of Eike’s study (Eike and Andeas, 2008). The interpretation accuracy can meet the needs of this study and can be used as the base data for the follow-up study.
The concept of resilience has been defined in different fields, but at its core, it emphasizes the resistance, adaptation, and vitality of systems in the face of disturbances and uncertainties (Xia et al., 2022). The following three essential characteristics of resilience can be summarized (Peng et al., 2015): first, the ability of the system to self-organize in response to external changes (resistance); second, the ability of the system to establish and increase learning and self-adaptation (adaptation); and third, the ability of the system to restore normal order promptly after the basic structure of the system has been damaged (vitality). Compared with the early warning characteristics of risk (Zhang et al., 2011), resilience can be used for ex-ante assessment or retrospective analysis, so some risk prevention and control management in resilient cities can achieve “twice the result with half the effort” (Xiu et al., 2018). Therefore, this study constructs an urban ecological resilience assessment model from three aspects: resistance, adaptation, and vitality (Figure 2).
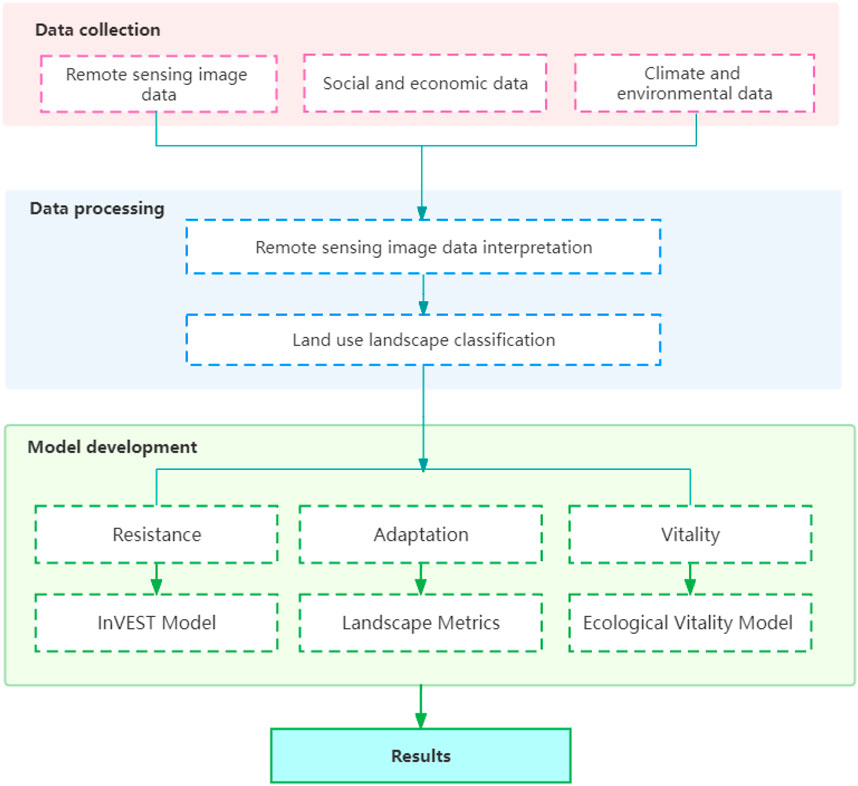
FIGURE 2. Framework diagram for resilience evaluation of urban ecosystems based on “resistance-adaptation-vitality.”
Resistance indicates the ability of urban ecosystems to resist external disturbances. Habitat quality is the ability of an ecosystem to provide the conditions required for the continued survival and reproduction of individual species, populations, communities, and humans (Gong et al., 2014). It can be used to characterize the good or bad ecological suitability of regional land class land-scape patches, and its numerical magnitude can reflect the resistance of each landscape patch to habitat degradation (Liu, 2014). Areas with high habitat quality are more stable on their own when subjected to external disturbances (i.e., threat factors) and therefore provide a better characterization of ecosystem resilience. Therefore, habitat quality can be used as a proxy for “resilience” to characterize the ability of urban ecosystems to resist external disturbances (Zhang, 2018).
Habitat quality is generally obtained through the InVEST model, the full name of which is the Integrated Valuation of Ecosystem Services and Trade-offs. The focus is on applying the sensitivity of stressors and the intensity of external threats for various land cover categories and considering habitat quality as a continuous variable to measure biodiversity based on the distance of influence of stressors, spatial weights, and other factors. The specific calculation procedure is as follows (Huang et al., 2020):
The main parameters needed to run the habitat quality model include the distance of threat factor effects and their weights, the suitability, and the sensitivity of the habitat to each threat factor. Combining with relevant studies (Gong et al., 2014; Chen et al., 2016), arable land, settlements, other construction lands, urban land, railroads, and roads, which have a greater impact on the ecological landscape, were selected and defined as ecological stressors, and assigning values to the suitability and sensitivity of each threat factor concerning previous studies (Chen et al., 2016; Zheng et al., 2018), as shown in Tables 2, 3.
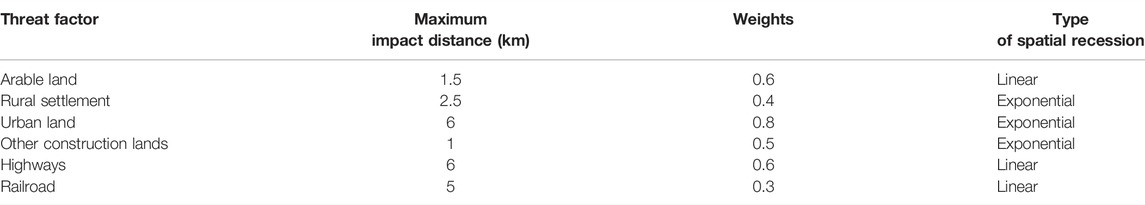
TABLE 2. The attribute of threat factor.
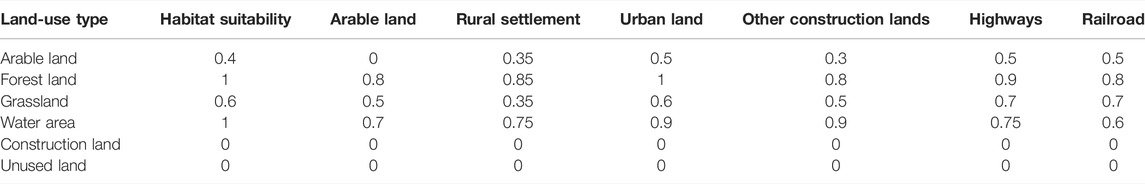
TABLE 3. Landscape types and their sensitivity to threats.
The more stable an ecosystem is, the more adaptable it is (Ren et al., 2000). Therefore, this study uses the indicators of the landscape pattern index related to the stability of ecosystem landscape structure to express its adaptation.
The landscape pattern index is a quantitative analysis index that summarizes and describes landscape pattern information, such as landscape patch shape, patch density, landscape fragmentation, landscape heterogeneity, and landscape connectivity. Generally, landscape connectivity and landscape spatial heterogeneity can describe landscape pattern changes in terms of aggregation, connectivity, fragmentation, distribution structure, and diversity of landscape patches, respectively, which provides a more comprehensive analysis of the dynamic changes of land-use change on landscape patterns and their functions (Xie and Li, 2008).
Landscape structural stability of ecosystems depends on landscape pattern indices related to spatial heterogeneity and landscape connectivity (Ou et al., 2014; Peng et al., 2015). Generally, landscape connectivity is characterized by the connectivity of the entire landscape and habitat (Turner, 2003), specifically quantified using landscape fragmentation (FN) (Yuan et al., 2019; Chen Y. et al., 2022). This study proposes to use the Shannon diversity index and area-weighted average patch fractal index to characterize the spatial heterogeneity of the landscape. In terms of weight setting, landscape heterogeneity and landscape connectivity describe two aspects of ecosystem landscape structure, respectively, and are not substitutable for each other, so their weights can be assumed to be equal (Peng et al., 2015), as shown in Table 4.

TABLE 4. Landscape pattern index, weight, and meaning.
Based on Table 4, the formula for ecosystem adaptation is as follows (Xia et al., 2022):
Ecosystem vitality emphasizes the ability and potential of an ecosystem to return to its original state after being harmed. This section portrays and evaluates the resistance and adaptation of landscape patches to external disturbances in ecosystem processes and provides an in-depth analysis of them in terms of spatial and temporal evolution patterns and spatial association patterns.
Ecosystem vitality is the ability of a system to gradually bounce back after the disappearance of a stressor, reflecting the resistance and adaptation of landscape patches to external disturbances during the ecosystem process. It is difficult to measure ecosystem vitality directly. Therefore, this study refers to the ecological vitality model and coefficients proposed according to Peng et al., where land-use types that are closer to natural ecosystems in terms of attributes are relatively easier to recover when subjected to external disturbances. The vitality coefficients (RC) of different land-use types are set according to their restoration difficulty (Table 5).

TABLE 5. Coefficient of vitality for different land-use types.
Based on the grid sampling method, the ecological vitality index was constructed by calculating the proportion of land area within each grid to describe the relative size of the integrated ecological resilience within a sample site. Thus, the land-use structure is transformed into ecological vitality values by sampling, and an ecosystem vitality model is constructed. The specific calculation formula is as follows:
The scale of each evaluation index in the indicator system varies, and even for the same scale, its actual quantity varies greatly. In order to eliminate the differences in scale and quantity among the evaluation indices, the variables should be normalized when constructing the ecosystem health evaluation system. In this study, the variables are first treated using the extreme value normalization method. The formula is as follows:
On this basis, the resilience index of the Nanchang ecosystem was calculated based on the framework of “resistance-vitality-adaptation” concerning previous research results. The calculation formula is as follows:
Resilience is the ecosystem resilience index. A is adaptability, P is resistance, and R is resilience.
Spatial autocorrelation is a statistical method used to reveal the spatially correlated characteristics of spatial reference units and neighboring units in terms of attribute feature values by describing whether there is a significantly correlated relationship between the attribute values of an element and its spatially adjacent attribute values of each element (Wu et al., 2015). The global and local coefficients of spatial autocorrelation can be used to determine the spatial correlation and the degree of correlation of the study variables. The global auto-correlation coefficient is mainly used to verify the spatial pattern of the whole study area and measure the distribution trend and clustering status of the attribute values over the geographical space. There are many indicators and methods to express the global spatial autocorrelation, mainly including Moran’s I, Geary’s C, and Getis, among which Moran’s I is the most commonly used. Local Moran’s I and Getis-Ord G indices are used to reflect the similarity or correlation between spatial geographical units and their neighboring spatial units’ attribute characteristics, mainly to identify “hot spots” and test the heterogeneity of the data.
The global autocorrelation Moran I index is used to examine the spatial correlation of the attribute values of a given element across the study area. The formula was calculated as follows (Liu and Wang, 2018):
1) Moran’s I Index
This index is used to portray the correlation between the attribute values of an element and the adjacent spatial units. The formula was calculated as follows (Feng et al., 2015):
Moran’s I between −1 and 1. When Moran’s I > 0, it indicates a positive correlation in the study area and that the attribute values of the study units exhibit convergent clustering. While when Moran’s I < 0, it represents a negative correlation, indicating a discrete distribution of the attribute values of the study unit. When Moran’s I = 0, then there is no spatial correlation.
2) Getis-Ord Gi Index
The Getis-Ord Gi index analyzes the information in a region to reveal the similarity or correlation between the spatial units and the attribute values of their neighboring spatial units to identify the spatial distribution of the “hot and cold spot areas” and test the heterogeneity of the data. The formula was calculated as follows (Anselin, 1995):
As can be seen from Figures 3, 4, the land-use types in the study area are mainly cropland, forest land, and water surface, which together account for about 90% of the total study area, with cropland accounting for relatively large and wide distribution in the region, accounting for about 55%. From 1995 to 2005, the evolution of the landscape pattern in the region is very obvious, where the most obvious growth is in construction land, showing a steady increase from 279.09 km2 in 1990 to 712.14 km2 in 2020, an increase of 155.17% in 30 years, with an area of 433.05 km2, indicating that with urbanization, population and economy all continuing to advance, the demand for expansion of construction land is increasing. The area of idle land is also gradually increasing, from 308.14 km2 initially in 1990 to 318.28 km2 in 2019. Arable land, forest land, grassland, and water area continue to decline from 1990 to 2020, with the largest decline in the area of arable land from 4,089.13 hm2 to 3,796.97 km2 in 2020. Forest land, grassland, and water area decreases from 1,212.94, 97.76, and 1,197.57 km2 in 1990 to 1,149.47, 75.34, and 1,132.44 km2 in 2020, decreasing by 0.88%, 0.31%, and 0.31% respectively. The proportion of total land use will decrease by 0.88%, 0.31%, and 0.91%, respectively.
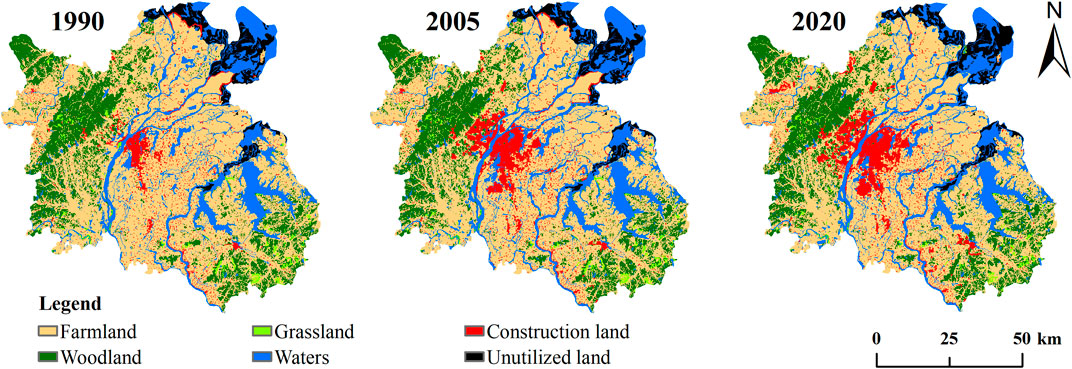
FIGURE 3. Spatial distribution of landscape types in Nanchang city in 1990, 2005, and 2020.
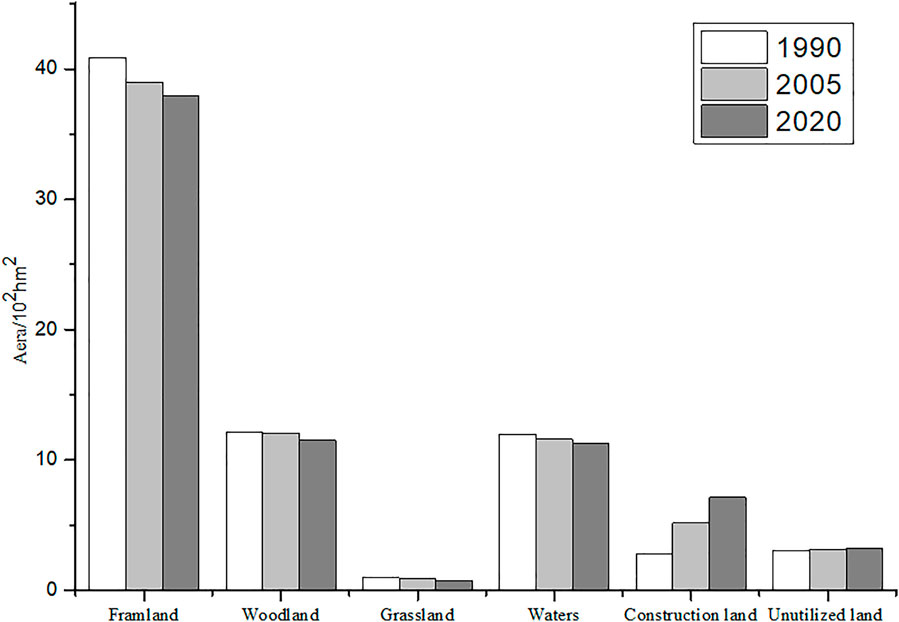
FIGURE 4. Land-use area of the first classes in 1995, 2005, and 2020.
Analyzing the reasons for the above changes, the land-use types that show an increasing trend are construction land and unused land, while the area of arable land, forest land, grassland, and water area decreases year by year. The increase in construction land is mainly concentrated in Honggutan, Donghu, Xihu, and Qingshanhu Districts on both sides of Ganjiang River in central Nanchang, mainly due to the accelerated industrialization and urbanization process and the sharp increase in population leading to the increase in construction land demand. The construction of Jiulonghu New Area proposed in 2010 and Ganjiang New Area proposed in 2016 has promoted the urbanization process more, and the urban development and expansion require a large amount of occupied arable land and ecological lands such as woodland and grassland, causing a continuous reduction in the area of arable land, woodland, and grassland. The main reason for the decrease in water area is that the water level of Poyang Lake decreases and the shoreline shrinks in recent years, which leads to the exposure of unused land such as marshland, so the unused land increases slightly. By analyzing and compiling the information on land-use change in the study area over 30 years, it is important to grasp the rule and direction of regional land-use change, which is of strategic significance for future land-use planning and ecological environmental protection of the study area.
In Table 6, the land-use transfer matrix of the study area shows that, from 1990 to 2005, cropland was the most transferred land use category in the study area, with a net transfer of 188.65 km2, mainly shifted to construction land (213.50 km2), and the expansion of urban construction land was the main reason for the transfer of cropland. The second-largest land-use category to be transferred out is water, with a net transfer of 26.89 km2. The majority of the decrease in water area comes from arable land (92.69 km2) and construction land (23.66 km2). The net transfer of forest land is 16.28 km2, with a net shift to arable land (59.32 km2) and construction land (22.88 km2), indicating that the phenomenon of deforestation still exists. The most obvious land-use category to expand is construction land, with an increase of 303.34 km2. The most obvious category of land expansion is construction land, with an increase of 303.34 km2, and 70.38% of the area transferred to construction land comes from arable land, reflecting that the expansion of construction land is mainly achieved by encroaching on arable land. The area of grassland and unused land fluctuates slightly.
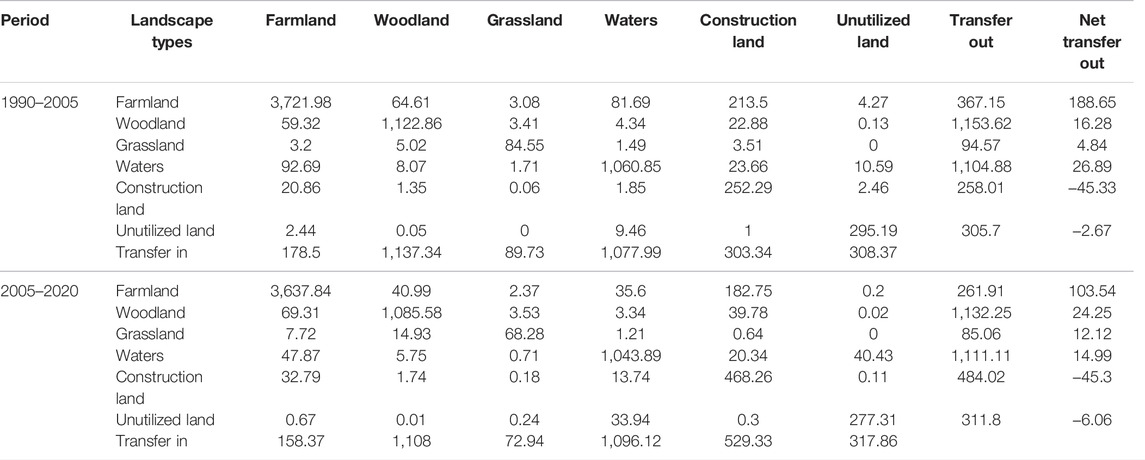
TABLE 6. Land-use transfer matrix of the study area.
From the land-use transfer matrix of the study area, it can be seen that, from 2005 to 2020, the largest area transferred out is still arable land, with a net transfer out of 103.54 km2 and a net reduction of 85.11 km2 compared to 1990–2005, mostly to construction land (182.75 km2), followed by forest land (40.99 km2) and water (35.60 km2). The reduction in water area also tends to be smaller, with a total reduction of 14.99 km2 and a reduction of 11.90 km2 compared with the previous period, mainly shifting to arable land (47.87 km2) and unused land (40.43 km2). The area of grassland slightly decreases. The water area changes significantly; compared with the previous period, the shrinkage of the water surface of Poyang Lake is the primary reason, which never makes the area transferred out to unused land increase. The construction land continues to expand, the net transfer is 45.30 km2, the growth rate is basically the same as the previous period, and the primary source of construction land is still arable land. The net transfer of unused land was 6.06 km2, an increase of 3.39 km2 from the previous period, and there was a significant mutual transfer between waters.
The quantification and spatial representation of evaluation objects can improve the accuracy and visualization of evaluation and facilitate the analysis of their spatial and temporal distribution characteristics. Among them, the division of evaluation units is the basic work to realize spatial representation. Commonly used methods include 1) dividing risk units by administrative boundaries, used in areas with a large degree of human interference; 2) dividing risk units by topography and geomorphology, watersheds, and other natural geographical boundaries, determining the division of evaluation units within a relatively complete ecological region, and the ecosystems and landscape structures within the evaluation units have a high degree of homogeneity; and 3) grid method, dividing the study area into grids of equal size according to certain granularity and using the grids as evaluation units to analyze their spatial and temporal distribution characteristics. This method is convenient for spatial interpolation to obtain a continuous spatial distribution map, so it is more commonly used at present (Gong et al., 2014). In this study, the study area was divided into 0.1, 0.5, 1, and 5 km granularity according to the actual situation of Nanchang city, and the final comparison revealed that the most suitable granularity size for the study area is 1 km. A 1 km grid is not too dense and leads to too much workload, but it also can well distinguish and portray spatial homogeneity and heterogeneity. Therefore, according to the extent of the study area, the study area was divided into 1 × 1 km square evaluation units with a total of 7,536 sampling areas.
Habitat quality can be used as a proxy for “resilience” to characterize the ability of urban ecosystems to withstand external disturbances (Zhang, 2018). The habitat quality index refers to the magnitude of the ability of the environment to provide the conditions and resources needed for species and populations to survive and reproduce sustainably. The habitat quality index ranges from 0 to 1. The larger the value, the higher the habitat quality, the higher the biodiversity, and the higher the stability and resistance of the system itself. The ArcGIS regional statistical tool showed that the mean values of habitat quality in Nanchang in 1990, 2005, and 2020 were 0.487144, 0.47363, and 0.458934, respectively, indicating that the regional habitat quality had an overall downward trend.
In order to explore the role of the evolution of land-use patterns in the region in habitat quality in depth and conduct a comprehensive assessment of habitat quality in Nanchang city (Chen W. X. et al., 2022), drawing on the grading methods of relevant experts and scholars (Rong et al., 2016; Zhong and Wang, 2017; Chu et al., 2018) on habitat quality, and based on field research in the study area, the habitat quality results obtained from running the model for the three periods were classified into five classes: lower (0–0.2), low (0.2–0.3), medium (0.3–0.4), high (0.4–0.8), and higher (0.8–1). The area of habitat quality at each level and its percentage were calculated for the three periods (Table 7). In 1990, the study area had the largest proportion of low-grade habitats, 53.48%, and the proportion of higher-, lower-, medium-, and high-grade habitats decreased in order, 33.54%, 8.20%, 3.43%, and 1.36%, respectively. In 2005, except for the percentage of lower-grade habitats, which increased significantly to 11.57%, low-, medium-, high-, and higher-grade habitats all decreased slightly to 52.17%, 2.11%, 1.29%, and 32.86%, respectively. In 2020, the percentage of low-, high-, and higher-grade habitats continued to decrease to 50.54%, 1.05%, and 31.76%, respectively, based on the 2005 level. Unlike the previous period, the proportion of medium-grade habitats increased slightly and showed a fluctuating decrease overall, while the proportion of lower-grade habitats maintained a steady increase at 14.34%. Overall, lower and low-grade habitats quality has been dominant for a long time, and the proportion of lower-grade habitats has been increasing over the past 30 years, indicating that the overall habitat quality level in Nanchang is at a low level, while the continuous decrease in the proportion of high- and higher-grade habitats further indicates the habitat quality is deteriorating, mainly due to rapid urbanization and expansion of urban construction land in recent years, resulting in the proportion of lower-grade habitats and the rapid increase in the proportion of low-grade habitats. It is urgent to take measures to improve the ecological environment in Nanchang to prevent habitat degradation and achieve healthy ecosystem development.
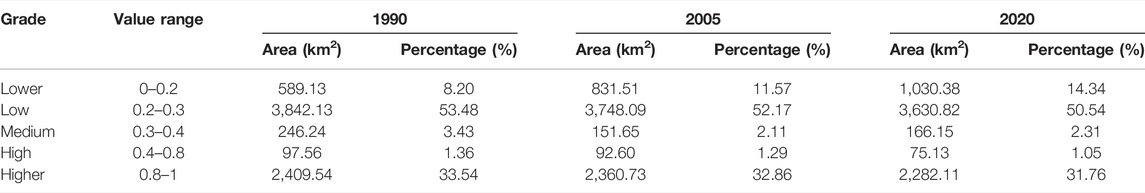
TABLE 7. Area and percentage of habitat quality for each grade.
Combined with the spatial distribution pattern of the three phases in Figure 5, the spatial variation in habitat quality in Nanchang was obvious during the study period, showing an overall low-grade pattern in the central part, gradually increasing in the surrounding area, and there was a significant correlation between habitat quality and land-use types in the study area. The habitat quality of forestland, grassland, water, and other ecological land distribution areas was higher, while the habitat quality of construction land and cultivated land was lower.
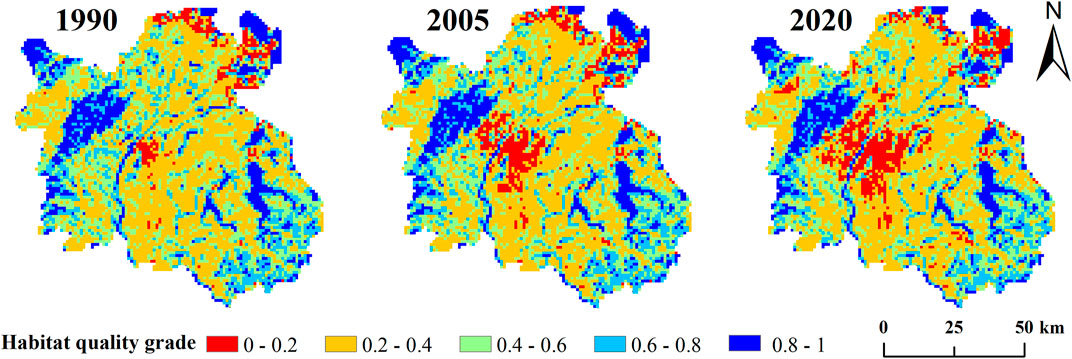
FIGURE 5. Spatial distribution pattern of habitat quality in 1990, 2005, and 2020.
Lower habitat quality areas are mainly located in the urban built-up areas mainly on both sides of the Ganjiang River in the central part of the city, represented by Honggutan, Donghu, Xihu, and Qingshanhu Districts, which are closely connected with the center of Nanchang city and are the economically prosperous areas of Nanchang city, with rapid urban development, high urbanization levels, and rapid expansion of land for construction, whose disorderly spreading engulfs ecological space such as woodlands and grasslands, which in turn threatens the surrounding habitats and destroys the ecological integrity of the habitats on which living organisms depend, resulting in poor habitat quality in the area and a significant decline in habitat quality. Areas with poor habitat quality are scattered in most of the plain areas, where the main land-use category is arable land, and many rural settlements are gathered here, which are subject to great human interference and low biodiversity, resulting in increased habitat fragmentation, poor connectivity, and serious ecological destruction. The habitat quality in this area is mainly poor. The area proportion of high habitat quality is small, mainly scattered in Meiling in northwestern Nanchang, Poyang Lake in the northeast, and Junshan Lake and Qinglan Lake in the southeast. The famous Meiling National Forest Park is located in Meiling, which is mainly woodland, with rich biodiversity due to its overlapping mountains and scarce inhabitants, so its habitat quality is high. Poyang Lake, Junshan Lake, and Qinglan Lake have the role and advantages of protecting landscape biodiversity and replenishing groundwater, and the habitat quality in this area is also good under the protection of the local government. In general, the most significant spatial changes were observed in lower-grade habitats. From 1990 to 2005, the areas with lower habitat quality expanded in a circle around the Xihu, Donghu, Qingyunpu, and Qingshanhu Districts on the east bank of the Ganjiang River as the origin, with the most significant expansion spreading to the Meiling Mountains in the northwest and to Nanchang County in the south. The change in the area with higher habitat quality was not obvious. From 2005 to 2020, the expansion of the area with lower habitat quality in Honggutan District, Xinjian County and Nanchang County was significant. Unlike in the previous period, the area with higher habitat quality in the Poyang Lake area in the northeast of the study area experienced large-scale shrinkage because of human exploitation of resources in the Poyang Lake basin, which led to a series of human activities such as enclosing the lake for farming and urban expansion that engulfed the lake body. The habitat degradation of the Poyang Lake basin intensified, while the habitat quality of Junshan Lake and Qinglan Lake in the east was consistently maintained at a high level because they are closed water bodies with stable water levels, and the government has been effective in protecting them.
To deeply explore and compare the changing trend of the ecosystem adaptation level, based on the Natural Hiatus Grading Method (Bai, 2019), ecosystem adaptation was divided into five levels using 20, 40, 60, 80, and 100 as critical values: lower ecosystem adaptation zone (0 ≤ A < 20), low ecosystem adaptation zone (20 ≤ A < 40), medium ecosystem adaptation zone (40 ≤ A < 60), high ecosystem adaptation zone (60 ≤ A < 80), and higher ecosystem adaptation zone (80 ≤ A < 100). The area and proportion of each ecosystem adaptation zone were calculated (Table 8). The results show that, from 1990 to 2005, the trend of change in the adaptation level was mainly reflected in the lower ecosystem adaptation zone and the medium ecosystem adaptation zone, whose changed area reached 91 and 117 km2, respectively, among which the area of the medium ecosystem adaptation zone showed a trend of shrinkage, the proportion of which decreased from 28.4% to 26.85%, while the lower ecosystem adaptation zone showed a trend of expansion, the proportion of which increased from 15.73% to 16.94%. The other classes showed less change. The trend of change in the adaptation level from 2005 to 2020 was the opposite. The main trend was the change in the medium ecosystem adaptation zone and higher ecosystem adaptation zone. In other words, the area of the medium ecosystem adaptation zone showed an upward trend, and the area of the higher ecosystem adaptation zone decreased. The area of the medium-level zone increased by 72 km2, and the area of the higher-level zone decreased by 66 km2. Specifically, the overall trend of the adaptation level from 1990 to 2005 decreased, the proportion of lower- and medium-level ecosystem adaptation gradually increased, and the level of ecosystem adaptation in the study area gradually decreased. On average, there was a medium level of adaptation from 2005 to 2020, the level of both higher and lower adaptation decreased, and the degree of differentiation of the adaptation level was moderated. In general, from the whole study period, the high and higher levels of adaptation changed significantly, with the area of higher-level adaptation decreasing from 9.41% to 8.42% and the high level increasing from 21.48% to 22.50%, but the medium level of adaptation was dominant during the study period, indicating that the adaptation level in the study area was mostly at the medium level.
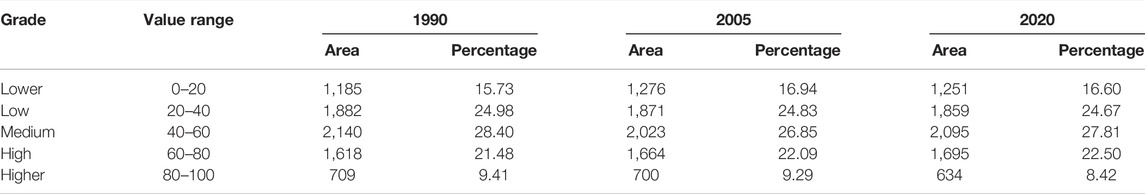
TABLE 8. Area and percentage of ecosystem adaptation at each level.
The spatial distribution pattern of adaptation of urban ecosystems was analyzed (Figure 6) to compare the characteristics of their spatial distribution differences. From the spatial distribution, the levels of ecosystem adaptation in 1990, 2005, and 2020 showed similar distribution patterns with significant spatial heterogeneity characteristics. The areas with high values of adaptation are scattered in the west and southeast of the study area, where the main landscape type is woodland, with better natural ecological protection and a higher degree of connectivity. The areas with low values of adaptation are clustered in the urban built-up areas in the central part of the study area, the plains with arable land as the main type of land in the east, and the water areas such as lakes and reservoirs. The proportion of low- and medium-grade adaptation dominated during the study period and showed a basal distribution pattern, and the distribution of low- and medium-grade adaptation was generalized in the region, which played a decisive role in the adaptation level, indicating that the adaptation level in the study area was mostly at the middle to lower level.
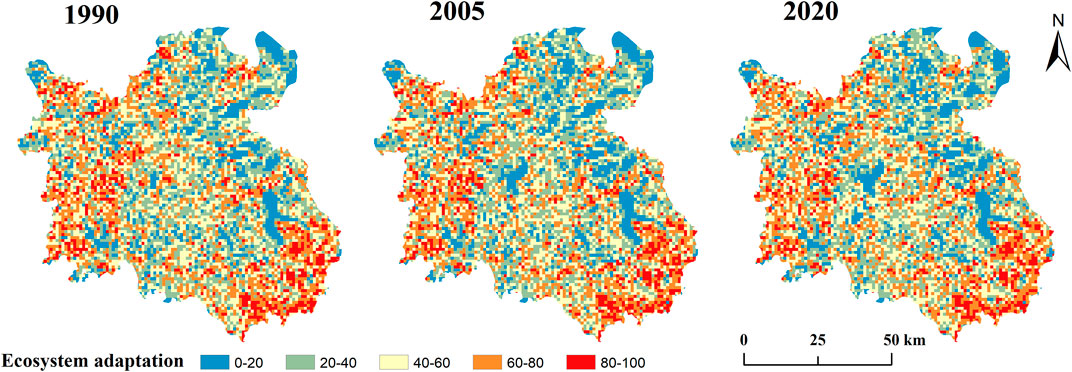
FIGURE 6. Spatial distribution pattern of ecosystem adaptation in 1990, 2005, and 2020.
Further analysis of the changes in the spatial distribution of adaptation reveals that the levels of adaptation changed significantly from 1990 to 2005, and the area that experienced significant changes was the central urban built-up area in a circle-like ring clustering, mainly because of the rapid increase in population and socioeconomic status at the early stage of urban development and the expansion of urbanization, which required a large amount of construction land, significantly reducing the forestland, arable land, grassland, and other ecological lands around the city. At the same time, as the intensity of human activities increased, dominant artificial patches with excellent connectivity were formed, landscape homogeneity was serious, landscape heterogeneity and species diversity decreased, and landscape heterogeneity and landscape connectivity, which characterize ecosystem resilience, declined significantly at the same time during this period, so the area with a low value of adaptation during the expansion from 1990 to 2005 is obvious. The change in adaptation from 2005 to 2020 is not obvious, mainly because the policies of “returning farmland to forest” and “returning farmland to grassland” were put forward in 2002 and 2003, and the 17th Party Congress put forward the concept of ecological civilization in 2007, when the government began to pay attention to ecology. However, the mathematical analysis of adaptation in shows that the overall level of adaptation in 2020 is still lower than that in 1990, and the change in patch morphology caused by urban expansion has led to the decline in landscape connectivity and landscape heterogeneity. In the process of rapid urban development, how to use existing regional conditions to increase the stability of landscape structure and thus enhance ecosystem adaptation is a question that urban builders need to seriously consider.
The average ecological vitality of Nanchang in 1990, 2005, and 2020 was 0.474561, 0.468409, and 0.460525, respectively, which shows that, with the development of urbanization, some unreasonable development and utilization behaviors have broken the ecological space, and the ecosystem processes are less resistant and adaptive to external disturbances. The resistance and adaptation of ecosystem processes to external disturbances are reduced.
To explore the characteristics of ecosystem vitality changes in depth, based on the Natural Hiatus Grading Method (Bai, 2019), ecosystem risk was classified into five levels using 0.20, 0.40, 0.55, and 0.75 as critical values: lower ecological vitality zone (R < 0.20), low ecological vitality zone (0.20 ≤ R < 0.40), medium ecological vitality zone (0.40 ≤ R < 0.55), high ecological vitality zone (0.55 ≤ R < 0.75), and higher ecological vitality zone R ≥ 0.75. The area and proportion of each vitality zone were calculated (Table 9). The results show that, from 1990 to 2020, the ecosystem vitality of Nanchang was mainly dominated by low ecological vitality zones and medium ecological vitality zones, and the sum of the two was more than 60% in each period. The city was in a rapid development stage, the overall ecosystem vitality was at a low level, and the resistance and adaptive ability of the urban ecosystem to external risks still needed to be strengthened.
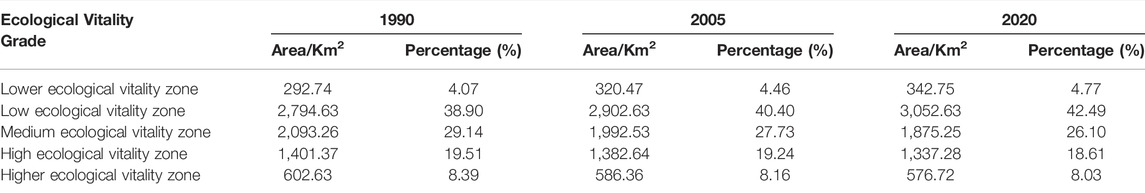
TABLE 9. Area and percentage of ecosystem vitality at each level.
The study area had the largest share of low ecological vitality areas in 1990, with 38.90%, and the share of areas with medium, high, higher, and lower ecological vitality decreased by 29.14%, 19.51%, 8.39%, and 4.07%, respectively. In 2005, the areas with medium, high, and higher ecological vitality showed a continuous downward trend during the study period, except for the percentage of lower ecological vitality zones and low ecological vitality zones, which increased to 4.46% and 40.40%, respectively. In 2020, the share of areas with medium, high, and higher ecological vitality continued to decrease to 26.10%, 18.61%, and 8.03%, respectively, from the 2005 level, while the share of lower and low ecological vitality zones continued to increase, indicating that the ability of ecosystems to maintain their structure and pattern has not improved. It is noteworthy that the area with lower ecological vitality gradually expanded from 4.07% in 1990 to 4.77% in 2020, with an increase of 17.20%. This area needs to be closely monitored to prevent further reduction in ecological vitality. Overall, the ecosystem vitality response to disturbance and self-regulation in the study area has been decreasing, mainly due to the rapid urbanization and expansion of urban construction land in recent years, resulting in a rapid increase in the proportion of the area with low ecological vitality. Nanchang city urgently needs to adopt means to improve the ecological environment to prevent the decline in ecosystem vitality to achieve healthy ecosystem development.
The spatial pattern of ecosystem vitality in Nanchang was obtained using the ArcGIS 10.7 software to calculate the ecological vitality index and classify 7,536 grid plots in 1990, 2005, and 2020 using the natural break method (Figure 7). From 1990 to 2020, the spatial divergence of ecosystem vitality was significant, showing low vitality in the middle of the decade and high vitality in the fourth year.
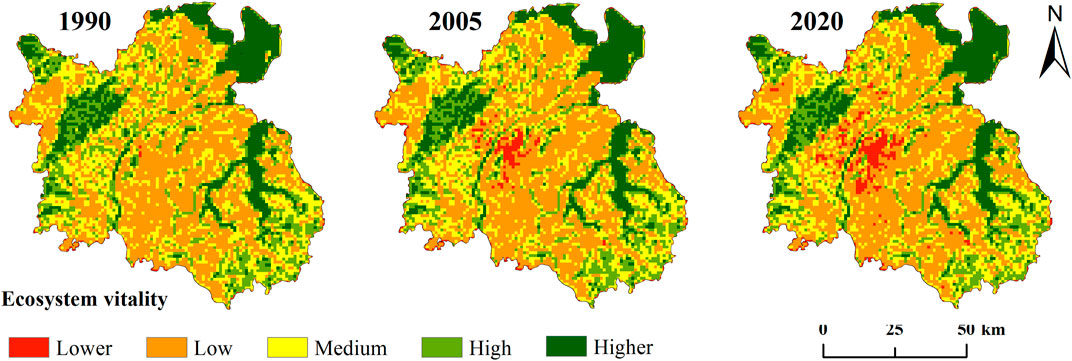
FIGURE 7. Spatial distribution pattern of ecological elasticity in 1990, 2005, and 2020.
From Figure 7, it can be seen that the low ecological vitality areas occupy the main part of the spatial distribution of Nanchang, dominated by arable land, which is widely distributed and forms the substrate because there is more human activity interference in arable land and lower biodiversity because of its lower vitality level. The areas with higher ecological vitality are distributed in clusters, with woodland, water, and other land types with high biodiversity as the main areas. The areas with lower ecological vitality are distributed in the urban built-up areas on both sides of the Ganjiang River in the central part of the study area. The medium and high ecological vitality areas are scattered in Jinxian County in the southeast and Xinjian County in the southwest of the study area, and the main land types are woodland and grassland. In 1990, the area with lower ecological vitality was very small and concentrated in the old urban areas, such as Donghu and Xihu Districts. From 1990 to 2005, the area with lower ecological vitality began to expand to the west bank of the Ganjiang River and Nanchang County, and t. This expansion led to concentrated and continuous urban construction land, which was disturbed by high-intensity human activities. Ecological vitality showed concentrated and continuous drastic changes in the urban expansion zone. From 2005 to 2020, the area with lower ecological vitality continued to maintain a significant expansion trend because the northwest expansion straddled the Meiling Mountains. The development and utilization of mountainous areas are difficult, and development is blocked, so the expansion of the area with lower ecological vitality expanded in a “southwest-northeast” direction. The southwest direction is represented by the rapid development of the Honggutan District, and the spread to Xinjiang County represents the northeast direction. In general, the distribution of lower ecological vitality areas is significantly influenced by urban expansion, and the growth trend is approximately the same as the expansion of construction land, which has a greater correlation with economic development and human activities, on which the expansion of construction land and economic development have had certain ecological and environmental impacts. From 1990 to 2020, although the area with higher ecological vitality showed a slight decrease, its distribution pattern was relatively stable, mainly distributed in the Poyang Lake basin in the northeast, the Meiling Mountains in the northwest, and Junshan Lake and Qinglan Lake in the east, which are also part of the Poyang Lake basin, thanks to the ecological pattern structure of Nanchang city of “eastern lake and western mountains, mountains and lakes reflecting each other” and “the ecological pattern structure of Nanchang city and the planning of two ecological barriers of “Poyang Lake—Qinglan Lake in the east and Meiling–Mengshan–Xishan in the west.” Other levels of areas with ecological vitality have fewer changes in spatial distribution.
In the context of continuous urban expansion, the mean value of urban ecosystem resilience declined from 0.491496 in 1990 to 0.475469 in 2005 and to 0.454988 in 2020, indicating a gradual decrease in ecosystem resilience during the 30-year period from 1990 to 2020, which indicates that human activities have gradually increased the consumption of ecosystems and caused a gradual decrease in ecosystem resilience. This indicates that human activities have gradually increased the consumption of ecosystems, resulting in the decreasing level of ecosystem resilience and the gradual reduction of the city’s ability to address risks. In order to compare the trends of urban ecosystem resilience, the ecosystem resilience index was classified into five levels: lower, low, medium, high, and higher using natural breaks (Jenks) classification (Table 10).
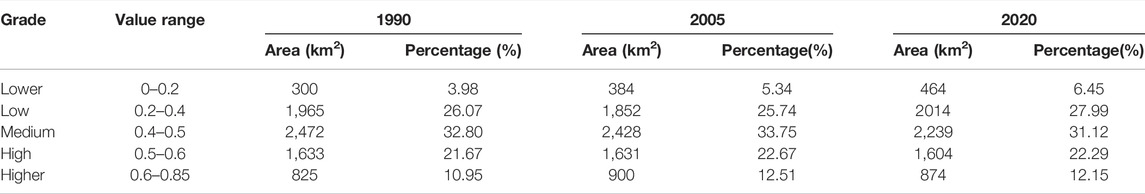
TABLE 10. Area and proportion of each grade of comprehensive resilience level of the ecosystem in Nanchang.
The results show that from 1990 to 2020, the ecosystem resilience level of Nanchang was mainly dominated by low and medium ecological resilience levels. The sum of the two was more than 55% in all three periods, and ecosystem resilience contributed a great deal to the overall resilience level. As the city is in a rapid development stage, the overall ecosystem resilience level is at a lower median level, and the resistance and adaptation capacity of the urban ecosystem to external risks still needs to be strengthened. During the study period, low-grade resilience showed a continuous upward trend, and the area with lower-grade resilience expanded significantly from 1990 to 2005, with an increase of 28% during the 15 years, while lower-grade resilience increased slightly from 2005 to 2020 to 20.78%. The area with a low ecological resilience level first decreased and then increased, with an overall “V"-shaped fluctuating upward trend. From 1990 to 2005, the area decreased slightly, and the proportion decreased by 0.33%, while from 2005 to 2020, the low resilience area increased by 2.25% and reached 27.99%. The area with a medium ecological resilience level first increased and then decreased, showing an overall inverted V-shaped fluctuating decline with a plateau at a moderate level, accounting for more than 30% of the three periods and contributing significantly to the overall resilience level. The area with a high-level ecological resilience level increased overall during the study period, but the magnitude of change was relatively small. The area with a higher-level ecological resilience showed an upward trend, with a good regional resilience level trend (Yu et al., 2022).
From Figure 8, the spatial distribution pattern of urban ecosystem resilience based on “resistance-vitality-adaptation” was analyzed, and ecosystem resilience was classified into five levels (lower, low, medium, high, and higher) using 0.2, 0.4, 0.5, and 0.6 as cutoff points to compare their spatial differences. From the spatial distribution of resilience levels, the overall spatial distribution of ecosystem resilience from 1990 to 2020 shows a pattern of “low in the middle and high around,” with significant spatial differentiation. The areas with lower ecological resilience are mainly distributed in the central urban built-up areas, while the higher-grade ecological resilience areas are located in Meiling National Forest Park, the mountainous and hilly areas in the northwest of Anyi County, most of Jinxian County and the Poyang Lake area in the northeast of the study area. The medium-grade resilience areas occupy the base of urban spatial distribution, are widely distributed, and are the main body of the study, among which the resilience of the built-up areas of central cities is distributed in a piecemeal manner, and the expansion trend is obvious during the study period.
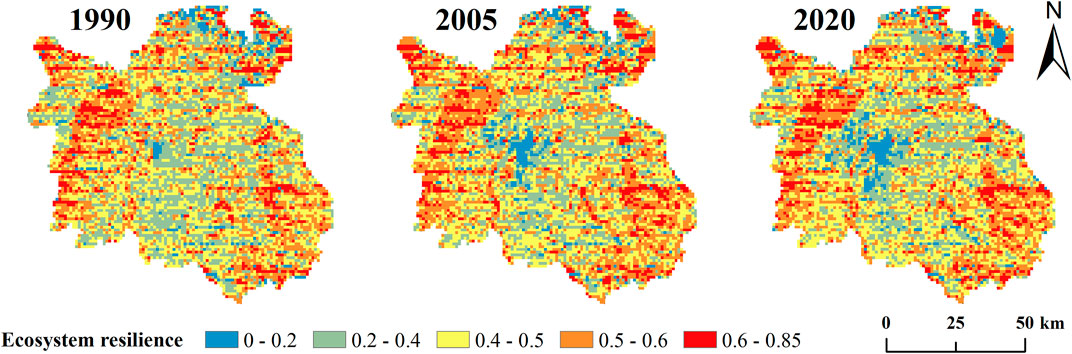
FIGURE 8. Spatial distribution pattern of integrated ecosystem resilience in 1990, 2005, and 2020.
Exploring the changes in the spatial distribution of urban ecosystem resilience, from 1990 to 2005, the areas with lower resilience expanded in a circle around the old urban areas such as Xihu, Donghu, and Qingyunpu Districts as the origin; the low resilience areas immediately adjacent to the urban areas were transformed into lower resilience areas, and the proportion of low resilience areas shrank slightly. From 2005 to 2020, except for the spread of lower resilience areas in the central part of the city, another more significant expansion appeared in the northeastern Poyang Lake area in the form of clumps, and many high- and higher-grade resilience areas were transformed into lower-grade resilience areas. The land type in this area is mainly wetland mudflats, and the loss of lake wetlands caused by factors such as lake reclamation is an important reason for the decline in ecosystem resilience in this area. At the same time, low resilience areas were also transformed from medium-level resilience areas because most areas in Nanchang are medium-level ecological resilience areas, and arable land is the main landscape of the area. However, the continuous promotion of urbanization makes the rural settlements continue to gather, integrate, and expand, resulting in the gradual shrinkage of arable land in the area. Coupled with the great improvement in transportation infrastructure in recent years, the crisscrossing road network leads to higher fragmentation of arable land patches and increasing pressure on the landscape, which gradually has a negative effect on the ecosystem, thus making the ecosystem resilience level in the area transform from a medium to a low level. From 1990 to 2020, the area with higher resilience increased in Jinxian County in the southeastern part of the study area, mainly transformed from high-grade ecological resilience areas, which are located in the lakeside plain with dense water networks, numerous lakes, abundant water resources, and superior ecological conditions. Coupled with the vigorous development of woodland-dependent derivative industries in the area in recent years to further increase biodiversity, the level of ecosystem resilience has increased.
As shown in Table 11, the global Moran index of ecosystem resilience in Nanchang from 1990 to 2020 was above 0.40, among which the lowest global Moran index was 0.414918 in 1990 and gradually increased from 1990 to 2020, with the highest value of 0.516780 in 2020. The standardized z-values were all greater than 1.96 and all were statistically significant. All of them passed the significance level test of p = 0.05, indicating that there was a positive spatial correlation and a high correlation in the level of ecosystem resilience in Nanchang during the study period. The growth of the Moran index and the increasing standardized z-score indicate that the spatial clustering of regional landscape ecosystem security indices is further evidence.
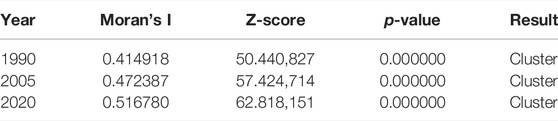
TABLE 11. Spatial autocorrelation analysis results of ecosystem resilience in Nanchang city.
The distribution pattern of cold hot spots in Nanchang city during 1990–2020 was obtained by hot spot analysis in ArcGIS 10.7. The results are shown in Figure 9. The cold spots during the study period are mainly located in the urban area in the middle of the study area, and the hot spots are mainly distributed in three places in the western, northeastern, and southeastern parts of the study area, except for the western part. The other two places are far from the main urban area, the primary land-use types are water, woodland, and grassland, and the land-use intensity is low.
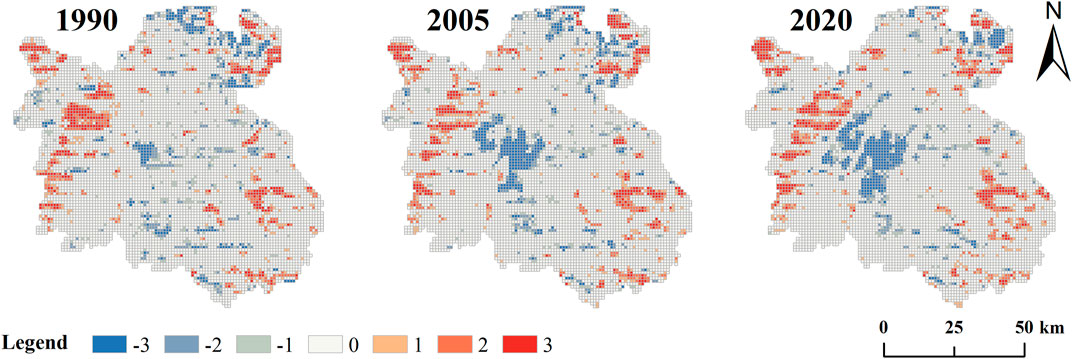
FIGURE 9. Distribution patterns of cold/hot spots of ecosystem resilience in 1990, 2005, and 2020. Note: 3/3 represents the cold spot/hot spot with a 99% confidence level; −2/2 represents the cold spot/hot spot with a 95% confidence level; −1/1 indicates the cold spot/hot spot with a 90% confidence level; and 0 indicates no statistical significance.
In 1990, the area with cold spots was widely distributed, in which the larger cold spot patches were located in the central Donghu, Xihu, and Qingyunpu Districts, and the rest of the finer cold spot patches were scattered in the northern Poyang Lake basin and southern counties. By 2005, the area with cold spots experienced a significant expansion, and the direction and rate of its expansion were consistent with the spreading characteristics of urban construction land. During the period 1990–2005, most of the hotspot areas of ecosystem resilience in Nanchang remained unchanged from the previous period, with significant changes occurring in the Meiling area of the study area, where high values of ecosystem resilience were originally clustered by human activities and urban expansion, becoming insignificant.
The medium and low levels of resilience of the Nanchang ecosystem dominated for a long time, and the growth rate of the low level of resilience was the most significant, indicating that the overall level of resilience of the Nanchang ecosystem is relatively low, and the overall level of resilience of the urban ecosystem still needs to be further improved. In the face of external threats (i.e., increasing risks), cities need to continuously improve the level of ecosystem resilience to cope with shocks, strengthen the ecological environment, gradually improve the overall level of habitat quality and biodiversity richness, and enhance ecosystem integrity and stability, thus contributing to a certain extent to the increase in ecosystem resilience. In general, the spatial distribution of ecosystem resilience based on “resistance-vitality-adaptation” is influenced by the quality of habitat, stability of landscape structure and ecological resilience. On the one hand, we protect and reasonably utilize the ecological space with woodland, grassland, lakes, and wetland as the main types of land to enhance the stability of the ecosystem and improve ecosystem resilience. On the other hand, the intensive use of construction land and three-dimensional development should be promoted to avoid the negative impact on ecological space caused by the expansion of the urban “disorderly state.”
From 2005 to 2020, the cold spots of ecosystem resilience in Nanchang County east of the main urban area tended to gather, indicating that the difference in ecosystem resilience between the regions was narrowing, mainly because Nanchang County is so close to Nanchang city that the two areas have undergone colocation development and the urban construction sites have been connected. Meanwhile, the rapid socioeconomic development in the Honggutan District on the west bank of the Ganjiang River inevitably has some impact on the ecology, so new cold spot patches appeared in this area. In addition, in the Poyang Lake basin in the northeast of the study area, the originally scattered cold spot areas were gathered into larger cold spot patches, which indicates that the ecological function of the land in this area is reduced compared with the previous area and needs to be considered. The change in hot spot areas is less significant. In summary, the area with higher ecosystem resilience is mainly located in the area dominated by natural ecological land, especially the mountainous, hilly area dominated by woodland and water landscape types, while the area with lower ecosystem resilience is mainly located in the plains area dominated by construction land and other landscape types. During 1990–2020, Nanchang still needed to increase investment in ecological environmental protection and management to promote regional ecological security.
The implications of this study can be described from both theoretical and practical aspects.
In terms of theory, at present, the study of urban ecosystem resilience is still in its initial stage, and there are still many theories that need to be improved, but there is a lack of systematic research. In this study, based on the basic characteristics of resilience, with reference to previous research results, the urban ecological resilience evaluation index model is constructed from the three dimensions of “resistance-adaptation-vitality,” which not only provides a quantitative evaluation framework for the ecosystem resilience theory of Nanchang city but also provides a qualitative evaluation framework for the ecosystem resilience theory of Nanchang city. The model also provides theoretical guidance and application demonstration for ecological resilience assessment of other similar cities in China and the world.
In terms of practice, as the key city of the Poyang Lake city cluster, Nanchang plays an important role in the economic development strategy of central China. However, with the rapid economic development in recent years, the accelerated urbanization process has posed a threat to the ecological environment and even endangered regional ecological security. Urban ecosystem resilience is an anticipatory, goal-oriented risk management model that aims to enhance the defensive capacity of urban ecosystems against ecological risks, their ability to restore normalcy after threats, and their adaptation to similar threats. Thus, there is a significant problem-response mechanism between ecological risk and urban ecological resilience, which are closely linked and interlocking and are two aspects that must be considered holistically in urban ecological protection. Therefore, taking Nanchang city as an example to carry out research on urban ecosystem resilience, it is of great significance to establish a sound mechanism for the green development of the urban ecosystem and realize the coordinated development of the urban social economy and ecological protection.
The city is a huge system consisting of many subsystems, such as social, cultural, economic, ecological, and political subsystems. Although this study is innovative in constructing an indicator system based on the feasibility of empirical research and the quantifiability of data, it is still necessary to acknowledge that the indicators used in this study can hardly cover all the characteristics of urban resilience. It is imperative to systematize the framework of urban ecological resilience indicators, and the coupling of social, economic, ecological, cultural, and other urban subsystems into the ecological resilience evaluation system is also the focus of future research in the academic community.
At this stage, research on the resilience of urban ecosystems is just beginning and is still immature. By considering the limitation of data acquisition, this study uses the parametric substitution method to construct the evaluation framework, which makes the ecosystem resilience evaluation more convenient. However, it should be noted that the establishment of the urban ecosystem resilience evaluation model in this study may lack the quantification of some risk factors and disaster prevention culture. Uncertainty risk data should be incorporated into the integrated assessment framework in the future to improve the accuracy of ecosystem resilience assessment results.
This study constructs an urban ecological resilience assessment model from the three aspects of the basic characteristics of resilience (resistance, adaptation, and vitality). Second, taking Nanchang as an example, we summarize its ecological resilience evolution law and characteristics by quantitatively measuring its ecosystem resilience and use the patch-level landscape simulation PLUS model to conduct a multiscenario simulation and ecological resilience assessment of the urban expansion of Nanchang in 2035. Based on the above study, this study obtained the following conclusions:
1) Land-use types in Nanchang are mainly arable land, forestland, and water area, which together occupy approximately 90% of the total area of the study area. The 1990–2020 land-use change trend was mainly characterized by the continuous decrease in arable land and ecological land (forestland, grassland, and water area) and the continuous increase in construction land. Cultivated land is the largest land type transferred out, and the mutual transfer between it and construction land is remarkable. The largest dynamic attitude of construction land reaches 5.33% from 1990 to 2005, and the transfer from natural ecological landscapes (woodlands, grasslands, waters, etc.) to human landscapes (construction land, cultivated land, etc.) is the general trend and main feature of land-use transfer in the study area over the 3 decades.
2) From 1995 to 2020, the ecosystem resilience level of Nanchang city was at a medium-to-low level for a long time, and the overall trend is decreasing. The spatial distribution of ecosystem resilience shows a stable pattern of “high in the east and low in the west,” with a stable distribution pattern of higher and lower resilience and significant spatial heterogeneity, in which the higher resilience areas are mainly located in the hilly areas dominated by natural ecological land, and the lower resilience areas are mainly located in the plain areas dominated by construction land, arable land, and other landscape types.
3) By changing the probability of land-use transfer and designating prohibited development zones, three land-use scenarios of ecological protection, natural development, and urban development are set, and the PLUS model, a patch-level landscape simulation model, is used to simulate and predict the expansion hotspots of urban construction land in 2035 under multiple scenarios, mainly in Donghu, Xihu, Qingyunpu, Qingshanhu, and Xinjian Districts. In addition, the Honggutan District and the Changbei area located in Ganjiang New District are important directions for future urban development. A large area of arable plains in central Nanchang County, the Poyang Lake area in the northeast, Meiling National Forest Park in the southwest, and woodlands and lakes and reservoirs in Jinxian County in the southeast are threatened by the expansion of urban construction land and encroachment of human activities, and ecological security is under threat.
4) Comparing the level of ecosystem resilience under three scenarios in 2035, the relationship between the ecological conservation scenario, the normal development scenario, and the high-speed development scenario is presented. Under different scenario simulations, there are significant differences between construction land expansion and ecological land protection. The conflict between the two is most prominent in the high-speed development scenario, and ecological land is the most threatened. In general, a large amount of ecological space (mountains, water, forests, and fields) in the periphery of urban areas is the main provider of ecosystem resilience. The contiguous expansion of urban areas and towns along transportation routes intensifies the fragmentation of natural ecological space, reduces ecosystem connectivity, and has a direct impact on ecosystem resilience impairment.
The raw data supporting the conclusions of this article will be made available by the authors without undue reservation.
LD, DZ, and YL: conceptualization, methodology, and visualization. LD: software and funding acquisition. DZ, YL, and MZ: validation. YZ and ZW: formal analysis and supervision. MZ and ZW: investigation. LD, DZ, and YL: writing—review and editing.
This research was funded by the Jiangxi Provincial Social Science Foundation “the 14th Five-Year Plan” (2021) regional projects (21DQ44), Institutional Research Centers of Jiangxi Provincial of Ecological Civilization Construction (JXST2103), Science and Technology Research Project of Jiangxi Provincial Department of Education (GJJ210723), the Doctoral Research Initiation fund of East China University of Technology (DHBK2019184).
The authors declare that the research was conducted in the absence of any commercial or financial relationships that could be construed as a potential conflict of interest.
All claims expressed in this article are solely those of the authors and do not necessarily represent those of their affiliated organizations or those of the publisher, the editors, and the reviewers. Any product that may be evaluated in this article, or claim that may be made by its manufacturer, is not guaranteed or endorsed by the publisher.
The authors are grateful to the editor and reviewers for their valuable comments and suggestions.
Abdrabo, M. A., and Hassaan, M. A. (2015). An Integrated Framework for Urban Resilience to Climate Change - Case Study: Sea Level Rise Impacts on the Nile Delta Coastal Urban Areas. Urban Clim. 14, 554–565. doi:10.1016/j.uclim.2015.09.005
Bai, L. M. (2019). “Evaluation and Optimization of Urban Ecological Resilience in Changchun Based on Landscape Pattern,” (Changchun, China: Northeast Normal University). PhD Thesis. doi:10.27011/d.cnki.gdbsu.2019.000089
Bozza, A., Asprone, D., Parisi, F., and Manfredi, G. (2017). Alternative Resilience Indices for City Ecosystems Subjected to Natural Hazards. Computer-Aided Civ. Infrastructure Eng. 32, 527–545. doi:10.1111/mice.12275
Chen, W. X., Zhao, X. L., Zhong, M. X., Li, J. F., and Zeng, J. (2022a). Spatiotemporal Evolution Patterns of Ecosystem Health in Middle Reaches of the Yangtze River Urban Agglomerations. Acta Ecol. Sin. 42 (1), 138–149. doi:10.5846/stxb202012093142
Chen, Y., Qiao, F., and Jiang, L. (2016). Effects of Land Use Pattern Change on Regional Scale Habitat Quality Based on InVEST Model—A Case Study in Beijing. Acta Sci. Nat. Univ. Pekin. 52 (3), 553–562. doi:10.13209/j.0479-8023.2016.057
Chen, Y., Yang, J., Yang, R., Xiao, X., and Xia, J. (2022b). Contribution of Urban Functional Zones to the Spatial Distribution of Urban Thermal Environment. Build. Environ. 216, 109000. doi:10.1016/j.buildenv.2022.109000
Chu, L., Zhang, X. R., Wang, T. W., Li, Z. X., and Cai, C. F. (2018). Spatial-temporal Evolution and Prediction of Urban Landscape Pattern and Habitat Quality Based on CA-Markov and InVEST Model. Ying Yong Sheng Tai Xue Bao 29 (12), 4106–4118. doi:10.13287/j.1001-9332.201812.013
Feng, X. H., Zhong, Y. X., Li, J. X., and Huang, J. (2015). Causal Analysis on Economic Disparity in Yangtze River Basin. World Reg. Stud. 24 (3), 100–109. doi:10.3969/j.issn.1004-9479.2015.03.012
Gimenez, R., Labaka, L., and Hernantes, J. (2017). A Maturity Model for the Involvement of Stakeholders in the City Resilience Building Process. Technol. Forecast. Soc. Change 121, 7–16. doi:10.1016/j.techfore.2016.08.001
Gong, J., Zhao, C. X., Xie, Y. C., and Gao, Y. J. (2014). [Ecological Risk Assessment and its Management of Bailongjiang Watershed, Southern Gansu Based on Landscape Pattern],southern Gansu Based on Landscape Pattern. Ying Yong Sheng Tai Xue Bao 25 (7), 2041–2048. doi:10.13287/j.1001-9332.20140425.005
He, B.-J., Wang, J., Zhu, J., and Qi, J. (2022). Beating the Urban Heat: Situation, Background, Impacts and the Way Forward in China. Renew. Sustain. Energy Rev. 161, 112350. doi:10.1016/j.rser.2022.112350
He, B.-J., Zhao, D.-X., Zhu, J., Darko, A., and Gou, Z.-H. (2018). Promoting and Implementing Urban Sustainability in China: An Integration of Sustainable Initiatives at Different Urban Scales. Habitat Int. 82, 83–93. doi:10.1016/j.habitatint.2018.10.001
He, B.-J., Zhao, D., Xiong, K., Qi, J., Ulpiani, G., Pignatta, G., et al. (2021). A Framework for Addressing Urban Heat Challenges and Associated Adaptive Behavior by the Public and the Issue of Willingness to Pay for Heat Resilient Infrastructure in Chongqing, China. Sustain. Cities Soc. 75, 103361. doi:10.1016/j.scs.2021.103361
He, Y. (2017). Ecology and Resilience in the New Urban Agenda: Report on Habitat Ⅲ. World Archit. 4, 24–29. doi:10.16414/j.wa.2017.04.004
Holling, C. S. (1996). Engineering Resilience versus Ecological Resilience.Engineering within Ecological Constraints. Canada: National Academies Press.
Huang, Y., Feng, Z., Yue, W. Z., Feng, S. R., and Zhang, J. H. (2020). Spatial-temporal Evolution of Habitat Quality and Analysis of Landscape Patterns in Dabie Mountain Area of West Anhui Province Based on InVEST Model. Acta Eco Sin. 40 (9), 2895–2906. doi:10.5846/stxb201904260858
Jin, G., Deng, X. Z., Zhao, X. D., Guo, B. S., and Yang, J. (2018). Spatio-temporal Patterns of Urban Land Use Efficiency in the Yangtze River Economic Zone during 2005-2014. Acta Geogr. Sin. 73 (07), 1242–1252. doi:10.11821/dlxb201807005
Liu, C. F., and Wang, C. (2018). Spatio-temporal Evolution Characteristics of Habitat Quality in the Loess Hilly Region Based on Land Use Change: a Case Study in Yuzhong County. Acta Eco Sin. 38 (20), 7300–7311. doi:10.5846/stxb201710101800
Liu, Z. W. (2014). “Ecological Response to Wetland Landscape Pattern Change Based on InVEST Model: A Case Study in Southern Hangzhou Bay Area,” (Hangzhou, China: Zhejiang University). Master's Thesis.
Luedeling, E., and Buerkert, A. (2008). Typology of Oases in Northern Oman Based on Landsat and SRTM Imagery and Geological Survey Data. Remote Sens. Environ. 112 (3), 1181–1195. doi:10.1016/j.rse.2007.08.007
Ma, K. M., Kong, H. M., Guan, W. B., and Fu, B. J. (2001). Ecosystem Health Assessment: Methods and Directions. Acta Ecol. Sin. 21 (12), 2106–2116. doi:10.3321/j.issn:1000-0933.2001.12.020
Manyena, S. B. (2006). The Concept of Resilience Revisited. Disasters 30 (4), 434–450. doi:10.1111/j.0361-3666.2006.00331.x
Ostrom, E. (2004). Panarchy: Understanding Transformations in Human and Natural Systems. Ecol. Econ. 49 (4), 488–491. doi:10.1016/j.ecolecon.2004.01.010
Ou, W. X., Zhao, L. N., and Li, R. (2014). Simulation on Regional Ecological Land Demand Based on Coordination of the Eco-Environmental Stress – Acase Study of Jiangsu Province. Res. Soil Water Conservation 21 (4), 274–278. doi:10.13869/j.cnki.rswc.2014.04.053
Peng, J., Liu, Y., Wu, J., Lv, H., and Hu, X. (2015). Linking Ecosystem Services and Landscape Patterns to Assess Urban Ecosystem Health: A Case Study in Shenzhen City, China. Landsc. Urban Plan. 143, 56–68. doi:10.1016/j.landurbplan.2015.06.007
Ren, H., Wu, J. G., and Peng, S. L. (2000). Evaluation and Monitoring of Ecosystem Health. Trop. Geo 20 (4), 310–316. doi:10.3969/j.issn.1001-5221.2000.04.018
Ren, J., Yang, J., Zhang, Y., Xiao, X., Xia, J. C., Li, X., et al. (2022). Exploring Thermal Comfort of Urban Buildings Based on Local Climate Zones. J. Clean. Prod. 340, 130744. doi:10.1016/j.jclepro.2022.130744
Rong, Y. J., Zhang, H., and Wang, Y. S. (2016). Assessment on Land Use and Biodiversity in Nanjing City Based on logistic-CA-Markov and InVEST Model. Res. Soil Water Conservation 23 (3), 82–89. doi:10.13869/j.cnki.rswc.2016.03.015
Suárez, M., Gómez-Baggethun, E., Benayas, J., Tilbury, D., Benayas, J, Tilbury, D, et al. (2016). Towards an Urban Resilience Index: A Case Study in 50 Spanish Cities. Sustainability 8 (8), 774. doi:10.3390/su8080774
Turner, M. G. (2003). Landscape Ecology: The Effect of Pattern on Process. Annu. Rev. Ecol. Syst. 20, 171–197. doi:10.1146/annurev.es.20.110189.001131
Wu, J. S., Cao, Q. W., Shi, S. Q., Huang, X. L., and Lu, Z. Q. (2015). Spatio-temporal Variability of Habitat Quality in Beijing-Tianjin-Hebei Area Based on Land Use Change. Ying Yong Sheng Tai Xue Bao 26 (11), 3457. doi:10.13287/j.1001-9332.20150915.008
Xia, C., Dong, Z. Y. Z., and Chen, B. (2022). Spatio-temporal Analysis and Simulation of Urban Ecological Resilience: A Case Study of Hangzhou. Acta Eco Sin. 42 (1), 116–126. doi:10.5846/stxb202101030007
Xie, H. L., and Li, B. (2008). Driving Forces Analysis of Land-Use Pattern Changes Based on Logistic Regression Model in the Farming-Pastoral Zone: A Case Study of Ongiud Banner, Inner Mongolia. Geogr. Res-Aust 27 (2), 294–304. doi:10.3321/j.issn:1000-0585.2008.02.007
Xie, P., Yang, J., Sun, W., Xiao, X., and Cecilia Xia, J. (2022). Urban Scale Ventilation Analysis Based on Neighborhood Normalized Current Model. Sustain. Cities Soc. 80, 103746. doi:10.1016/j.scs.2022.103746
Xiu, C. L., Wei, Y., and Wang, Q. (2018). Evaluation of Urban Resilience of Dalian City Based on the Perspective of Size-Density-Morphology. Acta Geogr. Sin. 73 (12), 2315–2328. doi:10.11821/dlxb201812004
Yang, J., Wang, Y., Xiao, X., Jin, C., Xia, J., and Li, X. (2019). Spatial Differentiation of Urban Wind and Thermal Environment in Different Grid Sizes. Urban Clim. 28, 100458. doi:10.1016/j.uclim.2019.100458
Yang, J., Yang, Y., Sun, D., Jin, C., and Xiao, X. (2021). Influence of Urban Morphological Characteristics on Thermal Environment. Sustain. Cities Soc. 72, 103045. doi:10.1016/j.scs.2021.103045
Ypa, B., Li, L., Hxa, B., Rza, B., and Hx, A. (2020). Spatial Variability of Inhalable Fungal Communities in Airborne Pm 2.5 across Nanchang. china: Science of The Total Environment, 746.
Yu, H., Yang, J., Li, T., Jin, Y., and Sun, D. (2022). Morphological and Functional Polycentric Structure Assessment of Megacity: An Integrated Approach with Spatial Distribution and Interaction. Sustain. Cities Soc. 80, 103800. doi:10.1016/j.scs.2022.103800
Yuan, M. N., Liu, Y. X., Wang, M., Tian, L., and Peng, J. (2019). Ecosystem Health Assessment Based on the Framework of Vigor, Organization, Resilience and Contribution in Guangzhou City. Chin. J. Ecol. 38 (4), 1249. doi:10.13292/j.1000-4890.201904.026
Zhang, L. J. (2018). “A Land-Cover-Based Approach to Assessing the Spatio-Temporal Dynamics of Ecosystem Health in the Yangtze River Delta Region,” (Nanjing,China: Nanjing Agricultural University). Master's Thesis. doi:10.27244/d.cnki.gnjnu.2018.000040
Zhang, X. F., Wang, R. S., Li, Z. G., Li, F., Wu, J. S., Huang, J. L., et al. (2011). Comprehensive Assessment of Urban Ecological Risks: the Case of Huaibei City. Acta Ecol. Sin. 31 (20), 6204–6214. doi:10.1016/j.chnaes.2011.07.006
Zhao, Z., Sharifi, A., Dong, X., Shen, L., and He, B.-J. (2021). Spatial Variability and Temporal Heterogeneity of Surface Urban Heat Island Patterns and the Suitability of Local Climate Zones for Land Surface Temperature Characterization. Remote Sens. 13 (21), 4338. doi:10.3390/rs13214338
Zheng, Y., Zhang, P. T., Zhao, L., and Zhao, X. (2018). The Effects of Land Use Change on Habitat Quality in Changli Country Based on Invest Model. Chin. J. Agric. Resour. Regional Plan. 39 (7), 121–128.
Keywords: ecological resilience, spatial-temporal pattern evolution, landscape patterns, integrated assessment, Nanchang city
Citation: Duo L, Li Y, Zhang M, Zhao Y, Wu Z and Zhao D (2022) Spatiotemporal Pattern Evolution of Urban Ecosystem Resilience Based on “Resistance-Adaptation-Vitality”: A Case Study of Nanchang City. Front. Earth Sci. 10:902444. doi: 10.3389/feart.2022.902444
Received: 23 March 2022; Accepted: 11 April 2022;
Published: 10 May 2022.
Edited by:
Jun Yang, Northeastern University, ChinaReviewed by:
Xiao Liu, South China University of Technology, ChinaCopyright © 2022 Duo, Li, Zhang, Zhao, Wu and Zhao. This is an open-access article distributed under the terms of the Creative Commons Attribution License (CC BY). The use, distribution or reproduction in other forums is permitted, provided the original author(s) and the copyright owner(s) are credited and that the original publication in this journal is cited, in accordance with accepted academic practice. No use, distribution or reproduction is permitted which does not comply with these terms.
*Correspondence: Dongxue Zhao, bWFpbHRvOnpoYW9keDA4QGdtYWlsLmNvbQ==
Disclaimer: All claims expressed in this article are solely those of the authors and do not necessarily represent those of their affiliated organizations, or those of the publisher, the editors and the reviewers. Any product that may be evaluated in this article or claim that may be made by its manufacturer is not guaranteed or endorsed by the publisher.
Research integrity at Frontiers
Learn more about the work of our research integrity team to safeguard the quality of each article we publish.