 Feng Zeng1,2,3*
 Meiben Gao
 Yan Zhang
- 1School of Emergency Science, Xihua University, Chengdu, China
- 2Key Laboratory of Geohazard Prevention of Hilly Mountains, Ministry of Natural Resources, Fuzhou, China
- 3Fujian Key Laboratory of Geohazard Prevention, Fuzhou, China
- 4State Key Laboratory of Geohazard Prevention and Geoenvironment Protection, Chengdu University of Technology, Chengdu, China
- 5The Center of National Railway Intelligent Transportation System Engineering and Technology, China Academy of Railway Sciences Corporation Limited, Beijing, China
The post-peak behavior and fracture characteristics of hard rock are correlated with the stability and bearing capacity of engineering rock mass. However, there are relatively few research studies on the post-peak mechanical behavior and fracture characteristics of hard rock under true triaxial stress. Therefore, this study carried out relevant true triaxial compression tests and acoustic emission (AE) monitoring. It is concluded that under a true triaxial condition, the number of post-peak steps increases first and then decreases with the increasing σ2, which implies that the rock failure evolves from shear failure to a more complex tension–shear mixed failure and finally evolves into a failure mode dominated by tensile failure. The overall level of the rock fracture angle (θ) at low σ3 is higher than that at high σ3. In the range of stress level in this study, when σ3 is high, the fracture angle of granite increases with increasing σ2, and its regularity is obvious, while when σ3 is low, the regularity of the fracture angle increases with the increasing σ2 is not obvious. It is found that there are three different types of cracking processes in granite. Meanwhile, the expansion rates of three different racking types are calculated by simplified treatment, which are about the order of 10−5–10–4 m/s. The research results of this study could supply a useful reference for the understanding of deep hard rock fracture behavior.
1 Introduction
With the increasing excavation depth of deep underground engineering in the world, the influence of high ground stress and complex geological environments on deep rock mass is increasing. Geological disasters such as spalling and rock burst occur frequently, which seriously restrict the development of deep underground engineering in the world (Martin et al., 1999; Feng, 2011; Li et al., 2017; Gong et al., 2019; Gao et al., 2021). The study of the failure and instability of deep rock mass through true triaxial tests is helpful to study the occurrence and mechanism of engineering rock mass disasters such as spalling and rock burst (Haimson and Chang, 2000; He et al., 2010; Li et al., 2015; Feng et al., 2016; Lu et al., 2020; Feng et al., 2021). Therefore, it is of great significance to research the mechanics and fracture behavior of hard rock under a true triaxial stress condition deep underground by the true triaxial test.
The mechanical properties of rocks are usually influenced by many factors such as lithology, stress state, loading mode and loading rate, water pressure, and temperature. Generally, when the rock object to be studied is selected, the stress state is the most important factor affecting the mechanical behavior of rock. At the moment, the rock’s mechanical properties are mostly carried out by the uniaxial test and the conventional triaxial test. Generally, when the studied rock is in the shallow strata, the conventional triaxial test or even uniaxial test can be used to simulate the stress state of this shallow part. However, when in deep strata, uniaxial or conventional triaxial tests cannot simulate the high true three-dimensional stress state of the deep strata, so the deep rock mechanics research based on the true triaxial test is the trend of rock mechanics development in the future.
Acoustic emission (AE) is the phenomenon of a transient elastic wave which is produced by the energy released during the evolution of a microcrack when rock failure occurs (Lockner, 1993). The evolution process of crack initiation, propagation, and coalescence can be analyzed by AE signals generated in different deformation and failure periods of rock (Tuncay and Ulusay, 2008; Fortin et al., 2011; Rück et al., 2017). Real-time AE monitoring based on the rock cracking process can realize the quantitative study of the rock fracture process.
At present, there are few studies on AE of rocks under the true triaxial stress state. Combining the AE source location results with actual failure morphology, the cracking evolution of rock under the true triaxial stress state can be realized. The research derived from the AE location results can achieve the research on spatial shape, propagation rate and direction, and the evolution process of the cracks (Ohtsu, 1991; Lei et al., 2000; Thompson et al., 2005). Therefore, the study of rock mechanical behavior and AE characteristics under true triaxial stress state can help us understand the cracking characteristics and mechanical properties of deep rock mass and lay a solid study foundation for the research of disaster-causing processes and mechanisms of deep rock mass.
2 True Triaxial Compression Test and Acoustic Emission Monitoring Methods
2.1 Sample Preparation
As shown in Figure 1, the granite selected in this experiment is monzogranite from Gansu Province, China (Zhang et al., 2019; Zhang, 2020). According to the testing average value of a group of rock samples, the density of granite is 2.61 g/cm3, the average P-wave velocity is 3,590 m/s, the uniaxial compressive strength (UCS) is 141 MPa, Poisson’s ratio is about 0.27, and Young’s modulus is about 54 GPa.
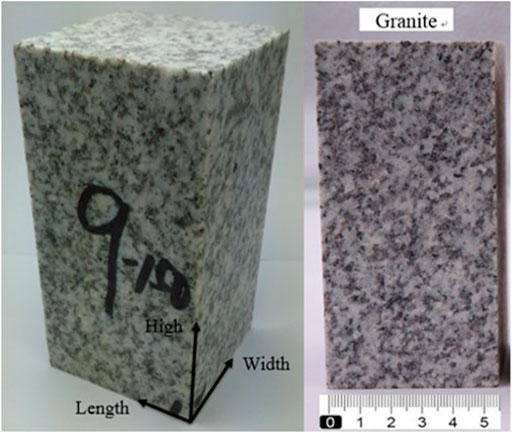
FIGURE 1. Granite tested in the true triaxial compression experiment.
As shown in Figure 2, it is observed by an optical microscope that the rock is granular mosaic, consisting mainly of about 40% plagioclase, 33% quartz, 17% K-feldspar, and 10% other substances.
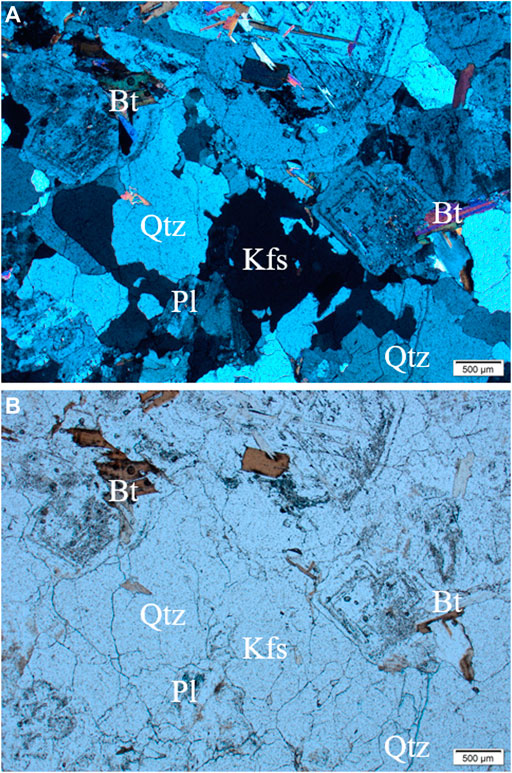
FIGURE 2. Optical micrograph of tested granite. (A) Crossed polars (B), plane polarized light [quartz (Qtz), K-feldspar (Kfs), plagioclase (Pl), and biotite (Bt)].
2.2 Testing Apparatus
The main experimental apparatus used in this study includes a true triaxial test system (Feng et al., 2016) and AE system (Zhang et al., 2019). The true triaxial testing machine can achieve the whole stress–strain curve of rock under loading or unloading stress paths. It can accommodate a 50 × 50 × 100-mm3 cuboid sample. The maximum principal stress (σ1) and intermediate principal stress (σ2) are exerted by a hydraulic driving piston, and the minimum principal stress (σ3) is exerted by hydraulic oil in the true triaxial chamber. The maximum output stresses σ1, σ2, and σ3 can reach 1,200 MPa, 1,200 MPa, and 100 MPa, respectively.
The AE monitoring threshold value is set to be 40–50 dB in the experiment of this study. In this experiment, eight high-frequency AE sensors are encapsulated in a small anti-hydraulic protective shell and are fixed on the surface of the rock sample by a sealant to carry out AE data monitoring and acquisition. During the test, the AE monitoring is matched with the recording time of the stress–strain curve, and the rock fracture information is monitored in the whole process.
2.3 Testing Plan and Adopted Stress Path
Through a large number of statistical analyses of the research literature on in situ stress in the study area, within the range of 700 m underground, the maximum horizontal ground stress σH is about 4.5–27.0 MPa, the minimum horizontal ground stress σh is about 2.6–13.1 MPa, and the vertical crustal stress σV is about 0–27.0 MPa.
In order to better analyze the mechanical behavior of the tested rock under different depths and different ground stress conditions, the true triaxial stress level of this study is determined by considering the relevant engineering background and the characteristics of the true triaxial test as follows:
The minimum principal stress σ3 is 5, 10, 20, and 30 MPa, respectively. When σ3 is 5 MPa, the corresponding σ2 is 5, 20, 50, 75, and 100 MPa, respectively. When σ3 is 10 MPa, the corresponding σ2 is 10 MPa, 20 MPa, 50 MPa, 75, and 100 MPa, respectively. When σ3 is 20 MPa, the corresponding σ2 is 20, 50, 75, and 100 MPa, respectively; when σ3 is 30 MPa, the corresponding σ2 is 30, 50, 75, and 100 MPa, respectively. Meanwhile, some supplementary experiments are carried out according to the actual situation.
The stress path taken in this study is shown in Figure 3:
(1) Load simultaneously in each stress direction to the σ3 level with a loading rate of 0.5 MPa/s (σ1 = σ2 = σ3).
(2) σ3 remains unchanged, σ1 and σ2 are simultaneously loaded to the set σ2 level with a loading rate of 0.5 MPa/s (σ1 = σ2).
(3) σ2 and σ3 remain unchanged, and σ1 is loaded with a loading rate of 0.5 MPa/s. When σ1 comes near the rock crack damage stress σcd, the control method is varied from stress control to strain control to achieve the rock post-peak curve, and the rate of ε1 strain control is 0.015 mm/min.
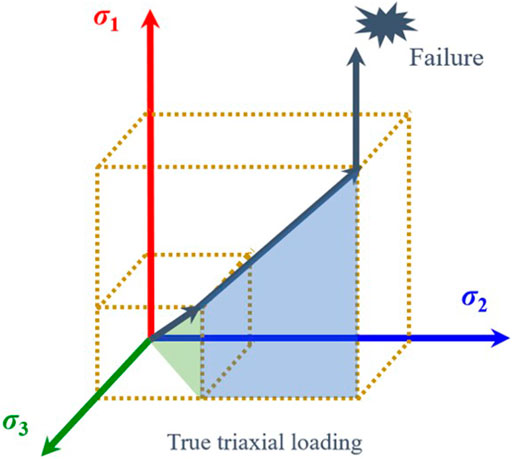
FIGURE 3. Adopted true triaxial loading stress paths of tested rocks.
3 Post-Peak Characteristics of Hard Rock Under True Triaxial Compression Test
The post-peak stress drop is a phenomenon where the bearing capacity of a rock drops rapidly and then rises slightly after reaching the peak value. It is shown in the curve shape that the stress–strain curve drops rapidly and then rises and then falls again. Based on the stress–strain curve of the granite rock under the true triaxial compression condition, this section analyzes variation law of the post-peak steps and brittle stress drop characteristics. It is concluded that when σ3 is small (σ3 = 5 MPa) or large (σ3 = 30 MPa), the number of post-peak steps of granite increases first and then decreases with increasing σ2. With the increase in σ2, the post-peak curve shape tends to become a type II curve, and its brittle failure characteristics are more obvious with the increase in σ2.
It can be seen from Figure 4 that when σ3 is 5 MPa and σ2 is 5, 20, 50, and 100 MPa, the post-peak step numbers during the whole stress–strain curve of the granite is 0, 2, 3, and 1, respectively. Figure 5 shows that when σ3 is 30 MPa and σ2 is 5, 20, 50, and 100 MPa, the number of the post-peak steps during the complete stress–strain curve of the granite is 1, 1, 2, and 0, respectively. Obviously, with increasing σ2, the number of post-peak steps of granite increases first and then decreases, the shape of post-peak curve tends to be a type II curve, and the brittle failure characteristics of the rock are more obvious.
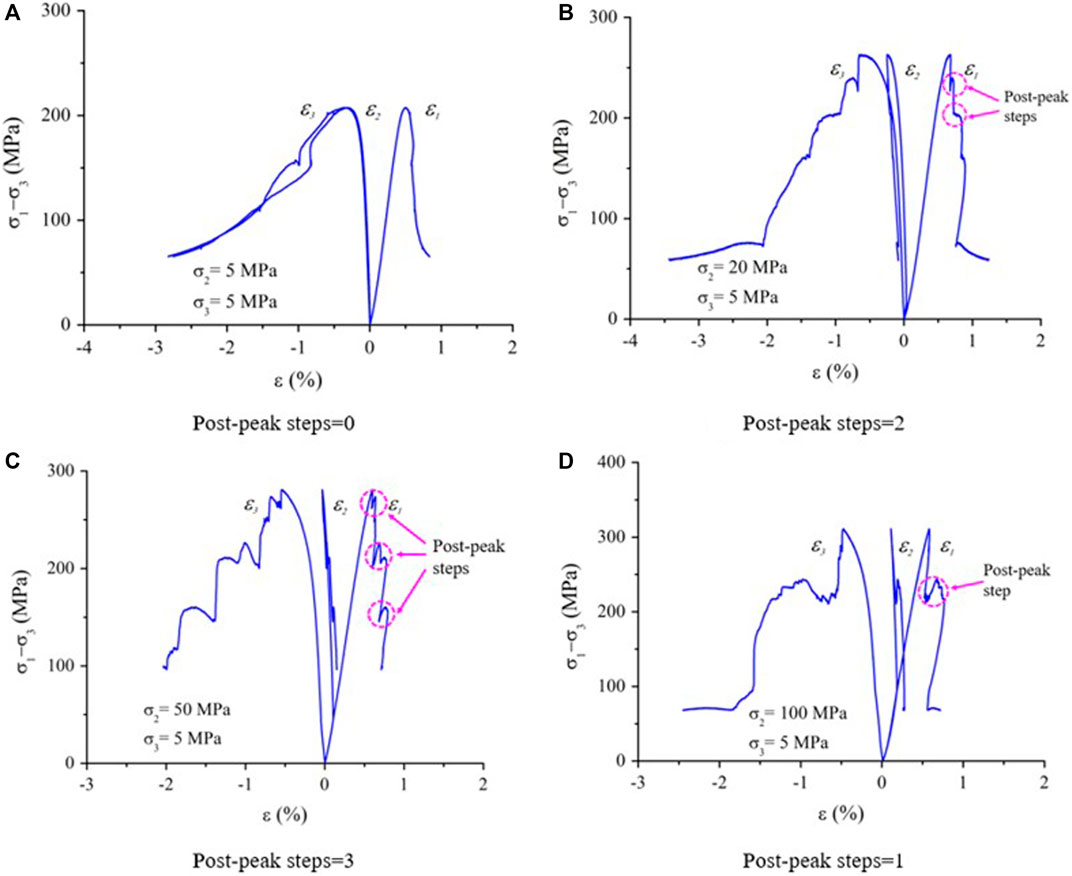
FIGURE 4. Step number at post-peak increases first and then decreases with the increase in σ2 (σ2 = 5 MPa). The post-peak steps is indicated by a dotted circle in the figure.
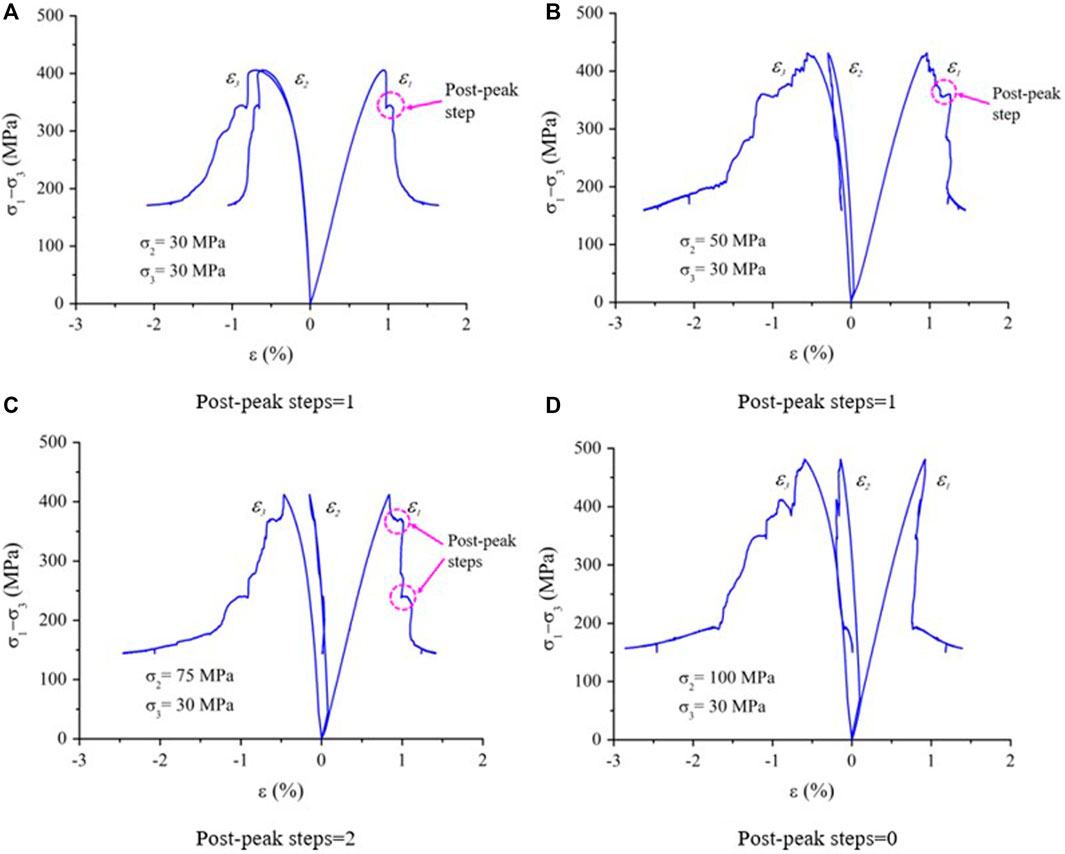
FIGURE 5. Step number at the post-peak increases first and then decreases with the increase in σ2 (σ2 = 30 MPa). The post-peak steps is indicated by a dotted circle in the figure.
The periodic post-peak stress drop, that is, the brittle stress drop of the rock’s post-peak curve, is related to the alternating interaction between the tensile failure and the shear failure during the post-peak failure. It is generally believed that brittle stress drop is caused by tensile failure, and the post-peak curve steps are a process of shear failure. Therefore, the number of post-peak steps increases first and then decreases with the increasing σ2, which means that the post-peak failure process of the rock is more complex with the increase in σ2. From the evolution process of post-peak curves of Figures 4, 5, it indicates that with the increasing σ2, the internal failure of the rock changes from shear failure to a more complex tensile–shear mixed failure, and eventually evolves into a failure mode dominated by tensile failure (Zhang, 2020).
4 Failure Mode of Hard Rock Under True Triaxial Compression Test
Figures 6–9 are the diagrams of the failure mode of granite rock under true triaxial compression changing with σ2 under different σ3 (Zhang, 2020). Figure 10 is the diagram and statistics of the fracture angle of granite under true triaxial compression. At the same time, the example of a typical rock sample in Figure 10 shows the definition of the fracture angle under true triaxial compression: the actual failure of the rock samples in true triaxial test forms a failure surface intersected with σ1–σ2 plane, perpendicular or approximately perpendicular to the σ1–σ3 plane (Mogi, 1971; Haimson, 2006; Mogi, 2007). In practice, the angle of failure surface (θ) can be expressed by the angle between the macroscopic main crack and the loading direction of σ3, that is, the fracture angle (θ).
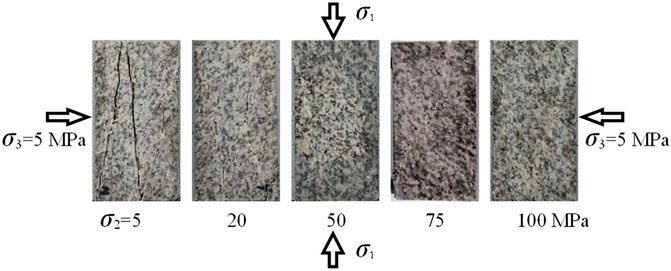
FIGURE 6. Failure modes of tested granite change with σ2 when σ3 is 5 MPa.
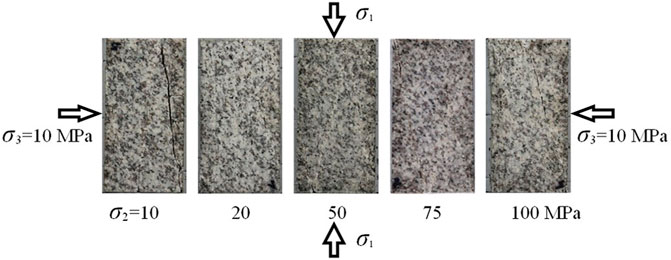
FIGURE 7. Failure modes of tested granite change with σ2 when σ3 is 10 MPa.
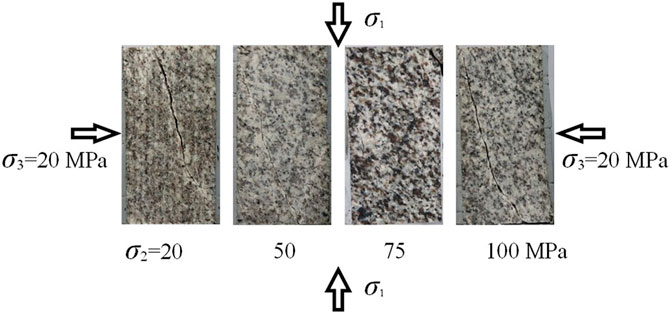
FIGURE 8. Failure modes of tested granite change with σ2 when σ3 is 20 MPa.
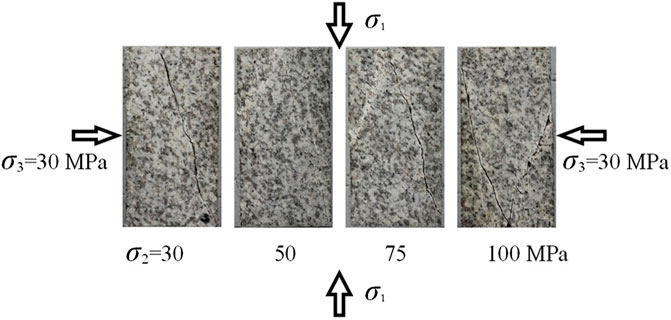
FIGURE 9. Failure modes of tested granite change with σ2 when σ3 is 30 MPa.
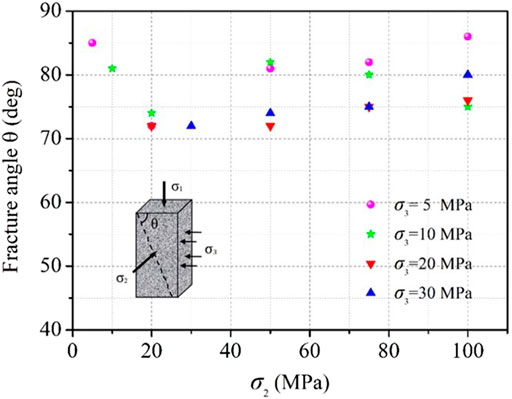
FIGURE 10. Fracture angles of tested granite change with σ2 under different σ3 stress states.
Since the actual failure of rock samples under true triaxial compression forms a failure surface perpendicular or approximately perpendicular to the σ1–σ3 plane, although Figures 6–9 show only the failure situation of the σ1–σ3 plane of the rock samples, it is considered that it can represent the failure situation and characteristics of rock samples in space. As shown in Figures 6–9, the macroscopic main cracks of most granite rocks pass through the corner of the sample and penetrate the whole sample.
Combined with Figures 6–10, it is found that the failure mode of granite is more inclined to tensile failure when σ3 is lower (σ3 = 5 MPa) than that when σ3 is higher, and the overall level of fracture angle (θ) value is higher than that of other σ3 stress levels, and the number of macroscopic cracks in the σ1–σ3 plane is relatively large. When σ3 is high (σ3 = 20 MPa, 30 MPa), most samples have only one macroscopic main crack and the fracture angle (θ) is generally low. When σ3 is 10 MPa, the fracture angle fluctuation of rock samples increases and is irregular, which may be because σ3 = 10 MPa is the critical value range of granite failure mode from tensile failure to shear failure.
Many previous studies have been done on the variation of rock fracture angle with σ2. Haimson and Chang (2000) believed that fracture angle of Westerly granite monotonically increases with the increasing σ2 under the condition that σ3 is constant. Ma and Haimson (2016) found that when σ2 increases to σ2 greater than σ3, the failure plane angles of Coconino and Bentheim sandstones also increased. Moreover, some other studies have the same view (Mogi, 1971; Chang and Haimson, 2012). Feng et al. (2016) believed that the fracture angle of the rock under true triaxial stress would first increase and then decrease with the increasing σ2.
The variation of granite rock fracture angle with σ2 in this article is shown in Figure 10. In the range of the stress level in this article, when σ3 is high (σ3 = 20 MPa, 30 MPa), the fracture angle of granite increases with the increasing σ2, and the regularity is obvious. When σ3 is low (σ3 = 5 MPa, 10 MPa), the regularity of the fracture angle increasing with σ2 is not obvious.
5 Estimation of Rock Crack Propagation Rate Based on Acoustic Emission Location
The AE source localization technology can be applied to research the spatial distribution and development characteristics of cracks during rock failure. Figures 11, 12 show the AE source location and the actual failure process of granite samples under true triaxial condition (σ2 = 75 MPa, σ3 = 20 MPa). By comparing the actual crack distribution of the rock sample in Figure 11 with corresponding AE source location results, it is found that they are in good agreement with each other, which shows that AE source location results can basically indicate the morphological characteristics and cracking evolution process of the rock sample during the final failure.
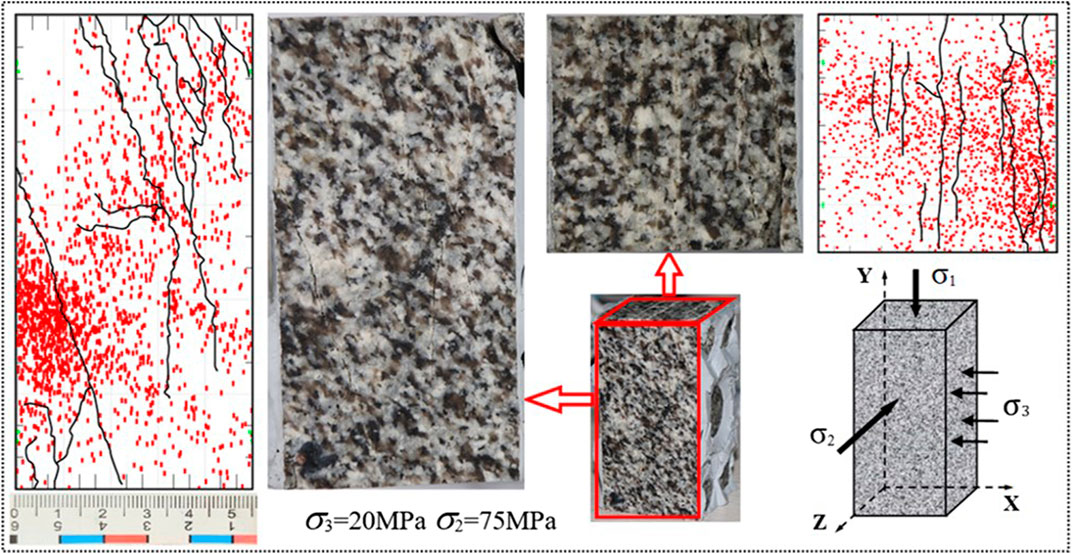
FIGURE 11. Comparison diagram of final failure mode, acoustic emission source location results, and crack sketch of tested granite under the true triaxial stress state.
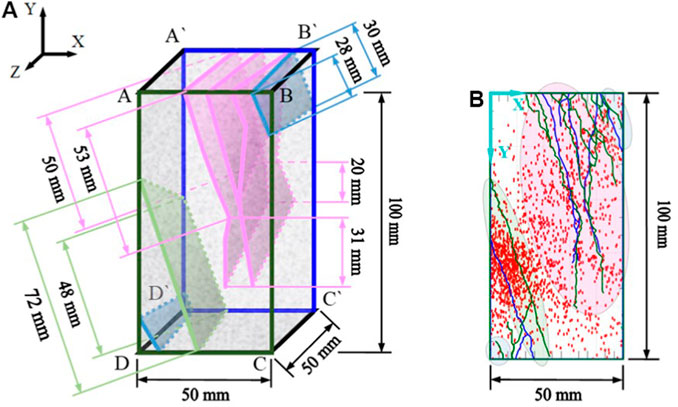
FIGURE 12. Display of the three-dimensional crack failure morphology of tested granite under true triaxial stress state. (A) 3-dimensional failure morphology and (B) 2-dimensional failure morphology.
The different colors corresponding to the elliptical area in Figure 12 represent the formation process of different rock samples in the test monitoring. Comprehensively considering the temporal and spatial distribution characteristics of macro and micro cracks during the final rock failure, and according to the differences of crack propagation time and formation process of rock samples, the cracks in the four elliptical areas in the figure are divided into three different types, and the elliptical areas are distinguished by three different colors of red, blue, and green, respectively. This part attempts to estimate the cracking surface expansion rates of these three different fracture forms, and further analyzes the differences in the formation process of three typically different cracking processes of rock from the perspective of fracture surface expansion rates.
Figure 12 shows the two-dimensional and three-dimensional displays of the shape and size of the rock cracking surface, where the cracks on the plane ABCD and plane A`B`C`D` are shown in the X-Y plane through the perspective map from the negative direction of the Z axis.
For the cracks shown in the blue elliptical region on the X-Y plane in Figure 12B, the cracks in the region above the right corner of the sample are selected for calculation. Figure 12A shows the spatial morphology of the crack. After accurate measurement, the lengths of the cracking surface on the plane ABCD and plane A`B`C`D` are 28 and 30 mm, respectively. For convenient calculation, the average value of 29 mm is taken to represent the propagation length of the cracking surface. Based on the AE localization results, the initial time of the crack is 1,250 s, and the final formation time of the crack is 1,625 s, with a time difference of 375 s. It can be considered that the extension time of the cracking surface is 375 s. Therefore, the expansion rate of the cracking surface can be estimated to be 77.3 μm/s.
Similarly, for the broken zone composed of multiple macro and micro cracks in the red elliptical region in Figure 12B, due to the complex evolution process of rock micro cracks in this progressive failure process, different micro cracks interact and connect with each other, and the distribution range is relatively wide.
Therefore, in order to estimate the cracking surface expansion rate, reasonable assumptions are needed to simplify the analysis process. It is considered that the main macroscopic cracking surfaces in the region are formed at the same time as shown in Figure 12A, and one of the longest cracking surfaces is selected for calculation. The lengths of the cracking surface on the plane ABCD and plane A`B`C`D` are 84 and 70 mm, respectively, with an average of 77 mm. At the same time, the test monitoring shows that the progressive cracking process of the cracks runs through the whole test process and the period is long. Therefore, 365 and 3,348 s corresponding to the time before and after the cracking formation are selected as the starting and ending points for calculating the propagation time of the cracking surface, and the difference between the two is 2,983 s. The calculated expansion rate of the cracking surface is about 25.8 μm/s.
For the single macroscopic cracking surface formed in the green elliptical region in Figure 12B, the lengths of the cracking surface on the plane ABCD and plane A`B`C`D` are 72 and 48 mm, respectively, with an average of 60 mm. By using the AE localization analysis, it is found that the cracking process extends from one end to the other end of the macroscopic cracking surface. The experimental monitoring shows that the starting and ending points of the macroscopic cracking surface expansion time are 365 and 1,625 s, respectively, and the difference is 1,260 s. Therefore, the expansion rate of the cracking surface can be estimated to be 47.6 μm/s.
6 Discussion
It should be pointed out that the crack morphology is very different in practice, the evolution process of crack propagation is very complex, and the propagation process of the cracking surface in three-dimensional space is more complex. It is very difficult to accurately measure the expansion rate of the cracking surface. Therefore, this article determines the length of macro cracks by forming a two-dimensional spatial cracking surface and calculating the average value. At the same time, due to the continuous evolution process of rock cracks, it is subjective to determine the initiation and termination time of the rock cracking surface, which will lead to errors in calculation of the cracking surface expansion time. In addition, the expansion of the spatial cracking surface does not necessarily develop from one end to the other, but may simultaneously propagate and connect with each other from multiple locations inside the rock to form a macroscopic cracking surface. Therefore, the expansion rate of the cracking surface in this article is only a ratio of the average projection length of the final macroscopic cracking surface on the two-dimensional plane and its expansion time, and does not pay attention to the specific expansion form and process of the cracking surface. In this article, the expansion rates of three typical cracking surfaces are 77.3 μm/s, 25.8 μm/s, and 47.6 μm/s, respectively. Therefore, it can be considered that the cracking expansion rate of granite within the scope of this study is about the magnitude of 10−5–10–4 m/s.
7 Conclusion
(1) Under true triaxial condition, the number of post-peak steps increases first and then decreases with increasing σ2. It is generally believed that the brittle stress drop is caused by tensile failure, and the post-peak steps are caused by shear failure. This means that the post-peak failure of the rock becomes more complex with the increase in σ2, indicating that with increasing σ2, the rock failure evolves from shear failure to a more complex tension–shear mixed failure and finally evolves into a failure mode dominated by tensile failure.
(2) The overall level of the fracture angle (θ) of granite at low σ3 is higher than that at high σ3, and the number of macroscopic cracks is relatively large in the σ1–σ3 plane. When σ3 is high, most samples have only one macroscopic main crack, and the fracture angle (θ) is generally low. In the range of the stress level in this article, when σ3 is high, the fracture angle of granite increases with increasing σ2, and the regularity is obvious, while when σ3 is low, the regularity of the fracture angle increases with increasing σ2 is not obvious.
(3) According to the difference of crack propagation time and formation process, it is found that there are three different types of cracking processes in granite. At the same time, the expansion rates of the three different racking types are calculated by a simplified treatment, which are about the order of 10−5–10–4 m/s.
Data Availability Statement
The raw data supporting the conclusion of this article will be made available by the authors, without undue reservation.
Author Contributions
All authors listed have made a substantial, direct, and intellectual contribution to the work and approved it for publication.
Funding
This research was supported by the Science and technology project fund for Returned Students of Sichuan Province in 2021 (No. 212603), Japan Emergency Management Research Center of Xihua University (Nos. RBYJ 2021-008 and RBYJ 2021-005), the Opening Foundation of Key Laboratory of Geohazard Prevention of Hilly Mountains, Ministry of Natural Resources (Fujian Key Laboratory of Geohazard Prevention) (Grant No. FJKLGH 2022K005), the On-campus Talent Introduction Project of Xihua University (Nos. Z212015 and Z201055), the National Natural Science Foundation of China (Grant No. 42107211), and the Center of National Railway Intelligent Transportation System Engineering and Technology (Contract No. RITS2021KF04), China Academy of Railway Sciences Corporation Limited.
The funder was not involved in the study design, collection, analysis, interpretation of data, the writing of this article or the decision to submit it for publication.
Acknowledgments
The authors sincerely acknowledge the support from Key Laboratory of Ministry of Education on Safe Mining of Deep Metal Mines, Northeastern University.
Conflict of Interest
YY was employed by the China Academy of Railway Sciences Corporation Limited.
The remaining authors declare that the research was conducted in the absence of any commercial or financial relationships that could be construed as a potential conflict of interest.
Publisher’s Note
All claims expressed in this article are solely those of the authors and do not necessarily represent those of their affiliated organizations, or those of the publisher, the editors, and the reviewers. Any product that may be evaluated in this article, or claim that may be made by its manufacturer, is not guaranteed or endorsed by the publisher.
References
Chang, C., and Haimson, B. (2012). A Failure Criterion for Rocks Based on True Triaxial Testing. Rock Mech. Rock Eng. 45, 1007–1010. doi:10.1007/s00603-012-0280-8
Feng, X.-T., Zhang, X., Kong, R., and Wang, G. (2016). A Novel Mogi Type True Triaxial Testing Apparatus and its Use to Obtain Complete Stress-Strain Curves of Hard Rocks. Rock Mech. Rock Eng. 49 (5), 1649–1662. doi:10.1007/s00603-015-0875-y
Feng, X. T., Wang, Z. F., Zhou, Y. Y., Yang, C. X., Pan, P. Z., and Kong, R. (2021). Modelling Three-Dimensional Stress-dependent Failure of Hard Rocks[J]. Acta Geotech. 16 (11–12), 1–31. doi:10.1007/s11440-020-01110-8
Fortin, J., Stanchits, S., Vinciguerra, S., and Guéguen, Y. (2011). Influence of Thermal and Mechanical Cracks on Permeability and Elastic Wave Velocities in a Basalt from Mt. Etna Volcano Subjected to Elevated Pressure[J]. Tectonophysics 503 (1), 60–74. doi:10.1016/j.tecto.2010.09.028
Gao, Y. H., Wang, K. Z., and Zhou, C. (2021). A Numerical Study on True Triaxial Strength and Failure Characteristics of Jointed Marble. Acta Geotech. doi:10.1007/s11440-021-01300-y
Gong, F.-q., Si, X.-f., Li, X.-b., and Wang, S.-y. (2019). Experimental Investigation of Strain Rockburst in Circular Caverns under Deep Three-Dimensional High-Stress Conditions. Rock Mech. Rock Eng. 52, 1459–1474. doi:10.1007/s00603-018-1660-5
Haimson, B., and Chang, C. (2000). A New True Triaxial Cell for Testing Mechanical Properties of Rock, and its Use to Determine Rock Strength and Deformability of Westerly Granite. Int. J. Rock Mech. Min. Sci. 37, 285–296. doi:10.1016/s1365-1609(99)00106-9
Haimson, B. (2006). True Triaxial Stresses and the Brittle Fracture of Rock. Pure Appl. Geophys. 163, 1101–1130. doi:10.1007/s00024-006-0065-7
He, M. C., Miao, J. L., and Feng, J. L. (2010). Rock Burst Process of Limestone and its Acoustic Emission Characteristics under True-Triaxial Unloading Conditions. Int. J. Rock Mech. Min. Sci. 47, 286–298. doi:10.1016/j.ijrmms.2009.09.003
Lei, X. L., Nishizawa, O., Kusunose, K., Cho, A., Satoh, T., and Nishizawa, O. (2000). Compressive Failure of Mudstone Samples Containing Quartz Veins Using Rapid AE Monitoring: the Role of Asperities[J]. Tectonophysics 328 (3), 329–340. doi:10.1016/s0040-1951(00)00215-8
Li, X., Du, K., and Li, D. (2015). True Triaxial Strength and Failure Modes of Cubic Rock Specimens with Unloading the Minor Principal Stress. Rock Mech. Rock Eng. 48 (6), 2185–2196. doi:10.1007/s00603-014-0701-y
Li, X., Tao, M., Wu, C., Du, K., and Wu, Q. (2017). Spalling Strength of Rock under Different Static Pre-confining Pressures. Int. J. Impact Eng. 99, 69–74. doi:10.1016/j.ijimpeng.2016.10.001
Lockner, D. (1993). The Role of Acoustic Emission in the Study of Rock Fracture. Int. J. Rock Mech. Min. Sci. Geomech. Abstr. 30 (7), 883–899. doi:10.1016/0148-9062(93)90041-b
Lu, J., Yin, G., Zhang, D., Gao, H., Li, C., and Li, M. (2020). True Triaxial Strength and Failure Characteristics of Cubic Coal and Sandstone under Different Loading Paths. Int. J. Rock Mech. Min. Sci. 135, 104439. doi:10.1016/j.ijrmms.2020.104439
Ma, X., and Haimson, B. C. (2016). Failure Characteristics of Two Porous Sandstones Subjected to True Triaxial Stresses. J. Geophys. Res. Solid Earth 121, 6477–6498. doi:10.1002/2016jb012979
Martin, C. D., Kaiser, P. K., and Mccreath, D. R. (1999). Hoek-Brown Parameters for Predicting the Depth of Brittle Failure Around Tunnels. Can. Geotech. J. 36 (1), 136–151. doi:10.1139/t98-072
Mogi, K. (1971). Fracture and Flow of Rocks under High Triaxial Compression. J. Geophys. Res. 76, 1255–1269. doi:10.1029/jb076i005p01255
Ohtsu, M. (1991). Simplified Moment Tensor Analysis and Unified Decomposition of Acoustic Emission Source: Application to In Situ Hydrofracturing Test. J. Geophys. Res. 96 (B4), 6211–6221. doi:10.1029/90jb02689
Rück, M., Rahner, R., Sone, H., and Dresen, G. (2017). Initiation and Propagation of Mixed Mode Fractures in Granite and Sandstone[J]. Tectonophysics 717, 270–283. doi:10.1016/j.tecto.2017.08.004
Thompson, B. D., Young, R. P., and Lockner, D. A. (2005). Observations of Premonitory Acoustic Emission and Slip Nucleation during a Stick Slip Experiment in Smooth Faulted Westerly Granite. Geophys. Res. Lett. 32, L10304. doi:10.1029/2005gl022750
Tuncay, E., and Ulusay, R. (2008). Relation between Kaiser Effect Levels and Pre-stresses Applied in the Laboratory. Int. J. Rock Mech. Min. Sci. 45 (4), 524–537. doi:10.1016/j.ijrmms.2007.07.013
Keywords: post-peak behavior, acoustic emission, hard rocks, failure mode, expansion rate
Citation: Zeng F, Gao M, Chen F, Yang Y and Zhang Y (2022) Preliminary Study on Post-Peak Behavior and Fracture Characteristics of Hard Rock Under True Triaxial Stress. Front. Earth Sci. 10:897921. doi: 10.3389/feart.2022.897921
Received: 16 March 2022; Accepted: 13 April 2022;
Published: 23 May 2022.
Edited by:
Yunhui Zhang, Southwest Jiaotong University, ChinaReviewed by:
Zhaofeng Wang, Institute of Rock and Soil Mechanics (CAS), ChinaHong Xu, Changsha University of Science and Technology, China
Copyright © 2022 Zeng, Gao, Chen, Yang and Zhang. This is an open-access article distributed under the terms of the Creative Commons Attribution License (CC BY). The use, distribution or reproduction in other forums is permitted, provided the original author(s) and the copyright owner(s) are credited and that the original publication in this journal is cited, in accordance with accepted academic practice. No use, distribution or reproduction is permitted which does not comply with these terms.
*Correspondence: Feng Zeng, emVuZ2ZlbmcyNTIyQDE2My5jb20= Yan Zhang, emhhbmd5YW4yMDIwQGNkdXQuZWR1LmNu