
94% of researchers rate our articles as excellent or good
Learn more about the work of our research integrity team to safeguard the quality of each article we publish.
Find out more
ORIGINAL RESEARCH article
Front. Earth Sci. , 07 October 2022
Sec. Atmospheric Science
Volume 10 - 2022 | https://doi.org/10.3389/feart.2022.897601
 Thuy L. T. Hoang1
 Hung N. Dao2*Phuong T. Cu3Van T. T. Tran1Tuan P. Tong1Son T. Hoang1Vu V. Vuong1Thang N. Nguyen1
Air temperature and humidity have a great impact on public health, leads to heat stress. The US National Weather Service uses temperature and relative humidity to build a heat index (HI) as a metric to identify the thresholds for heat stress as felt by the public. Under climate change conditions and especially in hot humid weather during summer, the number of hot days in Hanoi has increased in recent times. Subsequently, the heat index is rising in both number of occurrences and level of intensity leading to increasing temperature stress on people’s health. The daily heat index for the future was simulated using maximum daily temperature and minimum daily relative humidity based on climate change scenarios. Maximum daily temperature was provided by the climate change model, while minimum daily relative humidity was estimated from the following: maximum daily temperature, mean daily temperature and daily rainfall. Results show that in the future, the heat index will increase by 0.0777°C/year in the RCP 4.5 scenario and 0.08°C/year in the RCP 8.5 scenario. Number of weeks with heat at danger tends to increase to 5.5 weeks/5 year for scenario RCP 4.5, and it is 6 weeks/5 years under RCP 8.5 scenario. In particular, the number of days of heatstroke over a 30-year period (from 1991 to 2020) amounted to only 4, that is an average of 0.13 days of the year, which represents a very rare weather phenomenon in the past. In contrast, under an RCP 4.5 scenario in the future over a 30-year period, the average number of days per year will be 2, 57 days; while the average number of days per year under an RCP 8.5 scenario would be 3, 87 days. This phenomenon will be mainly concentrated in the months of June, July, and August. Projections of this type are a key tool for communities working out how they will adapt to heat stress in the context of climate change.
In recent years, heat waves have occurred on a large scale, and the number of prolonged heat waves has risen (Wang et al., 2016; Luo et al., 2022). Coumou and Robinson (2013) stated that due to climate change, a global temperature increase of approximately 0.5°C compared with temperature in the 1970s has strongly elevated the occurrence-probability of heat extremes on monthly to seasonal time scales. Studies on heat stress and public health have confirmed that climate change will increase the frequency and intensity of heatwaves (Kovats and Hajat, 2008). Im et al. (2017) assessed heat stress based on the heat index of wet thermometers in South Asia (including Vietnam) using data for the period 1976–2005 and climate change scenario data. He examined Wet bulb temperature (Tw), the lowest temperature to which air can be cooled by the evaporation of water into the air at a constant pressure. The results of this study show that wet-bulb temperature tends to increase at the end of the 21st century. Li et al. (2018) examined apparent temperature (AT), a measure of relative discomfort made possible by combined heat and high humidity under climate warming simulations. It emerged that AT has increased faster than air temperature over land. In their study, Zhu et al. (2019) used high-resolution projections and an ensemble of 10 indices to quantify the impacts of climate change on Human-Perceived Temperature Extremes and related perceived extremes. They also set out to address uncertainties in both empirical indices and emission scenarios over China. Recently, Li et al. (2020) stated that rapid warming is occurring in Summer Wet Bulb Globe Temperature in China with Human-Induced Climate Change. Zhu et al. (2021) showed that in the context of climate change, day-night hot extremes in a warming climate increased. Other research also indicates a rapid increase in extreme temperatures, a decline in the number of severe cold spells and an increase in the number of heat waves and droughts in Vietnam (Ha and Tan, 2009; Le et al., 2018). Tai and Quang (2020) recently detected an increase in the perceived temperature and excess heat coefficient through meteorological data in Quang Nam (Vietnam) from 1979 to 2019.
Hot weather can be very detrimental to human health. Many studies have been conducted on heat and its impact on public health. To determine the risk of weather causing people to experience heat stress, many heat stress indices were developed and these can be classified as those based on: physical factors of the environment, thermal comfort assessment; “rational” heat balance equations; and physiological strain (National Weather Service, 2022a). For example, effective temperature is based on equivalent subjective estimates of thermal sensation of the thermal environment with different combinations of air temperature, air velocity, and humidity (Houghten, 1923). Wet Bulb Globe Temperature (WBGT) is based on temperature, humidity, wind, solar radiation, and other weather parameters (National Weather Service, 2022b), while AT is an indicator for the heat-human body and can be calculated directly from standard meteorological variables (Steadman, 1979, 1984). Meanwhile, Heat Index (HI) measures how hot people really feel when relative humidity is factored in with the actual air temperature (National Weather Service, 2021). Heat Index is an indicator that is popular and easy to implement and will be selected for this study.
Wu et al. (2017) evaluated Heat Index in Chinese territory during the years 1961–2014 based on effective temperature (ET), which is an empirically determined index in terms of temperature, humidity and air movement. It relates to the physiological sensation of warmth or cold felt by the human body. The authors divided the temperature levels into: very cold, cold, cool, comfortable, warm, hot, and very hot. The areas with the highest degree of heat stress were around the Ganges and Indus deltas. Zhang et al. (2019) used daily meteorological data including: maximum temperature, relative humidity and wind speed for the period 1960–2016 at more than 500 meteorological stations to evaluate the spatial distribution of heat stress index. The US National Weather Service employs temperature and relative humidity to develop the heat index as a metric for establishing the risk thresholds for heat warnings issued to the public. The NOAA website offers Heat Forecast Tools, and included here is a heat stress assessment hierarchy, which is a map that predicts heat stress risk zones in the United States (National Weather Service, 2021).
In the research by Opitz-Stapleton et al. (2016) a number of different heat indices to determine the degree of heat stress in the context of climate change in Da Nang (Vietnam) were examined. These authors utilized meteorological data series for the period 1970–2011. Their results show that night-time temperatures are still too high after hot days, meaning that recovery of one’s health after a long working day is compromised and leads to heat stress. Ma et al. (2019) reported the impact of temperature extremes on respiratory systems. According to (McGregor and Vanos, 2018), high temperature and humidity, weak wind, and direct sunlight are combinations that weaken the human body’s ability to maintain body temperature, causing heat stress. Kjellstrom et al. (2019a) suggest that the basic environmental factors causing heat stress are temperature, humidity, radiant heat, and air velocity. Furthermore, the elderly, obese, and those with poor health and poorly adapted to high temperature are prone to heat stress. By the year 2030, an increase in heat stress due to climate change will greatly compromise work-related productivity and this means the loss of an equivalent of 80 million full-time jobs (Kjellstrom et al., 2019b). The 1995 Chicago heat wave study showed that during that summer, there were 11% more hospital admissions than average for comparison weeks and 35% more than expected among patients aged 65 years and older (Semenza et al., 1999). Dang et al. (2019) discovered a link between temperature, the number of people hospitalized due to heat stress, mortality in tropical developed countries as well as the ability to adapt to extreme weather conditions. The study by Phung et al. (2017) provides important evidence concerning the expected impacts of extreme weather with reference to climate change, and climate change adaptation programs need to be implemented in the healthcare sector to protect people from the effects of extreme weather events such as heatwaves in Vietnam. Based on the above research, it can be seen that research on heat stress has attracted much scientific attention. However, no future heat stress assessments based on day-to-day scenarios are currently available.
The study by Argüeso et al. (2015) evaluated the relationship between urbanization and heat stress in the context of climate change for Sydney, Australia. Their results show that the expansion of the urban area and the increasing population worsen the risk of heat stress. Luo and Lau (2018) in their analysis show that due to the strong urbanization process in eastern China, heat stress in that region also increases; heat stress in urban areas is always higher than that in rural zones. Urbanization tends to have stronger intensifying effects on heat stress in urban agglomerations with higher population density in low-altitude areas (Luo and Lau, 2021). According to Varentsov et al. (2018) who conducted research on the Moscow, both extensive and intensive urban growth have led to warming of 0.2–0.3°C in the historical city center. They are strongly amplified under heat wave conditions and becoming increasingly noticeable in terms of heat stress conditions. Tai and Quang (2020) recently detected an increase in the perceived temperature and excess heat coefficient through meteorological data in Quang Nam (Vietnam) from 1979 to 2019. Again in Vietnam, Dao (2013) has shown that due to the urban effect in Hanoi, the temperature in the inner city is about 1–2°C higher than the suburban areas, while the relative humidity in the inner city area is higher and the wind speed is weaker in the suburban areas. Based on these findings, urbanization is triggering higher heat stress levels in Hanoi and proving to be increasingly serious.
This research contributes to the knowledge on this subject by building a multivariable regression equation to estimate heat index from meteorological variables under current climate conditions. The equation will estimate the future heat index and evaluate any changes in the heat index for Hanoi, Vietnam. Hanoi is now one of the world’s most populated cities with more than eight million people. Population, socio-economic activities, along with the heat island effect are the factors that make Hanoi experience a higher maximum temperature value than surrounding cities. This study successfully identifies temperature stress in time (month) to help the community adapt to future temperature change conditions. It also introduces measurements for people to cope with this situation. The research was conducted for two climate change scenarios, specifically the average low greenhouse gas emissions (RCP 4.5) and high greenhouse gas emissions (RCP 8.5). These are the latest scenario versions issued by the Ministry of Natural Resources and Environment (MONRE)—CARE in Vietnam in 2020 (Vietnam Center of Hydro-Meteorological Data, 2021).
Hanoi is located in the center of the Red River Delta, at 20°34′–21°18′ North latitude and from 105°17′ to 106°02′ East longitude (Figure 1). The city covers an area of 3,358.6 km2, accounting for 1% of the natural area of the whole country. Most of Hanoi is located in the Red River Delta with an average elevation of 5–20 m above sea level. The hilly areas are concentrated in the north and west of the city with an altitude of 20–400 m. The population of the city in 2020 amounted to 8.2 million people, accounting for 8.5% of the country’s population. The population density is 2,480 people/km2, 8.3 times higher than the average population density of the whole country (General Statistics Office, 2021). Hanoi has a Tropical monsoon climates with hot wet summer and dry cold winter (Nguyen and Nguyen, 2004). The average annual temperature is 24.5°C, while average annual relative humidity is 78.4%. Hanoi’s climate is seasonal with cold winters compared to other cities in the world at the same latitude due to the influence of cold air from the north.
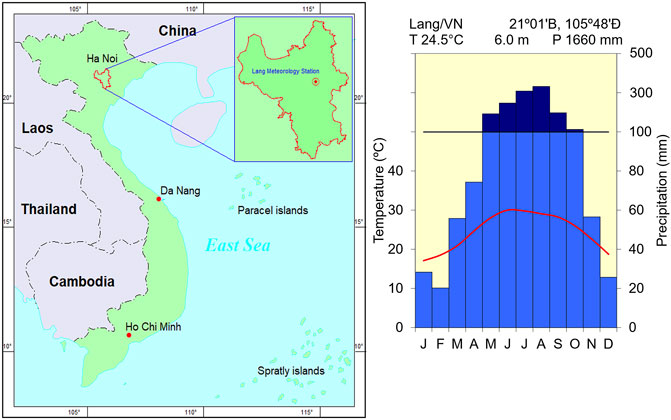
FIGURE 1. Hanoi’s location and climatology.
In this study the following data were used:
– Daily maximum temperature, daily minimum temperature, daily mean temperature, total daily rainfall, daily average relative humidity, daily minimum relative humidity at Lang meteorological station (Hanoi); hourly temperature and relative humidity over a 30-year period: 1991–2020 (Vietnam Center of Hydro-Meteorological Data, 2021).
– Data of daily maximum temperature, daily minimum temperature, daily mean temperature, total daily rainfall according to the average low greenhouse gas emissions scenarios (RCP 4.5) and high greenhouse gas emissions scenarios (RCP 8.5) for the period 2021–2050 issued by the Ministry of Natural Resources and Environment (MONRE)—CARE in Vietnam in 2020 (Vietnam Center of Hydro-Meteorological Data, 2021).
The HI is usually calculated at immediate or hourly stages (Dahl et al., 2019) and the highest HI is the most important factor in health risk. For this reason, it is very important to identify which is the highest value of HI during each day and what variables are significant for estimating this highest HI (HImax). According to Matveev (1976), daily temperature fluctuations on clear days reach their maximum during 03:00 p.m.–04:00 p.m. each day. Daily relative humidity also varied on clear days and has been going in the opposite direction to temperature, reaching its minimum at 03:00 p.m.—04:00 p.m. Analysis of the hourly data series for the period 1991–2020 at Lang meteorological station (Hanoi) discovered that at the highest temperature of the day (95.5% at 03:00 p.m.), this agreed with the smallest relative humidity of 90.7% at 15:00 and highest HI of the day (94% at 03:00 p.m.) (Figure 2). Consequently, the daily maximum temperature (Tmax) and daily minimum relative humidity (RHmin) served to estimate daily maximum heat index HImax values.

FIGURE 2. Daily change in maximum temperature and relative minimum humidity in the period 1991–2020 at lang meteorological station.
The assumption in this research is that Tmax and RHmin are consistently inversely related and that this relationship does not change in the future.
The general algorithms used to estimate HI (Anderson et al., 2013) are shown in Figure 3.where:
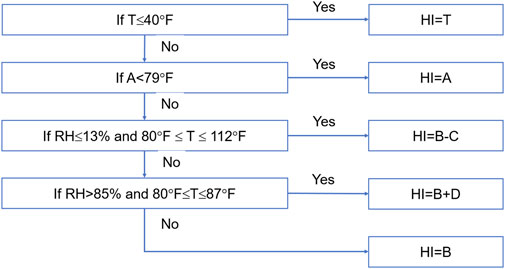
FIGURE 3. Algorithms used to calculate heat index (HI) Anderson et al. (2013).
The above equations require two variables and these are daily temperature and daily relative humidity (RH). The equation was applied to calculate the HImax. In this case, the model variable will be daily maximum temperature and daily minimum relative humidity (RHmin). The daily maximum temperature was issued by the climate change model. However, daily minimum relative humidity is not available in the climate change model and has been estimated by a multivariable linear regression which will be described in the following section.
Heat stress (HImax) values are divided into six categories according to danger level to human health as documented in Table 1 below.
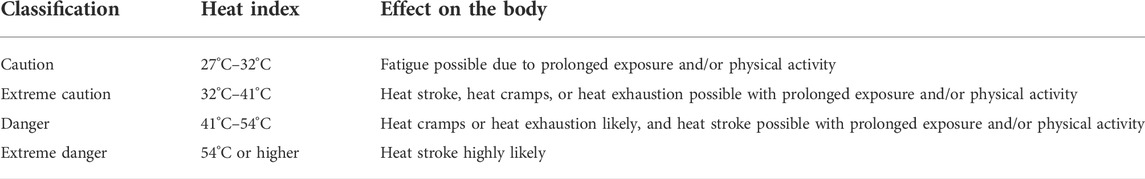
TABLE 1. Heat stress conditions.
In the multivariable regression model (Taylor, 1997), the dependent variable RHmin is described as a linear function of the independent variables, as follows:
where:
a is constant.
The regression coefficient
The period from 01/01/1991 to 31/12/2010 served to calibrate the model parameters while data covering the period 01/01/2011–31/12/2020 was used to validate the model. The model was calculated at daily step.
HImax is calculated based on Tmax and RHmin. In this study, it emerged that there is a good correlation between dependent variable (RHmin) and independent variables (daily maximum temperature, daily mean temperature, daily precipitation). Using SPSS software for data from 1/1/1991 to 31/12/2010, the study derived a regression equation between RHmin and Tmax, Tmean and it is written as follows:
The regression statistic results are summarized below:
- Adjusted R2 = 0.56 meaning that the independent variables can explain 56% of the RHmin. Durbin-Watson value equals 1.11, indicating there is no autocorrelation between independent variables. This is a sound basis for building a complex regression equation between the dependent and independent variables.
- The sig value of the F test for Mean Square is less than 0.05, signifying that the regression model is suitable, while the sig value in the t test of the regression coefficient less than 0.05 confirms that the independent variable affects the dependent variable. Based on the histogram, it is evident that the Regression Standardized Residual mean is close to zero, Std. Dev=1, hence the distribution is approximately normal. The P-P Plot reveals the percentiles in the distribution of the residuals diagonally, and consequently the assumption of normal distribution of the residuals is valid in this case and the regression equation is reliable.
Hence, Eq. 7 can determine the value of daily minimum relative humidity based on daily mean temperature, daily maximum temperature, and daily precipitation. This RHmin can be applied in the algorithms in Figure 3 to calculate HImax for the period from 1/1/1991 to 31/12/2010.
To assess how well the model performed, the model HImax and the “observed” HImax were compared. The observed HImax is calculated by the same algorithm described in Figure 3. However, RHmin is the observed values recorded at the meteorological station instead of the RHmin estimated from the regression equation.
Nash-Sutcliffe model efficiency coefficient (NSE) is an objective function used for evaluating how well the model performs:
where:
The NSE is 0.98 and this reveals there is good agreement between the model and observed HImax (Figure 4). Hence the regression model fits the calibration period.
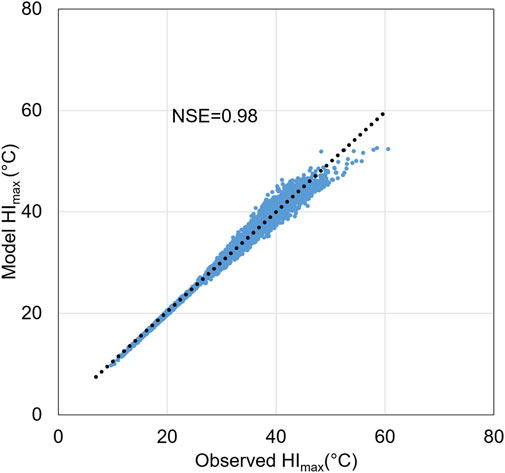
FIGURE 4. Scatter plot between observed HImax and mode HImax for the period 1991–2010.
The model was validated using data for 1/1/2011–31/12/2020. Figure 5 shows scatters between model and observed HImax. There is a good agreement between the observed and model values indicated by NSE of 0.94. Based on these findings, the model can be used to simulate HImax for the future climate change scenarios.
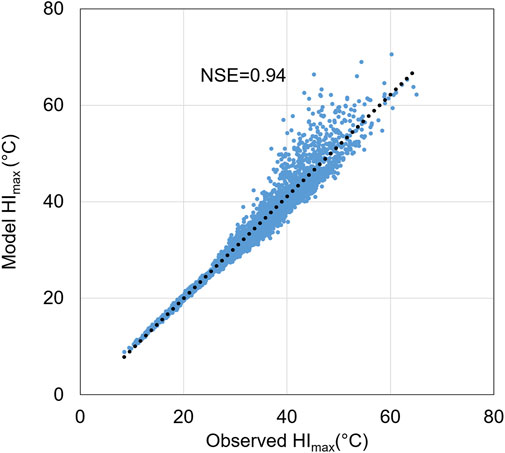
FIGURE 5. Scatter plot between observed HImax and mode HImax for the period 2011–2020.
Daily HImax were calculated under RCP 4.5 and RCP 8.5 scenarios and have been averaged for each year. Average yearly values are plotted in Figure 6.
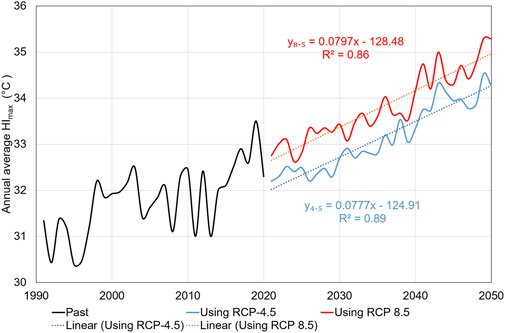
FIGURE 6. Historic and future annual averge HImax showing a linear fit to the trend for 2021–2050 under RCP 4.5 (blue) and RCP 8.5 (red).
The yearly fluctuation and changing trend of HImax according to the historical data, RCP 4.5 and RCP 8.5 scenarios are shown in Figure 6. According to the RCP 4.5 scenario, the linear fit for HImax increase has a coefficient of determination which is R2 = 0.89. This strongly suggests a highly reliable trend for an annual increase in HImax. The results obtained from the regression equation demonstrate that the average annual HImax increases by 0.0777°/year. Under RCP 8.5, it can be seen from Figure 6 that there is a close correlation between the rise of HImax and time with R2 = 0.86, meaning that the annual increase in HImax is reliable. It can be observed from the regression equation that the annual HImax will increase by 0.0797°/year.
In conclusion, in the context of climate change it is estimated that annual HImax will increase between now and 2050. Annual HImax increase according to RCP 8.5 is in 0.002°/year higher than that for RCP 4.5.
Judging by the data series (daily maximum temperature, daily average temperature, daily total rainfall), and based on Eqs 1–4, HImax can be calculated. It was found that the monthly average days with HImax > 41 reached the highest value in June, July, and August at 15–19 days. From November to March there is no day with HImax > 41 (Figure 7). In October, the average number of days with HImax > 41 amounts to only 1.3 days. Thus, it can be seen that HImax exhibits a clear seasonal variation. The largest HImax for the period 1991–2020 is 57.4°C on 6/8/2012. During this day, the daily mean temperature was 26.5°C, the highest temperature of the day is 34.9°C and the lowest relative humidity for that day is 82%. Although the maximum temperature on 6 August 2012 was not the highest during the period 1991–2020, the relative humidity remained high, so any effect on the body was most pronounced during this time.
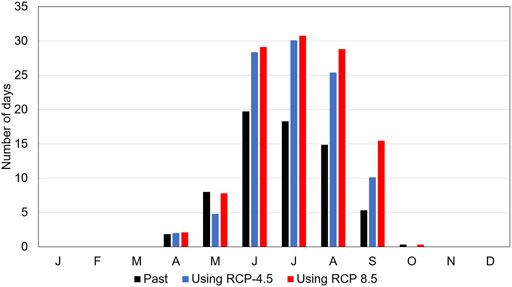
FIGURE 7. Monthly average of number of days having HI > 41 in the period 1991–2020 and in the period 2021–2050 under RCP 4.5 and RCP 8.5.
The main similarity between HImax in the future and in the past is that the highest value of HImax (HImax > 41°C) falls in the months of June, July, and August.
There is a difference between HImax in the future and in the past. The month with the highest number of days with HImax > 41°C in the period 2021–2050 under both scenarios RCP 4.5 and RCP 8.5 falls in July, while for the period 1991–2020 it is in June. Referring to 1991–2020, June has a maximum of about 20 days with HImax > 41°C, but on average for the years 2021–2050, the number of days with HImax > 41°C in months June, July, and August a accounts for more than 25 days.
The number of days having HImax > 54°C over the past 30 years was not obvious, occurring only once in June and three times in August (Figure 8). With four such occurrences in the past, it proves that this phenomenon is simply a rare extreme weather event. The number of days with HImax > 54°C in the period 2021–2050 under the RCP 4.5 scenario, there will be is an average of 2, 57 days of the year while for the RCP 8.5 scenario it will amount to is an average of 3, 87 days of the year, mainly in June, July, and August. There is a particular spike of HI in June, and this is also the month with the highest number of days with HImax > 54°C for the year.
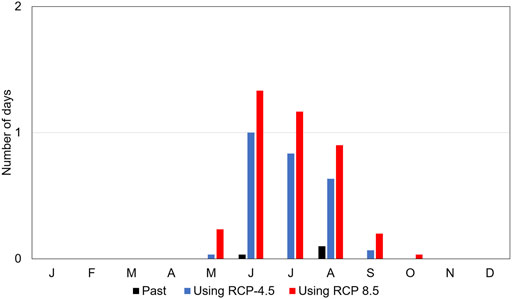
FIGURE 8. Monthly average of number of days having HI > 54 in the period 1991–2020 and in the period 2021–2050 under RCP 4.5 and RCP 8.5.
HImax does not occur between October of the previous year and April of the following year in the RCP 4.5 scenario. Neither does it occur from November of the previous year to April of the following year in the RCP 8.5 scenario.
This study discovered an increasing trend in the number of HImax days at a dangerous level during the period 1991–2020. The number of days with HImax at danger increased from 62 days/year for the decade 1991–2001, rising to 71 days/year for the decade 2001–2010 and 94 days for 2011–2020. This represents an average increase of 9.7 days/year over each decade (Figure 9).
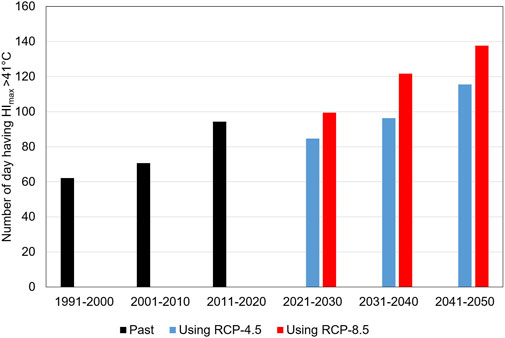
FIGURE 9. Number of days with HImax at dangerous levels in different decades.
Similarly, for the period 2021–2050, it can be observed that for the RCP 4.5 scenario, the average number of HImax days posing a danger rose by 12–19 days/year on average per decade. Meanwhile under the RCP 8.5 scenario, the number of HImax days at dangerous levels increased by an average of 16–23 days/year over each decade.
It is well known that heatwaves do pose a serious danger and particularly for vulnerable people such as the elderly and children. Figure 10 depicts the number of weeks per 5 years where the average HImax is above the upper 41°C (NW5YHI41), which means Danger and Extreme Danger to humans. According to the historical data, NW5YHI41 continuously increased through a 5-year period in the past. In the future, the rise of NW5YHI41 can be seen in Figure 9. According to the RCP 4.5 scenario, the linear fit for NW5YHI41 rise has a coefficient of determination R2 = 0.98, indicating a highly reliable increasing trend in NW5YHI41. The results obtained from the regression equation show that the NW5YHI41 increases by 5.5 weeks every 5 years. Referring to the RCP 8.5 scenario, there is a close correlation between the rise of NW5YHI41 and time with R2 = 0.97, meaning that the annual increase in NW5YHI41 is valid. It can be seen from the regression equation that the NW5YHI41 will increase by 6 weeks every 5 years.
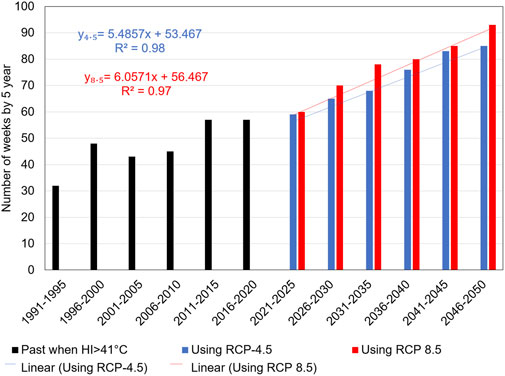
FIGURE 10. Number of weeks every 5 years having an average HImax at dangerous levels in different decades.
In conclusion, in the context of climate change it is estimated that NW5YHI41 will increase between now and 2050. Annual HI increase according to RCP 8.5 is 0.5 weeks every 5 years, which is higher than that for RCP 4.5.
On days with HImax > 54°C which is very dangerous to human health, heatstroke is highly likely to occur. During the period 1991–2020, there were only 4 days with HImax > 54°C, and these happened in 1997, 2012, 2014, and 2015. However, in the 30-year period from 2021 to 2050, under the RCP 4.5 scenario, the number of days with HImax > 51°C was 73 and under RCP 8.5, this number of days was 116. Figure 8 shows that the number of days with HImax > 51°C in the future is rising. Based on yearly maximum values with HImax > 51°C for the period 2021–2050 according to RCP 4.5 and RCP 8.5, a trend line of the number of days with HImax > 51°C was built. The upward trend in the number of days per year under the RCP 4.5 scenario is clearly shown in Figure 11 (blue colour). It is worth noting here that the number of days per year increases by 0.24 and the reliability level is high (R2=0.89). The number of days per year under the RCP 8.5 scenario rises by 0.35 with a high reliability level (R2=0.88). For the RCP 8.5 option, the number of days with HImax > 51°C is 1.6 times higher than under RCP 4.5.
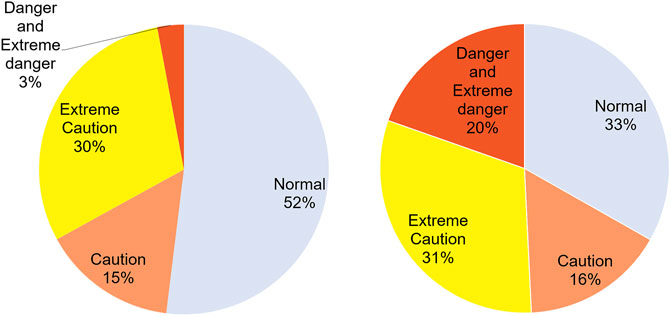
FIGURE 11. Heat index using daily mean temperature and heat index using highest temperature for the period 1991–2020 at lang meteorological ststion (Hanoi).
Hanoi’s climate can be described as one being moist with mild and dry winters, where the winter is not hot, the summer temperature is relatively high, humidity remains high all year round and the heat island effect makes the hot weather in Hanoi increasingly fierce and having a worsening impact on the human body (Dao, 2013). To evaluate the combined effects of heat and humidity on the human body, HI is a widely used index. The aim of the project is to calculate HImax for the future given the encroaching danger posed by climate change. To develop a viable heat index, a temperature and relative humidity context is required, but in the climate change scenario devised by the Vietnam Ministry of Natural Resources and Environment, the relative humidity factor is not available in the climate change model applied to Hanoi. Based on Eq. 7, it is possible to determine the daily minimum relative humidity value based on daily mean temperature, daily maximum temperature, daily minimum temperature and daily precipitation.
Estimates of HImax changes in this paper are projections of what is likely to occur based on the following assumptions.
- Assessment of correlation between daily minimum relative humidity and some meteorological features
The relative humidity (RH) is the ratio of the amount of water vapor actually in the air to the maximum amount of water vapor required for saturation at that particular temperature (Ahrens, 2009). The maximum amount of water vapor required for saturation depends entirely and proportionally on the temperature. If the air mass is considered to be static, assuming the amount of water vapor in the air does not change, when the air temperature reaches the highest point of the day (Tmax), the largest amount of water vapor required for saturation will be respectively the highest, so relative humidity will decrease and reach the lowest value of the day. It can therefore be concluded that Tmax is inversely proportional to RHmin. The higher Tmean, the smaller the difference between Tmean and Tmax, then the less RHmin changes during the day, meaning the Hmin is larger. Thus, it can be reasonably stated that relative humidity value during the day is inversely proportional to Tmax and to Tmean.
- Identifying the highest HI time of the day
A major reason for conducting this study is to evaluate the largest HI fluctuations in the future, as a warning that the health of people in the community must be protected. To do this, it is necessary to choose the highest HI time of the day. The question is asked: when is the highest HI value of the day? Figure 10 shows the difference between HI calculated based on daily mean temperature and daily mean relative humidity (a) and HI calculated based on highest temperature of the day, lowest humidity of the day (b). In case (b) the number of HI days at danger will be higher than case (a). Specifically, according to the calculation for 30 years, in the case based on daily average temperature and humidity values, the number of HI days above normal level is 48%. In the case of calculating HI at the time of the highest temperature of the day, the number of HI days above the normal level is 67%. Similarly, if calculating the number of HI days at danger level during the highest temperature of the day, it is nearly 7 times higher than the case based on the daily mean temperature and humidity values (Figure 11).
Subsequently, it can be determined that HI is highest at the time of the highest temperature and lowest relative humidity during the day.
- Assessing the seasonality of HImax.
Research results show that in the past and future scenarios, from November to March there is no day with HImax > 41°C. The fluctuation in the number of days with HImax at Danger level and Extreme danger follows a general rule for both scenarios. Here the months with the number of HImax days at Danger level and especially Extreme danger are concentrated in June, July, and August. If in the past the Extreme danger level was simply a rare weather phenomenon, it will appear more regularly in the future and mainly during these months. This outcome confirms the distinct seasonality of Hanoi’s climate with winters being greatly influenced by the polar air masses coming from the north.
- Evaluating the research results and potential accuracy
The months June, July, and August experience the most days with HImax > 41°C in a given year. The number of days with HImax > 41°C is likely to increase significantly in the future, for both RCP 4.5 and RCP 8.5 scenarios. The number of days having HImax > 51°C in the future is going to be much more than in the past. From the past to the future, it is observed that number of weeks every 5 years having a weekly average HImax > 41°C increases. The number of days having HImax > 51°C in the past are rare occasions. In the future the number of days having HImax > 51°C will be more than in the past and happen: 1) in most years under the RCP 4.5 scenario; and 2) all years under the RCP 8.5 scenario and the trend will not abate.
Thus, the reality of climate change is very evident in terms of the increasing average annual HI, increasing number of weeks with HImax > 41°C and the number of days with HImax > 54°C. These are days when heatstroke is highly likely to occur, so determining the time pattern and intensity of HI is important in protecting the health of people in the community, especially those who work outdoors, people with cardiovascular disease, high blood pressure and underlying diseases. In June, with the sudden increase in the number of days of extreme danger, people need to protect themselves and the healthcare/medical sector must be prepared when the number of patients suffering from heatstroke spikes. This study will be practical if the research results are combined with the statistics on the number of people who have had a stroke in Hanoi, Vietnam. Its findings can also help officials and policymakers assess the spatial variation of HI in Hanoi and for other cities.
This study classifies HI by evaluating its effects on the human body. Our findings highlight that under both RCP 4.5 and RCP 8.5 scenarios there is an increased risk of HI in both intensity and number of days at danger and extreme danger levels.
The mean annual HImax intensity will increase by 0.0875°C/year under RCP 4.5 and 0.09°C/year under RCP 8.5 in the period 2021–2050. The number of HImax days marked as dangerous is also likely to increase significantly in the future. On average, the number of days with HImax > 41°C in the months of June, July, and August for the years 2021–2050 is greater than for 1991–2020 by about an average of 10 days. A notable feature is that in the past there were only four HI occurrences at the Extreme danger level. The number of days with HImax > 54°C over 2011–2050 under the RCP 4.5 scenario, there will be is an average of 2, 57 days of the year, under the RCP 8.5 scenario, there will amount to is an average of 3, 87 days of the year, mainly concentrated in the months of June, July, and August. Especially the number of days at extreme danger increases very rapidly during the period 2021–2050, increasing to 0.24 day/year for scenario RCP 4.5 and 0.34 day per year for scenario RCP 8.5.
Given the fluctuation of HImax over time, especially when the days that are likely to cause a stroke will be more frequent in the future compared to the past, it is necessary to develop specific plans and policies for infrastructure and medical staff to protect outdoor workers, the elderly, the very young and people with pre-existing medical conditions. The potential risk posed by weather is reflected in the heat index which is getting stronger in intensity during the months of June, July, and August, but especially in June.
The original contributions presented in the study are included in the article/supplementary material, further inquiries can be directed to the corresponding author.
HD: Conceptualisation, methodology, and writing—original draft. TH: Visualisation. PC: Writing—review and editing. TH: Writing—review and editing and data curation. All authors contributed to the article and approved the submitted version.
This research was funded by Vietnam Academy of Science and Technology under grant number VAST 05.01/22-23.
The authors declare that the research was conducted in the absence of any commercial or financial relationships that could be construed as a potential conflict of interest.
All claims expressed in this article are solely those of the authors and do not necessarily represent those of their affiliated organizations, or those of the publisher, the editors and the reviewers. Any product that may be evaluated in this article, or claim that may be made by its manufacturer, is not guaranteed or endorsed by the publisher.
Anderson, G. B., Bell, M. L., and Peng, R. D. (2013). Methods to calculate the heat index as an exposure metric in environmental health research. Environ. health Perspect. 121 (10), 1111–1119. doi:10.1289/ehp.1206273
Argüeso, D., Evans, J. P., Pitman, A. J., and Di Luca, A. (2015). Effects of city expansion on heat stress under climate change conditions. PLoS one 10 (2), e0117066. doi:10.1371/journal.pone.0117066
Coumou, D., and Robinson, A. (2013). Historic and future increase in the global land area affected by monthly heat extremes. Environ. Res. Lett. 8 (3), 034018. doi:10.1088/1748-9326/8/3/034018
Dahl, K., Licker, R., Abatzoglou, J. T., and Declet-Barreto, J. (2019). Increased frequency of and population exposure to extreme heat index days in the United States during the 21st century. Environ. Res. Commun. 1 (7), 075002. doi:10.1088/2515-7620/ab27cf
Dang, T. N., Honda, Y., Van Do, D., Pham, A. L. T., Chu, C., Huang, C., et al. (2019). Effects of extreme temperatures on mortality and hospitalization in Ho Chi Minh city, Vietnam. Int. J. Environ. Res. Public Health 16 (3), 432. doi:10.3390/ijerph16030432
Dao, N. H. (2013). Assessing the impact of traffic on the effect of heat island Hanoi. Vietnam J. Hydro - Meteorology 626, 46–50.
General Statistics Office (2021). “Area, population and population density in 2021 by province,” in Statistical Yearbook of Vietnam (Hanoi: Statistical Publishing House), 89.
Ha, H. T. M., and Tan, P. V. (2009). Magnitude and trends in extreme monthly temperature inVietnam in period of 1961-2007J. Hanoi: Vietnam National University, 412–422.
Im, E.-S., Pal, J. S., and Eltahir, E. A. (2017). Deadly heat waves projected in the densely populated agricultural regions of South Asia. Sci. Adv. 3 (8), e1603322. doi:10.1126/sciadv.1603322
Kjellstrom, T., Maıtre, N., Saget, C., Otto, M., and Karimova, T. (2019a). “Climate change and the rising incidence of heat stress,” in Working on a warmer planet: The effect of heat stress on productivity and decent work (Geneva: Switzerland Report of the International Labour Office ILO), 21–23.
Kjellstrom, T., Maître, N., Saget, C., Otto, M., and Karimova, T. (2019b). Working on a warmer planet: The impact of heat stress on labour productivity and decent work. Geneva: Publications Production Unit, International Labour Organization.
Kovats, R. S., and Hajat, S. (2008). Heat stress and public health: A critical review. Annu. Rev. Public Health 29, 41–55. doi:10.1146/annurev.publhealth.29.020907.090843
Le, T. H., Nguyen, V. B., and Vo, V. H. (2018). Research on developing frequency and probability maps of heat wave and drought for the red river delta in the north of Viet Nam. Vietnam J. Hydrometeorol. 688 (3), 36–44.
Li, C., Sun, Y., Zwiers, F., Wang, D., Zhang, X., Chen, G., et al. (2020). Rapid warming in summer wet bulb globe temperature in China with human-induced climate change. J. Clim. 33 (13), 5697–5711. doi:10.1175/JCLI-D-19-0492.1
Li, J., Chen, Y. D., Gan, T. Y., and Lau, N.-C. (2018). Elevated increases in human-perceived temperature under climate warming. Nat. Clim. Chang. 8 (1), 43–47. doi:10.1038/s41558-017-0036-2
Luo, M., and Lau, N. C. (2018). Increasing heat stress in urban areas of eastern China: Acceleration by urbanization. Geophys. Res. Lett. 45 (2313), 060–013. doi:10.1029/2018GL080306
Luo, M., and Lau, N. C. (2021). Increasing human‐perceived heat stress risks exacerbated by urbanization in China: A comparative study based on multiple metrics. Earth's. Future 9 (7), e2020EF001848. doi:10.1029/2020EF001848
Luo, M., Lau, N. C., Liu, Z., Wu, S., and Wang, X. (2022). An observational investigation of spatiotemporally contiguous heatwaves in China from a 3D perspective. Geophys. Res. Lett. 49 (6), e2022GL097714. doi:10.1029/2022GL097714
Ma, Y., Zhou, J., Yang, S., Yu, Z., Wang, F., and Zhou, J. (2019). Effects of extreme temperatures on hospital emergency room visits for respiratory diseases in Beijing, China. Environ. Sci. Pollut. Res. 26 (3), 3055–3064. doi:10.1007/s11356-018-3855-4
Matveev, L. T. (1976). “Atmospheric humidity,” in Course of general meteorology- Physics of the atmosphere (Leningrad: Gidrometeoizdat), 326.
McGregor, G. R., and Vanos, J. (2018). Heat: A primer for public health researchers. Public Health 161, 138–146. doi:10.1016/j.puhe.2017.11.005
National Weather Service (2022a). Heat Forecast tools. USA: National Oceanic and Atmospheric Administration. Available: https://www.weather.gov/safety/heat-index
National Weather Service (2021). Meteorological Conversions and calculations: Heat index calculator. Available: https://www.wpc.ncep.noaa.gov/html/heatindex.shtml.
National Weather Service (2022b). US Dept of Commerce, National Oceanic and Atmospheric Administration. US UnitedState: WetBulb Globe temperature. Available: https://www.weather.gov/tsa/wbgt.
Nguyen, D. N., and Nguyen, T. H. (2004). Climate and climate resources in Vietnam. Hanoi: Agriculture Publisher.
Opitz-Stapleton, S., Sabbag, L., Hawley, K., Tran, P., Hoang, L., and Nguyen, P. H. (2016). Heat index trends and climate change implications for occupational heat exposure in Da Nang, Vietnam. Clim. Serv. 2, 41–51. doi:10.1016/j.cliser.2016.08.001
Phung, D., Chu, C., Rutherford, S., Nguyen, H. L. T., Do, C. M., and Huang, C. (2017). Heatwave and risk of hospitalization: A multi-province study in Vietnam. Environ. Pollut. 220, 597–607. doi:10.1016/j.envpol.2016.10.008
Semenza, J. C., McCullough, J. E., Flanders, W. D., McGeehin, M. A., and Lumpkin, J. (1999). Excess hospital admissions during the July 1995 heat wave in Chicago. Am. J. Prev. Med. 16 (4), 269–277. doi:10.1016/s0749-3797(99)00025-2
Steadman, R. (1984). A universal scale of apparent temperature. J. Appl. Meteorology Climatol 23, 1674–1687. doi:10.1175/1520-0450(1984)023%3C1674
Steadman, R. (1979). The assessment of sultriness. Part I: A temperature-humidity index based on human physiology and clothing science. J. Appl. Meteorology Climatol 18, 861–873. doi:10.1175/1520-0450(1979)018%3C0861:TAOSPI%3E2.0
Tai, N. C., and Quang, N. D. (2020). Nghiên cứu xây dựng bộ chỉ tiêu nhiệt ẩm ảnh hưởng tới sức khỏe một số cộng đồng dân cư tại Quảng Nam. Vietnam J. Hydrometeorol. 717, 20–31. doi:10.36335/VNJHM.2020(717).20–31
Taylor, T. (1997). Introduction to error analysis, the study of uncertainties in physical measurements. New York, NY: University Science Books.
Varentsov, M., Konstantinov, P., Semenova, A., and Shartova, N. (2018). Effects of the climate change and city development on summering urban heat island and heat stress indices for Moscow megacity (Tromp Foundation Travel Award). EMS annual Meeting Abstracts 15, 9. doi:10.3390/urbansci1010009
Vietnam Center of Hydro-Meteorological Data (2021). Vietnam Journal Of Hydrometeorology. Hanoi: Hydrometeorological data.
Wang, W., Zhou, W., Li, X., Wang, X., and Wang, D. (2016). Synoptic-scale characteristics and atmospheric controls of summer heat waves in China. Clim. Dyn. 46 (9), 2923–2941. doi:10.1007/s00382-015-2741-8
Wu, J., Gao, X., Giorgi, F., and Chen, D. (2017). Changes of effective temperature and cold/hot days in late decades over China based on a high resolution gridded observation dataset. Int. J. Climatol. 37, 788–800. doi:10.1002/joc.5038
Zhang, J., Lai, W., Zhao, Z., and Wang, H. (2019). Detecting spatial differences in thermal stress across China. Theor. Appl. Climatol. 138 (1), 541–552. doi:10.1007/s00704-019-02831-x
Zhu, J., Wang, S., and Fischer, E. M. (2021). Increased occurrence of day–night hot extremes in a warming climate. Clim. Dyn. 59, 1297–1307. doi:10.1007/s00382-021-06038-7
Keywords: climate change, heat stress, heat index, daily maximum temperature, daily mean temperature, daily minimum relative humidity
Citation: Hoang TLT, Dao HN, Cu PT, Tran VTT, Tong TP, Hoang ST, Vuong VV and Nguyen TN (2022) Assessing heat index changes in the context of climate change: A case study of Hanoi (Vietnam). Front. Earth Sci. 10:897601. doi: 10.3389/feart.2022.897601
Received: 16 March 2022; Accepted: 20 September 2022;
Published: 07 October 2022.
Edited by:
Wei Zhang, Utah State University, United StatesCopyright © 2022 Hoang, Dao, Cu, Tran, Tong, Hoang, Vuong and Nguyen. This is an open-access article distributed under the terms of the Creative Commons Attribution License (CC BY). The use, distribution or reproduction in other forums is permitted, provided the original author(s) and the copyright owner(s) are credited and that the original publication in this journal is cited, in accordance with accepted academic practice. No use, distribution or reproduction is permitted which does not comply with these terms.
*Correspondence: Hung N. Dao, aHVuZ2RuQGhudWUuZWR1LnZu
Disclaimer: All claims expressed in this article are solely those of the authors and do not necessarily represent those of their affiliated organizations, or those of the publisher, the editors and the reviewers. Any product that may be evaluated in this article or claim that may be made by its manufacturer is not guaranteed or endorsed by the publisher.
Research integrity at Frontiers
Learn more about the work of our research integrity team to safeguard the quality of each article we publish.