
95% of researchers rate our articles as excellent or good
Learn more about the work of our research integrity team to safeguard the quality of each article we publish.
Find out more
ORIGINAL RESEARCH article
Front. Earth Sci. , 27 June 2022
Sec. Environmental Informatics and Remote Sensing
Volume 10 - 2022 | https://doi.org/10.3389/feart.2022.895561
This article is part of the Research Topic Near-earth Electromagnetic Environment and Natural Hazards Disturbances View all 10 articles
 Lu Wang1,2
 Zhenxia Zhang2*
 Xunhui Shen2
 Xinqiao Li3
 Xiaohua Liang3
 Zeren Zhima2
 Wei Chu2
 Feng Guo2
 Na Zhou2
 Huaran Chen4
 Daihui Wei5
Solar eruptions can cause violent effects on the space environment. Electromagnetic radiation from solar flares will be the first to arrive on the Earth at the speed of light, followed by solar energetic charged particles. The last to appear will be coronal mass ejections and geomagnetic storms. Based on observations of ZH-1 satellite, we report three strong disturbed space environment events, all of them with solar proton events (SPEs), and analyze the driving mechanisms: 1) On 29 November 2020, an M4.4 flare accompanied with a full halo CME caused a gradual SPE, which was mainly driven by CME shocks. 2) On 28 May 2021, a C9.4 flare brought an impulsive SPE, which was accelerated by the flare. The heliolongitude of this small flare was 63°W, near the footpoint of the magnetic field line leading from the Sun to the Earth. 3) On 28 October 2021, a full-halo CME accompanied with an X1.1 flare brought a gradual SPE. On 2 November 2021, another fast full halo CME accompanied with flare was ejected. The faster CME of November 2 caught up and swept up the slower CME of November 1, and subsequently caused a severe geomagnetic storm (minimum Dst = -101) and a high-energy electron storm on November 4. The observations of the above three space environmental events confirm that the data quality of the high-energy particle package (HEPP) from ZH-1 is highly reliable and accurate and is highly advantageous to monitoring the variation of energetic particles and X-rays in the radiation belt of the Earth during solar activities.
Usually, the space environment is not always stable. Space weather events, such as flares, coronal mass ejections (CMEs), and solar proton events (SPEs) can lead to the damage of satellite systems, communication systems, navigation systems, and power systems, which causes enormous economic losses (Feynman and Gabriel, 2000). Therefore, it is important to monitor the space environment to defend and alleviate space environmental hazards. SPE is a phenomenon that is mostly associated with strong flares and fast halo coronal mass ejections (CMEs) (Reames, 1999). NOAA Space Weather Prediction Center (SWPC) defines the SPE to have a flux level of 10 cm−2s−1sr−1 for 15 min at
There are two different types of solar proton events: gradual events and impulsive events. Impulsive SPEs last about a few hours and often carry many electrons in 1–100 keV. The component ratios of Fe/O, 3He/4He for events accelerated by flares are significantly higher than those accelerated by CMEs (Kallenrode et al., 1992; Cane et al., 2003). A common explanation is that 3He is preferentially heated by certain waves, such as ion cyclotron waves, due to gyroresonance, because it is the only isotope whose cyclotron frequency lies between He++ and H+ (Fisk, 1978). Another interesting thing is that the heliolongitude corresponding to the flare-driven SPE is concentrated at around 60°W, which is the solar longitude that is magnetically connected to the Earth by the Parker spiral (Park et al., 2010). However, the heliolongitude distribution also has a wide dispersion, which is mainly due to the variation of the solar wind. Also, the random walk of the interplanetary magnetic field plays a partial role (Reames, 1999).
Usually, gradual SPEs last several days and are rich in protons. It is widely believed that the particles of gradual SPEs are accelerated by CME shocks. The heliolongitude distribution of these events on the visible disk of the Sun is roughly uniform. Some CMEs occurring even on the back side of the Sun can also cause gradual SPEs observed near Earth. The full halo CMEs with V ≥ 1,500 km/s have the highest probability of triggering SPE (Park et al., 2012). Generally, the flux of the proton event corresponding to the CMEs in the western hemisphere quickly peaks at the beginning, while the flux of the event corresponding to the eastern hemisphere rises slowly (Cane et al., 1988; Reames, 1999).
CMEs are often associated with flares, and the correlation is related to the duration of flares. A small part of CMEs is associated with prominence bursts. It is not easy to distinguish the sources of SPEs, and many SPE events are blended events driven by both CMEs and flares. It means these SPEs involve two different acceleration mechanisms. Cane and Kallenrode pointed out that the acceleration information of energetic particles can be found in the abundance of heavy ions (Kallenrode et al., 1992; Cane et al., 2003).
As coronal mass ejections (CMEs) occur, huge clumps of material from the solar atmosphere are ejected into interplanetary space, and these clumps take on the structure of interplanetary magnetic ropes or magnetic clouds. The CMEs can cause magnetic storms when they cause a continuous increase in the southward component of the interplanetary magnetic field (Gonzalez et al., 1999; Burlaga et al., 2002). In SPEs, the protons are mainly injected into the outer radiation belt (L ≥ 4). But for the SPEs accompanied with strong magnetic storms, the protons can be injected into the lower L layers, resulting in a trapped protons belt. Hudson et al. reported a long-term trapped protons belt with 10.7 MeV energy in the region of L = 3.5 ∼ 4, which was caused by SPEs accompanied with large magnetic storms. This result was observed in 1990–1991 by CRRES, and it is a geostationary transfer orbit satellite. Hudson also gave an explanation for the formation of the new trapped proton band that the induction electric field accompanying storm sudden commencement (SSC) transports particles radially inward, and injects energetic protons deeply into the inner magnetosphere. Due to the high magnetic field strength in the inner magnetosphere, the energetic protons are easily trapped. (Hudson et al., 1997; Hudson et al., 1998). The protons in the inner radiation belt are considerably stable for a lengthy period of time and usually vary with the 11-year solar activity cycle (Li et al., 2001; Domingos et al., 2017). However, the outer boundary of the inner radiation belt also has some fluctuations when strong geomagnetic storms occur. Zhang et al. reported the proton loss of the inner radiation belt during the geomagnetic storm of 2018 based on ZH-1 satellite observation. The non-adiabatic magnetic field line curvature scattering plays a significant role in the proton loss mechanism within the energy level of 30–100 MeV(Zhang Z.-X. et al., 2021).
ZH-1 is the first space-based platform in China for both earthquake observation and geophysical field measurement. A space platform is established for monitoring global space electromagnetic waves/fields, ionospheric plasma, high-energy particles, and space weather. On 2 February 2018, ZH-1 was launched into solar synchronous orbits with an altitude of 507 km, 97° inclination. The orbit cycle is 94.6 min, and the ascending node is 14:00 p.m. with a revisiting period of 5 days (Shen et al., 2018).
In previous work, ZH-1 has got many results in the study of perturbations in the ionosphere and radiation belts during the geomagnetic storms (Yang et al., 2019; Zhang et al., 2020; Palma et al., 2021; Zhang Z. et al., 2021; Zhima et al., 2021). The SPEs may cause battery damage and the single-particle effect on MEO and GEO satellites in orbit (Tylka et al., 1996; Jackman et al., 2008). Therefore, the study of SPE not only has scientific significance but also has practical meaning to astronaut safety and space mission execution. In this article, we report three events during the on-orbit period of ZH-1: the first event is a gradual SPE in November 2020, the second event is an impulsive SPE in May 2021, and the third event is a geomagnetic storm in November 2021 following the occurrence of SPEs. We take full advantage of the characteristics of the sun-synchronous orbit, and the ability to observe X-rays, high-energy protons, and electrons with high-energy resolution simultaneously. Combining data from NOAA-19, GOES, and SOHO satellites, we analyze the driving mechanisms of the two typical lower energy (mainly
ZH-1 satellite carries eight scientific payloads, of which the high-energy particle package (HEPP) consists of a high-energy band probe (HEPP-H), a low-energy band probe (HEPP-L), and a solar X-ray monitor (HEPP-X) (Li et al., 2019). Besides the HEPP, the ZH-1 satellite also carries another independent particle detector which was developed by the Italian Space Agency named High Energy Particle Detector (HEPD) (Picozza et al., 2019).
HEPP-L is installed on the side of the ZH-1 satellite facing the Earth (YOZ) and has an angle of 20° with the Sun–Earth line. HEPP-L can measure the electron fluxes with energy ranging from 0.1 to 3 MeV and the proton fluxes with an energy of 2–20 MeV. The energy ranges are divided into 256 energy channels with energy resolution
HEPP-X is an SDD detector with Si installed in the skyward direction. The half angle of the field of view of HEPP-X is 30° × 50°. The angle between the main axis of HEPP-X and the +Y direction to the Sun is 70°. It can detect photon counts in the energy range of 0.9–35 keV with a time resolution of 1s, the energy resolution of HEPP-X is 170 eV@5.9 keV. When the satellite operates on the night side, the shading of the Earth
interferes with the X-ray observation, so HEPP-X can achieve 11.5 h of solar observation each day (Li et al., 2019).
In addition, in this work, we also use NOAA-19 satellite proton data and GOES satellite X-ray data for comparison with ZH-1. Also, we analyze the CME images from the SOHO satellite to identify the source of the SPEs. The NOAA-19 satellite has a sun-synchronous orbit launched by NOAA (American National Oceanic and Atmospheric Administration), with an orbit altitude of 804 km, inclination of 98.6°, and orbit cycle of 101.1 min (Evans and Greer, 2004). The satellite carries MEPED detector which can detect protons and electrons, consisting of MEPED-0 and MEPED-90. A 0° telescope is mounted on the three-axis stabilized NOAA spacecraft such that the center of the field of view of each detector is directed approximately outward along the local zenith, whereas the 90° telescope is mounted perpendicular to the 0° telescope (Rodger et al., 2010). GOES series satellites are geosynchronous orbit satellites developed by NOAA and NASA (American National Aeronautics and Space Administration) operating at an altitude of 36,000 km. It carries a space environment detector to monitor high-energy particles and solar X-rays and is widely used in space weather monitoring and early warning. SOHO, the Solar and Heliospheric Observatory, is a project of international cooperation between ESA and NASA to study the Sun, from its deep core to the outer corona, and the solar wind. The LASCO instrument is one of 12 instruments included in SOHO. The LASCO instrument is a set of three coronagraphs that image the solar corona from 1.1 to 32 solar radii (Brueckner et al., 1995). The data of GOES and NOAA-19 are downloaded from the NOAA National Geophysical Data Center at https://satdat.ngdc.noaa.gov/. The data of SOHO can be downloaded at http://cdaw.gsfc.nasa.gov/CME_list/.
A solar flare is an intense brightening of partial regions of the solar atmosphere (mainly in the chromosphere and the corona), accompanied by strong electromagnetic radiation and a stream of energetic particles of a wide energy range. When a solar flare erupts, the protons travel through the corona by diffusion, reach the root region of the interplanetary magnetic fields (IMF) located in the corona, and then propagate along with the open magnetic field lines and through the interplanetary to near-Earth space (Cane et al., 1988). It is found that the probability of SPE occurrence strongly depends on the heliolongitude of the flare. Flares occurring between 30°W and 90°W have the greatest probability of inducing SPEs (Park et al., 2010).
HEPP-X can detect photons with energy of 0.9–35 keV, divided into 1,024 energy channels. Each energy channel has a photon count rating in unit (counts/s). To compare with other satellite data, we convert the photon counts to X-ray flux in units (W/m2) with the formula:
where Ephoton is the energy of one photon and Countsphoton denotes the detected count rating of photons. 1.6 × 10⁻¹⁶ is the energy conversion constant with the unit J/keV; S is the sensor area of HEPP-X with the value of 3.14 × 10⁻⁶m2; and Effi denotes the detection efficiency of 95%@10 keV, which is obtained from the ground calibration experiment.
The X-ray flux enhancement is observed before both SPE events. Figure 1A shows the energy and flux distributions of the M4.4 class X-ray flare observed on 29 November 2020. And Figure 1B shows the C9.4 class flare observed on 28 May 2021. The energy range of both the two flares covers 2.3–5 keV and the X-ray flux shows a significant increase compared to the quiet time. By comparing the observations of ZH-1 and GOES satellites, we find that the occurrence time of X-ray peaks is basically consistent, as shown in Table 1. The time difference of several minutes is due to the shading of the Earth which affects the observation of X-rays when ZH-1 is operating on the night side. It is reasonable as long as the difference is less than half of the ZH-1 orbital period (47.3 min).
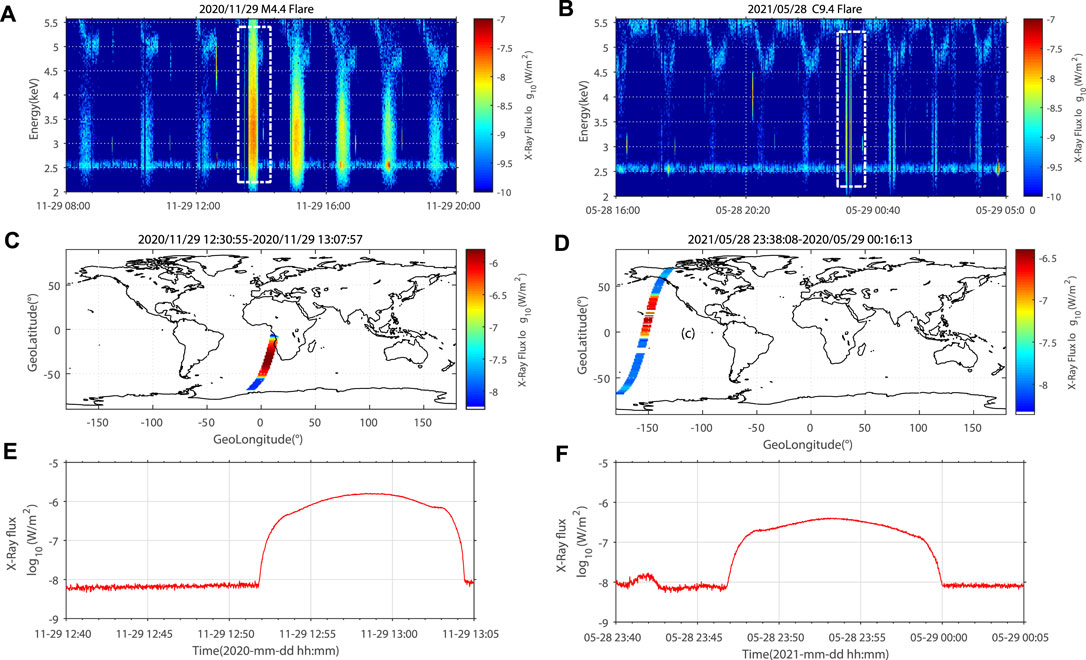
FIGURE 1. X-ray fluxes before the two SPEs measured by HEPP-X. (A,C,E) The M4.4 flare flux distribution before 2020 gradual SPE. (B,D,F) The C9.4 flare flux distribution before 2021 impulsive SPE.

TABLE 1. The time difference of X-ray flux peak of flare observations between ZH-1 and GOES satellite.
We integrated the X-ray fluxes on all energy channels to obtain the total flux value. Figures 1C and 1D show the orbit paths of the two flare observations. and Figures 1E and 1F are a more direct display of the X-ray fluxes in the peak flux orbits. It should be noted that HEPP-X also responds to electrons, so HEPP-X has a higher measurement value in the South Atlantic Anomaly (SAA) region. For the M4.4 flare on 29 November 2020, ZH-1 is operating in the SAA region. The peak of X-ray fluxes is 1.0 × 10⁻⁶ W/m2, which is much higher than the quiet time (10–8 to 10−7 W/m2). For the C9.4 flare on 28 May 2021 observed in the non-SAA region, the peak of X-ray fluxes is 3.1 × 10⁻⁷ W/m2, also much higher than in the quiet period (10−9 to 10−8 W/m2).
Figure 2 shows the space environment before the gradual SPE in November 2020 (Figure 2A), the impulsive SPE in May 2021 (Figure 2B), and the geomagnetic storm in November 2021 (Figure 2C). From the top to the bottom are the solar wind dynamic pressure (nPa), geomagnetic index Kp, equatorial ring current index Dst (nT), interplanetary magnetic field component Bz (nT), F10.7 index, sunspot number, and solar wind speed (km/s).
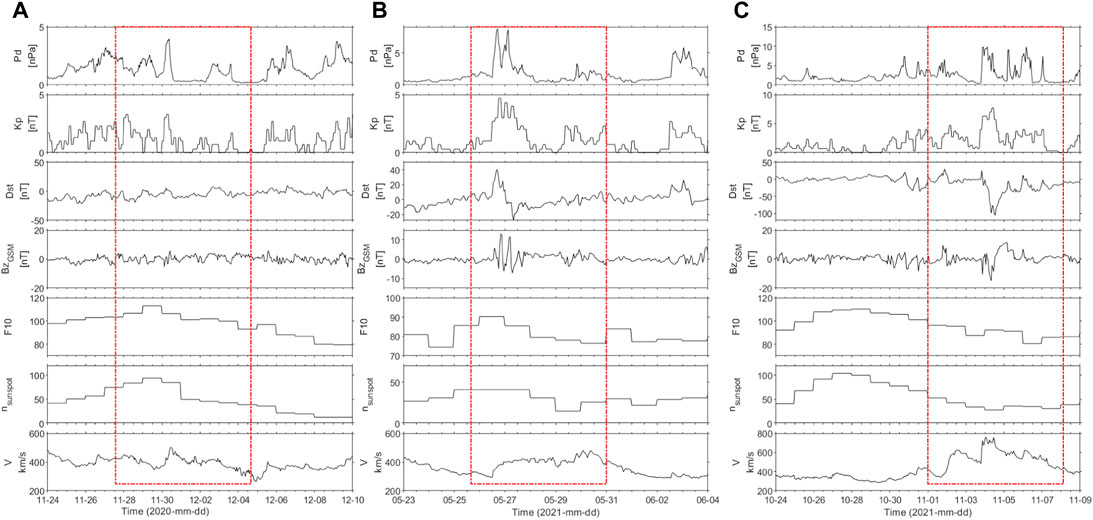
FIGURE 2. The space weather index for these three typical events (A) for SPE in November 2020, (B) for SPE in May 2021, and (C) for geomagnetic storm in November 2021.
Figures 3 and 4 show the observations and evolutions of X-ray fluxes from HEPP-X, electron fluxes (0.1–3 MeV), and proton fluxes (2.5–6.9 MeV, 6.9–20 MeV) from HEPP-L, and proton fluxes (2.5–6.9 MeV) from NOAA with L-shell value. For X-rays, we only take into account data on dayside with a time resolution of 1 minute. Proton and electron measurements are color coded in logarithm scale and sorted in L-shell (L bin width: 0.1) with a time resolution of 3 h.
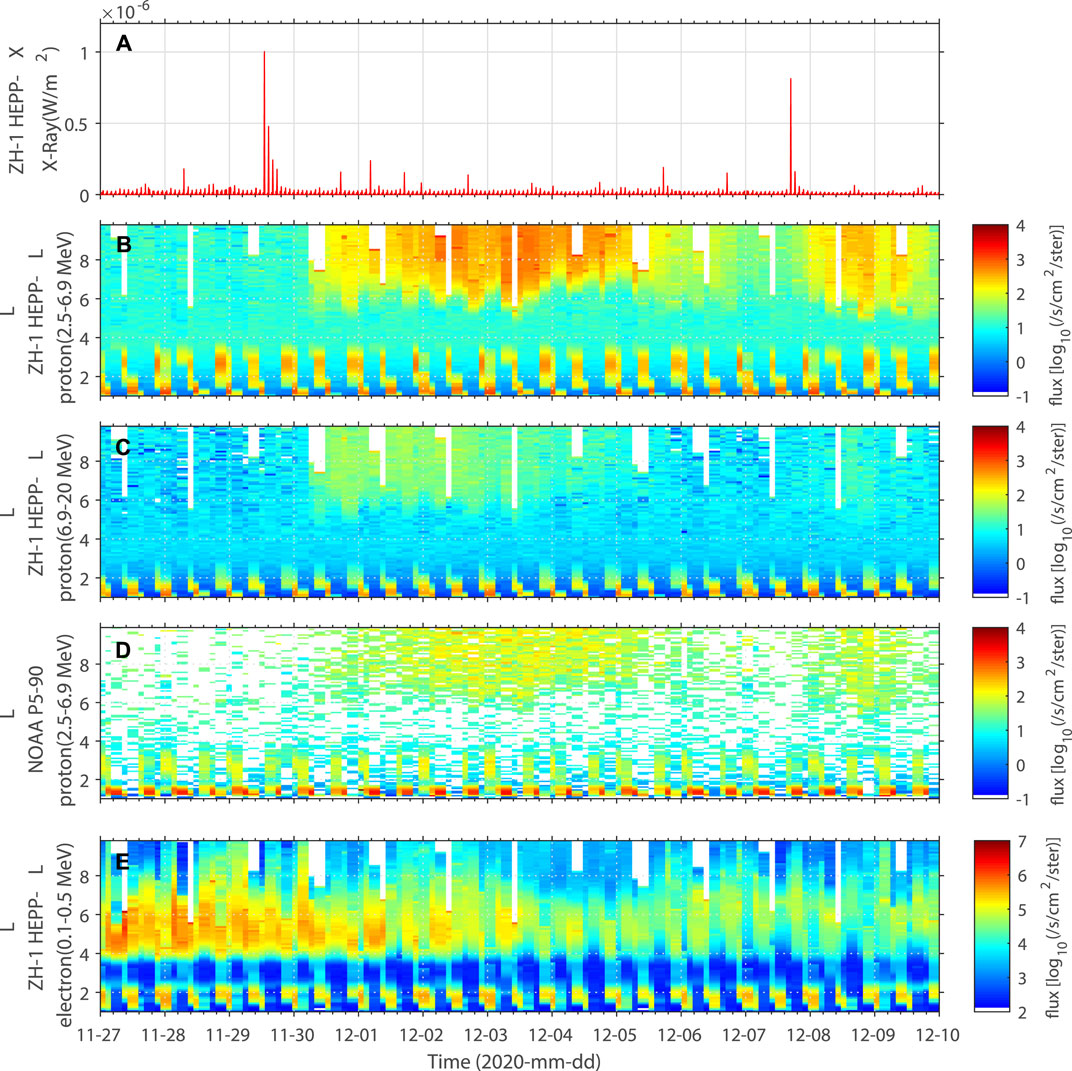
FIGURE 3. The evolution of X-rays, protons, and electrons during the gradual SPE from 27 November 2020 to 10 December 2020. (A) X-ray fluxes observed by HEPP-X. (B,C) The proton fluxes observed by ZH-1 with energies of 2.5–6.9 MeV and 6.9–20 MeV. (D) The proton fluxes from the NOAA-19 satellite. (E) 0.1–0.5 MeV electron flux distribution from ZH-1.
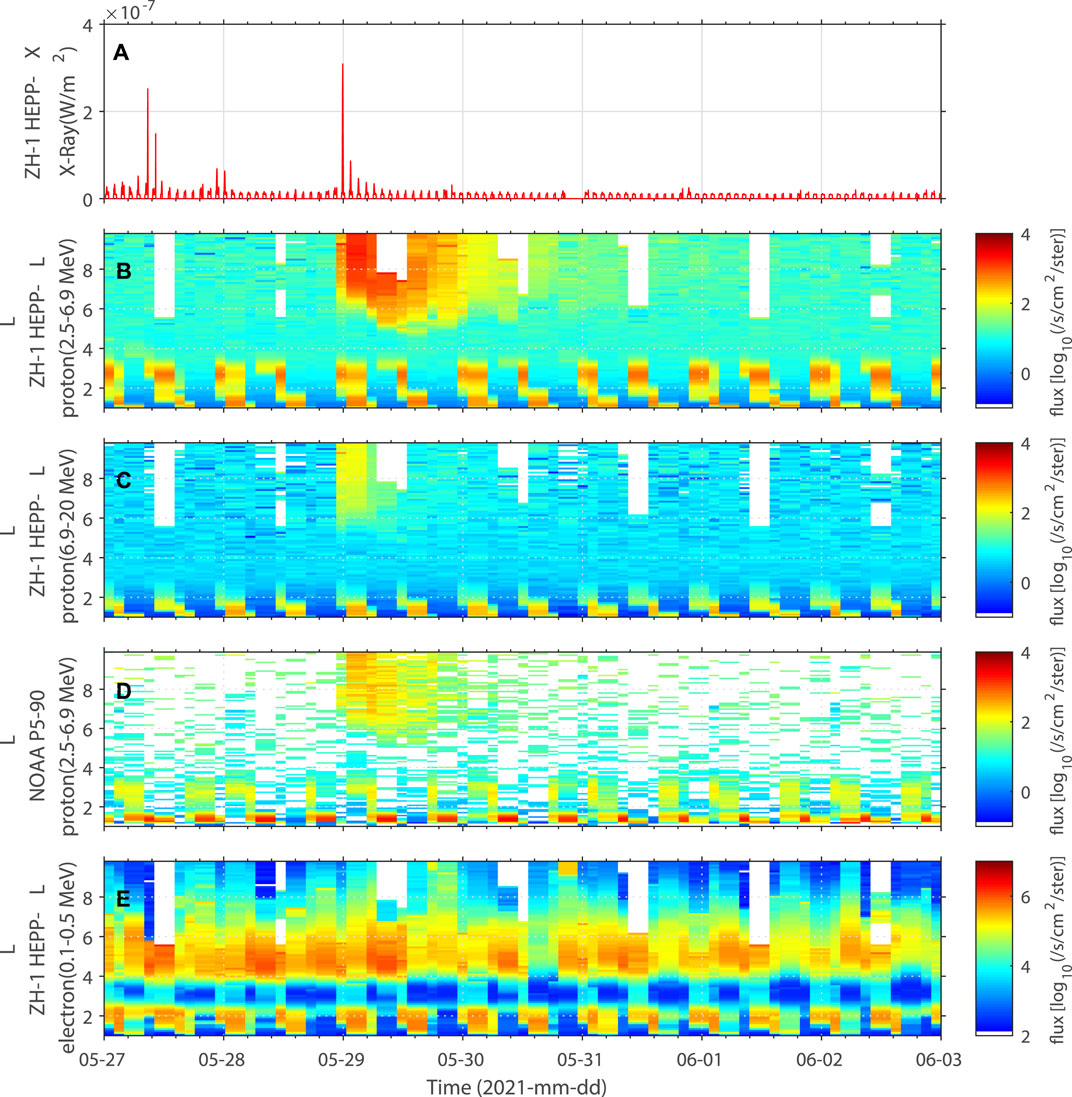
FIGURE 4. The evolution of X-rays, protons, and electrons during the impulsive SPE from 27 May 2021 to 3 June 2021. (A) X-ray fluxes observed by HEPP-X. (B), (C) The proton fluxes observed by ZH-1 with energies of 2.5–6.9 MeV and 6.9–20 MeV. (D) The proton fluxes from the NOAA-19 satellite. (E) 0.1–0.5 MeV electron flux distribution from ZH-1.
According to the observations in Figure 2A, the space environment before the 2020 SPE is considerably calm. The F10.7 and sunspot number reached a maximum on November 29 with sunspot number 84. The solar wind speed had a small increase on November 29, from 400 km/s to 500 km/s.
On 29 November 2020 at 12:59 UTC, a significant X-ray flux enhancement was observed with a peak X-ray flux at 1.0, ×, 10–6 (W/m2), shown in Figure 3A. The geosynchronous satellite GOES observed an M4.4 flare at 13:11 UTC from sunspot AR2786. According to SOHO satellite observations, this flare was accompanied with a full and fast CME, but the CME was not facing toward the Earth at the beginning. One day later, on November 30 at 10:00 UTC, proton fluxes started to increase, shown in Figures 3B and 3C. The increased protons are mainly located in the outer radiation belt with L values from 5 to 9. The maximum flux of 2.5–6.9 MeV protons reaches 4,982 cm−2s−1sr−1, and the maximum flux of 6.9–20 MeV protons reaches 550 cm−2s−1sr−1. On December 7, a C7 flare erupted with a small CME from sunspot AR2790. This event caused a slight increase in proton flux again on December 8 and lasted for 1 day. 0.1–0.3 MeV electron flux does not show a significant increase (see Figure 3E).
To compare the proton fluxes observed by ZH-1 and NOAA-19 in the same time period, we investigate the evolution of proton data at 2.5–6.9 MeV with 2s time resolution from the NOAA P5-90 probe (see Figure 3D). It is obvious that the NOAA observations are approximately consistent with the ZH-1 observations, and the proton fluxes are in the same order of magnitude. The flux value of ZH-1 is slightly higher than NOAA because the ZH-1 collects data from a wider pitch angle range. In addition, the two satellites have different operating heights, energy ranges, and installation directions. It is hard to accurately compare the flux values. Compared to other similar satellite, the observation advantages of ZH-1 brings much more significance to this report.
It is clear that this event belongs to a gradual SPE, and the proton flux does not show a significant increase immediately after the M4.4 flare occurred on November 29 at 13:00 UTC. We can conclude that the increase of proton fluxes on November 30 is mainly driven by the CME and ICME shocks because the flare-accelerated particles will reach the Earth within a few minutes to a few hours. After that, the shocks driven by the CME and ICME are likely the only source to accelerate particles.
Figure 2B shows the activity index of space environment before the 2021 SPE. On May 26 and 27, a small geomagnetic storm (Kp = 5) occurred, while the solar wind speed increased from 300 km/s up to about 450 km/s, and the sunspot number was around 50. Figure 4A shows a significant enhancement in X-ray fluxes at 23:52 UTC on 28 May 2021, with peak X-ray fluxes of 3.1 × 10⁻⁷°(W/m2). The GOES observed a C9.4 flare at 23:18 with the position at N21°W63° (sunspot AR2824). Following the flare occurrence, the proton flux increased significantly at a rapid speed, shown in Figures 4B and 4C. The maximum flux of 2.5–6.9 MeV protons reached 4,274.1°cm−2s−1sr−1 and lasted for about 1 day. The 6.9–20 MeV proton maximum flux reached 1,000.6 cm−2s−1sr−1 and lasted for only several hours. The 0.1–0.3 MeV electron fluxes did not show significant changes, as shown in Figure 4E. Figure 4D gives the results of the NOAA P5-90 probe showing that the 2.5–6.9 MeV proton flux enhancement is also demonstrated during the same period, which is consistent with the ZH-1 results.
By investigating the CME observations from the SOHO satellite, this C9.4 flare is not accompanied with a fast full halo CME. The source longitude of the flare is near 63°W, which is near the solar longitude that is magnetically connected to the Earth by the Parker spiral. The flares occurring in this region can rapidly reach the Earth along the magnetic field lines. The occurrence probability of flare-driven SPE is strongly correlated with the heliolongitude of the flare source as aforementioned, even though this flare was only C9.4 class. Therefore, we can infer that this SPE is mainly driven by the solar flare. By the way, conversely, X-class flares occurring in the eastern hemisphere are hardly likely to induce SPE (Park et al., 2010). Based on the profile of the proton flux evolution, this event is thought to be an impulsive SPE.
Figure 5 shows the global distribution of the proton fluxes observed by the HEPP-L during the quiet and SPE periods, with energy divided into 2–10 MeV and 10–20 MeV in 1 ° × 1 ° pixel. Protons are mainly concentrated in the SAA during quiet time, shown in Figures 5C and 5D. This is a region full of captured particles due to the deviation of the geomagnetic dipole center relative to the Earth’s center and the tilt of the magnetic axis relative to the Earth’s rotation axis (Heirtzler, 2002). The latitude and longitude values of the SAA flux peak in the SAA region have ever been estimated based on ZH-1 satellite data (Zhang Z.-X. et al., 2021).
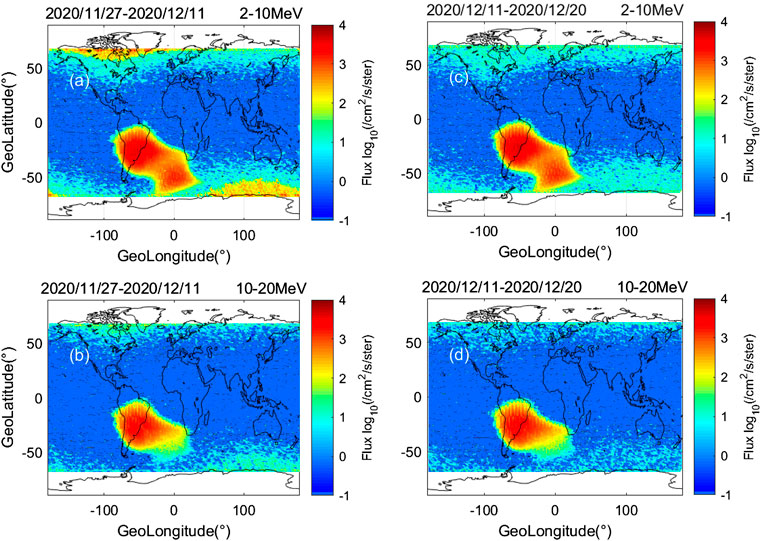
FIGURE 5. Global distribution of proton fluxes during SPE occurrence and quiet time observed by ZH-1 (A,B) for the SPE period and (C,D) for the quiet time. The energy range of (A) and (C) is 2–10 MeV and (B) and (D) is 10–20 MeV.
Figures 5A and 5B show the global distribution of proton fluxes during the November 2020 SPE. Energetic protons injected during the SPE are mainly distributed at high latitudes ≥±55°, and the latitude that solar energy particles can reach is related to the cutoff rigidity. During large geomagnetic storms, the geomagnetic field is warped which induces solar energy particles to reach lower latitudes. This compression can reach at most up to about 15° toward the equator, exposing lower latitudes to the harmful radiation environment (Smart and Shea, 2003). Figure 6 shows more directly the daily variation of proton fluxes in three regions during the SPE occurrence, namely, the SAA region (longitude −100° ∼ 40°, latitude −40° ∼ 0°), the high-latitude region (latitude 50° ∼ 70°, -70° ∼ − 50°), and other low-latitude regions (latitude 0° ∼ 50°). We can find the proton fluxes in high-latitude regions increase significantly during SPEs, but not in lower latitude regions.
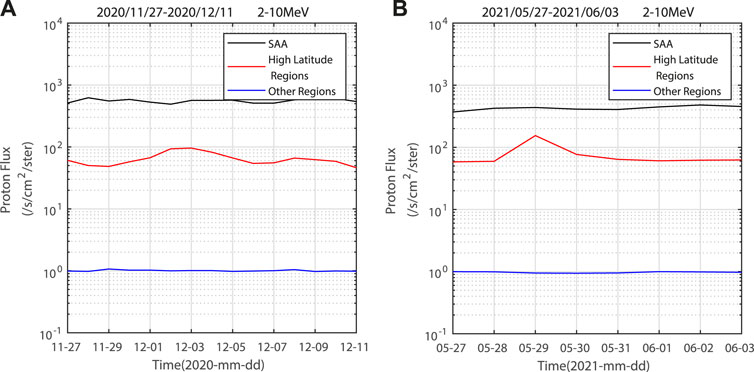
FIGURE 6. Daily variation of proton fluxes in different regions during the SPEs. The black line refers to the SAA region, the red line refers to the high latitude region, and the blue line refers to the other regions.
HEPP-L has a high-energy resolution, it divides the 2–20 MeV protons into 256 energy channels. Figure 7 shows the evolution of the 2–16 MeV proton fluxes with energy intervals in 2 MeV corresponding to L = 5 ∼ 9. We can see that the higher energy protons arrive at the satellite faster than the lower energy protons and the latter last for a longer time. For the impulsive SPE driven by flares, the protons travel along the magnetic lines, arrive at the Earth after a few hours, and then drop rapidly. For the gradual SPE, shown in Figure 7A, it has a smoother time-intensity profile and longer duration than impulsive SPE. The flux evolution of SPEs also depends on the source longitude of the flare, the angular width of the CME, the solar wind speed, and so on. It is believed that flares can accelerate particles at higher energies more often than the interplanetary shocks from CMEs (Gloeckler, 1984).
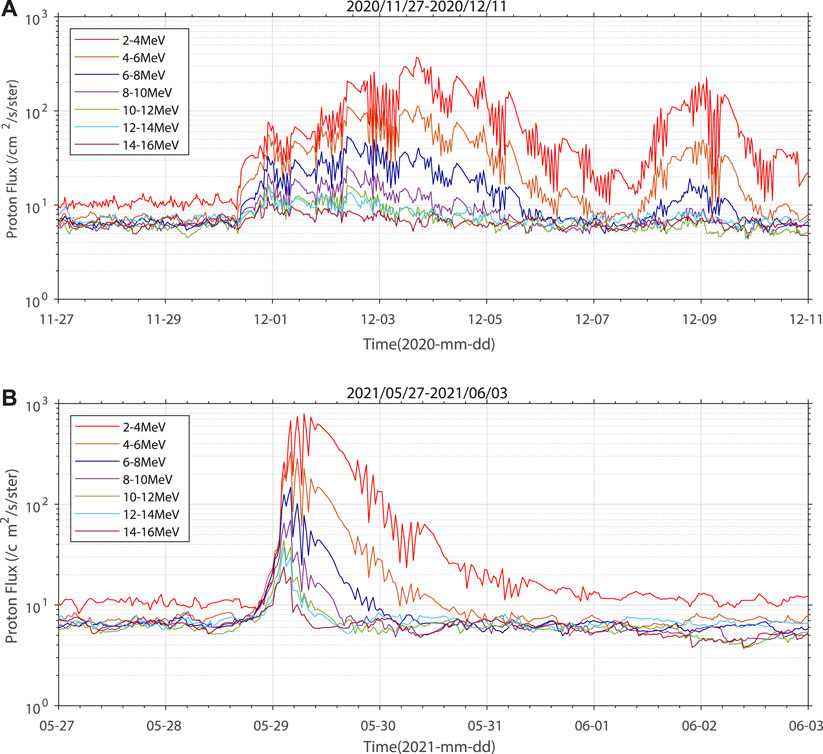
FIGURE 7. The evolution of the proton fluxes at different energies corresponding to L = 5 ∼ 9 (A) for the gradual SPE of 2020 and (B) for the impulsive SPE of 2021.
The pitch angle distribution of particles is an important indicator of the particle dynamics in the radiation belt, which provides an important reference for studying the source, acceleration, and loss of particles. In this article, we refer to D. G Sibeck’s classification of pitch angle to classify the distribution of pitch angle into three types: pancake, butterfly, and flattop (Sibeck et al., 1987). The pancake distribution features a peak near 90° and a smooth decline toward a small pitch angle. The observed values in the range less than 60° and more than 120° are almost 0. The butterfly-type distribution is characterized as valley flux at the 90°. Flattop-type distributions have approximately equal fluxes around the 90° pitch angles. ZH-1 covers a very narrow range of local time, so we do not consider the variation of the pitch angle with local time (Figures 8C,F), but only distinguish the difference between the dayside and the nightside.
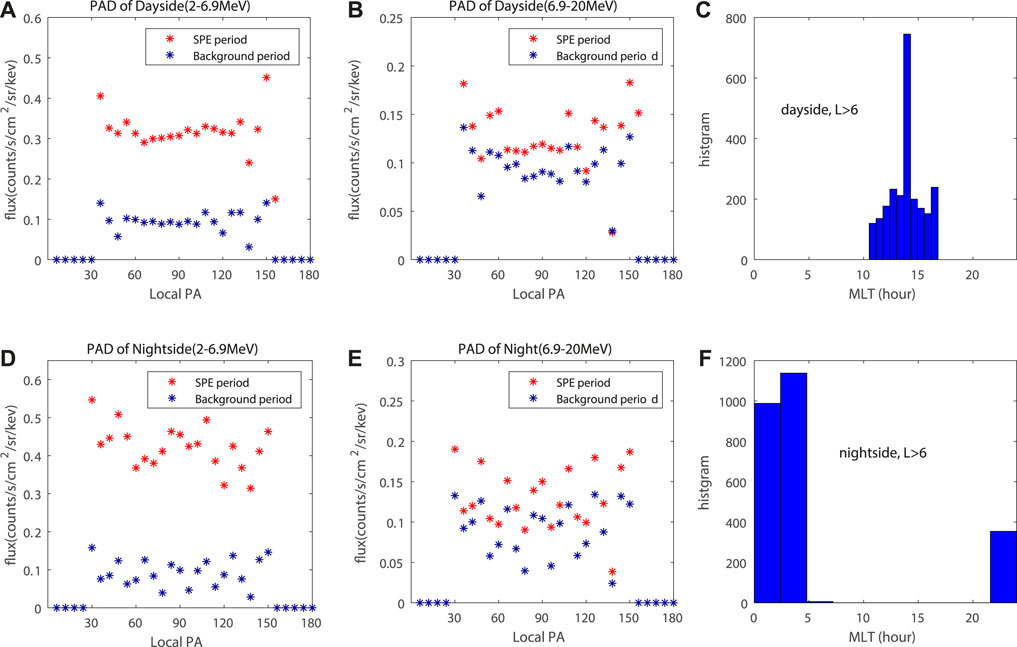
FIGURE 8. Pitch angle distribution of protons in the outer radiation belt during SPE, (A) and (B) at dayside, (D) and (E) at nightside. Red dots indicate flux distribution during the SPE period. Blue dots indicate quiet time. (C) and (F) are the local time covered by ZH-1.
We choose 5 days of data for both the SPE period and the background period, showing the pitch angle distributions of 2–6.9 MeV and 6.9–20 MeV protons at dayside and nightside, respectively, with the L value range L = 8 ∼ 10 (see Figure 8). The protons of 6.9–20 MeV show a significant butterfly-type pitch angle distribution, and the protons of 2–6.9 MeV look approximately between flattop and butterfly type. The possible reasons for butterfly distribution may come from the drift shell splitting and the magnetopause shadowing (Sibeck et al., 1987; Hudson et al., 2014). It may also be developed from the butterfly distribution in the high L value through an inward radial diffusion acceleration mechanism, or from the pancake distribution in the low L value region through a pitch angle diffusion mechanism (Yang et al., 2014). The accurate mechanism of pitch angle formation needs further study in the future.
Besides the aforementioned SPEs, here we report another typical space weather event, that is, an occurrence of one geomagnetic storm following the SPE and solar flare.
As we enter the 25th solar cycle, solar activity begins to be more active. At 15:35 UTC, on 28 October 2021, an X1.1 flare with a full halo CME erupted from Earth-facing sunspot AR2887. This event caused SPE as shown in Figures 9C–G. Three days later, on November 1, sunspot AR2887 erupted again, producing an M1 flare and a CME. On November 2, another fast full halo CME accompanied with an M1.7 flare was ejected from sunspot AR2891. The faster CME of November 2 caught up and swept up the slower CME of November 1 and caused tangled magnetic fields and compressed plasma which can spark geomagnetic storms well. The CME occurred on November 1 and 2 resulting in an enhancement of proton flux on November 4, and the geomagnetic index Dst dropped to −101, as shown in Figures 2C and 9A. In other words, complex structure CMEs are the source of SPE and geomagnetic storm on November 4. This explanation is also consistent with the space environment alert website (https://spaceweather.com/). From Figures 9E–G, before the onset of the geomagnetic storms, the 0.5–1.0 MeV high-energy electrons are mainly distributed in the outer radiation belt at L = 4 ∼ 6. During the main phase of the November 4 magnetic storm, there was a significant increase in electron flux in all three energy bands as the solar wind dynamic pressure increased. When the Dst index reached its minimum (-101), the boundary of the outer radiation electron moves downward, and the electrons
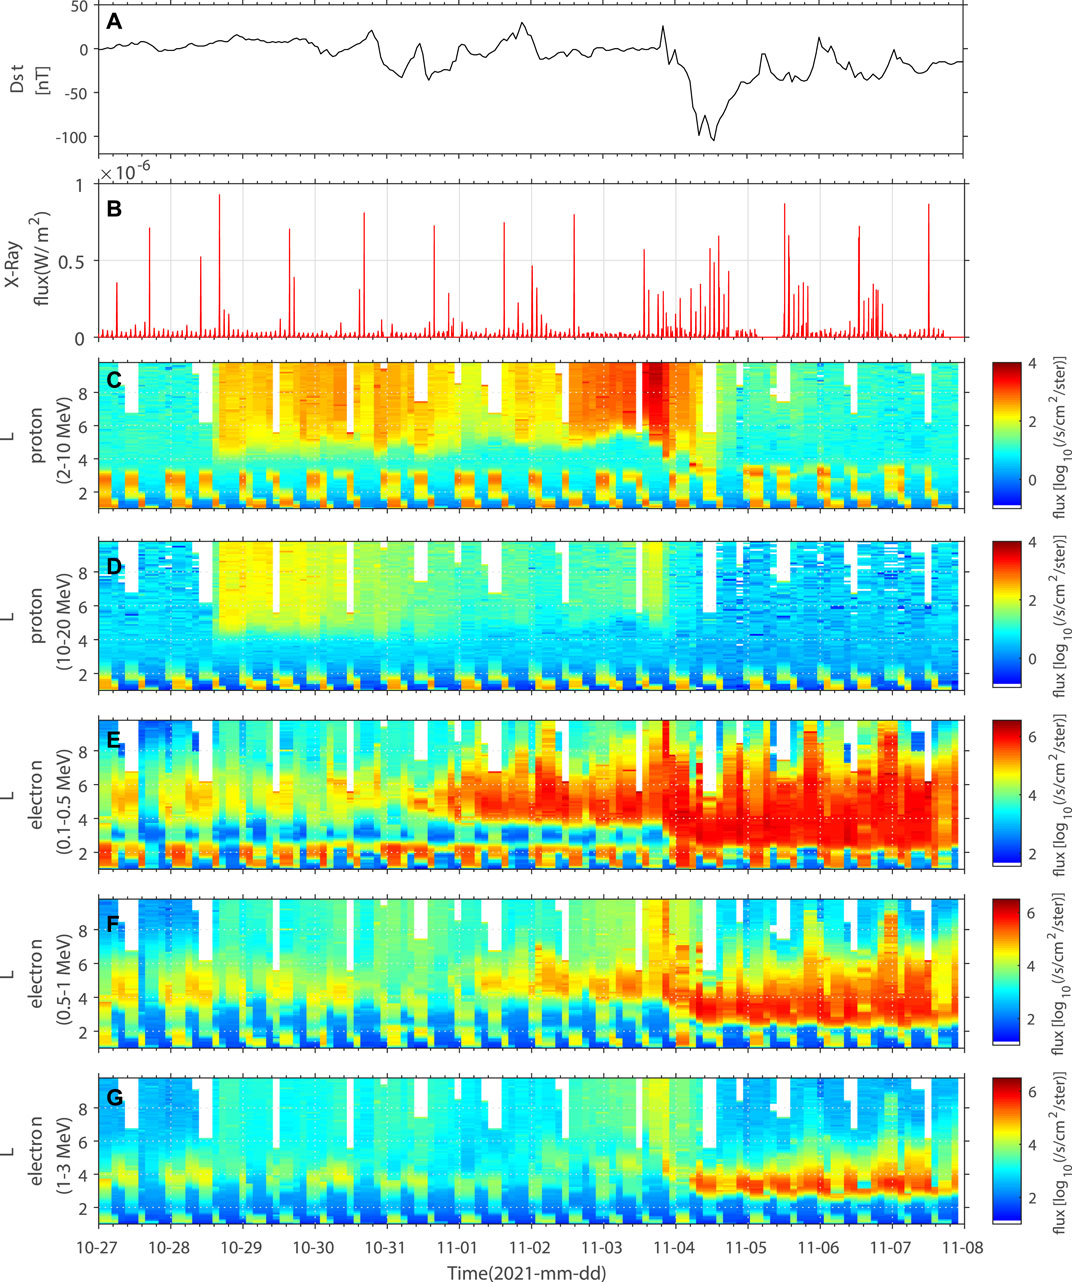
FIGURE 9. The evolution of the Dst index, X-rays, protons, and electrons during the SPE and induced geomagnetic storm from 27 October 2021 to 8 November 2021. (A) Evolution of the Dst index. (B) X-ray fluxes observed by HEPP-X. (C) and (D) are the proton fluxes observed by ZH-1 with energies of 2–10 MeV and 10–20 MeV. (E), (F), and (G) are the electron flux distribution at 0.1–0.5 MeV, 0.5–1 MeV, and 1–3 MeV energies, respectively.
The interplanetary driving sources of geomagnetic storms are mainly CMEs and CIRs. The primary causes of geomagnetic storms on the Earth are strong dawn-to-dusk electric fields associated with the passage of southward directed IMF, which affect the Earth for sufficiently long intervals of time. The solar wind energy transfer mechanism is the magnetic reconnection between the IMF and the Earth’s magnetic field (Gonzalez et al., 1994; Gonzalez et al., 1999). For magnetic storms caused by CMEs, the southward magnetic field (Bs) in shock sheaths and ICMEs or magnetic clouds contribute to the generation of the geomagnetic storms (Burlaga et al., 2001). Such magnetic storms typically occur 3–5 days after the CME, or even less. By statistics of CME-related geomagnetic storm events for 1996–1999, it is found that the halo CMEs occurring within 50° from the center meridian of the heliopause are more likely to cause geomagnetic storms (Cane et al., 2000). The principle of CIR-driven magnetic storms is similar to CMEs, also due to magnetic reconnection. The southward component of the IMF is provided by the Alfvén perturbation in the high-speed solar wind from the coronal hole. CIR-driven magnetic storms mainly occur during the declining period of the solar cycle, when there is less solar eruption activity but more solar wind high-speed flow (Feynman and Gu, 1986). Usually, CIR-driven magnetic storms are smaller than CME-driven storms and have a cycle of 27-day recurrence (Tsurutani et al., 1995).
Sometimes, the source of a magnetic storm may not come from a single CME but from the interaction of multiple CMEs. CMEs will generate some interplanetary composite structures after catching up and colliding during propagation (Burlaga et al., 2002). By statistics of the interplanetary sources of 37 long-lived strong magnetic storms during 1998–2002, they concluded that 64.9% (24 of 37) of magnetic storms are caused by multiple CMEs, 21.6% (7 of 37) are caused by single CME, and 13.5% are caused by CIR (5 of 37) (Xie et al., 2006). The intensity of geomagnetic storms is well correlated with the number of CMEs, more CMEs result in stronger and longer-lasting geomagnetic storms. The geomagnetic storm in November 2021 was a typical event since it was generated by the collision of multiple CMEs and had a large impact on the space weather environment worthy of our attention.
This article aims to present the solar flare X-ray and solar proton events based on ZH-1 data, which is highly advantageous to exhibit the observation characteristics of these space weather, such as wide energy ranges, high-energy resolution, and good particle identification, compared to NOAA data. What’s more, ZH-1 is a sun-synchronous orbit satellite and can observe all the solar proton events in wide L-shells (covering L = 1 ∼ 10), compared to the synchronous orbit of GOES. So based on the advantage of the ZH-1 satellite, we analyze the recently occurred solar proton event and also provide more confidence to scientists to use ZH-1 data for study of space weather. The following results are obtained:
• Before the two SPEs occurred on 29 November 2020 and on 28 May 2021, significant X-ray flux enhancements are observed by the ZH-1 satellite, and the flare time is consistent with the GOES satellite observations.
• When strong disturbances such as CMEs and flares occur, the energetic proton from the Sun will sink into the high-latitude region along the open magnetic field lines. The injection latitude can reach ±55°, corresponding to L-shell values around L = 5, and the observations are consistent with NOAA satellites.
• The gradual SPE that occurred in November 2020 was mainly driven by CME and ICME shocks, with protons reaching Earth about a day later. The impulsive SPE occurred in May 2021 SPE was mainly driven by flares, with protons reaching Earth rapidly after a few minutes.
• In addition to SPEs, CMEs causing geomagnetic storms are also reported in this work. On 28 October 2021, a full-halo CME accompanied with an X1.1 flare brought a gradual SPE. On November 2, another fast full halo CME accompanied with flare was ejected, the faster CME of November 2 caught up and swept up the slower CME of November 1 and brought a large magnetic storm on November 4.
With the advent of the space age, various space missions are in progress. It is meaningful to forecast and attempt to avoid the SPEs, flares, and CMEs in advance. Forecasting SPEs include long-term forecasting models such as King, JPL, and ESP(King, 1974; Feynman et al., 1991; Xapsos et al., 2000), and short-term forecasting models mostly utilized real-time observations of X-rays (Núñez, 2011). During solar eruptions, solar X-rays are the first to reach Earth at the speed of light, while energetic particles follow in a few hours to a few days later. Taking advantage of X-ray supervision in advance, we can try to forecast SPEs and reduce their hazards to satellites in orbit, space stations, and astronauts, which is the next work objective in the future.
Publicly available datasets were analyzed in this study. This data can be found here: https://www.leos.ac.cn.
LW performed the data process and wrote the original manuscript version. ZZ put forward the main idea and guide the whole analysis process of this work. XL is in charge of the reconstruction method of the ZH-1 raw data and data application method. XL designed and developed X-ray detector (HEPP-X). XS, ZZ, WC, FG, NZ, HC, and DW provided consultation on the idea and manuscript writing of the work.
This study was supported by grants from the National Natural Science Foundation of China (NNSFC) (41904149 and 12173038), the Asia-Pacific Space Cooperation Organization Project (APSCO-SP/PM-EARTHQUAKE), the research grants from the National Institute of Natural Hazards, Ministry of Emergency Management of China (Grant Number: 2021-JBKY-11), and the Stable-Support Scientific Project of China Research Institute of Radiowave Propagation (A132001W07).
The authors declare that the research was conducted in the absence of any commercial or financial relationships that could be construed as a potential conflict of interest.
All claims expressed in this article are solely those of the authors and do not necessarily represent those of their affiliated organizations, or those of the publisher, the editors, and the reviewers. Any product that may be evaluated in this article, or claim that may be made by its manufacturer, is not guaranteed or endorsed by the publisher.
We are grateful for the satellite data download.
Brueckner, G. E., Howard, R. A., Koomen, M. J., Korendyke, C. M., Michels, D. J., Moses, J. D., et al. (1995). The Large Angle Spectroscopic Coronagraph (Lasco). Sol. Phys. 161, 357–402. doi:10.1007/bf00733434
Burlaga, L. F., Plunkett, S. P., and Cyr, O. C. S. (2002). Successive Cmes and Complex Ejecta. J. Geophys. Res. 107, 1266. doi:10.1029/2001JA000255
Burlaga, L. F., Skoug, R. M., Smith, C. W., Webb, D. F., Zurbuchen, T. H., and Reinard, A. (2001). Fast Ejecta during the Ascending Phase of Solar Cycle 23: ACE Observations, 1998-1999. J. Geophys. Res. 106, 20957–20977. doi:10.1029/2000ja000214
Cane, H. V., Reames, D. V., and von Rosenvinge, T. T. (1988). The Role of Interplanetary Shocks in the Longitude Distribution of Solar Energetic Particles. J. Geophys. Res. 93, 9555–9567. doi:10.1029/ja093ia09p09555
Cane, H. V., Richardson, I. G., and Cyr, O. C. S. (2000). Coronal Mass Ejections, Interplanetary Ejecta and Geomagnetic Storms. Geophys. Res. Lett. 27, 3591–3594. doi:10.1029/2000GL000111
Cane, H. V., von Rosenvinge, T. T., Cohen, C. M. S., and Mewaldt, R. A. (2003). Two Components in Major Solar Particle Events. Geophys. Res. Lett. 30, 8017. doi:10.1029/2002GL016580
Domingos, J., Jault, D., Pais, M. A., and Mandea, M. (2017). The South Atlantic Anomaly throughout the Solar Cycle. Earth Planet. Sci. Lett. 473, 154–163. doi:10.1016/j.epsl.2017.06.004
Evans, D. S., and Greer, M. S. (2004). Polar Orbiting Environmental Satellite Space Environment Monitor-2 Instrument Descriptions and Archive Data Documentation, 1.4. Boulder, Colorado: NOAA Tech. Mem.
Feynman, J., and Gabriel, S. B. (2000). On Space Weather Consequences and Predictions. J. Geophys. Res. 105, 10543–10564. doi:10.1029/1999JA000141
Feynman, J., and Gu, X. Y. (1986). Prediction of Geomagnetic Activity on Time Scales of One to Ten Years. Rev. Geophys. 24, 650–666. doi:10.1029/RG024i003p00650
Feynman, J., Spitale, G., Wang, J., and Gabriel, S. (1991). Interplanetary Proton Fluence Model: Jpl 1991. J. Geophys. Res. 98, 13281–13294. doi:10.1029/92ja02670
Fisk, L. A. (1978). 3He-Rich Flares: A Possible Explanation. Astrophysical J. 224, 1048–1055. doi:10.1086/156456
Gloeckler, G. (1984). Characteristics of Solar and Heliospheric Ion Populations Observed Near Earth. Adv. Space Res. 4, 127–137. doi:10.1016/0273-1177(84)90302-8
Gonzalez, W. D., Joselyn, J. A., Kamide, Y., Kroehl, H. W., Rostoker, G., Tsurutani, B. T., et al. (1994). What is a Geomagnetic Storm? J. Geophys. Res. 99, 5771–5792. doi:10.1029/93JA02867
Gonzalez, W. D., Tsurutani, B. T., and Clúa de Gonzalez, A. L. (1999). Interplanetary Origin of Geomagnetic Storms. Space Sci. Rev. 88, 529–562. doi:10.1023/A:1005160129098
Heirtzler, J. R. (2002). The Future of the South Atlantic Anomaly and Implications for Radiation Damage in Space. J. Atmos. Sol.-Terr. Phys. 64, 1701–1708. doi:10.1016/s1364-6826(02)00120-7
Hudson, M. K., Baker, D. N., Goldstein, J., Kress, B. T., Paral, J., Toffoletto, F. R., et al. (2014). Simulated Magnetopause Losses and Van Allen Probe Flux Dropouts. Geophys. Res. Lett. 41, 1113–1118. doi:10.1002/2014GL059222
Hudson, M. K., Elkington, S. R., Lyon, J. G., Marchenko, V. A., Roth, I., Temerin, M., et al. (1997). Simulations of Radiation Belt Formation during Storm Sudden Commencements. J. Geophys. Res. 102, 14087–14102. doi:10.1029/97JA03995
Hudson, M. K., Marchenko, V. A., Roth, I., Temerin, M., Blake, J. B., and Gussenhoven, M. S. (1998). Radiation Belt Formation during Storm Sudden Commencements and Loss during Main Phase. Adv. Space Res. 21, 597–607. doi:10.1016/s0273-1177(97)00969-1
Jackman, C. H., Marsh, D. R., Vitt, F. M., Garcia, R. R., Fleming, E. L., Labow, G. J., et al. (2008). Short- and Medium-Term Atmospheric Constituent Effects of Very Large Solar Proton Events. Atmos. Chem. Phys. 8, 765–785. doi:10.5194/acp-8-765-2008
Kallenrode, M.-B., Cliver, E. W., and Wibberenz, G. (1992). Composition and Azimuthal Spread of Solar Energetic Particles from Impulsive and Gradual Flares. Astrophysical J. 391, 370–379. doi:10.1086/171352
King, J. H. (1974). Solar Proton Fluences for 1977-1983 Space Missions. J. Spacecr. Rockets 11, 401–408. doi:10.2514/3.62088
Li, X., Baker, D. N., Kanekal, S. G., Looper, M., and Temerin, M. (2001). Long Term Measurements of Radiation Belts by Sampex and Their Variations. Geophys. Res. Lett. 28, 3827–3830. doi:10.1029/2001gl013586
Li, X. Q., Xu, Y. B., Liang, X. H., Wang, P., Zhao, X. Y., Wang, H. Y., et al. (2019). The High-Energy Particle Package Onboard Cses. Radiat. Detect. Technol. Methods 3, 22. doi:10.1007/s41605-019-0101-7
Núñez, M. (2011). Predicting Solar Energetic Proton Events (e > 10 mev). Space Weather 9, S07003. doi:10.1029/2010SW000640
Palma, F., Sotgiu, A., Parmentier, A., Martucci, M., Piersanti, M., Bartocci, S., et al. (2021). The August 2018 Geomagnetic Storm Observed by the High-Energy Particle Detector on Board the Cses-01 Satellite. Appl. Sci. 11, 5680. doi:10.3390/app11125680
Park, J., Moon, Y.-J., and Gopalswamy, N. (2012). Dependence of Solar Proton Events on Their Associated Activities: Coronal Mass Ejection Parameters. J. Geophys. Res. 117, A08108. doi:10.1029/2011JA017477
Park, J., Moon, Y.-J., Lee, D. H., and Youn, S. (2010). Dependence of Solar Proton Events on Their Associated Activities: Flare Parameters. J. Geophys. Res. 115, A10105. doi:10.1029/2010JA015330
Picozza, P., Battiston, R., Ambrosi, G., Bartocci, S., Basara, L., Burger, W. J., et al. (2019). Scientific Goals and In-Orbit Performance of the High-Energy Particle Detector on Board the Cses. Astrophysical J. Suppl. Ser. 243, 16. doi:10.3847/1538-4365/ab276c
Reames, D. V. (1999). Particle Acceleration at the Sun and in the Heliosphere. Space Sci. Rev. 90, 413–491. doi:10.1023/A:1005105831781
Rodger, C. J., Clilverd, M. A., Green, J. C., and Lam, M. M. (2010). Use of POES SEM-2 Observations to Examine Radiation Belt Dynamics and Energetic Electron Precipitation into the Atmosphere. J. Geophys. Res. 115, A040202. doi:10.1029/2008JA014023
Shen, X., Zhang, X., Yuan, S., Wang, L., Cao, J., Huang, J., et al. (2018). The State-Of-The-Art of the china Seismo-Electromagnetic Satellite Mission. Sci. China Technol. Sci. 61, 634–642. doi:10.1007/s11431-018-9242-0
Sibeck, D. G., Mcentire, R. W., Lui, A. T. Y., Lopez, R. E., and Krimigis, S. M. (1987). Magnetic Field Drift Shell Splitting: Cause of Unusual Dayside Particle Pitch Angle Distributions during Storms and Substorms. J. Geophys. Res. 92, 13485–13497. doi:10.1029/JA092iA12p13485
Smart, D. F., and Shea, M. A. (2003). The Space-Developed Dynamic Vertical Cutoff Rigidity Model and its Applicability to Aircraft Radiation Dose. Adv. Space Res. 32, 103–108. doi:10.1016/s0273-1177(03)90376-0
Tsurutani, B. T., Gonzalez, W. D., Gonzalez, A. L. C., Tang, F., Arballo, J. K., and Okada, M. (1995). Interplanetary Origin of Geomagnetic Activity in the Declining Phase of the Solar Cycle. J. Geophys. Res. 100, 21717–21733. doi:10.1029/95JA01476
Tylka, A. J., Dietrich, W. F., Boberg, P. R., Smith, E. C., and Adams, J. H. (1996). Single Event Upsets Caused by Solar Energetic Heavy Ions. IEEE Trans. Nucl. Sci. 43, 2758–2766. doi:10.1109/23.556863
Xapsos, M. A., Summers, G. P., Barth, J. L., Stassinopoulos, E. G., and Burke, E. A. (2000). Probability Model for Cumulative Solar Proton Event Fluences. IEEE Trans. Nucl. Sci. 47, 486–490. doi:10.1109/23.856469
Xie, H., Gopalswamy, N., Manoharan, P. K., Lara, A., Yashiro, S., and Lepri, S. (2006). Long-Lived Geomagnetic Storms and Coronal Mass Ejections. J. Geophys. Res. 111, A01103. doi:10.1029/2005JA011287
Yang, S. C., Zhang, X. G., Wang, Y., Wang, C. Q., Chang, Z., Qin, M. R., et al. (2014). Pitch Angle Distribution Research of Radiation Belt Protons Based on the Noaa Data (In Chinese). Chin. J. Space Sci. 34, 390–397. doi:10.11728/cjss2014.03.390
Yang, Y. Y., Zhima, Z. R., Shen, X. H., Chu, W., Huang, J. P., Wang, Q., et al. (2019). The First Intense Geomagnetic Storm Event Recorded by the China Seismo‐Electromagnetic Satellite. Space Weather 18, 1. doi:10.1029/2019sw002243
Zhang, Z.-X., Shen, X.-H., Li, X.-Q., and Wang, Y.-F. (2021a). Proton Loss of Inner Radiation Belt during Geomagnetic Storm of 2018 Based on zh-1 Satellite Observation. Chin. Phys. B 30, 129401. doi:10.1088/1674-1056/ac1f00
Zhang, Z., Chen, L., Liu, S., Xiong, Y., Li, X., Wang, Y., et al. (2020). Chorus Acceleration of Relativistic Electrons in Extremely Low L‐Shell during Geomagnetic Storm of August 2018. Geophys. Res. Lett. 47, e2019GL086226. doi:10.1029/2019GL086226
Zhang, Z., Xiang, Z., Wang, Y., Ni, B., and Li, X. (2021b). Electron Acceleration by Magnetosonic Waves in the Deep Inner Belt (L=1.5-2) Region during Geomagnetic Storm of August 2018. JGR Space Phys. 126, e2021JA029797. doi:10.1029/2021JA029797
Keywords: solar x-ray flares, solar proton event, CSES satellite, geomagnetic storm, coronal mass ejections, ZH-1 satellite
Citation: Wang L, Zhang Z, Shen X, Li X, Liang X, Zhima Z, Chu W, Guo F, Zhou N, Chen H and Wei D (2022) Effects of Solar Proton Events Associated With X-Ray Flares on Near-Earth Electron and Proton Fluxes Based on ZH-1 Satellite Observations. Front. Earth Sci. 10:895561. doi: 10.3389/feart.2022.895561
Received: 14 March 2022; Accepted: 18 May 2022;
Published: 27 June 2022.
Edited by:
Juergen Pilz, University of Klagenfurt, AustriaReviewed by:
Maria Alexandra Pais, University of Coimbra, PortugalCopyright © 2022 Wang, Zhang, Shen, Li, Liang, Zhima, Chu, Guo, Zhou, Chen and Wei. This is an open-access article distributed under the terms of the Creative Commons Attribution License (CC BY). The use, distribution or reproduction in other forums is permitted, provided the original author(s) and the copyright owner(s) are credited and that the original publication in this journal is cited, in accordance with accepted academic practice. No use, distribution or reproduction is permitted which does not comply with these terms.
*Correspondence: Zhenxia Zhang, enh6aGFuZzIwMThAMTYzLmNvbQ==
Disclaimer: All claims expressed in this article are solely those of the authors and do not necessarily represent those of their affiliated organizations, or those of the publisher, the editors and the reviewers. Any product that may be evaluated in this article or claim that may be made by its manufacturer is not guaranteed or endorsed by the publisher.
Research integrity at Frontiers

Learn more about the work of our research integrity team to safeguard the quality of each article we publish.