 Chunxiao Ma
 Yun Xing2
 Yiqian Qu
95% of researchers rate our articles as excellent or good
Learn more about the work of our research integrity team to safeguard the quality of each article we publish.
Find out more
METHODS article
Front. Earth Sci. , 04 May 2022
Sec. Economic Geology
Volume 10 - 2022 | https://doi.org/10.3389/feart.2022.895382
This article is part of the Research Topic Reservoir Formation Conditions and Enrichment Mechanisms of Shale Oil and Gas View all 48 articles
Hydraulic fracturing is the most prominently used technique for increasing well productivity in shale oil reservoirs. Therefore, studying the method for optimizing fracture parameters is essential in the development of shale oil. This study established a mathematical model of non-Darcy flow in the fractured horizontal well section of a shale oil reservoir which considered the influence of the threshold pressure gradient. The finite element method was used to solve the problem, and the calculation method of pressure field and productivity was given. This model is used to study the optimal number of clusters, optimal cluster spacing, optimal fracture length, and optimal fracture conductivity in a horizontal well section. Simulation shows that the optimal number of clusters in a horizontal well section is five when the permeability is 0.02 × 10⁻³ μm2–∼0.10 × 10⁻³ μm2, and the optimal number is four when the permeability range is 0.15 × 10⁻³ μm2–∼0.30 × 10⁻³ μm2. With the increase in the number of clusters, the stimulation effect is more sufficient, the interference effect between fractures is enhanced, and the loss of stratum energy is accelerated. The optimal cluster spacing is 30 m. Several cases of non-uniform cluster spacing have little effect on the stimulation effect. The cluster number and the sum of the cluster spacing are the determinant factors affecting the stimulation effect. The optimal fracture half-length is 140 m. Several cases of the non-uniform fracture length have little effect on the stimulation effect. The cluster number and the sum of the length of the fracture are the determinant factors affecting the stimulation effect. The optimal conductivity is 20 D•cm. At last, it proposed a fracture parameter optimization method considering the stratum energy loss and productivity.
At present, most of the world’s shale oil is produced in the United States, but due to human demand for oil resources, more shale oil needs to be discovered and developed effectively (Janszen et al., 2015; Reynolds and Umekwe, 2019; Kang et al., 2019; Boak and Kleinberg, 2020). The Chang 7 layer of the Triassic Yanchang Formation in the Ordos Basin, China, deposited a set of shale-dominated source rock series during the heyday of the lake basin development (Liu, 2021; Zhang et al., 2021). After years of research (Ren et al., 2015; Guo et al., 2015; Qu et al., 2019), the macro evaluation method of shale reservoirs has been innovated (Huang et al., 2020; Wang et al., 2020; Gao, 2021; Yu et al., 2022), a new microscopic experimental approach to shale reservoirs emerges (Brohi et al., 2011; Crafton and Noe, 2013; Marongiu-Porcu et al., 2016; Huang et al., 2020), new standards for evaluating movable fluids in shale oil reservoirs have been established (Wang and Sheng, 2017; Li et al., 2019; Zhang et al., 2020; Huang et al., 2021), research methods of reservoir (Medeiros et al., 2010; Potapenko et al., 2017; Qu et al., 2020; Zhang et al., 2020) and fluid mechanics theories (Chaudhary et al., 2011; Jin et al., 2013; Zhang et al., 2020; Qu et al., 2022) of other unconventional reservoirs are used for reference, and major breakthroughs have been made in oil exploration in this area (Fu et al., 2020). By learning from the experience of the U.S. shale oil and gas revolution, we know that improving the multi-stage fracturing technology for horizontal wells and optimizing the fracturing design are the keys to achieving sustainable economic development of shale oil resources (Weijers et al., 2019). The optimization of the multi-stage fracturing scheme for horizontal wells is mainly to optimize the parameters of artificial fractures. There are two main directions for optimizing fracture parameters using mathematical models. One is to establish a fracture propagation model which considers the fracture geometry of each cluster and the induced stress field between the fractures (Guo et al., 2015). The other is to use the reservoir numerical simulation method, set the objective function, and select the best fracture parameters through the optimal target value (MoradiDowlatabad and Jamiolahmady, 2018). This study mainly aims at optimal productivity, comprehensively considers the loss of stratum energy, and explores the optimization method of fracture parameters in the horizontal well section of shale oil.
With the application of horizontal wells in unconventional oil and gas fields, the research on horizontal well productivity has gradually increased (Male, 2019). The earliest scholars applied the principle of hydropower similarity to the study of horizontal well productivity and obtained the productivity ratio equation between the horizontal well and vertical well under the influence of homogeneous isotropic reservoirs and permeability anisotropy (Giger, 1984). Researchers assumed that the fractures had infinite conductivity and calculated the productivity of multiple fractures in horizontal wells (Karcher and Giger, 1986). On this basis, an early production model of a horizontal well in an infinitely thick reservoir with multiple fractures and limited conductivity was established (Soliman, 1990). After that, the researchers established a single-hole reservoir model, including matrix and fractures, and compared the difference between the water-oil ratio and the cumulative production when the vertical well and horizontal well were produced (Haddad and Crafton, 1991). In order to solve the problem of single-phase flow in horizontal wells, the concept of equivalent wellbore radius and the correction method of the conductivity coefficient were proposed, and the productivity of horizontal wells with transverse and longitudinal fractures was successfully calculated (Heger, 1996). In the same year, a production model of fracturing horizontal wells under constant pressure conditions was proposed, in which horizontal wells have lateral or vertical fractures (Soliman et al., 1996). Subsequent research concluded a simple production calculation model for calculating horizontal well production under constant pressure or constant production conditions, where the calculation parameters are given by the formula (Helmy and Wttenbarger, 1998). Another scholar proposed a new semi-analytical method to solve the three-dimensional unidirectional flow problem in horizontal wells, in which the position of the wells can be flexibly arranged (Peter and Egberts, 2003). In order to analyze the influence of conductivity on productivity, the influence of the completion method on the productivity of tight gas layers was studied (Soliman, 2008). With the popularization of mathematical methods, a new numerical model was established to calculate the productivity of fracturing horizontal wells by applying the finite element–finite volume method and hybrid element mesh discretization (Geiger et al., 2007). The current research is to make improvements on the basis of predecessors, such as the computational fluid dynamics model for horizontal wells to simulate the complex interaction between the creeping reservoir flow and turbulent well flow for single phases to predict the inflow to the well (Szanyi et al., 2018); based on the theory of pseudo-steady-state flow, the effect of perforation cluster spacing on oil well productivity (Mahmood and Guo, 2019); a theory proposed for calculating fluid flow in laterally isotropic and spatially anisotropic permeable media; and a productivity analysis model derived for both the steady-state and semi-steady-state flow of inclined wells in this media (Johansen and Cao, 2022).
In previous studies, the productivity calculation of horizontal wells was mainly based on analytical or numerical methods. The advantage of an analytical method is that it provides immediate insight into the controlling parameters and steers further numerical analysis on stimulation optimization (Ozkan et al., 2011; Wong et al., 2013; Rojas and Lerza, 2018). Moreover, there are various analysis methods at present which solve many problems (Orangi et al., 2011; Weijermars and Khanal, 2019; Xiao et al., 2020). However, analytical methods face difficulty in solving the problem of irregularly shaped heterogeneous reservoirs (Rodriguez and Soeder, 2015; Zanganeh et al., 2015). The numerical method can realize the simulation of fracturing horizontal wells with various parameters. The finite element method, such as a numerical method, can deal with irregularly shaped oil reservoirs and various complex boundary conditions (Zhang et al., 2016). Therefore, this study adopts the finite element method to solve the mathematical model of the multi-stage fracturing horizontal well. At the same time, in order to finely optimize the fracture parameters, it is proposed to take a fracturing horizontal well section as the basic research object and optimize the parameters of each cluster of fractures in the section.
The study area is located in the southern part of Dingbian Oilfield, in Dingbian County, Yulin City, Shaanxi province. It borders Jingbian County in Shaanxi province in the east, Huachi County and Huan County in Gansu province in the south, Yanchi County in Ningxia province in the west, and Etuokeqianqi in Inner Mongolia in the north (Ma et al., 2021). It is the junction of the four provinces of Shaanxi, Gansu, Ningxia, and Inner Mongolia. The regional structure belongs to the central and western part of the North Shaanxi Slope of the Ordos Basin. The tectonic setting is a gentle west-dipping monocline with a dip angle of about 1° and an average slope drop of 8–10 m/km.
The geotectonic structure of the Ordos Basin is located at the junction of the eastern structural domain and the western structural domain in China. Most of the oil and gas in the basin is mainly distributed on the Yi-Shan slope. During the extended period of the Late Triassic, a set of fluvial-delta-lake facie strata with a thickness of more than one thousand meters of yellow-green and gray-green sandstone intercalated with gray mudstone, dark brown mudstone, and black shale, was deposited. It can be divided into ten layers, from Chang 10 layer to Chang 1 layer from bottom to top. The Chang 7 layer is further divided into three sub-layers, Chang 73 layer, Chang 72 layer, and Chang 71 layer, from bottom to top, according to the sedimentary cycle. The Chang 73 period has the deepest water body, has mainly developed a set of semi-deep lake-deep lake facies deposits, and has deposited the most important set of source rocks of the Yanchang Formation. The Chang 72 and Chang 71 periods were mainly composed of semi-deep lake-deep lake facies and delta deposits developed in the direction of provenance. Affected by the distribution pattern of the lake basin terrain, type I shale oil in the Chang 73 period is mainly distributed in Wuqi, Zhidan, and Ansai areas in the east and is deposited in delta front facies. In the Chang 72 period, the lake water became shallow, and the northeast provenance controlled the delta front deposits to develop in and east of Xin’an, which is a favorable accumulation area for type I shale oil. In the Chang 71 period, as the lake water became further shallow, the northeast provenance-controlled delta front deposits could extend to the center of the lake, and a large amount of gravity flow deposits accumulated in the low-lying areas of the lake bottom or the bottom of the slope break belt. At this time, from the Xin’an edge to the east, all the deposits were delta fronts, and the underwater distributary channels developed in a large area, so the Chang 71 period of northern Shaanxi type I shale oil generally developed. In this study, the Chang 7 shale oil layer is taken as the research target, and the optimization method of fracture parameters in a horizontal well section of shale oil is explored.
The basic differential equation of seepage in the stratum media is as follows:
The basic differential equation of seepage in the fracture media is as follows:
The initial condition is as follows:
The inner boundary condition is expressed as follows:
The outer boundary condition is as follows:
where Kx、Ky、 and Kz are the permeability values in three directions of the stratum, m2; Gx is the threshold pressure gradient in the x-direction of the stratum, Pa/m; Gy is the threshold pressure gradient in the y-direction of the stratum, Pa/m; Gz is the threshold pressure gradient in the z-direction of the stratum, Pa/m; Ct is the comprehensive compressibility of the stratum, 1/Pa; CL is the liquid compressibility, 1/Pa; p is the pressure, Pa; t is time, s; μ is the fluid viscosity, Pas; pi is the original stratum pressure, Pa; pwf is the bottom hole pressure, Pa; Kfx is the fracture permeability in the x-direction, m2; Kfy is the fracture permeability in the y-direction, m2; h is the thickness of the reservoir, m. The heterogeneity of shale oil reservoirs is characterized by the permeability of the three directions of xyz.
After introducing the Galerkin finite element method, Eqs 1 and 2 are transformed into Eqs 6 and 7, respectively.
Applying the Green–Gauss formula and considering boundary conditions, Eqs 6 and 7 are transformed into Eqs 8 and 9, respectively.
where Ni and Nʹi are interpolation functions, Ω is the integral range, and
where pi, pj, pk, and pl are the pressure values of each node of the tetrahedral element, Mpa; pfi, pfj, and pfm are the pressure values of each node of the triangular element, Mpa; Ni, Nj, Nk, Nl, Ni’, Nj′, and Nm′ are interpolation basis functions, which are only related to node coordinates.
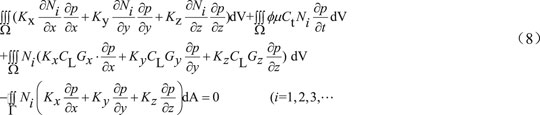
The integral expression in the stratum media unit is obtained as Eq. 12.
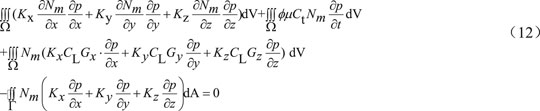
where dV is the volume element; m = i, j, k, and l.
The integral expression in the fracture media unit is obtained as Eq. 13.
where dA is the area element; k = i, j, and m.
By further integral calculation of the aforementioned equations and substituting the differential value for the time derivative of the pressure, the finite element equation of the stratum media unit is Eq. 14, and the finite element equation of the fracture media unit is obtained as Eq. 15.
where K1 and K2 are element pressure stiffness matrices; N1 and N2 are element temperature-variable matrices; P1 and P2 are column vectors of element nodal pressure values; Δt is the time interval, s; F1 is the start matrix of the formation medium unit.
By synthesizing all finite element equations, the overall finite element equation of the entire study area is obtained as Eq. 16.
where K is the overall stiffness matrix; N is the overall temperature-variable matrix; P is a column vector of all nodal pressure values; F is the overall start matrix of the stratum media.
The initial conditions and boundary conditions are introduced, the calculation time and iterations are given, the corresponding program is compiled, the pressure values of each node at each moment are solved, and the seepage field diagram can be drawn. Finally, the productivity of the fracturing horizontal well section is calculated by formula (17).
where
In this article, the fracture parameters in the horizontal well volume fracturing section are optimized. The basic parameters are as follows: the horizontal well section spacing is 60 m; the half-length of the artificial fracture is 150 m; the fracture conductivity is 20 D•cm; the original stratum pressure is 10 MPa; the bottom hole pressure is 6 MPa; and the effective thickness of the reservoir is 5 m. The porosity of the reservoir is 7%; the average permeability is 0.15 × 10⁻³ μm2 (0.02–0.30 × 10⁻³ μm2); crude oil viscosity is 2.63 mPas; the crude oil volume factor is 1.224; and the comprehensive compressibility is 15.7 × 10⁻⁴ MPa−1. Unless otherwise specified, the analysis in this chapter is based on the above parameters. The fracturing section is used as a unit to establish a basic model, and the finite element division of the basic model is shown in Figure 1 (four clusters of fractures in a horizontal well section). The parameter selection of this study is based on the actual data in the oilfield. The calculation schemes are also based on the actual situation of the oilfield.
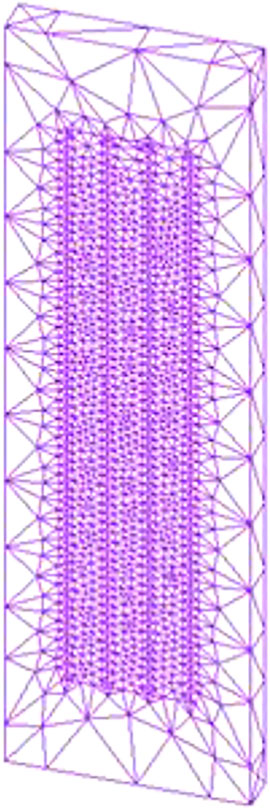
FIGURE 1. Finite element partition diagram of the basic model.
This study refers to the experiment of the threshold pressure gradient by Zhao Jiyong et al. (Zhao et al., 2018). The threshold pressure gradient corresponding to reservoirs with different permeability is compared and analyzed, and the calculation chart of the threshold pressure gradient in different permeability ranges is regressed. As shown in Figure 2, this chart is mainly for the Chang 7 layer of the shale oil reservoir in the Ordos Basin.
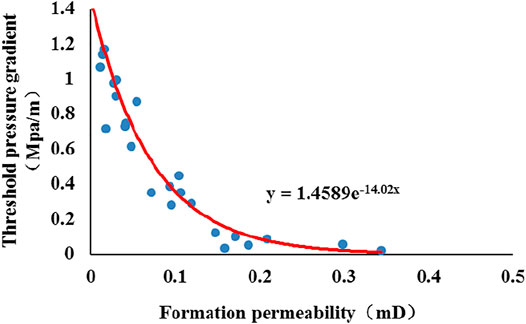
FIGURE 2. Calculation chart of the threshold pressure gradient for different types of permeability.
In this section, the fracture cluster spacing is set to 20 m. With different permeabilities of the Chang 7 layer, the production of fractures in the fracturing section under the conditions of 1–6 clusters was calculated. The pressure fields were drawn, and the optimal number of fracture clusters under different reservoir conditions was selected. The permeability values are 0.02 × 10⁻³, 0.05 × 10⁻³, 0.10 × 10⁻³, 0.15 × 10⁻³, 0.20 × 10⁻³, 0.25 × 10⁻³, and 0.30 × 10⁻³ μm2.
Figures 3A and B show the daily production and cumulative production (1 year) of different cluster numbers, when the permeability is 0.02 × 10⁻³ μm2. When the number of clusters increases, the daily production increases. The difference in the output is mainly reflected in the first 100 days of production, and the daily production curve almost overlaps after 100 days. When the number of clusters increases, the cumulative production increases. When the number of fractures increases to 5 clusters, the cumulative production increases very little, indicating that when there are five clusters of fractures in the section, the productivity is optimal. Figure 3C shows the pressure fields of fractures with different cluster numbers for 15 days, when the permeability is 0.02 × 10⁻³ μm2. The pressure reduction in the fracture is the fastest, and the energy of the reservoir is continuously replenished to the fracture and its surrounding area, resulting in the gradual expansion of the pressure reduction area centered on the fracture. When the pressure drop gradient in the expansion area is greater than the threshold pressure gradient, the crude oil in this area will migrate. When the crude oil converges in the fractures, the seepage resistance is reduced, and the fluid flows into the wellbore in a linear flow to achieve the purpose of increasing productivity. Comparing the pressure fields of such reservoirs with different cluster numbers, the more clusters, the larger the area is effectively stimulated by artificial fractures. Combined with the characteristics of productivity, the optimal number of clusters is 5.
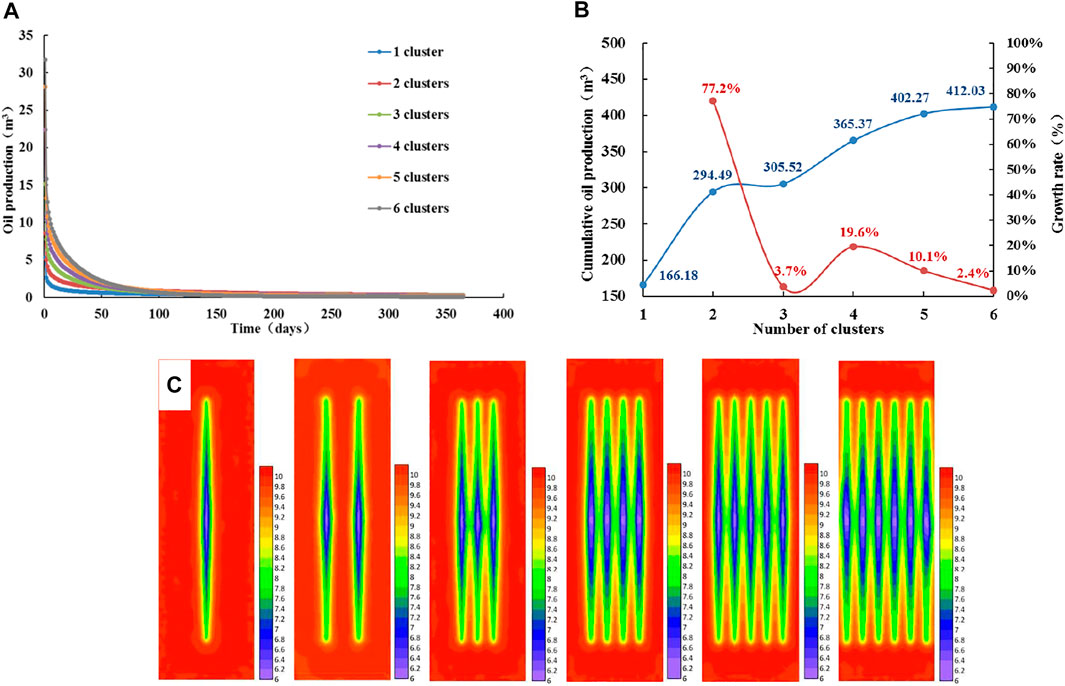
FIGURE 3. Analysis of productivity and pressure fields with different cluster numbers when permeability is 0.02 × 10⁻³ μm2. (A) Daily oil production curve of different numbers of clusters. (B) Cumulative oil production curve of different cluster numbers. (C) Pressure fields with different numbers of clusters.
Figures 4A and B show the daily production and cumulative production (1 year) of different cluster numbers, when the permeability is 0.05 × 10⁻³ μm2. Figure 4C shows the pressure fields of fractures with different cluster numbers for 15 days when the permeability is 0.05 × 10⁻³ μm2. At this time, the productivity characteristics are similar to that of 0.02 × 10⁻³ μm2, and the productivity is optimal when there are five clusters of fractures in the horizontal well section. As the formation permeability increases, the threshold pressure gradient becomes smaller, the effective stimulated area corresponding to each cluster of fractures increases, more crude oil flows into the fractures, and the productivity increases.
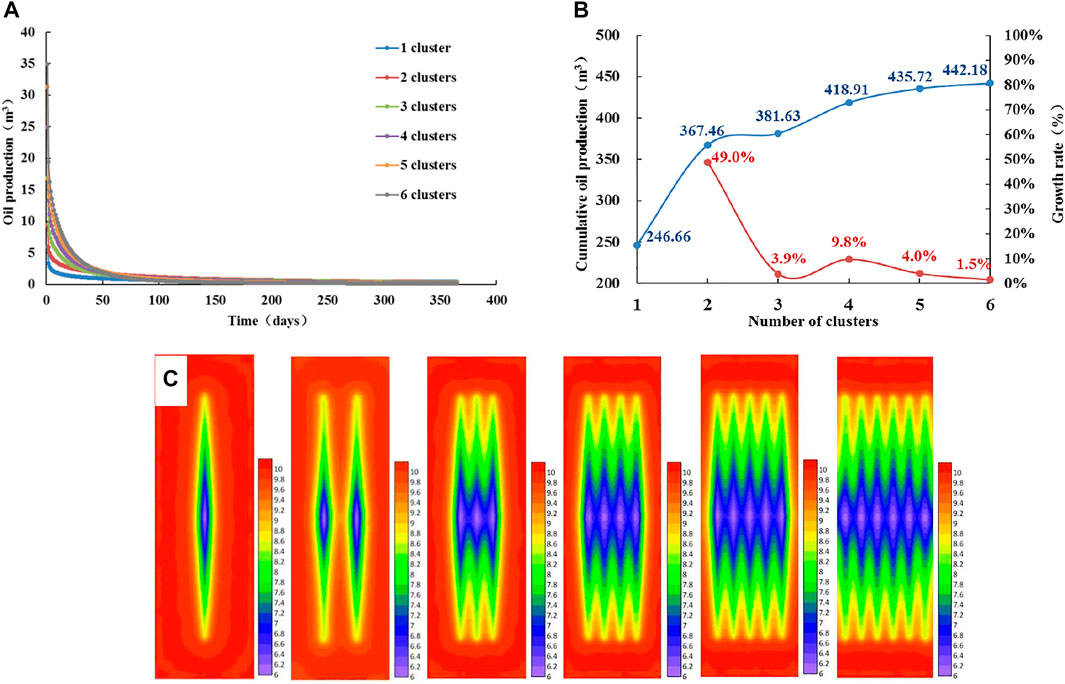
FIGURE 4. Analysis of productivity and pressure fields with different cluster numbers when permeability is 0.05 × 10⁻³ μm2. (A) Daily oil production curve of different numbers of clusters. (B) Cumulative oil production curve of different cluster numbers. (C) Pressure fields with different numbers of clusters.
Figures 5A–C respectively show the daily production, cumulative production (1 year), and pressure fields (15 days) under the conditions of different numbers of clusters when the permeability is 0.10 × 10⁻³ μm2. The productivity characteristics are similar to those of 0.02 × 10⁻³ μm2, and the productivity is optimal when there are 5 clusters of fractures in the horizontal well section. The formation permeability increases, the threshold pressure gradient decreases, the effective stimulated area corresponding to each cluster of fractures increases, and the productivity increases. However, in the pressure fields with more than 3 clusters, the pressure drop areas between fractures overlap, and the overlapping part is the interference area between fractures. The crude oil here is difficult to produce, indicating that the cluster spacing at this time is not the optimal cluster spacing.
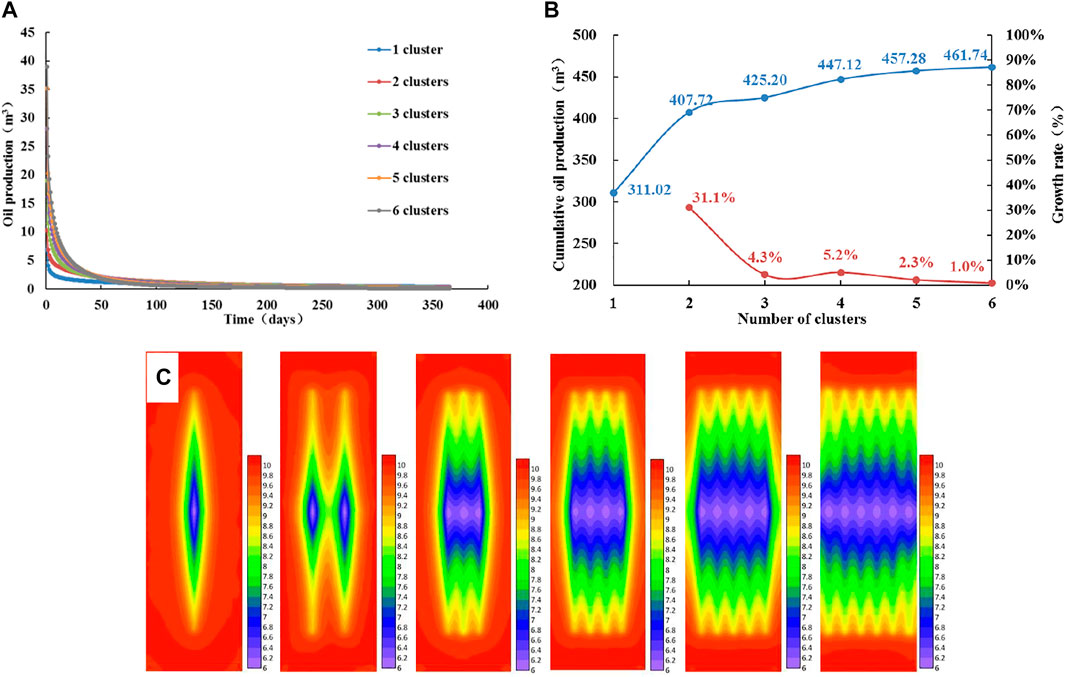
FIGURE 5. Analysis of productivity and pressure fields with different cluster numbers when permeability is 0.10 × 10⁻³ μm2 (A) Daily oil production curve of different numbers of clusters. (B) Cumulative oil production curve of different cluster numbers. (C) Pressure fields with different numbers of clusters.
Figures 6A–C respectively show the daily production, cumulative production (1 year), and pressure fields (15 days) under the conditions of different numbers of clusters when the permeability is 0.15 × 10⁻³ μm2. The number of clusters increases, the daily production increases, and the cumulative production increases. After increasing to four clusters, the cumulative production increases very little, indicating that the productivity is optimal when there are 4 clusters of fractures in the horizontal well section. The difference between the corresponding optimal production capacity (457.53 m3) and the optimal production capacity (457.28 m3) when the permeability is 0.10 × 10⁻³ μm2 is only 0.25 m3. The permeability increases, but the optimal productivity value is almost unchanged. This is because the interference area between the fractures increases, and the interference effect reduces the optimal productivity value.
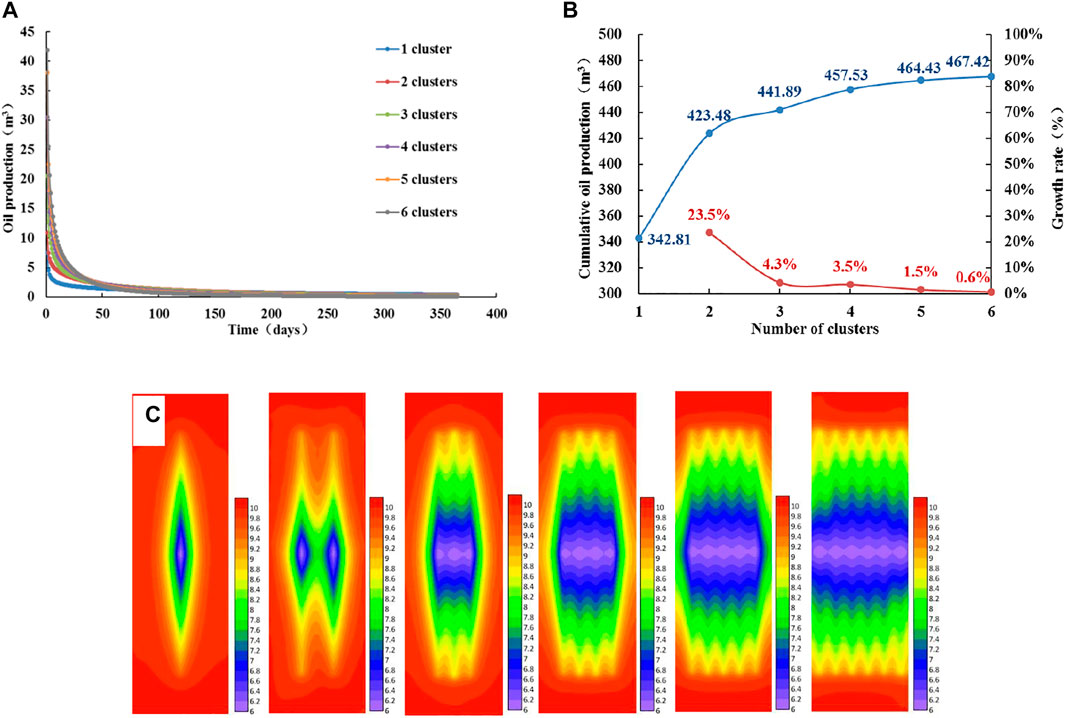
FIGURE 6. Analysis of productivity and pressure fields with different cluster numbers when permeability is 0.15 × 10⁻³ μm2. (A) Daily oil production curve of different numbers of clusters. (B) Cumulative oil production curve of different cluster numbers. (C) Pressure fields with different numbers of clusters.
Figures 7A and B show the daily production and cumulative production (1 year) of different cluster numbers, when the permeability is 0.20 × 10⁻³ μm2. Figures 7C and D show the daily production and cumulative production (1 year) of different cluster numbers, when the permeability is 0.25 × 10⁻³ μm2. Figures 7E and F show the daily production and cumulative production (1 year) of different cluster numbers, when the permeability is 0.30 × 10⁻³ μm2. The optimal productivities of these three permeabilities are similar to those of 0.15 × 10⁻³ μm2, and the productivity is optimal when there are 4 clusters of fractures in a horizontal well section, but with the increase of permeability, the difference between the optimal productivity values is very small. Figure 8 shows the pressure fields of different cluster numbers for the three permeability conditions. The distribution characteristics of the pressure fields of the three types of reservoirs are similar. As the number of clusters increases, the overall stimulated area becomes larger. After increasing the number of clusters to 4, increasing the number of clusters can only improve the stimulation effect of the reservoir at the horizontal boundary of the section. Permeability increases, and the interference between fractures is stronger, which affects the convergence of crude oil in fractures. At the same time, the loss of stratum energy reduces the pressure drop gradient in the stimulated area, and the crude oil migration stops in the region where the pressure drop gradient is less than the threshold pressure gradient. So the permeability increases and the optimal productivity is not improved.
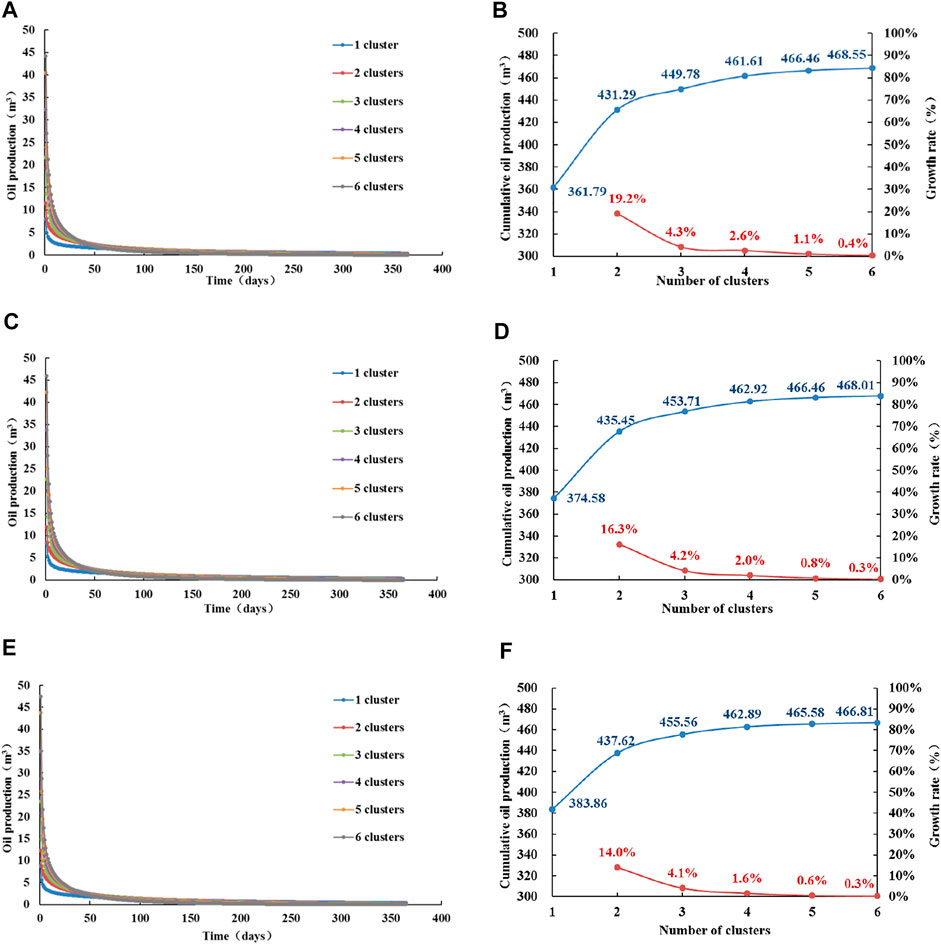
FIGURE 7. Analysis of productivity with different cluster numbers when the permeability is 0.20 × 10⁻³, 0.25 × 10⁻³, or 0.30 × 10⁻³ μm2. (A) Daily oil production curve of different numbers of clusters (0.20 × 10⁻³ μm2). (B) Cumulative oil production curve of different cluster numbers (0.20 × 10⁻³ μm2). (C) Daily oil production curve of different numbers of clusters (0.25 × 10⁻³ μm2). (D) Cumulative oil production curve of different cluster numbers (0.25 × 10⁻³ μm2). (E) Daily oil production curve of different numbers of clusters (0.30 × 10⁻³ μm2). (F) Cumulative oil production curve of different cluster numbers (0.30 × 10⁻³ μm2).
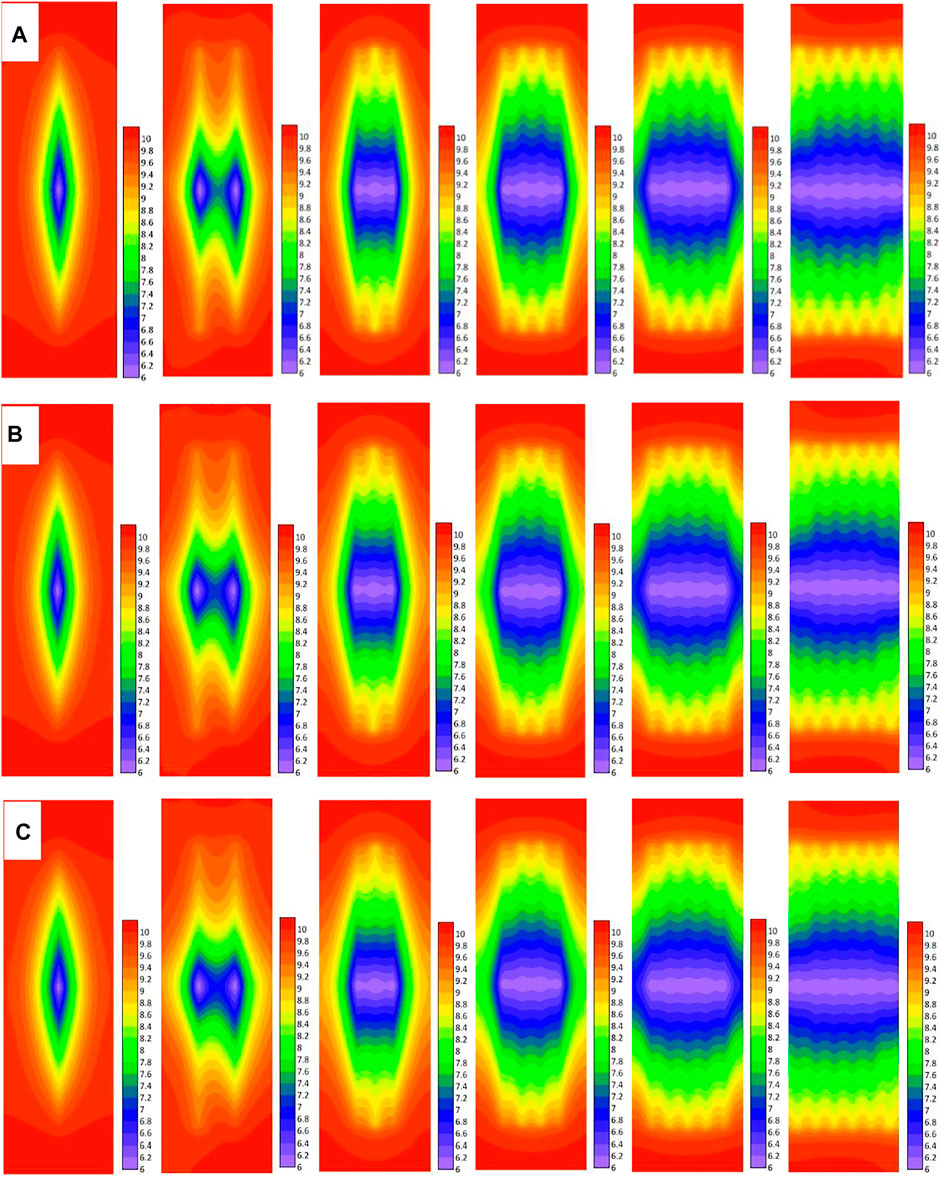
FIGURE 8. Analysis of pressure fields with different cluster numbers when permeability is 0.20 × 10⁻³, 0.25 × 10⁻³, or 0.30 × 10⁻³ μm2. (A) Pressure fields with different numbers of clusters (0.20 × 10⁻³ μm2). (B) Pressure fields with different numbers of clusters (0.25 × 10⁻³ μm2). (C) Pressure fields with different numbers of clusters (0.30 × 10⁻³ μm2).
In order to improve the optimal productivity, one has to increase the energy of the stratum, that is, to increase the stratum pressure of the shale oil reservoir by supplementing liquid or gas. However, due to the low permeability, economical and effective energy supplementation methods are not yet mature. The second is to reduce the interference between fractures which can slow down the consumption of stratum energy and prolong the time of oil migration. By adjusting the fracture parameters, such as cluster spacing, we can improve the optimal productivity. This study aimed to improve the productivity by adjusting the fracture parameters.
The basic parameters of the model remain unchanged, the average permeability of the shale oil reservoir is 0.15 × 10⁻³ μm2, and there are four clusters of fractures in the horizontal well section. Cluster spacing between each fracture is equal. The oil productions in the horizontal well section of different types of cluster spacing were calculated, and the pressure fields were drawn.
The cluster spacing of plan one to plan five is 5, 10, 15, 20, 25, and 30 m, respectively, and the half-length of the fractures is 150 m.
From Figures 9A and B we can observe the following: the cluster spacing increases, and the daily production increases. The difference in the output is mainly reflected in the first 50 days of production, and the daily production curve almost overlaps after 50 days. If cluster spacing increases, the cumulative production increases. The productivity is optimal when the cluster spacing is 30 m. Figure 9C shows the pressure fields of fractures of different plans for 15 days. The cluster spacing of plan 1 and plan 2 is too small, so the stimulated areas of each cluster of fractures are highly overlapping, and the pressure value in the overall stimulated area is very low. Stratum energy consumption is too fast, resulting in insufficient seepage of crude oil into fractures, and artificial fractures have a poor stimulation effect on shale oil reservoirs. The pressure field of plan 3 can show the shape of four clusters of fractures, but the interference of fractures makes the crude oil in the overall stimulated area flow into the wellbore in the form of radial flow. Also, the seepage resistance is great, which reduces the degree of crude oil recovery. The effective stimulated area of fractures in the pressure field of plan 4 increases. This is because the cluster spacing increases, the interference between fractures is small, and the crude oil in the far-end fractures resumes linear flow. However, in the area of the fracture near the wellbore, there is still a characteristic of radial flow, and the stratum energy will also be lost. According to the pressure fields of plan 5 and plan 6, as the cluster spacing continues to increase, the interference effect of fractures decreases, the stimulated area of a single cluster of fractures increases, and the overall stimulated area expands. In plan 6, the stimulation effect of single-cluster fractures and the entire reservoir is the best, and the cluster spacing of 30 m is the optimal cluster spacing. At this time, the pressure gradually decreases outward along the stimulated area of each cluster fracture. As the main seepage channel of crude oil, the artificial fractures greatly promote the crude oil to overcome the constraints of the threshold pressure gradient and complete the migration process from the shale oil reservoir to the wellbore.
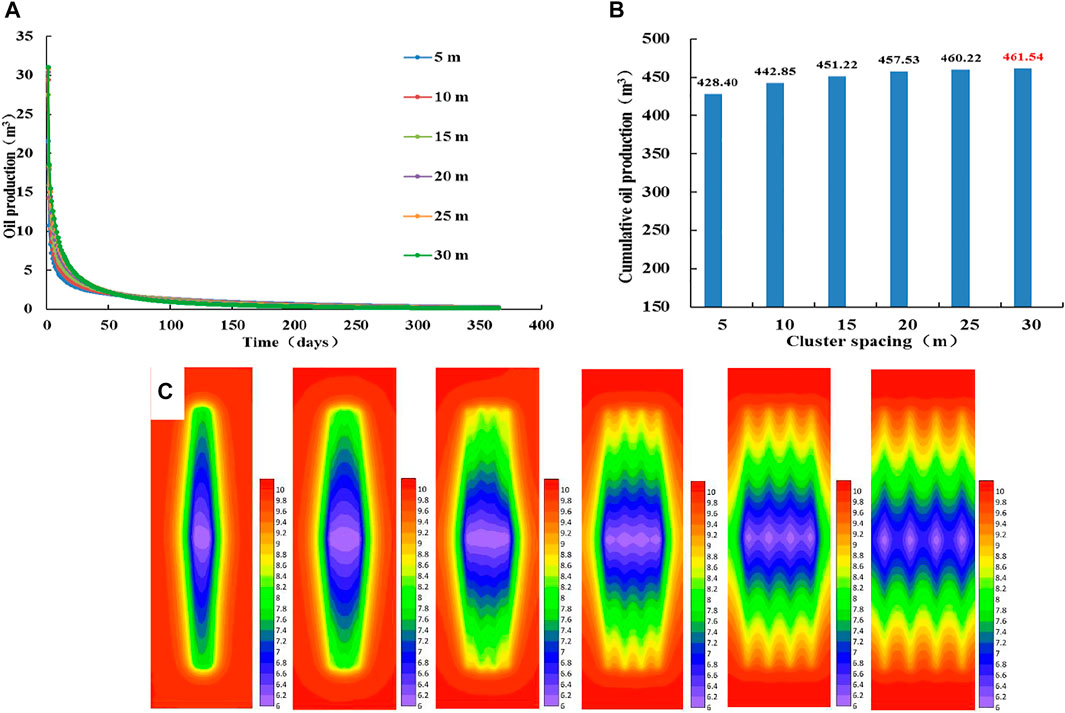
FIGURE 9. Analysis of productivity and pressure fields with different cluster spacing plans. (A) Daily oil production curve of different cluster spacing plans. (B) Cumulative oil production histogram of different cluster spacing plans. (C) Pressure fields of different cluster spacing plans (From left to right, plan 1, plan 2, plan 3, plan 4, plan 5, and plan 6).
The simulation calculation scheme is shown in Table 1, and the half-lengths of the fractures are 150 m d01, d12, d23, d34, and d45, representing the spacing between the fractures from left to right.
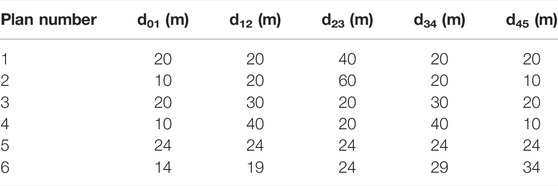
TABLE 1. Calculation scheme of different types of cluster spacing when each fracture cluster spacing is unequal.
From Figures 10A and B, we observed that the daily production curves corresponding to different cluster spacing types almost overlap, and the corresponding cumulative production differences are small, indicating that the distribution of several cluster spacing has little effect on productivity. Figure 10C shows the pressure fields of fractures of different plans for 15 days. When the cluster spacing is small, there is interference between fractures, and the effective stimulated area of a single cluster of fractures is reduced. When the cluster spacing is larger, the interference between fractures is weakened, and the effective stimulated area of a single cluster of fractures increases. According to the pressure fields, it can be judged that there is little difference in the overall stimulated area of different plans. In conclusion, when the number of fracture clusters is the same in each plan, and the sum of the cluster spacing is equal, the overall stimulation effect of artificial fractures on the reservoir in a horizontal well section is basically the same.
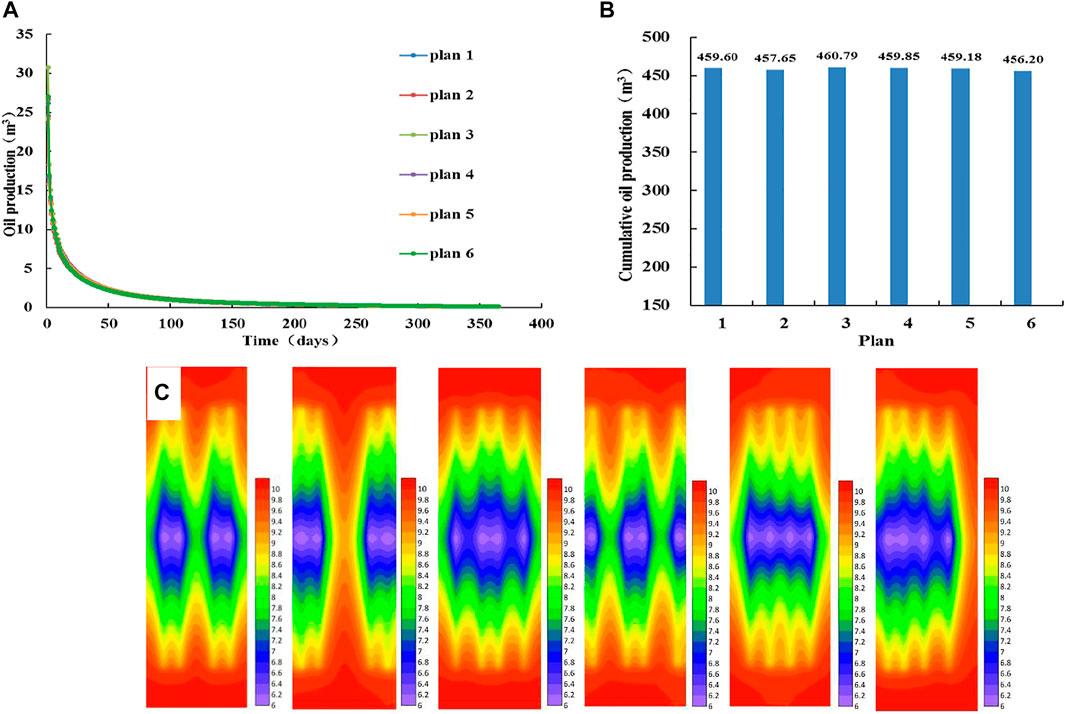
FIGURE 10. Analysis of productivity and pressure fields with different cluster spacing plans. (A) Daily oil production curve of different cluster spacing plans. (B) Cumulative oil production histogram of different cluster spacing plans. (C) Pressure fields of different cluster spacing plans (From left to right, plan 1, plan 2, plan 3, plan 4, plan 5, and plan 6).
There are four clusters of fractures in a horizontal well section, the cluster spacing is 20 m, and the lengths of the fractures are the same. The half-lengths of plan 1 to plan 5 are 80, 100, 120, 140, 160 and 180 m, respectively.
Figures 11A and B show the daily production and cumulative production (1 year) of different fracture lengths. As the length of fractures increases, the daily production increases. The difference in output is mainly reflected in the first 150 days of production, and the daily production curve almost overlaps after 150 days. When the length of fractures increases, the cumulative production increases. While the fracture half-length is 180 m, the productivity is the largest. Figure 11C shows the pressure fields of fractures of different lengths for 15 days. As the length of fractures increases, the overall stimulated area becomes larger. In plan 1 and plan 2, the pressure decreases rapidly in the fractures and stimulated area. This is because the interference between fractures causes stratum energy consumption to be too fast. Also, the reservoir crude oil seeps in the form of radial flow. In plan three and plan 4, the fracture length increases, and the interference effect decreases. Among them, the pressure in plan 4 decreases the slowest, and the interference effect is the smallest. At this time, the crude oil in the far-end fractures seeps in a linear flow mode, and the crude oil in the fractures with a certain length in the center of the wellbore seeps in a radial flow mode. In plan 5 and plan 6, the increase of fracture length leads to the accelerated reduction of pressure in the central part of the stimulated area, and the interference between fractures is strengthened again, which hinders the linear flow of crude oil in the fractures and is not conducive to the production of crude oil. Plan 4 has higher productivity and less energy loss, so plan 4 corresponds to the optimal fracture length.
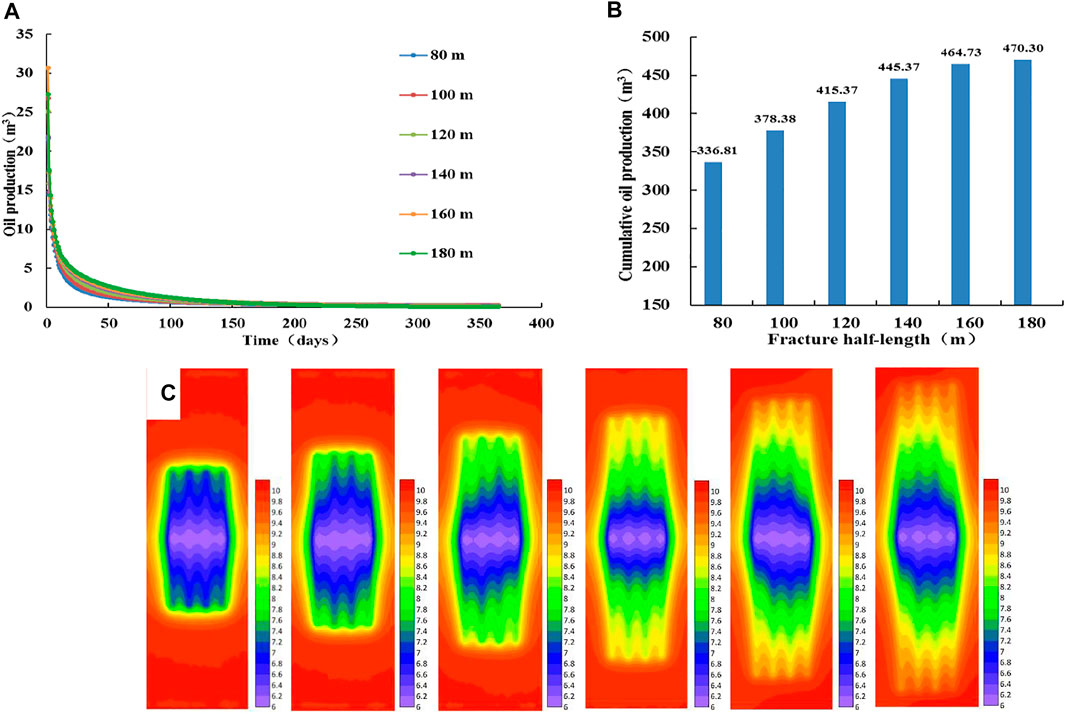
FIGURE 11. Analysis of productivity and pressure fields with different fracture lengths (A) Daily oil production curve of different fracture lengths. (B) Cumulative oil production histogram of different fracture lengths (C) Pressure fields of different fracture length plans (From left to right, plan 1, plan 2, plan 3, plan 4, plan 5, and plan 6).
The simulation calculation scheme is shown in Table 2. There are four clusters of fractures in a horizontal well section, and the cluster spacing is 20 m. Fracture 1, fracture 2, fracture 3, and fracture 4 are fractures from left to right.
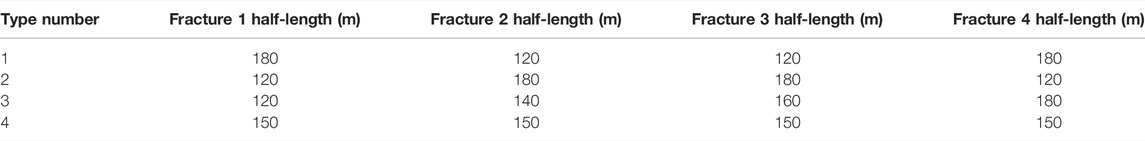
TABLE 2. Calculation scheme of different fracture lengths when each half-length is unequal.
From Figures 12A and B, we can see that the daily production curves corresponding to different fracture length types almost overlap, and the corresponding cumulative output differences are small. Figure 12C shows the pressure fields of fractures of different lengths for 15 days. The shapes of the stimulated areas of the four types are different, but the overall stimulated areas are similar in size. The crude oil at the far-end of the fracture flows linearly, and the crude oil near the wellbore of the fracture flows radially, and there is still interference between the fractures. In this calculation of parameter conditions, when the total length of the fractures in a horizontal well section is the same, the stimulation effect of the reservoir in the section is the same, that is, the productivity and the size of the stimulated area are similar.
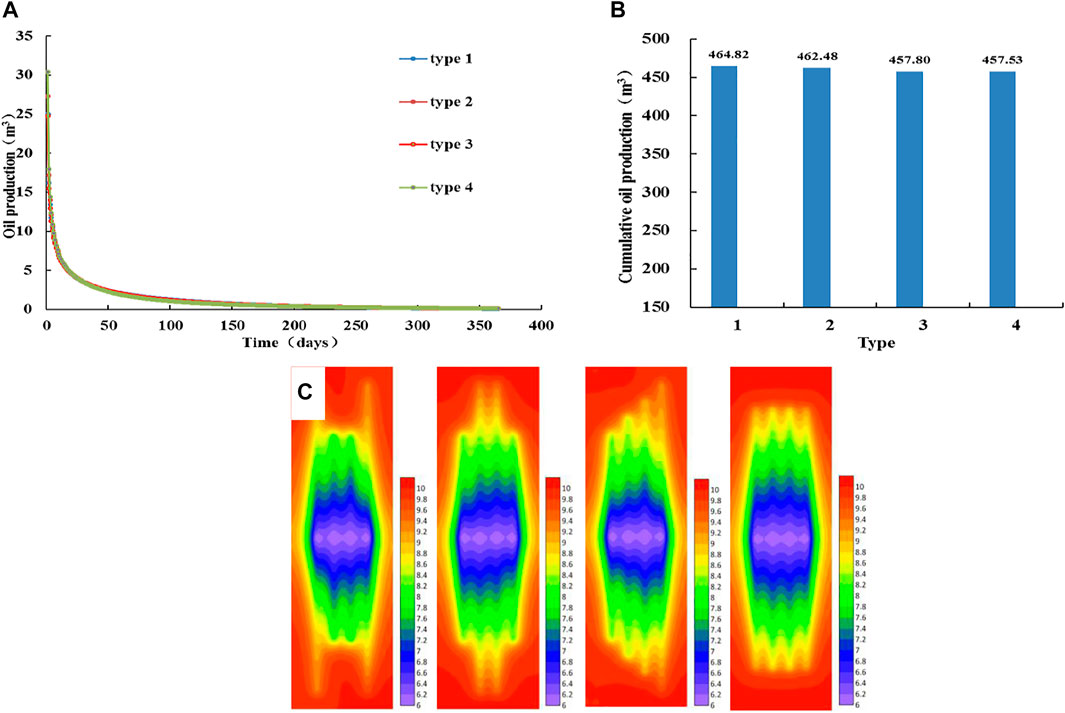
FIGURE 12. Analysis of productivity and pressure fields with different fracture lengths. (A) Daily oil production curve of different fracture lengths. (B) Cumulative oil production histogram of different fracture lengths. (C) Pressure fields of different fracture length plans (From left to right, type 1, type 2, type 3, and type 4).
There are four clusters of fractures in a horizontal well section, the cluster spacing is 20 m, and the half-length of each fracture is 150 m. The conductivity value of each cluster of fractures is the same. The conductivity values of plan 1 to plan 8 are 5, 10, 15, 20, 25, 30, 35, and 40 D•cm, respectively.
From Figures 13A and B, we can see that as the fracture conductivity increases, the daily production increases. The difference in output is mainly reflected in the first 50 days of production, and the daily production curve almost overlaps after 50 days. When the fracture conductivity increases, the cumulative production increases. When the value of fracture conductivity increases to 20 D•cm, the cumulative production increases very little, indicating that 20 D•cm is the optimal fracture conductivity. Figure 13C shows the pressure fields of fractures of different fracture conductivities for 15 days. The greater the fracture conductivity, the larger the overall stimulated area is. But when the conductivity increases to 20 D•cm, the overall stimulated area does not change much by increasing the conductivity. Between each single cluster of fractures, the greater the conductivity, the stronger is the interference between the fractures, the faster is the pressure reduction in the fracture and the stimulated area, and the greater is the threshold energy loss. Therefore, considering the productivity and the stimulation effect of the reservoir, plan 4 corresponds to the optimal conductivity value.
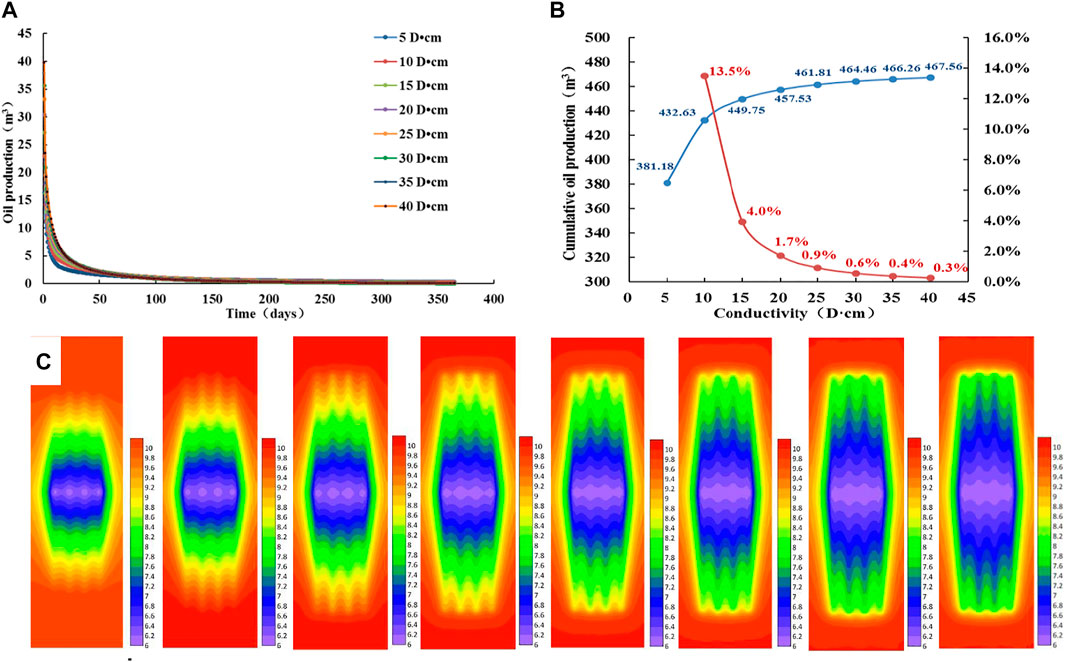
FIGURE 13. Analysis of productivity and pressure fields with different fracture conductivities. (A) Daily oil production curve of different fracture conductivities. (B) Cumulative oil production curve of different fracture conductivities. (C) Pressure fields of different fracture conductivity plans (From left to right, plan 1, plan 2, plan 3, plan 4, plan 5, plan 6, plan 7, and plan 8).
Shale oil reservoirs are tight, with strong heterogeneity and low stratum pressure. The multi-stage fracturing technology of horizontal wells is the key technology to develop such reservoirs. The reservoir properties of each stage of multi-stage fracturing are different. In this study, each stage of fracturing is taken as the research object, and the parameters of each cluster of fractures in the stage are optimized to achieve the best intra-stage stimulation effect. At this time, the fracture parameter design of each horizontal well section has differences and pertinence, which ensures the stimulation effect of the whole well. Taking the optimization of productivity as the basic goal, comprehensively considering the energy consumption of the stratum as the criterion for selecting fracture parameters, the optimal productivity is visually determined by daily production and cumulative production. Stratum energy is analyzed through the characteristics of the pressure field. First, the characteristics of energy consumption are determined according to the pressure change characteristics of the whole area in a horizontal well section. Second, the pressure change characteristics between each cluster of fractures and their affected areas reflect stratum energy consumption. Interference between fractures is the main analysis method in this part. Based on the analysis of the aforementioned two points, the fracture parameters are adjusted so that the overall reconstruction in the horizontal well section is sufficient, and the interference between fractures is minimized. It is a difficult problem to maintain the long-term stable production of horizontal wells in shale oil reservoirs. Through the design of fracture parameters in the early stage, the interference between fractures can be reduced, which helps crude oil to maintain linear flow in the fractures and their stimulated areas and reduce the energy consumption of the stratum. This not only improves economic efficiency but also saves energy and protects the environment.
In this study, a mathematical model of multi-stage fracturing horizontal well seepage under non-Darcy conditions in shale oil reservoirs was established, the solution was completed, and the calculation method of horizontal well pressure field and productivity was given. The optimization method of fracture parameters in the shale oil reservoir in the study area is formed. From this study, we can conclude the following:
When the permeability is 0.02 × 10⁻³∼0.10 × 10⁻³ μm2, the optimal number of clusters in a horizontal well section is 5. When the permeability is 0.15 × 10⁻³∼0.30 × 10⁻³ μm2, the optimal number of clusters in the horizontal well section is 4. The number of clusters in a horizontal well section increases, and the overall stimulated area increases. However, when the number of clusters increases to a certain value, the increase in productivity is very small, and the interference of fractures accelerates the loss of stratum energy, causing the pressure drop gradient in some areas to be smaller than the stratum gradient and hindering the migration of crude oil.
The optimal cluster spacing is 30 m when each fracture cluster spacing is equal. When the cluster spacing is small, the crude oil seeps in the radial flow into the stimulated area. With the increase of cluster spacing, the interference effect of fractures decreases, the seepage resistance decreases, and crude oil seeps in a linear flow mode at the far end of the fractures, which improves the effectiveness of artificial fractures. When the cluster spacing is 30 m, the productivity is optimal, and the energy loss is the smallest. When each fracture cluster spacing is unequal, the distribution of several cluster spacing has little effect on the stimulation effect. When the number of fracture clusters is the same and the sum of the cluster spacing is equal, the overall stimulation effect of artificial fractures on the reservoir in a horizontal well section is basically the same.
When the length of each fracture is the same, the optimal fracture half-length is 140 m. When the fracture length is small, the interference between fractures is strong, and the energy consumption of the reservoir is fast. After increasing the fracture length, the effectively stimulated area increases, the interference effect of fractures is weakened, the energy loss is reduced, and a linear flow pattern appears in the far-end fractures. When the fracture half-length exceeds 140 m, the central interference area expands again, the increase in productivity becomes very small, and the energy loss increases. Therefore, the optimal half-length is 140 m. When each fracture length is unequal, the distribution of several lengths has little effect on the stimulation effect. When the number of fracture clusters is the same and the total length of the fractures in a horizontal well section is the same, the stimulation effect of the reservoir in the horizontal well section is basically the same.
When the conductivity of each fracture is the same, the optimal conductivity is 20 D•cm. When the fracture conductivity increases, the overall stimulated area increases, but when it exceeds 20 D•cm, the overall stimulated area remains unchanged. The conductivity increases, the interference between fractures increases, the central interference area expands, and the energy consumption increases. Therefore, the conductivity value should not be too large. Considering the productivity and the stimulation effect, it is concluded that 20 D•cm is the optimal conductivity.
The original contributions presented in the study are included in the article/Supplementary Material, further inquiries can be directed to the corresponding authors.
All authors listed have made a substantial, direct, and intellectual contribution to the work and approved it for publication.
This study was funded by the National Science and Technology Major Project of China (2017ZX05039-004).
CM, YX, and PL were employed by the company Shaanxi Yanchang Petroleum (Group) Co., Ltd.
The remaining authors declare that the research was conducted in the absence of any commercial or financial relationships that could be construed as a potential conflict of interest.
All claims expressed in this article are solely those of the authors and do not necessarily represent those of their affiliated organizations, or those of the publisher, the editors, and the reviewers. Any product that may be evaluated in this article, or claim that may be made by its manufacturer, is not guaranteed or endorsed by the publisher.
The authors thank the Department of Geology of Northwest University and the Research Institute of Shaanxi Yanchang Petroleum (Group) Co., Ltd. for providing data and permission to publish this work.
Boak, J., and Kleinberg, R. (2020). Shale Gas, Tight Oil, Shale Oil and Hydraulic Fracturing. Future Energy, 67–95. doi:10.1016/b978-0-08-102886-5.00004-9
Brohi, I., Pooladi-Darvish, M., and Aguilera, R. (2011). Modeling Fractured Horizontal Wells as Dual Porosity Composite Reservoirs - Application to Tight Gas, Shale Gas and Tight Oil Cases. SPE Western North American Region Meeting. doi:10.2118/144057-ms
Chaudhary, A. S., Ehlig-Economides, C., and Wattenbarger, R. (2011). Shale Oil Production Performance from a Stimulated Reservoir Volume. SPE Annu. Tech. Conf. Exhibition. doi:10.2118/147596-ms
Crafton, J. W., and Noe, S. L. (2013). Factors Affecting Early Well Productivity in Six Shale Plays. SPE Annu. Tech. Conf. Exhibition. doi:10.2118/166101-ms
Fu, J., Li, S., Niu, X., Deng, X., and Zhou, X. (2020). Geological Characteristics and Exploration of Shale Oil in Chang 7 Member of Triassic Yanchang Formation, Ordos Basin, NW China. Pet. Exploration Dev. 47 (5), 931–945. doi:10.1016/s1876-3804(20)60107-0
Gao, F. (2021). Influence of Hydraulic Fracturing of strong Roof on Mining-Induced Stress Insight from Numerical Simulation. J. Mining Strata Control. Eng. 3 (2), 023032.
Geiger, S., Matthai, S., Niessner, J., and Helmig, R. (2007). Black-Oil Simulations for Three-Component -- Three-phase Flow in Fractured Porous Media. SPEJ 2009, 338–354. SPE107485.
Guo, C., Wang, J., Wei, M., He, X., and Bai, B. (2015). Multi-Stage Fractured Horizontal Well Numerical Simulation and its Application in Tight Shale Reservoirs. SPE Russ. Pet. Tech. Conf. doi:10.2118/176714-ms
Guo, J., Lu, Q., Zhu, H., Wang, Y., and Ma, L. (2015). Perforating Cluster Space Optimization Method of Horizontal Well Multi-Stage Fracturing in Extremely Thick Unconventional Gas Reservoir. J. Nat. Gas Sci. Eng. 26, 1648–1662. doi:10.1016/j.jngse.2015.02.014
Helmy, W. M., and Wattenbarger, R. A. (1998). Simplified Productivity Equation for Horizontal wells at Constant Rate and Constant Pressure[J], SPE49090.
Huang, H., Li, R., Chen, W., Chen, L., Jiang, Z., Xiong, F., et al. (2021). Revisiting Movable Fluid Space in Tight fine-grained Reservoirs: A Case Study from Shahejie Shale in the Bohai Bay Basin, NE China. J. Pet. Sci. Eng. 207, 109170. doi:10.1016/j.petrol.2021.109170
Huang, H., Li, R., Jiang, Z., Li, J., and Chen, L. (2020). Investigation of Variation in Shale Gas Adsorption Capacity with Burial Depth: Insights from the Adsorption Potential Theory. J. Nat. Gas Sci. Eng. 73, 103043. doi:10.1016/j.jngse.2019.103043
Huang, H., Li, R., Xiong, F., Hu, H., Sun, W., Jiang, Z., et al. (2020). A Method to Probe the Pore-Throat Structure of Tight Reservoirs Based on Low-Field NMR: Insights from a Cylindrical Pore Model. Mar. Pet. Geology. 117, 104344. doi:10.1016/j.marpetgeo.2020.104344
Janszen, M., Bakker, T., and Zitha, P. L. (2015). Hydraulic Fracturing in the Dutch Posedonia Shale. In SPE European Formation Damage Conference and Exhibition. doi:10.2118/174231-ms
Jin, C. J., Sierra, L., and Mayerhofer, M. (2013). A Production Optimization Approach to Completion and Fracture Spacing Optimization for Unconventional Shale Oil Exploitation. Denver, Colorado: Unconventional Resources Technology Conference, 12–14. doi:10.1190/urtec2013-062
Johansen, T. E., and Cao, J. (2022). A New Theory for Flow Computations in a Large Class of Anisotropic media with Applications to Well Productivity Modeling. J. Pet. Sci. Eng. 208, 109366. doi:10.1016/j.petrol.2021.109366
Kang, H., Xu, G., Wang, B., Wu, Y., Jiang, P., Pan, J., et al. (2019). Forty Years Development and Prospects of Underground Coal Mining and Strata Control Technologies in China. J. Mining Strata Control. Eng. 1 (1), 013501.
Karcher, B. J., and Giger, F. M. (1986). Some Practical Formulas to Predict Horizontal Well Behabior[J]. SPE15430.
Li, G., Guo, B., Li, J., and Wang, M. (2019). A Mathematical Model for Predicting Long-Term Productivity of Modern Multifractured Shale-Gas/Oil Wells. SPE Drilling & Completion 34, 114–127. doi:10.2118/194495-pa
Liu, Y. (2021). Fundamental Research on the Storage Characteristics and Phase Behavior of Shale Oil and Gas. Unconventional Oil & Gas 8 (02), 8–12. doi:10.19901/j.fcgyq.2021.02.02
Ma, W., Wang, Y., and Zhang, S. (2021). Microscopic Characteristics and Controlling Factors of Chang 7 Member Shale Oil Reservoir in Northern Shaanxi Area, Ordos Basin[J]. Nat. Gas Geosci. 32 (12), 1810–1821.
Mahmood, M. N., and Guo, B. (2019). An Analytical Method for Optimizing Fracture Spacing in Shale Oil Reservoirs. Lafayette: SPE Liquids-Rich Basins Conference - North America. doi:10.2118/197083-ms
Male, F. (2019). Using a Segregated Flow Model to Forecast Production of Oil, Gas, and Water in Shale Oil Plays. J. Pet. Sci. Eng. 180, 48–61. doi:10.1016/j.petrol.2019.05.010
Marongiu-Porcu, M., Lee, D., Shan, D., and Morales, A. (2016). Advanced Modeling of Interwell-Fracturing Interference: An Eagle Ford Shale-Oil Study. SPE J. 21 (05), 1567–1582. doi:10.2118/174902-pa
Medeiros, F., Kurtoglu, B., Ozkan, E., and Kazemi, H. (2010). Analysis of Production Data from Hydraulically Fractured Horizontal Wells in Shale Reservoirs. SPE Reservoir Eval. Eng. 13 (03), 559–568. doi:10.2118/110848-pa
MoradiDowlatabad, M., and Jamiolahmady, M. (2018). The Performance Evaluation and Design Optimisation of Multiple Fractured Horizontal wells in Tight Reservoirs. J. Nat. Gas Sci. Eng. 49, 19–31. doi:10.1016/j.jngse.2017.10.011
Orangi, A., Nagarajan, N. R., Honarpour, M. M., and Rosenzweig, J. (2011). Unconventional Shale Oil and Gas-Condensate Reservoir Production, Impact of Rock, Fluid, and Hydraulic Fractures. SPE Hydraulic Fracturing Tech. Conf. doi:10.2118/140536-ms
Ozkan, E., Brown, M., Raghavan, R., and Kazemi, H. (2011). Comparison of Fractured-Horizontal-Well Performance in Tight Sand and Shale Reservoirs. SPE Reservoir Eval. Eng. 14 (02), 248–259. doi:10.2118/121290-pa
Peter, A. F., Francesca, V., and Egberts, P. J. P. (2003). Semi-Analytic Calculation of Horizontal Well Productivity in Fractured Reservoirs[J]. SPE84597.
Potapenko, D. I., Williams, R. D., Desroches, J., Enkababian, P., Theuveny, B., Willberg, D. M., et al. (2017). Securing Long-Term Well Productivity of Horizontal Wells through Optimization of Postfracturing Operations. SPE Annu. Tech. Conf. Exhibition. doi:10.2118/187104-ms
Qu, Y., Sun, W., Guo, S., Shao, S., and Lv, X. (2019). A Gas-Content Calculation Model for Terrestrial Shales in the Kuqa Depression, the Tarim Basin, Western China. Interpretation 7 (2), T513–T524. doi:10.1190/INT-2018-0127.1
Qu, Y., Sun, W., Tao, R., Luo, B., Chen, L., and Ren, D. (2020). Pore-throat Structure and Fractal Characteristics of Tight Sandstones in Yanchang Formation, Ordos Basin. Mar. Pet. Geology. 120, 104573. doi:10.1016/j.marpetgeo.2020.104573
Qu, Y., Sun, W., Wu, H., Huang, S., Li, T., Ren, D., et al. (2022). Impacts of Pore-Throat Spaces on Movable Fluid: Implications for Understanding the Tight Oil Exploitation Process. Mar. Pet. Geology. 137, 105509. doi:10.1016/j.marpetgeo.2021.105509
Ren, L., Su, Y., and Lu, J. (2015). Optimization of Fracture Parameters of Segmented Multi-Cluster Fracturing Horizontal wells in Unltra-Low Permeability Reservoirs[J]. J. Xi'an Shiyou University:Natural Sci. Edition 30 (04), 49–52+58+67.
Reynolds, D. B., and Umekwe, M. P. (2019). Shale-Oil Development Prospects: The Role of Shale-Gas in Developing Shale-Oil. Energies 12 (17), 3331. doi:10.3390/en12173331
Rodriguez, R. S., and Soeder, D. J. (2015). Evolving Water Management Practices in Shale Oil & Gas Development. J. Unconventional Oil Gas Resour. 10, 18–24. doi:10.1016/j.juogr.2015.03.002
Rojas, D., and Lerza, A. (2018). Horizontal Well Productivity Enhancement through Drawdown Management Approach in Vaca Muerta Shale. SPE Can. Unconventional Resour. Conf. doi:10.2118/189822-ms
Soliman, M. Y., Hunt, J. L., and Azari, M. (1996). Fractured Horizontal Wells in Gas Reservoirs [J], SPE35260.
Soliman, M. Y., Loyd, E., Joe, A., and Hong, W. (2008). Testing and Design of Hydraulic Fractures in Tight Gas Formations[J]. SPE114988.
Szanyi, M. L., Hemmingsen, C. S., Yan, W., Walther, J. H., and Glimberg, S. L. (2018). Near-wellbore Modeling of a Horizontal Well with Computational Fluid Dynamics. J. Pet. Sci. Eng. 160, 119–128. doi:10.1016/j.petrol.2017.10.011
Wang, J., Zhang, C., and Zheng, D. (2020). Stability Analysis of Roof in Goaf Considering Time Effect. J. Mining Strata Control. Eng. 2 (1), 013011.
Wang, X., and Sheng, J. J. (2017). Effect of Low-Velocity Non-darcy Flow on Well Production Performance in Shale and Tight Oil Reservoirs. Fuel 190, 41–46. doi:10.1016/j.fuel.2016.11.040
Weijermars, R., and Khanal, A. (2019). “Production Interference of Hydraulically Fractured Hydrocarbon Wells: New Tools for Optimization of Productivity and Economic Performance of Parent and Child Wells,” in SPE Europec Featured at 81st EAGE Conference and Exhibition. doi:10.2118/195544-ms
Weijers, L., Wright, C., Mayerhofer, M., Pearson, M., Griffin, L., and Weddle, P. (2019). “Trends in the North American Frac Industry: Invention through the Shale Revolution,” in SPE Hydraulic Fracturing Technology Conference and Exhibition. doi:10.2118/194345-ms
Wong, S.-W., Geilikman, M., and Xu, G. (2013). Interaction of Multiple Hydraulic Fractures in Horizontal Wells. SPE Unconventional Gas Conf. Exhibition. doi:10.2118/163982-ms
Xiao, J., Hao, Q., and Zhang, S. (2020). Influence of Oil Well Casing on the Law of Strata Pressure in Working Face. J. Mining Strata Control. Eng. 2 (1), 013522.
Yu, X., Bian, J., and Liu, C. (2022). Determination of Energy Release Parameters of Hydraulic Fracturing Roof Near Goaf Based on Surrounding Rock Control of Dynamic Pressure Roadway. J. Mining Strata Control. Eng. 4 (1), 013016.
Zanganeh, B., Ahmadi, M., Hanks, C., and Awoleke, O. (2015). The Role of Hydraulic Fracture Geometry and Conductivity Profile, Unpropped Zone Conductivity and Fracturing Fluid Flowback on Production Performance of Shale Oil wells. J. Unconventional Oil Gas Resour. 9, 103–113. doi:10.1016/j.juogr.2014.11.006
Zhang, G., Huang, S., and Zhang, R. (2021). Study on Porosity Interpretation Model of Shale Oil Reservoir Based on Geochemical Parameters. Unconventional Oil & Gas 8 (05), 9–18. doi:10.19901/j.fcgyq.2021.05.02
Zhang, K., Jia, C., Song, Y., Jiang, S., Jiang, Z., Wen, M., et al. (2020a). Analysis of Lower Cambrian Shale Gas Composition, Source and Accumulation Pattern in Different Tectonic Backgrounds: A Case Study of Weiyuan Block in the Upper Yangtze Region and Xiuwu Basin in the Lower Yangtze Region. Fuel 263, 115978. doi:10.1016/j.fuel.2019.115978
Zhang, K., Peng, J., Liu, W., Li, B., Xia, Q., Cheng, S., et al. (2020b). The Role of Deep Geofluids in the Enrichment of Sedimentary Organic Matter: a Case Study of the Late Ordovician-Early Silurian in the Upper Yangtze Region and Early Cambrian in the Lower Yangtze Region, south China. Geofluidsfluids 2020, 1–12. doi:10.1155/2020/8868638
Zhang, K., Peng, J., Wang, X., Jiang, Z., Song, Y., Jiang, L., et al. (2020c). Effect of Organic Maturity on Shale Gas Genesis and Pores Development: A Case Study on marine Shale in the Upper Yangtze Region, South China. Open Geosciences 12, 1617–1629. doi:10.1515/geo-2020-0216
Zhang, R.-h., Zhang, L.-h., Wang, R.-h., Zhao, Y.-l., and Huang, R. (2016). Simulation of a Multistage Fractured Horizontal Well with Finite Conductivity in Composite Shale Gas Reservoir through Finite-Element Method. Energy Fuels 30 (11), 9036–9049. doi:10.1021/acs.energyfuels.6b01565
Keywords: the Ordos Basin, shale oil, fluid flow model, finite element method, fracture parameters, pressure field, productivity
Citation: Ma C, Xing Y, Qu Y, Cheng X, Wu H, Luo P and Xu P (2022) A New Fracture Parameter Optimization Method for the Horizontal Well Section of Shale Oil. Front. Earth Sci. 10:895382. doi: 10.3389/feart.2022.895382
Received: 13 March 2022; Accepted: 25 March 2022;
Published: 04 May 2022.
Edited by:
Kun Zhang, Southwest Petroleum University, ChinaReviewed by:
Tingwei Li, Guangzhou Marine Geological Survey, ChinaCopyright © 2022 Ma, Xing, Qu, Cheng, Wu, Luo and Xu. This is an open-access article distributed under the terms of the Creative Commons Attribution License (CC BY). The use, distribution or reproduction in other forums is permitted, provided the original author(s) and the copyright owner(s) are credited and that the original publication in this journal is cited, in accordance with accepted academic practice. No use, distribution or reproduction is permitted which does not comply with these terms.
*Correspondence: Chunxiao Ma, bWFjaHVueGlhb18yMDA5QDE2My5jb20=; Xin Cheng, Y2hlbmd4aW5Abnd1LmVkdS5jbg==
Disclaimer: All claims expressed in this article are solely those of the authors and do not necessarily represent those of their affiliated organizations, or those of the publisher, the editors and the reviewers. Any product that may be evaluated in this article or claim that may be made by its manufacturer is not guaranteed or endorsed by the publisher.
Research integrity at Frontiers
Learn more about the work of our research integrity team to safeguard the quality of each article we publish.